Table of Contents for
Your Code as a Crime Scene
 Your Code as a Crime Scene
Published by
Pragmatic Bookshelf, 2015
Your Code as a Crime Scene
Published by
Pragmatic Bookshelf, 2015
- Title Page
- Your Code as a Crime Scene
- Your Code as a Crime Scene
- For the Best Reading Experience...
- Table of Contents
- Early praise for Your Code as a Crime Scene
- Foreword by Michael Feathers
- Acknowledgments
- Chapter 1: Welcome!
- About This Book
- Optimize for Understanding
- How to Read This Book
- Toward a New Approach
- Get Your Investigative Tools
- Part 1: Evolving Software
- Chapter 2: Code as a Crime Scene
- Meet the Problems of Scale
- Get a Crash Course in Offender Profiling
- Profiling the Ripper
- Apply Geographical Offender Profiling to Code
- Learn from the Spatial Movement of Programmers
- Find Your Own Hotspots
- Chapter 3: Creating an Offender Profile
- Mining Evolutionary Data
- Automated Mining with Code Maat
- Add the Complexity Dimension
- Merge Complexity and Effort
- Limitations of the Hotspot Criteria
- Use Hotspots as a Guide
- Dig Deeper
- Chapter 4: Analyze Hotspots in Large-Scale Systems
- Analyze a Large Codebase
- Visualize Hotspots
- Explore the Visualization
- Study the Distribution of Hotspots
- Differentiate Between True Problems and False Positives
- Chapter 5: Judge Hotspots with the Power of Names
- Know the Cognitive Advantages of Good Names
- Investigate a Hotspot by Its Name
- Understand the Limitations of Heuristics
- Chapter 6: Calculate Complexity Trends from Your Code’s Shape
- Complexity by the Visual Shape of Programs
- Learn About the Negative Space in Code
- Analyze Complexity Trends in Hotspots
- Evaluate the Growth Patterns
- From Individual Hotspots to Architectures
- Part 2: Dissect Your Architecture
- Chapter 7: Treat Your Code As a Cooperative Witness
- Know How Your Brain Deceives You
- Learn the Modus Operandi of a Code Change
- Use Temporal Coupling to Reduce Bias
- Prepare to Analyze Temporal Coupling
- Chapter 8: Detect Architectural Decay
- Support Your Redesigns with Data
- Analyze Temporal Coupling
- Catch Architectural Decay
- React to Structural Trends
- Scale to System Architectures
- Chapter 9: Build a Safety Net for Your Architecture
- Know What’s in an Architecture
- Analyze the Evolution on a System Level
- Differentiate Between the Level of Tests
- Create a Safety Net for Your Automated Tests
- Know the Costs of Automation Gone Wrong
- Chapter 10: Use Beauty as a Guiding Principle
- Learn Why Attractiveness Matters
- Write Beautiful Code
- Avoid Surprises in Your Architecture
- Analyze Layered Architectures
- Find Surprising Change Patterns
- Expand Your Analyses
- Part 3: Master the Social Aspects of Code
- Chapter 11: Norms, Groups, and False Serial Killers
- Learn Why the Right People Don’t Speak Up
- Understand Pluralistic Ignorance
- Witness Groupthink in Action
- Discover Your Team’s Modus Operandi
- Mine Organizational Metrics from Code
- Chapter 12: Discover Organizational Metrics in Your Codebase
- Let’s Work in the Communication Business
- Find the Social Problems of Scale
- Measure Temporal Coupling over Organizational Boundaries
- Evaluate Communication Costs
- Take It Step by Step
- Chapter 13: Build a Knowledge Map of Your System
- Know Your Knowledge Distribution
- Grow Your Mental Maps
- Investigate Knowledge in the Scala Repository
- Visualize Knowledge Loss
- Get More Details with Code Churn
- Chapter 14: Dive Deeper with Code Churn
- Cure the Disease, Not the Symptoms
- Discover Your Process Loss from Code
- Investigate the Disposal Sites of Killers and Code
- Predict Defects
- Time to Move On
- Chapter 15: Toward the Future
- Let Your Questions Guide Your Analysis
- Take Other Approaches
- Let’s Look into the Future
- Write to Evolve
- Appendix 1: Refactoring Hotspots
- Refactor Guided by Names
- Bibliography
- You May Be Interested In…
Catch Architectural Decay
Temporal coupling has a lot of potential in software development. We can spot unexpected dependencies and suggest areas for refactoring.
Temporal coupling is also related to software defects. There are multiple reasons for that. For example, a developer may forget to update one of the (implicitly) coupled modules. Another explanation is that when you have multiple modules whose evolutionary lifelines are intimately tied, you run the risk of unexpected feature interactions. You’ll also soon see that temporal coupling often indicates architectural decay. Given these reasons, it’s not surprising that a high degree of temporal coupling goes with high defect rates.
Temporal Coupling and Software Defects | |
|---|---|
|
|
Researchers found that different measures of temporal coupling outperformed traditional complexity metrics when it came to identifying the most defect-prone modules (see On the Relationship Between Change Coupling and Software Defects [DLR09]). What’s surprising is that temporal coupling seems to be particularly good at spotting more severe bugs (major/high-priority bugs). The researchers made another interesting finding when they compared the bug-detection rate of different coupling measures. Some measures included time awareness, effectively down-prioritizing older commits and giving more weight to recent changes. The results were counterintuitive: the simpler sum of coupling algorithm that you learned about in this chapter performed better than the more sophisticated time-based algorithms. My guess is that the time-based algorithms performed worse because they’re based on an assumption that isn’t always valid. They assume code gets better over time by refactorings and focused improvements. In large systems with multiple developers, those refactorings may never happen, and the code keeps on accumulating responsibilities and coupling. Using the techniques in this chapter, we have a way to detect and avoid that trap. And now we know how good the techniques are in practice. |
Enable Continuing Change
Back in Chapter 6, Calculate Complexity Trends from Your Code’s Shape, we learned about Lehman’s law of increasing complexity. His law states that we must continuously work to prevent a “deteriorating structure” of our programs as they evolve. This is vital because every successful software product will accumulate more features.
Lehman has another law, the law of continuing change, which states a program that is used “undergoes continual change or becomes progressively less useful” (see On Understanding Laws, Evolution, and Conservation in the Large-Program Life Cycle [Leh80]).
There’s tension between these two laws. On one hand, we need to evolve our systems to make them better and keep them relevant to our users. At the same time, we don’t want to increase the complexity of the system.
One risk with increased complexity is features interacting unexpectedly. We make a change to one feature, and an unrelated one breaks. Such bugs are notoriously hard to track down. Worse, without an extensive regression test suite, we may not even notice the problem until later, when it’s much more expensive to fix.
To prevent horrors like that from happening in our system, let’s see how we can use temporal coupling to track architectural problems and stop them from spreading in our code.
Identify Architecturally Significant Modules
In the following example, we’re going to analyze a new codebase. Craft.Net[25] is a set of Minecraft-related .NET libraries. We’re analyzing this project because it’s a fairly new and cool project of suitable size with multiple active developers.
To get a local copy of Craft.Net, clone its repository:
| | prompt> git clone https://github.com/SirCmpwn/Craft.Net.git |
Let’s perform the trend analysis step by step so that we can understand what’s happening. Each step is nearly identical; the time period is the only thing that changes. We can automate this with a script later. Let’s find the first module to focus on.
Move into the Craft.Net directory and perform a sum of coupling analysis:
| | prompt> git log --pretty=format:'[%h] %an %ad %s' --date=short --numstat \ |
| | --before=2014-08-08 > craft_evo_complete.log |
| | prompt> maat -l craft_evo_complete.log -c git -a soc |
| | entity,soc |
| | Craft.Net.Server/Craft.Net.Server.csproj,685 |
| | Craft.Net.Server/MinecraftServer.cs,635 |
| | Craft.Net.Data/Craft.Net.Data.csproj,521 |
| | Craft.Net.Server/MinecraftClient.cs,464 |
| | ... |
Notice how we first generate a Git log and then feed that to Code Maat. Sure, there’s a bit of Git magic here, but nothing you haven’t seen in earlier chapters. You can always refer back to Chapter 3, Creating an Offender Profile, if you need a refresher on the details.
When you look for modules of architecural significance in the results, ignore the C# project files (csproj). The first real code module is MinecraftServer.cs. As you see, that class has the most cases of temporal coupling to other modules. Looks like a hit.
The name of our code witness, MinecraftServer, is also an indication that we’ve found the right module; a MinecraftServer sounds like a central architectural part of any, well, Minecraft server. We want to ensure that the module stays on track over time. Here’s how we do that.
Perform Trend Analyses of Temporal Coupling
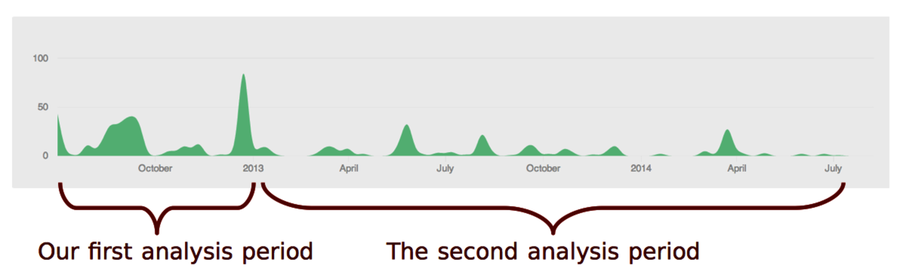
To track the architectural evolution of the MinecraftServer, we’re going to perform a trend analysis. The first step is to identify the periods of time that we want to compare.
The development history of Craft.Net goes back to 2012. There was a burst of activity that year. Let’s consider that our first development period.
To perform the coupling analysis, let’s start with a version-control log for the initial period:
| | prompt> git log --pretty=format:'[%h] %an %ad %s' --date=short --numstat \ |
| | --before=2013-01-01 > craft_evo_130101.log |
We now have the evolutionary data in craft_evo_130101.log. We use the file for coupling analysis, just as we did earlier in this chapter:
| | prompt> maat -l craft_evo_130101.log -c git -a coupling > craft_coupling_130101.csv |
The result is stored in craft_coupling_130101.csv. That’s all we need for our first analysis period. We’ll look at it in a moment. But to spot trends we need more sample points.
In this example, we’ll define the second analysis period as the development activity in 2013 until 2014. Of course, we could use multiple, shorter periods, but the GitHub activity shows that period contains roughly the same amount of activity. So for brevity, let’s limit the trend analysis to just two sample points.
The steps for the second analysis are identical to the first. We just have to change the filenames and exclude commit activity before 2013. We can do both in one sweep:
| | prompt> git log --pretty=format:'[%h] %an %ad %s' --date=short --numstat \ |
| | --after=2013-01-01 --before=2014-08-08 > craft_evo_140808.log |
| | prompt> maat -l craft_evo_140808.log -c git -a coupling > craft_coupling_140808.csv |
We now have two sampling points at different stages in the development history. Let’s investigate them.
Investigate the Trends
When we perform an analysis of our codebase, we want to track the evolution of all interesting modules. To keep this example short, we’ll focus on one main suspect as identified in the sum of coupling analysis: the MinecraftServer module. So let’s filter the data to inspect its trend.
I opened the result files, craft_coupling_130101.csv and craft_coupling_140808.csv, in a spreadsheet application and removed everything but the modules coupled to MinecraftServer to get the filtered analysis results.
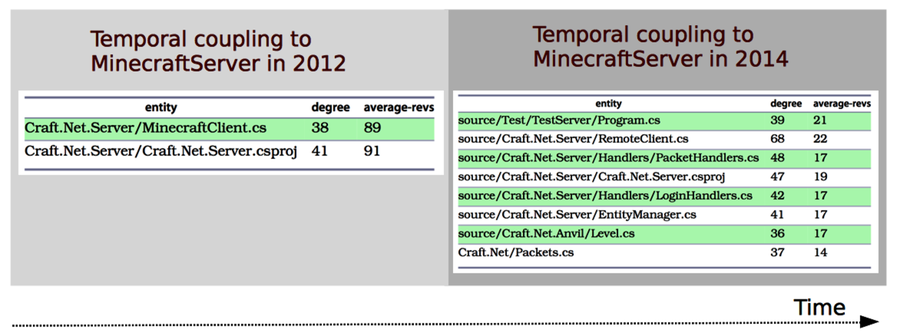
There’s one interesting finding in 2012: the MinecraftServer.cs is coupled to MinecraftClient.cs. This seems to be a classic case of temporal coupling between a producer and a consumer of information, just as we discussed in Understand the Reasons Behind Temporal Dependencies. When we notice a case like that, we want to track it.
Forward to 2014. The coupling between server and client isn’t present a year and a half later, but we have other problems. As you can see, the MinecraftServer has accumulated several heavy temporal dependencies compared to its cleaner start in the initial development period.
When that happens, we want to understand why and look for places to improve. Let’s see how.