Table of Contents for
Your Code as a Crime Scene
 Your Code as a Crime Scene
Published by
Pragmatic Bookshelf, 2015
Your Code as a Crime Scene
Published by
Pragmatic Bookshelf, 2015
- Title Page
- Your Code as a Crime Scene
- Your Code as a Crime Scene
- For the Best Reading Experience...
- Table of Contents
- Early praise for Your Code as a Crime Scene
- Foreword by Michael Feathers
- Acknowledgments
- Chapter 1: Welcome!
- About This Book
- Optimize for Understanding
- How to Read This Book
- Toward a New Approach
- Get Your Investigative Tools
- Part 1: Evolving Software
- Chapter 2: Code as a Crime Scene
- Meet the Problems of Scale
- Get a Crash Course in Offender Profiling
- Profiling the Ripper
- Apply Geographical Offender Profiling to Code
- Learn from the Spatial Movement of Programmers
- Find Your Own Hotspots
- Chapter 3: Creating an Offender Profile
- Mining Evolutionary Data
- Automated Mining with Code Maat
- Add the Complexity Dimension
- Merge Complexity and Effort
- Limitations of the Hotspot Criteria
- Use Hotspots as a Guide
- Dig Deeper
- Chapter 4: Analyze Hotspots in Large-Scale Systems
- Analyze a Large Codebase
- Visualize Hotspots
- Explore the Visualization
- Study the Distribution of Hotspots
- Differentiate Between True Problems and False Positives
- Chapter 5: Judge Hotspots with the Power of Names
- Know the Cognitive Advantages of Good Names
- Investigate a Hotspot by Its Name
- Understand the Limitations of Heuristics
- Chapter 6: Calculate Complexity Trends from Your Code’s Shape
- Complexity by the Visual Shape of Programs
- Learn About the Negative Space in Code
- Analyze Complexity Trends in Hotspots
- Evaluate the Growth Patterns
- From Individual Hotspots to Architectures
- Part 2: Dissect Your Architecture
- Chapter 7: Treat Your Code As a Cooperative Witness
- Know How Your Brain Deceives You
- Learn the Modus Operandi of a Code Change
- Use Temporal Coupling to Reduce Bias
- Prepare to Analyze Temporal Coupling
- Chapter 8: Detect Architectural Decay
- Support Your Redesigns with Data
- Analyze Temporal Coupling
- Catch Architectural Decay
- React to Structural Trends
- Scale to System Architectures
- Chapter 9: Build a Safety Net for Your Architecture
- Know What’s in an Architecture
- Analyze the Evolution on a System Level
- Differentiate Between the Level of Tests
- Create a Safety Net for Your Automated Tests
- Know the Costs of Automation Gone Wrong
- Chapter 10: Use Beauty as a Guiding Principle
- Learn Why Attractiveness Matters
- Write Beautiful Code
- Avoid Surprises in Your Architecture
- Analyze Layered Architectures
- Find Surprising Change Patterns
- Expand Your Analyses
- Part 3: Master the Social Aspects of Code
- Chapter 11: Norms, Groups, and False Serial Killers
- Learn Why the Right People Don’t Speak Up
- Understand Pluralistic Ignorance
- Witness Groupthink in Action
- Discover Your Team’s Modus Operandi
- Mine Organizational Metrics from Code
- Chapter 12: Discover Organizational Metrics in Your Codebase
- Let’s Work in the Communication Business
- Find the Social Problems of Scale
- Measure Temporal Coupling over Organizational Boundaries
- Evaluate Communication Costs
- Take It Step by Step
- Chapter 13: Build a Knowledge Map of Your System
- Know Your Knowledge Distribution
- Grow Your Mental Maps
- Investigate Knowledge in the Scala Repository
- Visualize Knowledge Loss
- Get More Details with Code Churn
- Chapter 14: Dive Deeper with Code Churn
- Cure the Disease, Not the Symptoms
- Discover Your Process Loss from Code
- Investigate the Disposal Sites of Killers and Code
- Predict Defects
- Time to Move On
- Chapter 15: Toward the Future
- Let Your Questions Guide Your Analysis
- Take Other Approaches
- Let’s Look into the Future
- Write to Evolve
- Appendix 1: Refactoring Hotspots
- Refactor Guided by Names
- Bibliography
- You May Be Interested In…
Discover Your Process Loss from Code
By using code churn, we can detect problems in our process. Again, we’re not referring to the official processes our companies use to get a sense of predictiveness in software development. Instead, we’re referring to the actual process you and your team use. Formal or not, chaotic or ordered—there’s always a process.
Now, remember how we discussed process loss back in Chapter 11, Norms, Groups, and False Serial Killers? Process loss means that we, as a team, will never operate at 100 percent efficiency. But what we can do is minimize the loss. To succeed, we need to know where we stand. So let’s see how code churn lets us trace process loss in the history of our codebase.
Measure the Churn Trend
Let’s start with a code churn analysis on Code Maat to reverse-engineer its coding process. Move into your Code Maat repository and request an abs-churn analysis:
| | prompt> maat -c git -l maat_evo.log -a abs-churn |
| | date,added,deleted |
| | 2013-08-09,259,20 |
| | 2013-08-11,146,70 |
| | 2013-08-12,213,79 |
| | 2013-08-13,126,23 |
| | 2013-08-15,334,118 |
| | ... |
The abs-churn analysis calculates the absolute code churn in the project. That means we get to see the total number of added and deleted lines of code grouped by each commit date.
When we re-engineer our process from code, the churn numbers themselves aren’t that interesting. What matters is the overall pattern. Let’s look at it.
A simple way to investigate churn patterns is to visualize the analysis results in a line diagram. Save the analysis results to a file and import the data into a spreadsheet application of your choice. As the following figure shows, the overall trend is a steady stream of commits. That’s a good trend because it means we’re building the software in small increments. Small increments make our progress more predictive. It’s a coding process that makes it easier to track down errors, since we can roll back the specific and isolated changes until we reach a stable state.
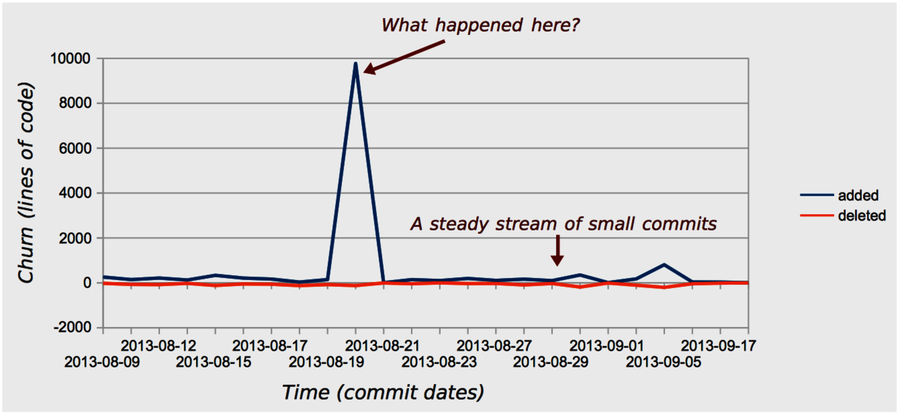
But all is not well. There’s a suspiciously high peak in the middle of the churn diagram. What happened there? According to the results from our abs-churn analysis, that spike occurred on the 2013-08-20. At that day, the Code Maat codebase grew by a factor of 60 compared to the normal daily churn. If that growth occurred due to new application logic, we may have a problem, because high code churn predicts defects.
Our first investigative step is to look at the version-control log for the date of interest. In this case, we find that the spike is due to the addition of static test data. As you can see in the following image, a complete Subversion log was committed to the repository.
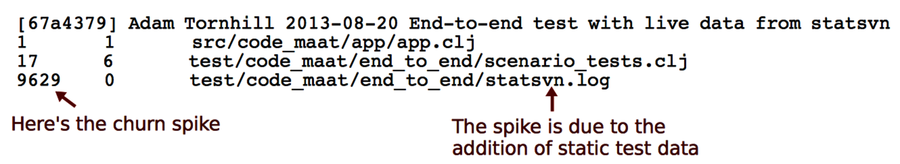
So in this case, our spike was a false positive (although test data may be fragile, too, as we discussed in Encapsulate Test Data). But you need to be aware of other churn patterns. Let’s look at them.
Know the Common Churn Patterns
When we investigate churn trends, we’ll typically find one of the patterns illustrated in the figure below. As we discuss these patterns, imagine a fictional deadline approaching. Now, let’s look at each pattern.
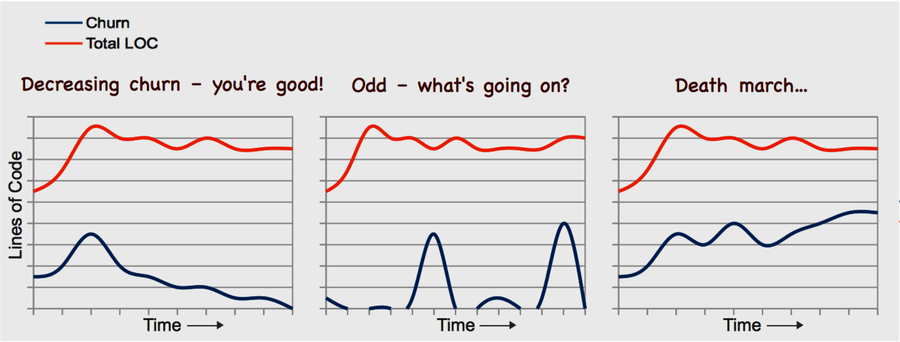
The first case shows a decreasing churn trend. That means we’re able to stabilize more and more of our code bases as time goes on. This is the pattern we want to see.
The second pattern is harder to interpret. The first time I saw it, it didn’t seem to make sense. Take a look at the following figure. What happens is that you have a period of virtually no activity, and then you get a sudden churn spike. Then there’s no activity again before another large spike occurs. What situational forces can bring forth a trend like this?
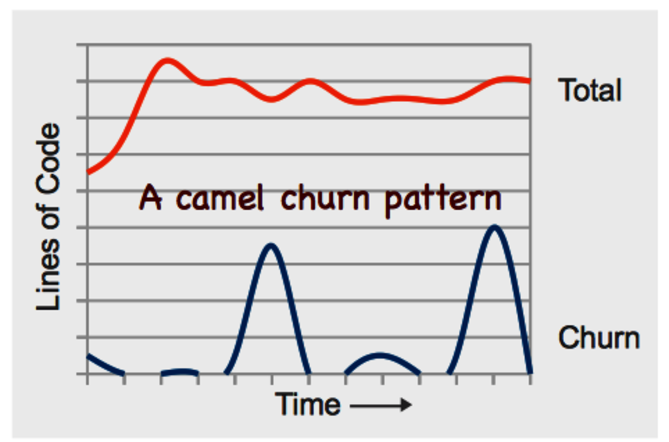
Remember the project I told you about at the start of this chapter? The project where we spent hours on complicated merges? That project exhibited this pattern. Once we looked into it, we found that there were exactly two weeks between each spike. Of course, the team used an iterative development process. And, you guessed it, each iteration was two weeks. At the start of each iteration, the developers got a feature assigned to them. The developers then branched out and coded along. As the deadline approached—in this case, the end of the iteration marked by a demo—each developer hurried to get his or her feature merged into the main branch.
The takeaway is that deadlines bring out the worst in us. No one wanted to miss the demo. As a consequence, code was often rushed to completion so that it could be merged. That in itself is a problem manifested in this pattern. But there’s more to it. Even when each feature is well-tested in isolation on its respective branch, we don’t know how the different features are going to work together. That puts us at risk for unexpected feature interactions, which are some of the trickiest bugs to track down.
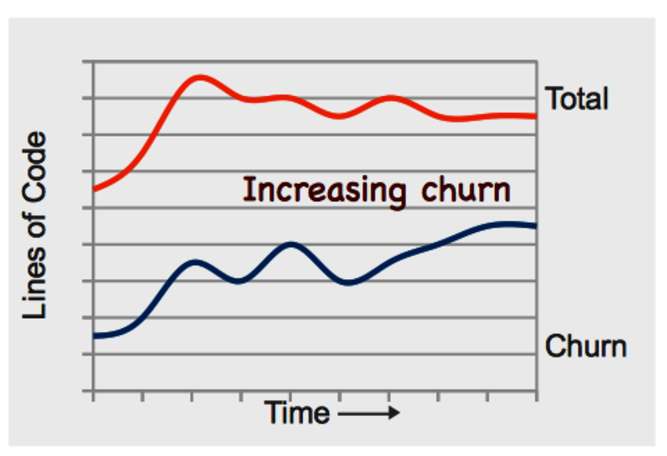
Finally, our last churn pattern shows a scary place to be. As you see in the following figure, that project approaches a deadline but keeps changing progressively more code. Since there’s a positive correlation between code churn and defects, this patterns means we put the quality of our code at risk.
This churn pattern means that the project won’t hit the deadline. There’s a lot more work before we have anything like a stable codebase. Running regular analyses of hotspots and temporal coupling lets you uncover more about these problems. Another useful strategy is to analyze what kind of growth you have by applying the tools from Chapter 6, Calculate Complexity Trends from Your Code’s Shape. If the new code is more complex than the previous code, the project is probably patching conditional statements into a design that cannot sustain them.
You Need Other Tools for SVN and Mercurial | |
|---|---|
|
|
Code Maat only supports code churn measures for Git. The reason is that Git makes the raw data available directly in the version-control log on which Code Maat operates. That doesn’t mean you’re out of luck, though. If you use Subversion, you can still calculate churn metrics. You need to write a script that iterates through all revisions in your repository and performs an svn diff for each revision. The output is fairly straightforward to parse in order to collect the churn values. I’d also recommend that you check out StatSVN,[40] which is a tool that calculates a churn trend for you. Mercurial users can apply the strategy to extract raw churn values. In addition, Mercurial comes with a churn extension that provides useful statistics.[41] |