Table of Contents for
Your Code as a Crime Scene
 Your Code as a Crime Scene
Published by
Pragmatic Bookshelf, 2015
Your Code as a Crime Scene
Published by
Pragmatic Bookshelf, 2015
- Title Page
- Your Code as a Crime Scene
- Your Code as a Crime Scene
- For the Best Reading Experience...
- Table of Contents
- Early praise for Your Code as a Crime Scene
- Foreword by Michael Feathers
- Acknowledgments
- Chapter 1: Welcome!
- About This Book
- Optimize for Understanding
- How to Read This Book
- Toward a New Approach
- Get Your Investigative Tools
- Part 1: Evolving Software
- Chapter 2: Code as a Crime Scene
- Meet the Problems of Scale
- Get a Crash Course in Offender Profiling
- Profiling the Ripper
- Apply Geographical Offender Profiling to Code
- Learn from the Spatial Movement of Programmers
- Find Your Own Hotspots
- Chapter 3: Creating an Offender Profile
- Mining Evolutionary Data
- Automated Mining with Code Maat
- Add the Complexity Dimension
- Merge Complexity and Effort
- Limitations of the Hotspot Criteria
- Use Hotspots as a Guide
- Dig Deeper
- Chapter 4: Analyze Hotspots in Large-Scale Systems
- Analyze a Large Codebase
- Visualize Hotspots
- Explore the Visualization
- Study the Distribution of Hotspots
- Differentiate Between True Problems and False Positives
- Chapter 5: Judge Hotspots with the Power of Names
- Know the Cognitive Advantages of Good Names
- Investigate a Hotspot by Its Name
- Understand the Limitations of Heuristics
- Chapter 6: Calculate Complexity Trends from Your Code’s Shape
- Complexity by the Visual Shape of Programs
- Learn About the Negative Space in Code
- Analyze Complexity Trends in Hotspots
- Evaluate the Growth Patterns
- From Individual Hotspots to Architectures
- Part 2: Dissect Your Architecture
- Chapter 7: Treat Your Code As a Cooperative Witness
- Know How Your Brain Deceives You
- Learn the Modus Operandi of a Code Change
- Use Temporal Coupling to Reduce Bias
- Prepare to Analyze Temporal Coupling
- Chapter 8: Detect Architectural Decay
- Support Your Redesigns with Data
- Analyze Temporal Coupling
- Catch Architectural Decay
- React to Structural Trends
- Scale to System Architectures
- Chapter 9: Build a Safety Net for Your Architecture
- Know What’s in an Architecture
- Analyze the Evolution on a System Level
- Differentiate Between the Level of Tests
- Create a Safety Net for Your Automated Tests
- Know the Costs of Automation Gone Wrong
- Chapter 10: Use Beauty as a Guiding Principle
- Learn Why Attractiveness Matters
- Write Beautiful Code
- Avoid Surprises in Your Architecture
- Analyze Layered Architectures
- Find Surprising Change Patterns
- Expand Your Analyses
- Part 3: Master the Social Aspects of Code
- Chapter 11: Norms, Groups, and False Serial Killers
- Learn Why the Right People Don’t Speak Up
- Understand Pluralistic Ignorance
- Witness Groupthink in Action
- Discover Your Team’s Modus Operandi
- Mine Organizational Metrics from Code
- Chapter 12: Discover Organizational Metrics in Your Codebase
- Let’s Work in the Communication Business
- Find the Social Problems of Scale
- Measure Temporal Coupling over Organizational Boundaries
- Evaluate Communication Costs
- Take It Step by Step
- Chapter 13: Build a Knowledge Map of Your System
- Know Your Knowledge Distribution
- Grow Your Mental Maps
- Investigate Knowledge in the Scala Repository
- Visualize Knowledge Loss
- Get More Details with Code Churn
- Chapter 14: Dive Deeper with Code Churn
- Cure the Disease, Not the Symptoms
- Discover Your Process Loss from Code
- Investigate the Disposal Sites of Killers and Code
- Predict Defects
- Time to Move On
- Chapter 15: Toward the Future
- Let Your Questions Guide Your Analysis
- Take Other Approaches
- Let’s Look into the Future
- Write to Evolve
- Appendix 1: Refactoring Hotspots
- Refactor Guided by Names
- Bibliography
- You May Be Interested In…
Evaluate Communication Costs
To reason about communication costs, we need to know who’s communicating with whom. The analysis model we’ll use is based on the idea that we can identify a main developer of each module.
We’ll define the main developer as the programmer who’s likely to know the most about the specific code. Because code knowledge isn’t easy to measure, we’ll use the number of contributed lines of code instead.
Like all heuristics, our metric has its flaws—in particular, since we measure something as multifaceted as programmer contributions. That doesn’t mean the results are useless; the metrics are there to support your decisions, not to make them for you. Your knowledge and expertise cannot be replaced by data.
So sure, using the number of added lines of code is a rough approximation, but the overall results tend to be good enough. Let’s see the metric in action.
Identify Main Developers by Removed Code | |
|---|---|
|
|
Since we used the number of added lines to identify main developers, this means that a copy-paste cowboy could easily conquer parts of the codebase. So, let’s turn it around and find an alternative. Good programmers take pride in doing more with less. That means you could use the number of removed lines of code instead. That tweak to the algorithm would identify developers who actively refactor the code. Since Code Maat implements the analysis, refactoring-main-dev, go ahead and try it yourself. In practice, you’ll often find that in projects that care about code quality, like Hibernate, the two algorithms identify the same people. This is why we used the conceptually simpler metric of added lines in our case study. |
Identify Main Developers
As the following figure shows, the contribution information is recorded in every commit. We just need to instruct Code Maat to sum it up and calculate a degree of ownership for each entity. The author with most added lines is considered the main developer, the knowledge owner, of that module.
You perform a main developer analysis with the main-dev option. On Hibernate, this analysis will deliver a long list of results. (Remember, Hibernate is a large codebase.) So let’s save the results to a file for further inspection:
| | prompt> maat -c git -l hib_evo.log -a main-dev > main_devs.csv |
Let’s look inside main_devs.csv to find the main developer of AbstractEntityPersister:
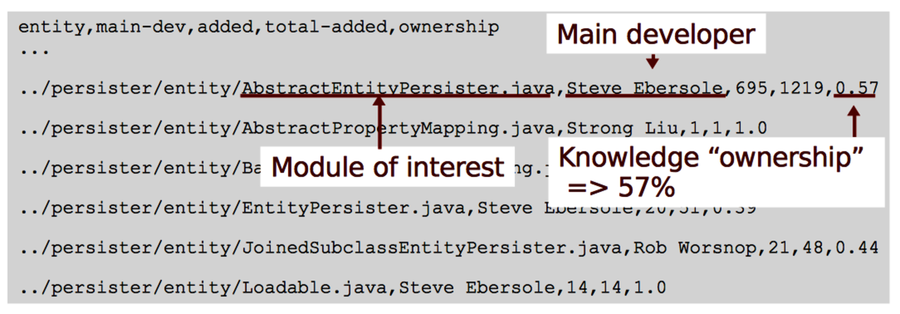
The results identify Mr. Ebersole, the productive project lead on Hibernate, as the main developer. In our analysis period, he contributed 695 of the 1,219 lines that have been added to AbstractEntityPersister, an ownership of 57%.
Remember, we’re after expensive communication paths. So who does Mr. Ebersole have to communicate with? To find out, we need to identify the main developers of the modules that are temporally coupled to AbstractEntityPersister. Let’s look at that.
This Only Works on Git | |
|---|---|
|
|
The main-dev analysis we ran only works on Git. The reason is that neither Subversion nor Mercurial includes the number of modified lines of code in its log files. Fortunately, there’s a workaround that’s almost as good. If you’re on another version-control system—for example, Subversion—then run the main-dev-by-revs analysis instead. That analysis classifies the programmer who has contributed the most commits to a specific module as its main developer. |
Analyze Contributions to Coupled Modules
When we analyzed the temporal coupling to AbstractEntityPersister in the code, we identified three dependent modules. Let’s extract the main developers of those from our main_devs.csv analysis results:
| Coupled Module | Main Developer | Ownership (%) |
|---|---|---|
CustomPersister.java | Steve Ebersole | 58 |
EntityPersister.java | Steve Ebersole | 39 |
GoofyPersisterClassProvider.java | Steve Ebersole | 54 |
As you can see in the preceding figure, all entities that have a temporal coupling to the AbstractEntityPersister are within the mind of the same developer. Looks good—or does it? The low ownership degree, 39 percent, of EntityPersister.java indicates that the code is shared between several authors. Let’s see how much each programmer contributed before we can feel safe.
Calculate Individual Contributions
The contributions of each developer are available from the same version-control information. We just need to use an entity-ownership analysis instead. Here’s how it looks, filtered for EntityPersister:
| | prompt> maat -c git -l hib_evo.log -a entity-ownership |
| | entity,author,added,deleted |
| | ... |
| | ../EntityPersister.java,Gail Badner,1,0 |
| | ../EntityPersister.java,Steve Ebersole,20,9 |
| | ../EntityPersister.java,Rob Worsnop,3,0 |
| | ../EntityPersister.java,Eric Dalquist,19,8 |
| | ../EntityPersister.java,edalquist,8,2 |
| | ... |
Oops—one of the programmers, Eric Dalquist, uses two committer names. We see it immediately in the output above, but Code Maat had no way to know. That means we’ve run into our first analysis bias!
The problem is easy to fix once we’ve identified the authors with multiple aliases. On your own projects, you want to investigate and clean the log before any analyses. Once we’ve done a quick search-and-replace on our data, we rerun the analysis on the cleaned log:
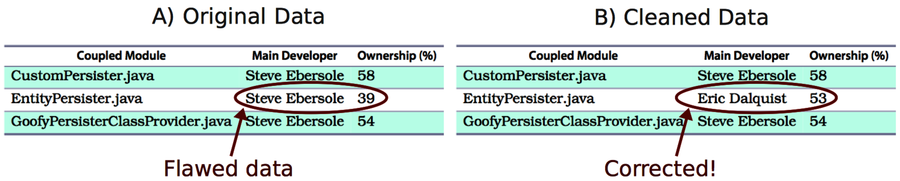
The algorithm now identifies the correct main developer. If we put our results together, we can start to reason about communication:
-
We have a temporal coupling between EntityPersister and AbstractEntityPersister.
-
Since AbstractEntityPersister is a hotspot, we know we need to modify the code frequently.
-
That means its coupled part, EntityPersister, will need to change often as well, but the two modules have different main developers!
Let’s look at the consequences.
Check Communication Dependencies Against Your Organization
Hibernate is open source with a development process that’s different from what most companies in the industry use. Without more context and insight, it’s hard to reason about the consequences of our findings.
What we do know is that communication costs are likely to increase with organizational distance. So when you identify a case like this in your own projects, you want to check the information against your organization. Are the two programmers on the same team? Are they located at the same site? If not, it may be a concern.
When we work together, we develop informal communication channels. We meet in the hallway, grab a coffee together in the morning, or chat about our work during lunch breaks. If we lose those opportunities for informal talks, our products suffer.
In this chapter, you got the basic tools to start analyzing how well your own development work aligns with those communication channels. Let’s sum up.