Table of Contents for
Your Code as a Crime Scene
 Your Code as a Crime Scene
Published by
Pragmatic Bookshelf, 2015
Your Code as a Crime Scene
Published by
Pragmatic Bookshelf, 2015
- Title Page
- Your Code as a Crime Scene
- Your Code as a Crime Scene
- For the Best Reading Experience...
- Table of Contents
- Early praise for Your Code as a Crime Scene
- Foreword by Michael Feathers
- Acknowledgments
- Chapter 1: Welcome!
- About This Book
- Optimize for Understanding
- How to Read This Book
- Toward a New Approach
- Get Your Investigative Tools
- Part 1: Evolving Software
- Chapter 2: Code as a Crime Scene
- Meet the Problems of Scale
- Get a Crash Course in Offender Profiling
- Profiling the Ripper
- Apply Geographical Offender Profiling to Code
- Learn from the Spatial Movement of Programmers
- Find Your Own Hotspots
- Chapter 3: Creating an Offender Profile
- Mining Evolutionary Data
- Automated Mining with Code Maat
- Add the Complexity Dimension
- Merge Complexity and Effort
- Limitations of the Hotspot Criteria
- Use Hotspots as a Guide
- Dig Deeper
- Chapter 4: Analyze Hotspots in Large-Scale Systems
- Analyze a Large Codebase
- Visualize Hotspots
- Explore the Visualization
- Study the Distribution of Hotspots
- Differentiate Between True Problems and False Positives
- Chapter 5: Judge Hotspots with the Power of Names
- Know the Cognitive Advantages of Good Names
- Investigate a Hotspot by Its Name
- Understand the Limitations of Heuristics
- Chapter 6: Calculate Complexity Trends from Your Code’s Shape
- Complexity by the Visual Shape of Programs
- Learn About the Negative Space in Code
- Analyze Complexity Trends in Hotspots
- Evaluate the Growth Patterns
- From Individual Hotspots to Architectures
- Part 2: Dissect Your Architecture
- Chapter 7: Treat Your Code As a Cooperative Witness
- Know How Your Brain Deceives You
- Learn the Modus Operandi of a Code Change
- Use Temporal Coupling to Reduce Bias
- Prepare to Analyze Temporal Coupling
- Chapter 8: Detect Architectural Decay
- Support Your Redesigns with Data
- Analyze Temporal Coupling
- Catch Architectural Decay
- React to Structural Trends
- Scale to System Architectures
- Chapter 9: Build a Safety Net for Your Architecture
- Know What’s in an Architecture
- Analyze the Evolution on a System Level
- Differentiate Between the Level of Tests
- Create a Safety Net for Your Automated Tests
- Know the Costs of Automation Gone Wrong
- Chapter 10: Use Beauty as a Guiding Principle
- Learn Why Attractiveness Matters
- Write Beautiful Code
- Avoid Surprises in Your Architecture
- Analyze Layered Architectures
- Find Surprising Change Patterns
- Expand Your Analyses
- Part 3: Master the Social Aspects of Code
- Chapter 11: Norms, Groups, and False Serial Killers
- Learn Why the Right People Don’t Speak Up
- Understand Pluralistic Ignorance
- Witness Groupthink in Action
- Discover Your Team’s Modus Operandi
- Mine Organizational Metrics from Code
- Chapter 12: Discover Organizational Metrics in Your Codebase
- Let’s Work in the Communication Business
- Find the Social Problems of Scale
- Measure Temporal Coupling over Organizational Boundaries
- Evaluate Communication Costs
- Take It Step by Step
- Chapter 13: Build a Knowledge Map of Your System
- Know Your Knowledge Distribution
- Grow Your Mental Maps
- Investigate Knowledge in the Scala Repository
- Visualize Knowledge Loss
- Get More Details with Code Churn
- Chapter 14: Dive Deeper with Code Churn
- Cure the Disease, Not the Symptoms
- Discover Your Process Loss from Code
- Investigate the Disposal Sites of Killers and Code
- Predict Defects
- Time to Move On
- Chapter 15: Toward the Future
- Let Your Questions Guide Your Analysis
- Take Other Approaches
- Let’s Look into the Future
- Write to Evolve
- Appendix 1: Refactoring Hotspots
- Refactor Guided by Names
- Bibliography
- You May Be Interested In…
Investigate the Disposal Sites of Killers and Code
As we introduced hotspots in Chapter 2, Code as a Crime Scene, we based our hotspots on a core idea from geographical profiling: the spatial movement of criminals helps us identify and catch them. Similarly, we’ve been able to identify patterns in our spatial movement in code. And these patterns let us identify maintenance problems and react to them.
Over the years, forensic psychologists have looked at other behavioral patterns as well. One recent study investigated the location of disposal sites used by serial killers. It sure is a macabre research subject, but the information gained is valuable. Let’s look into it.
The deeds of a serial killer are bizarre. There’s not much to understand there. But although the deeds are irrational, there is a certain logic to the places where serial killers choose to dispose of their victims. One driving force is minimizing the risk of detection. That means the disposal sites are carefully chosen. Often, the geographical distribution of these locations overlaps with the offender’s other noncriminal activities. (See Principles of Geographical Offender Profiling [CY08a].) As a consequence, the location of disposal sites contains additional information that points to the offender.
Our programing activities are nowhere near as gruesome, but our codebases do have disposal sites. Disposal sites of code that shouldn’t be there are also hard to find. Just as criminal investigators improve their models by looking for additional data, so should we. Let’s see how code churn provides that information.
Link Code Churn to Temporal Coupling
Our early design decisions frequently lead to problems as our code evolves. Because programming is a learning activity, it’s ironic that we have to make so many fundamental design choices early, at the point where we know the least about the system. That’s why we need to revisit and improve those choices. We need to reflect our increased understanding in the system we’re building.
The analyses we’ve learned aim to let us pick up the signs when things start to evolve in the wrong direction. One typical sign is when our software exhibits unexpected modification patterns. In Part II, you learned to catch that problem with temporal coupling analyses. Let’s return to one of those case studies and supplement it with code churn data.
We’ll reuse the version-control log from Craft.Net that we investigated in Catch Architectural Decay. In that chapter, we found that the central MinecraftServer module kept accumulating temporal dependencies. We interpreted this trend as a sign of structural decay.
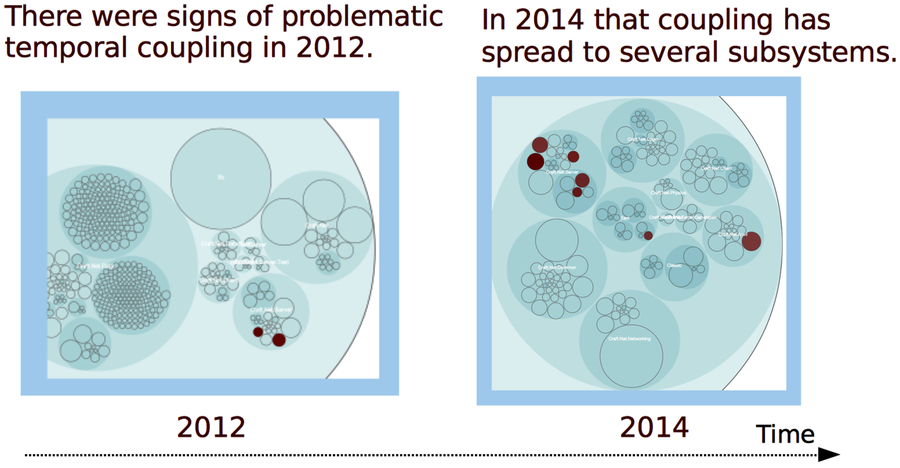
Let’s revisit the results from that temporal coupling analysis. You can reuse the version-control log we generated back then. (If you don’t have one, follow the steps in Catch Architectural Decay.) As you can see in the following figure, the dependencies go across multiple packages:
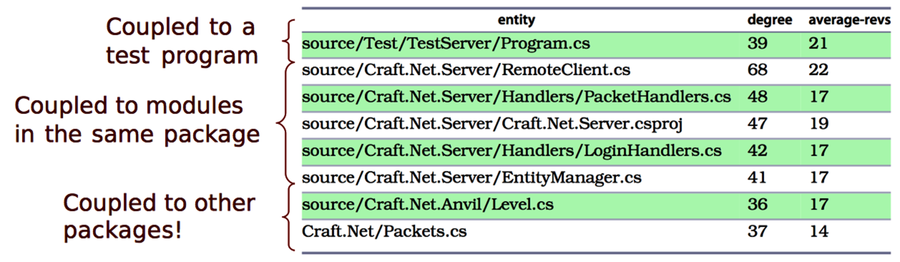
Figure 3. Modules that have temporal coupling to MinecraftServer
The structural decay in the preceding figure is a reason for concern. We have a cluster of 7 modules with strong temporal dependencies on the MinecraftServer. Trying to break all of these dependencies at once would be a high-risk operation. Instead, we’d like to prioritize the problems. Are some dependencies worse than others? A code churn analysis cannot tell for sure, but it gives us enough hints. Let’s try it out.
Link Code Churn to Temporal Coupling
In our first churn analysis, we calculated a trend for the complete codebase. Now we want to focus on individual modules instead and see how the churn is distributed across the system. We do that by an entity-churn analysis. Here’s how it looks in the Craft.Net repository:
| | prompt> maat -c git -l craft_evo_140808.log -a entity-churn |
| | entity,added,deleted |
| | ... |
| | Craft.Net.Server/MinecraftServer.cs,1315,786 |
| | Craft.Net.Server/EntityManager.cs,775,562 |
| | Craft.Net.Client/Session.cs,678,499 |
| | Craft.Net/Packets.cs,676,3245 |
| | ... |
The results show the amount of churned code in each module. For example, you see that we added 1,315 lines of code to the MinecraftServer.cs, but we also deleted 786 lines. Let’s combine this information with our temporal coupling results:
| Module | Coupling (%) | Added Lines | Deleted Lines |
|---|---|---|---|
Test/TestServer/Program.cs | 39 | 88 | 28 |
Server/RemoteClient.cs | 68 | 313 | 45 |
Server/Handlers/PacketHandlers.cs | 48 | 224 | 136 |
Client/Handlers/LoginHandlers.cs | 42 | 179 | 99 |
Server/EntityManager.cs | 41 | 65 | 569 |
Anvil/Level.cs | 36 | 411 | 11 |
Packets.cs | 37 | 676 | 3245 |
The churn metrics give us a more refined picture of the structural problems. Let’s interpret our findings.
Interpret Temporal Coupling with Churn
In the preceding table, we can see that the Level.cs module has increased significantly in size. As part of this growth, it got coupled to the MinecraftServer. That’s the kind of dependency I’d recommend you break soon.
Our churn dimensions also tell us that TestServer/Program.cs and Handlers/LoginHandlers.cs only contain small modifications. That means they get low priority until our more serious problems have been addressed.
Finally, the EntityManager.cs presents an interesting case. Given what you learned in Chapter 5, Judge Hotspots with the Power of Names, the name of the module makes an alarm go off. But our metrics show that the module shrank by 500 lines during our analysis period. Since code is like body fat after the holiday season—it’s good to get rid of some—this decrease is a promising sign. You see, code churn can be used to track improvements, too.
As you see, adding churn metrics to your other analyses lets you prioritize the improvements. Code churn also helps to track your progress. Used this way, code churn becomes a tool to focus refactoring efforts where they are likely to pay off quickly.