Table of Contents for
Your Code as a Crime Scene

Version ebook / Retour

Cover image for bash Cookbook, 2nd Edition Your Code as a Crime Scene by Adam Tornhill Published by Pragmatic Bookshelf, 2015
  1. Title Page
  2. Your Code as a Crime Scene
  3. Your Code as a Crime Scene
  4. For the Best Reading Experience...
  5. Table of Contents
  6. Early praise for Your Code as a Crime Scene
  7. Foreword by Michael Feathers
  8. Acknowledgments
  9. Chapter 1: Welcome!
  10. About This Book
  11. Optimize for Understanding
  12. How to Read This Book
  13. Toward a New Approach
  14. Get Your Investigative Tools
  15. Part 1: Evolving Software
  16. Chapter 2: Code as a Crime Scene
  17. Meet the Problems of Scale
  18. Get a Crash Course in Offender Profiling
  19. Profiling the Ripper
  20. Apply Geographical Offender Profiling to Code
  21. Learn from the Spatial Movement of Programmers
  22. Find Your Own Hotspots
  23. Chapter 3: Creating an Offender Profile
  24. Mining Evolutionary Data
  25. Automated Mining with Code Maat
  26. Add the Complexity Dimension
  27. Merge Complexity and Effort
  28. Limitations of the Hotspot Criteria
  29. Use Hotspots as a Guide
  30. Dig Deeper
  31. Chapter 4: Analyze Hotspots in Large-Scale Systems
  32. Analyze a Large Codebase
  33. Visualize Hotspots
  34. Explore the Visualization
  35. Study the Distribution of Hotspots
  36. Differentiate Between True Problems and False Positives
  37. Chapter 5: Judge Hotspots with the Power of Names
  38. Know the Cognitive Advantages of Good Names
  39. Investigate a Hotspot by Its Name
  40. Understand the Limitations of Heuristics
  41. Chapter 6: Calculate Complexity Trends from Your Code’s Shape
  42. Complexity by the Visual Shape of Programs
  43. Learn About the Negative Space in Code
  44. Analyze Complexity Trends in Hotspots
  45. Evaluate the Growth Patterns
  46. From Individual Hotspots to Architectures
  47. Part 2: Dissect Your Architecture
  48. Chapter 7: Treat Your Code As a Cooperative Witness
  49. Know How Your Brain Deceives You
  50. Learn the Modus Operandi of a Code Change
  51. Use Temporal Coupling to Reduce Bias
  52. Prepare to Analyze Temporal Coupling
  53. Chapter 8: Detect Architectural Decay
  54. Support Your Redesigns with Data
  55. Analyze Temporal Coupling
  56. Catch Architectural Decay
  57. React to Structural Trends
  58. Scale to System Architectures
  59. Chapter 9: Build a Safety Net for Your Architecture
  60. Know What’s in an Architecture
  61. Analyze the Evolution on a System Level
  62. Differentiate Between the Level of Tests
  63. Create a Safety Net for Your Automated Tests
  64. Know the Costs of Automation Gone Wrong
  65. Chapter 10: Use Beauty as a Guiding Principle
  66. Learn Why Attractiveness Matters
  67. Write Beautiful Code
  68. Avoid Surprises in Your Architecture
  69. Analyze Layered Architectures
  70. Find Surprising Change Patterns
  71. Expand Your Analyses
  72. Part 3: Master the Social Aspects of Code
  73. Chapter 11: Norms, Groups, and False Serial Killers
  74. Learn Why the Right People Don’t Speak Up
  75. Understand Pluralistic Ignorance
  76. Witness Groupthink in Action
  77. Discover Your Team’s Modus Operandi
  78. Mine Organizational Metrics from Code
  79. Chapter 12: Discover Organizational Metrics in Your Codebase
  80. Let’s Work in the Communication Business
  81. Find the Social Problems of Scale
  82. Measure Temporal Coupling over Organizational Boundaries
  83. Evaluate Communication Costs
  84. Take It Step by Step
  85. Chapter 13: Build a Knowledge Map of Your System
  86. Know Your Knowledge Distribution
  87. Grow Your Mental Maps
  88. Investigate Knowledge in the Scala Repository
  89. Visualize Knowledge Loss
  90. Get More Details with Code Churn
  91. Chapter 14: Dive Deeper with Code Churn
  92. Cure the Disease, Not the Symptoms
  93. Discover Your Process Loss from Code
  94. Investigate the Disposal Sites of Killers and Code
  95. Predict Defects
  96. Time to Move On
  97. Chapter 15: Toward the Future
  98. Let Your Questions Guide Your Analysis
  99. Take Other Approaches
  100. Let’s Look into the Future
  101. Write to Evolve
  102. Appendix 1: Refactoring Hotspots
  103. Refactor Guided by Names
  104. Bibliography
  105. You May Be Interested In…

Apply Geographical Offender Profiling to Code

As I learned about geographical offender profiling in criminal psychology, I was struck by its possible applications to software. What if we could devise techniques that let us identify hotspots in large software systems? A hotspot analysis that could narrow down a large system to a few critical modules would be a big win in our profession.

Instead of speculating about potential design problems among million lines of code, geographical profiling would give us a prioritized lists of sections that need refactoring. It would also be dynamic, reflecting shifts in development focus over time.

Explore the Geography of Code

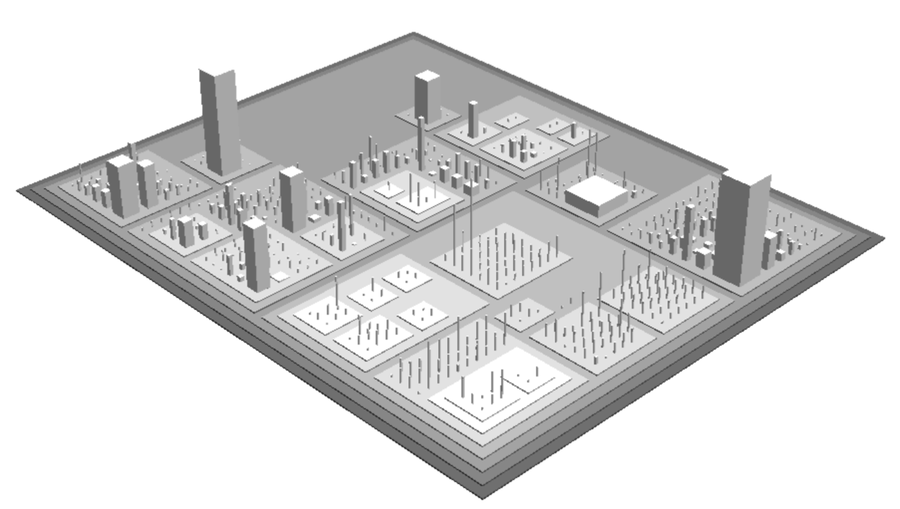
We need a geography of code. Despite its lack of physics, software is easy to visualize. My favorite tool is Code City.[6] It’s fun to work with and matches the offender-profiling metaphor well. The following figure shows a sample city generated by the tool.
images/Chp2_CodeCity.png

A city block represents a package, and each class is a building. The number of methods defines the height, and the number of attributes specifies the base of the building. Try out Code City, and you’ll notice new patterns you didn’t spot before in the code itself.

Code City is a nice starting point, but it limits us to looking at only object-oriented designs. Today’s software world is increasingly polyglot. Even when you use the same language, you may have complex configurations in scripts, XML, and other markup formats. A geography must present a holistic picture, no matter what languages we choose. We’ll soon explore other options, but before that we need to address a more serious limitation of our data.

Look at the large buildings in our city map again. If that information is all we have, those large buildings would be our hotspots. But there’s nothing in the illustration to indicate on which building we should actually spend our efforts. Perhaps those large classes have been stable for years, are well-tested, and have little developer activity. It doesn’t make sense to start there when other buildings may require immediate attention. In this case, the code doesn’t tell the whole story.

Joe asks:
Joe asks:
Who Was Jack?

Since Jack the Ripper was never caught, how do we know if the geographical offender profile is any good?

As of September 2014, there were reports of mitochondrial DNA evidence that presumably links one of the suspects, Aaron Kosminski, to a Jack the Ripper victim. There is a lot of controversy and debate around the claim, so let me introduce you to another likely suspect: James Maybrick.

In the early 1990s, a diary supposedly written by Liverpool cotton merchant James Maybrick surfaced. In this diary, Maybrick claimed to be the Ripper. Since its publication in The Diary of Jack the Ripper [Har10], thousands of Ripperologists around the world have tried to expose the diary as a forgery using techniques such as handwriting analysis and chemical ink tests. No one has yet managed to prove the diary is fake, and its legitimacy is still under dispute.

images/Chp2_Maybrick.png

The interesting part about the diary for us is the fact that Maybrick wrote that he used to rent a room on Middlesex Street whenever he visited London. You can see Middlesex Street right inside our hotspot.

But what about Aaron Kosminiski’s homebase? It, too, fits the profile, although not as well as Maybrick’s does. Kosminski’s probable home at the time of the murders is just a little bit east of the high-probability hotspot area.