Table of Contents for
Your Code as a Crime Scene
 Your Code as a Crime Scene
Published by
Pragmatic Bookshelf, 2015
Your Code as a Crime Scene
Published by
Pragmatic Bookshelf, 2015
- Title Page
- Your Code as a Crime Scene
- Your Code as a Crime Scene
- For the Best Reading Experience...
- Table of Contents
- Early praise for Your Code as a Crime Scene
- Foreword by Michael Feathers
- Acknowledgments
- Chapter 1: Welcome!
- About This Book
- Optimize for Understanding
- How to Read This Book
- Toward a New Approach
- Get Your Investigative Tools
- Part 1: Evolving Software
- Chapter 2: Code as a Crime Scene
- Meet the Problems of Scale
- Get a Crash Course in Offender Profiling
- Profiling the Ripper
- Apply Geographical Offender Profiling to Code
- Learn from the Spatial Movement of Programmers
- Find Your Own Hotspots
- Chapter 3: Creating an Offender Profile
- Mining Evolutionary Data
- Automated Mining with Code Maat
- Add the Complexity Dimension
- Merge Complexity and Effort
- Limitations of the Hotspot Criteria
- Use Hotspots as a Guide
- Dig Deeper
- Chapter 4: Analyze Hotspots in Large-Scale Systems
- Analyze a Large Codebase
- Visualize Hotspots
- Explore the Visualization
- Study the Distribution of Hotspots
- Differentiate Between True Problems and False Positives
- Chapter 5: Judge Hotspots with the Power of Names
- Know the Cognitive Advantages of Good Names
- Investigate a Hotspot by Its Name
- Understand the Limitations of Heuristics
- Chapter 6: Calculate Complexity Trends from Your Code’s Shape
- Complexity by the Visual Shape of Programs
- Learn About the Negative Space in Code
- Analyze Complexity Trends in Hotspots
- Evaluate the Growth Patterns
- From Individual Hotspots to Architectures
- Part 2: Dissect Your Architecture
- Chapter 7: Treat Your Code As a Cooperative Witness
- Know How Your Brain Deceives You
- Learn the Modus Operandi of a Code Change
- Use Temporal Coupling to Reduce Bias
- Prepare to Analyze Temporal Coupling
- Chapter 8: Detect Architectural Decay
- Support Your Redesigns with Data
- Analyze Temporal Coupling
- Catch Architectural Decay
- React to Structural Trends
- Scale to System Architectures
- Chapter 9: Build a Safety Net for Your Architecture
- Know What’s in an Architecture
- Analyze the Evolution on a System Level
- Differentiate Between the Level of Tests
- Create a Safety Net for Your Automated Tests
- Know the Costs of Automation Gone Wrong
- Chapter 10: Use Beauty as a Guiding Principle
- Learn Why Attractiveness Matters
- Write Beautiful Code
- Avoid Surprises in Your Architecture
- Analyze Layered Architectures
- Find Surprising Change Patterns
- Expand Your Analyses
- Part 3: Master the Social Aspects of Code
- Chapter 11: Norms, Groups, and False Serial Killers
- Learn Why the Right People Don’t Speak Up
- Understand Pluralistic Ignorance
- Witness Groupthink in Action
- Discover Your Team’s Modus Operandi
- Mine Organizational Metrics from Code
- Chapter 12: Discover Organizational Metrics in Your Codebase
- Let’s Work in the Communication Business
- Find the Social Problems of Scale
- Measure Temporal Coupling over Organizational Boundaries
- Evaluate Communication Costs
- Take It Step by Step
- Chapter 13: Build a Knowledge Map of Your System
- Know Your Knowledge Distribution
- Grow Your Mental Maps
- Investigate Knowledge in the Scala Repository
- Visualize Knowledge Loss
- Get More Details with Code Churn
- Chapter 14: Dive Deeper with Code Churn
- Cure the Disease, Not the Symptoms
- Discover Your Process Loss from Code
- Investigate the Disposal Sites of Killers and Code
- Predict Defects
- Time to Move On
- Chapter 15: Toward the Future
- Let Your Questions Guide Your Analysis
- Take Other Approaches
- Let’s Look into the Future
- Write to Evolve
- Appendix 1: Refactoring Hotspots
- Refactor Guided by Names
- Bibliography
- You May Be Interested In…
Study the Distribution of Hotspots
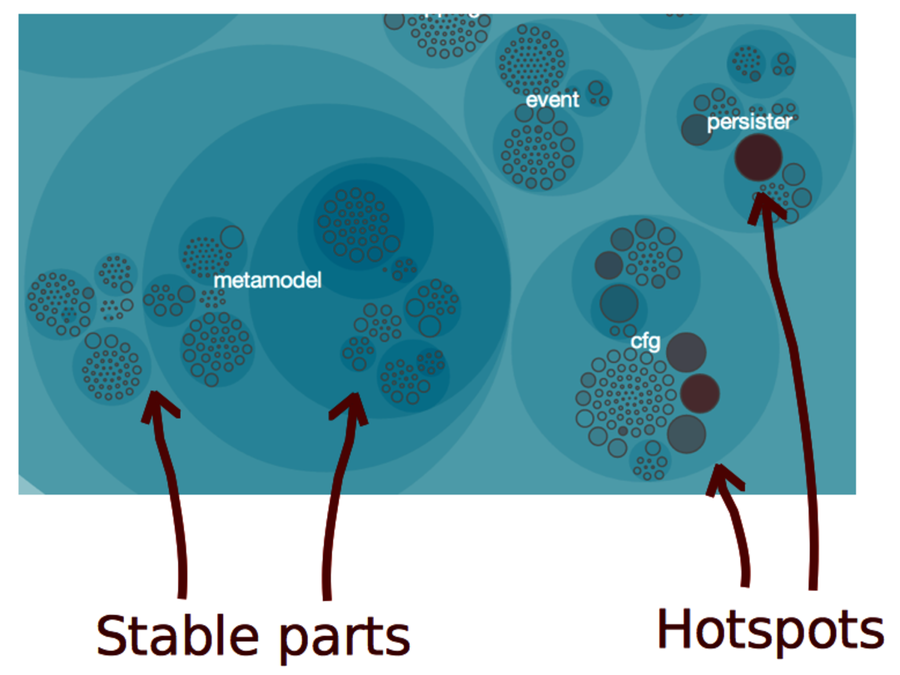
Take another look at the the first hotspot picture. The cluster we see in the lower-right corner is something that frequently happens in software projects. The reason we see that cluster is because changes to one hotspot are intimately tied to changes in other areas.
Multiple hotspots that change together are signs of unstable code. In a well-designed system, we expect code to become more stable over time. Let’s consider the underlying design principles to see why.
Individual Coding Styles Affect Hotspots | |
|---|---|
|
|
A project’s success depends on the coding skills of the people involved. As humans we vary a lot in our capabilities. A cognitively demanding task like programming amplifies those variations. That’s one reason why there’s a large difference in quality between the code of different programmers, even on the same team. Given these differences, it is hardly surprising that the expertise and coding techniques of individual developers make up one reason for clusters of hotspots. Specialization is very common in large software projects. Developers find their niche within a subsystem or feature area and stay there. If the same person is designing all the modules within that area, then the results are going to be similar. This may be one reason why hotspots attract each other. We aren’t talking about incompetency. When we look at the current hotspot, we don’t have the original context, so mistakes look obvious in hindsight. But there are many reasons why the code looks as it does. Perhaps it was a strategic decision to build on top of a fragile base—a deliberate technical debt. Or the hotspot may be a clue that your developers don’t know something. You can educate your team with better methods or even rearrange the teams to shift skills around. We’ll devote Part III of this book to those areas. |
Design to Isolate Change
As we discussed in See That Hotspots Really Work, there’s a strong correlation between the stability of code and its quality. If you look into research on the subject, you’ll find support for the idea; the importance of change to a module is so high that more elaborate metrics rarely provide any further predictive value when it comes to defects. (See the research in Does Measuring Code Change Improve Fault Prediction? [BOW11].)
In the following figure, metamodel represents a stable package. That’s the kind of code you want. Contrast it with the subsystems cfg and persister, which both contain several hotspots that evolve together.
The importance of change isn’t limited to individual classes. It’s even more important on a system level. Here’s why.
Stabilize by Extracting Cohesive Design Elements
Different features stabilize at different rates. You want to reflect that in your design such that modules in a specific subsystem evolve at similar rate.
When faced with clusters of hotspots, we need to investigate the kind of changes we are making. Because you’re working with version-control data, you can look at each change made to the modules. You’ll often find that the change patterns suggest new modular boundaries.
When modules aren’t stable, we need to act. Often that failure stems from low cohesion; the subsystems keep changing because they have many reasons to do so.
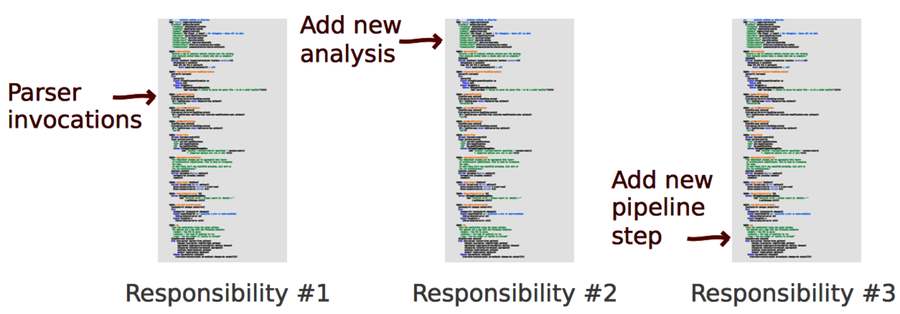
The following figure shows a simplified example from Code Maat. Its app.clj module has changed several times, each time for different reasons. It has three responsibilites, and therefore three reasons to change. Refactoring this module to three independent ones would isolate the responsibilities and stabilize the code.
The more of your code you can protect from change, the better. Cohesion lets you isolate change. You have less code to modify in stable modules. This relieves your brain, as it means you have less knowledge to keep in your head. It’s cognitive economy.
Create Your Own Visualizations
Before we move on, let’s see how you can visualize your own code with a set of simple tools. The visualizations in this chapter all contain the same information as we have in the Code Maat output. Because that output is in CSV format, it’s easy to write scripts to transform it into other formats. The D3.js visualizations we’ve been using are based on the Zoomable Circle Packing algorithm.[17] Because D3.js is data-driven, you can ignore most details and treat the visualization as a black box. You’ll find that it’s surprisingly easy to experiment with.
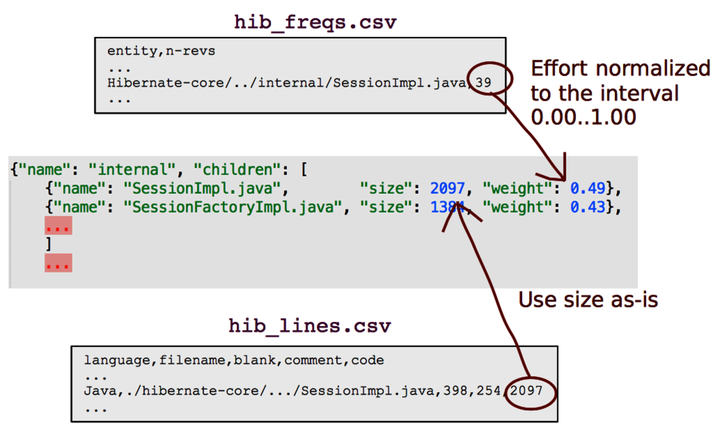
The D3.js circle-packing algorithm expects a JSON document. That means you’ll have to convert from CSV to JSON and feed the resulting data into D3.js. I’ve included a script for the conversion in the Code Maat distribution you’ve downloaded. (It’s the script used to create the visualizations in this chapter.) Run it with the -h flag as python csv_as_enclosure_json.py -h to get a usage description.
Try it out. Visualizing data is fun!