Table of Contents for
Your Code as a Crime Scene
 Your Code as a Crime Scene
Published by
Pragmatic Bookshelf, 2015
Your Code as a Crime Scene
Published by
Pragmatic Bookshelf, 2015
- Title Page
- Your Code as a Crime Scene
- Your Code as a Crime Scene
- For the Best Reading Experience...
- Table of Contents
- Early praise for Your Code as a Crime Scene
- Foreword by Michael Feathers
- Acknowledgments
- Chapter 1: Welcome!
- About This Book
- Optimize for Understanding
- How to Read This Book
- Toward a New Approach
- Get Your Investigative Tools
- Part 1: Evolving Software
- Chapter 2: Code as a Crime Scene
- Meet the Problems of Scale
- Get a Crash Course in Offender Profiling
- Profiling the Ripper
- Apply Geographical Offender Profiling to Code
- Learn from the Spatial Movement of Programmers
- Find Your Own Hotspots
- Chapter 3: Creating an Offender Profile
- Mining Evolutionary Data
- Automated Mining with Code Maat
- Add the Complexity Dimension
- Merge Complexity and Effort
- Limitations of the Hotspot Criteria
- Use Hotspots as a Guide
- Dig Deeper
- Chapter 4: Analyze Hotspots in Large-Scale Systems
- Analyze a Large Codebase
- Visualize Hotspots
- Explore the Visualization
- Study the Distribution of Hotspots
- Differentiate Between True Problems and False Positives
- Chapter 5: Judge Hotspots with the Power of Names
- Know the Cognitive Advantages of Good Names
- Investigate a Hotspot by Its Name
- Understand the Limitations of Heuristics
- Chapter 6: Calculate Complexity Trends from Your Code’s Shape
- Complexity by the Visual Shape of Programs
- Learn About the Negative Space in Code
- Analyze Complexity Trends in Hotspots
- Evaluate the Growth Patterns
- From Individual Hotspots to Architectures
- Part 2: Dissect Your Architecture
- Chapter 7: Treat Your Code As a Cooperative Witness
- Know How Your Brain Deceives You
- Learn the Modus Operandi of a Code Change
- Use Temporal Coupling to Reduce Bias
- Prepare to Analyze Temporal Coupling
- Chapter 8: Detect Architectural Decay
- Support Your Redesigns with Data
- Analyze Temporal Coupling
- Catch Architectural Decay
- React to Structural Trends
- Scale to System Architectures
- Chapter 9: Build a Safety Net for Your Architecture
- Know What’s in an Architecture
- Analyze the Evolution on a System Level
- Differentiate Between the Level of Tests
- Create a Safety Net for Your Automated Tests
- Know the Costs of Automation Gone Wrong
- Chapter 10: Use Beauty as a Guiding Principle
- Learn Why Attractiveness Matters
- Write Beautiful Code
- Avoid Surprises in Your Architecture
- Analyze Layered Architectures
- Find Surprising Change Patterns
- Expand Your Analyses
- Part 3: Master the Social Aspects of Code
- Chapter 11: Norms, Groups, and False Serial Killers
- Learn Why the Right People Don’t Speak Up
- Understand Pluralistic Ignorance
- Witness Groupthink in Action
- Discover Your Team’s Modus Operandi
- Mine Organizational Metrics from Code
- Chapter 12: Discover Organizational Metrics in Your Codebase
- Let’s Work in the Communication Business
- Find the Social Problems of Scale
- Measure Temporal Coupling over Organizational Boundaries
- Evaluate Communication Costs
- Take It Step by Step
- Chapter 13: Build a Knowledge Map of Your System
- Know Your Knowledge Distribution
- Grow Your Mental Maps
- Investigate Knowledge in the Scala Repository
- Visualize Knowledge Loss
- Get More Details with Code Churn
- Chapter 14: Dive Deeper with Code Churn
- Cure the Disease, Not the Symptoms
- Discover Your Process Loss from Code
- Investigate the Disposal Sites of Killers and Code
- Predict Defects
- Time to Move On
- Chapter 15: Toward the Future
- Let Your Questions Guide Your Analysis
- Take Other Approaches
- Let’s Look into the Future
- Write to Evolve
- Appendix 1: Refactoring Hotspots
- Refactor Guided by Names
- Bibliography
- You May Be Interested In…
Grow Your Mental Maps
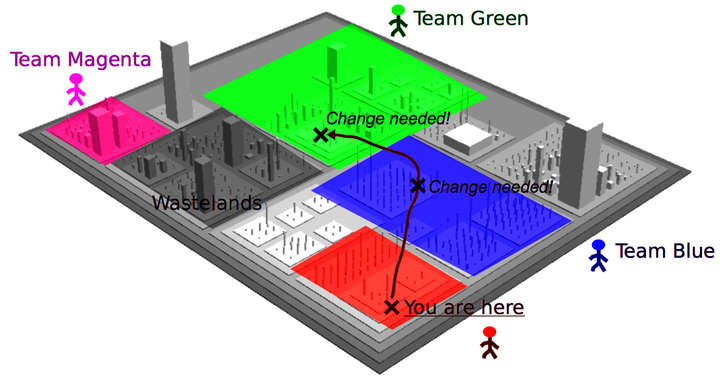
Remember how we discussed geographical offender profiling back in Learn Geographical Profiling of Crimes? We built our hotspot analyses based on the idea that just as we spot patterns in the movement of criminals, our version-control data lets us identify patterns in the changes we make to the codebase. What I didn’t mention back then is that the movement of offenders is constrained by a concept called mental maps.
A mental map is our subjective view of a specific geographic area. Our mental maps deviate from how a real map would look. For example, geographical hindrances such as highways and rivers often constrain and skew our perception of an area. In the small town where I grew up, it took me years to venture across the heavily trafficked road that cut through the city. As a consequence, my mental map ended at that the street. It was the edge of the world. Similarly, the mental maps of criminals shape where their crimes take place.
We programmers have mental maps, too. Over time, at least when we work with others, we tend to specialize and get to know some parts of the system better than others. These knowledge barriers shape our perception of the system—our mental maps constrain our view of the system to the parts we know. Let’s see how we can tear them down.
Explore Your Knowledge Map
Imagine for a moment that you had a map of the individual knowledge distribution in your organization. No, no—not some out-of-date Excel file that’s stashed away on the intranet. To be useful, the information has to be based on how we actually work. In reality, in code.
The concept we’ll develop is a knowledge map. A knowledge map lets you find the right people to discuss a piece of code, fix hotspots, and help out with debugging. Let’s see how the end result looks in the figure, so we know where we’re heading.
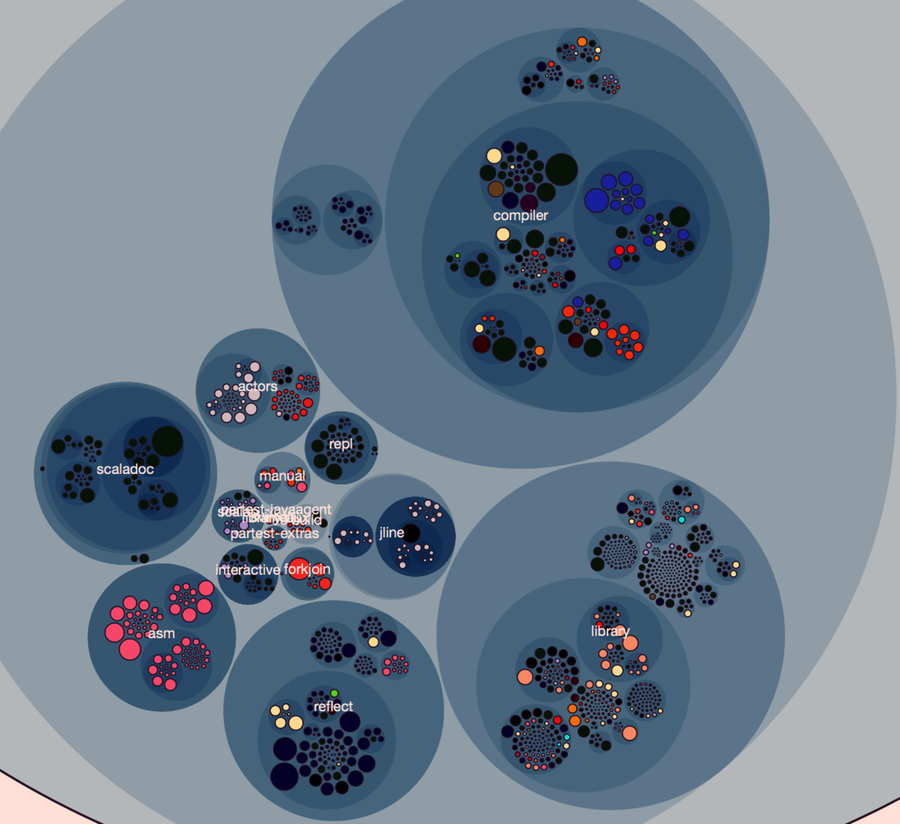
Figure 1. Knowledge map showing the main developer (indicated by color) of each module.
This knowledge map of the programming language Scala is based on the same concept as the fractal figures, as each programmer is assigned a color. This lets us reason about knowledge distribution on a system level. For example, the map shows that components such as scaladoc (generates API documentation), asm (Java bytecode manipulation), and reflect (dynamic type inspection and manipulation) seem to be in the hands of a single developer—there’s little knowledge distribution. In contrast, other components, such as the compiler, exhibit a shared effort, with contributions from multiple developers.
The visualization is based on interactive enclosure diagrams, just like we used back in Visualize Hotspots. Have a look at the visualization samples you downloaded from the Code Maat distribution site.[34] There’s a scala directory inside that bundle. Open a command prompt in that directory and launch Python’s SimpleHTTPServer:
| | prompt> python -m SimpleHTTPServer 8888 |
Now you can point your browser to http://localhost:8888/scala_knowledge.html to view the Scala knowledge map. The interactive visualization lets you zoom in on individual components for a detailed examination. Let’s see what the map tells us about the Scala compiler.
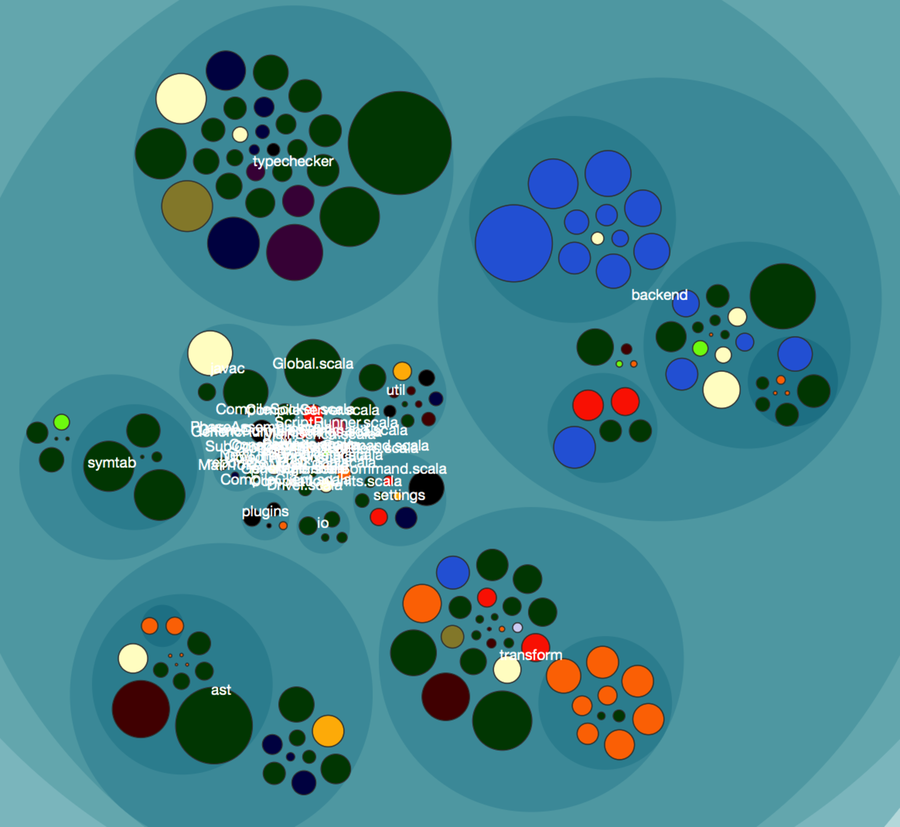
Pretend for a moment that we join this project and need to make a change to the typechecker. Our map immediately points us to the green developer as the correct person to discuss our proposed design with. If we come across some task in the backend instead, green may still be able to help us out, but we’re more likely to get the right expertise if we involve the light-blue developer, too. All right, let’s see how you can create this map.