Table of Contents for
Your Code as a Crime Scene
 Your Code as a Crime Scene
Published by
Pragmatic Bookshelf, 2015
Your Code as a Crime Scene
Published by
Pragmatic Bookshelf, 2015
- Title Page
- Your Code as a Crime Scene
- Your Code as a Crime Scene
- For the Best Reading Experience...
- Table of Contents
- Early praise for Your Code as a Crime Scene
- Foreword by Michael Feathers
- Acknowledgments
- Chapter 1: Welcome!
- About This Book
- Optimize for Understanding
- How to Read This Book
- Toward a New Approach
- Get Your Investigative Tools
- Part 1: Evolving Software
- Chapter 2: Code as a Crime Scene
- Meet the Problems of Scale
- Get a Crash Course in Offender Profiling
- Profiling the Ripper
- Apply Geographical Offender Profiling to Code
- Learn from the Spatial Movement of Programmers
- Find Your Own Hotspots
- Chapter 3: Creating an Offender Profile
- Mining Evolutionary Data
- Automated Mining with Code Maat
- Add the Complexity Dimension
- Merge Complexity and Effort
- Limitations of the Hotspot Criteria
- Use Hotspots as a Guide
- Dig Deeper
- Chapter 4: Analyze Hotspots in Large-Scale Systems
- Analyze a Large Codebase
- Visualize Hotspots
- Explore the Visualization
- Study the Distribution of Hotspots
- Differentiate Between True Problems and False Positives
- Chapter 5: Judge Hotspots with the Power of Names
- Know the Cognitive Advantages of Good Names
- Investigate a Hotspot by Its Name
- Understand the Limitations of Heuristics
- Chapter 6: Calculate Complexity Trends from Your Code’s Shape
- Complexity by the Visual Shape of Programs
- Learn About the Negative Space in Code
- Analyze Complexity Trends in Hotspots
- Evaluate the Growth Patterns
- From Individual Hotspots to Architectures
- Part 2: Dissect Your Architecture
- Chapter 7: Treat Your Code As a Cooperative Witness
- Know How Your Brain Deceives You
- Learn the Modus Operandi of a Code Change
- Use Temporal Coupling to Reduce Bias
- Prepare to Analyze Temporal Coupling
- Chapter 8: Detect Architectural Decay
- Support Your Redesigns with Data
- Analyze Temporal Coupling
- Catch Architectural Decay
- React to Structural Trends
- Scale to System Architectures
- Chapter 9: Build a Safety Net for Your Architecture
- Know What’s in an Architecture
- Analyze the Evolution on a System Level
- Differentiate Between the Level of Tests
- Create a Safety Net for Your Automated Tests
- Know the Costs of Automation Gone Wrong
- Chapter 10: Use Beauty as a Guiding Principle
- Learn Why Attractiveness Matters
- Write Beautiful Code
- Avoid Surprises in Your Architecture
- Analyze Layered Architectures
- Find Surprising Change Patterns
- Expand Your Analyses
- Part 3: Master the Social Aspects of Code
- Chapter 11: Norms, Groups, and False Serial Killers
- Learn Why the Right People Don’t Speak Up
- Understand Pluralistic Ignorance
- Witness Groupthink in Action
- Discover Your Team’s Modus Operandi
- Mine Organizational Metrics from Code
- Chapter 12: Discover Organizational Metrics in Your Codebase
- Let’s Work in the Communication Business
- Find the Social Problems of Scale
- Measure Temporal Coupling over Organizational Boundaries
- Evaluate Communication Costs
- Take It Step by Step
- Chapter 13: Build a Knowledge Map of Your System
- Know Your Knowledge Distribution
- Grow Your Mental Maps
- Investigate Knowledge in the Scala Repository
- Visualize Knowledge Loss
- Get More Details with Code Churn
- Chapter 14: Dive Deeper with Code Churn
- Cure the Disease, Not the Symptoms
- Discover Your Process Loss from Code
- Investigate the Disposal Sites of Killers and Code
- Predict Defects
- Time to Move On
- Chapter 15: Toward the Future
- Let Your Questions Guide Your Analysis
- Take Other Approaches
- Let’s Look into the Future
- Write to Evolve
- Appendix 1: Refactoring Hotspots
- Refactor Guided by Names
- Bibliography
- You May Be Interested In…
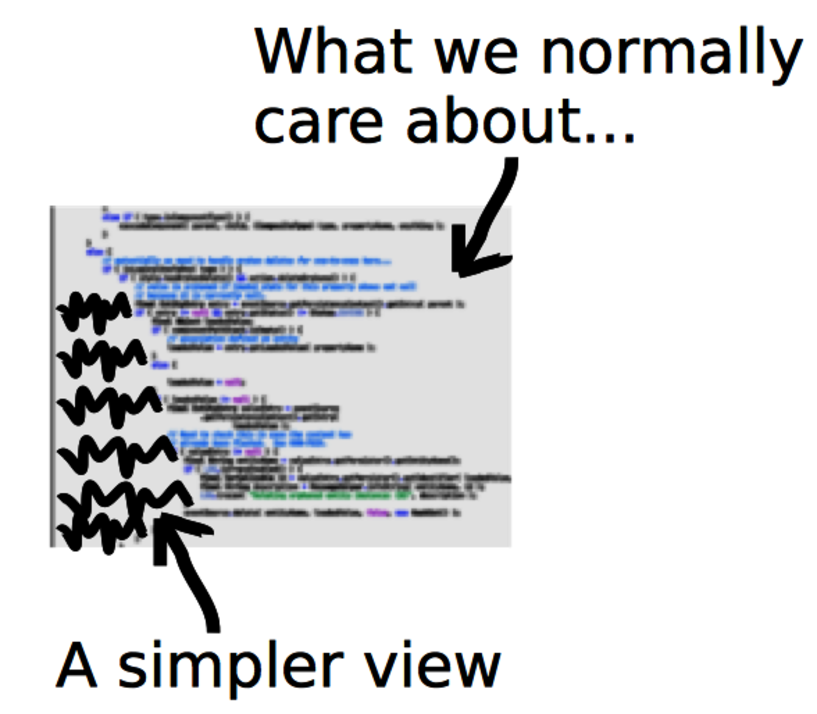
Learn About the Negative Space in Code
Virtually all programming languages use whitespace as indentation to improve readability. (Even Brainf***[19] programs seem to use it, despite the goal implied by the language’s name.) Indentation correlates with the code’s shape. So instead of focusing on the code itself, we’ll look at what’s not there, the negative space. We’ll use indentation as a proxy for complexity.
The idea of indentation as a proxy for complexity is backed by research. (See the research in Reading Beside the Lines: Indentation as a Proxy for Complexity Metric. Program Comprehension, 2008. ICPC 2008. The 16th IEEE International Conference on [HGH08].) It’s a simple metric, yet it correlates with more elaborate metrics, such as McCabe cyclomatic complexity and Halstead complexity measures.
The main advantage to a whitespace analysis is that it’s easy to automate. It’s also fast and language-independent. Even though different languages result in different shapes, the concept works just as well on Java as it does on Clojure or C.
However, there is a cost: some constructs are nontrivial despite looking flat. (List comprehensions[20] come to mind.) But again, measuring software complexity from a static snapshot of the code is not supposed to produce absolute truths. We are looking for hints. Let’s move ahead and see how useful these hints can be.
Whitespace Analysis of Complexity
Back in Check Your Assumptions with Complexity, we identified the Configuration.java class in Hibernate as a potential hotspot. Its name indicates a plain configuration file, but its large size warns it is something more. A complexity measure gives you more clues.
Calculating indentation is trivial: just read a file line by line and count the number of leading spaces and tabs. Let’s use the Python script complexity_analysis.py in the scripts folder of the code you downloaded from the Code Maat distribution page.[21]
The complexity_analysis.py script calculates logical indentation. Four spaces or one tab counts as one logical indentation. Empty and blank lines are ignored.
Open a command prompt in the Hibernate root directory and fire off the following command. Just remember to provide the real path to your own scripts directory:
| | prompt> python scripts/complexity_analysis.py \ |
| | hibernate-core/src/main/java/org/hibernate/cfg/Configuration.java |
| | n,total,mean,sd,max |
| | 3335,8072,2.42,1.63,14 |
Like an X-ray, these statistics give us a peek into a module to reveal its inner workings. The total column is the accumulated complexity. It’s useful to compare different revisions or modules against each other. (We’ll build on that soon.) The rest of the statistics tell us how that complexity is distributed:
-
The mean column tells us that there’s plenty of complexity, on average 2.42 logical indentations. It’s high but not too bad.
-
The standard deviation sd specifies the variance of the complexity within the module. A low number like we got indicates that most lines have a complexity close to the mean. Again, not too bad.
-
But the max complexity show signs of trouble. A maximum logical indentation level of 14 is high.
A large maximum indentation value means there is a lot of indenting, which essentially means nested conditions. We can expect islands of complexity. It looks as if we’ve found application logic hidden inside a configuration file.
Analyze Code Fragments | |
|---|---|
|
|
Another promising application is to analyze differences between code revisions. An indentation measure doesn’t require a valid program—it works just fine on partial programs, too. That means we can analyze the complexity delta in each changed line of code. If we do that for each revision in our analysis period, we can detect trends in the modifications we make. This usage is a way to measure modification effort. A low effort is the essence of good design. |
When you find excess complexity, you have a clear candiate for refactoring. Before you begin refactoring, you may want to check out the module’s complexity trend. Let’s apply our whitespace analysis to historical data and track trends in the hotspot.

Since the dawn of computing, our industry has tried to simplify programming. Visual programming is one such approach. Instead of typing cryptic commands in text, what if we could just draw some shapes, press a button, and have the computer generate the program? Wouldn’t that simplify programming? Indeed it would. But not in the way the idea is sold, nor in a way that matters.
Visual programming might make small tasks easier, but it breaks down quickly for larger problems. (The Influence of the Psychology of Programming on a Language Design [PM00] has a good overview of the research.) The thing is, it’s the larger problems that would benefit from simplifying the process—small tasks generally aren’t that complex. This is a strong argument against visual programming languages. It also explains why demonstrations of visual programming tools look so convincing—demo programs are small by nature.
Expressions also don’t scale very well. A visual symbol represents one thing. We can assign more meanings to it by having the symbol depend on context. (Natural languages have tried this—hieroglyphs show the limitations of the system.) Contrast this with text where you’re free to express virtually any concept.
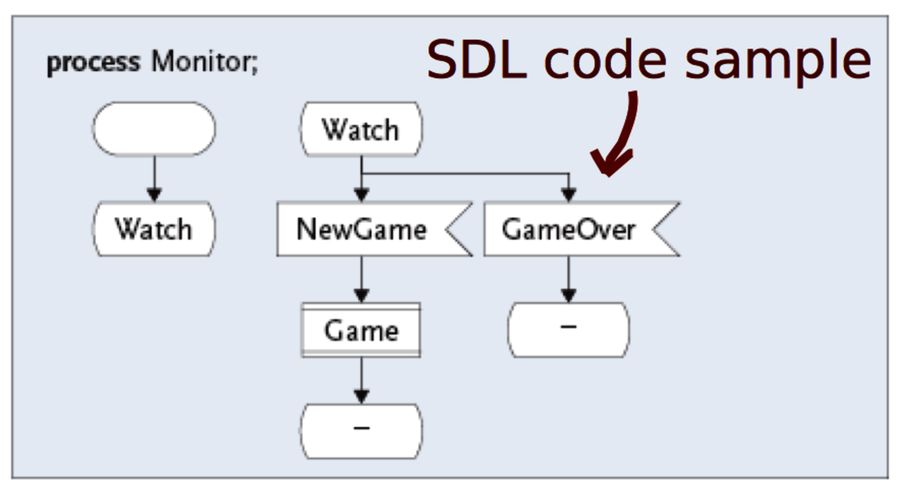
I became painfully aware of the limitations of visual programming when I rewrote in C++ a system created in the graphical Specification and Description Language (SDL). What took four screens of SDL was transformed into just a few lines of high-level C++.