Table of Contents for
Your Code as a Crime Scene
 Your Code as a Crime Scene
Published by
Pragmatic Bookshelf, 2015
Your Code as a Crime Scene
Published by
Pragmatic Bookshelf, 2015
- Title Page
- Your Code as a Crime Scene
- Your Code as a Crime Scene
- For the Best Reading Experience...
- Table of Contents
- Early praise for Your Code as a Crime Scene
- Foreword by Michael Feathers
- Acknowledgments
- Chapter 1: Welcome!
- About This Book
- Optimize for Understanding
- How to Read This Book
- Toward a New Approach
- Get Your Investigative Tools
- Part 1: Evolving Software
- Chapter 2: Code as a Crime Scene
- Meet the Problems of Scale
- Get a Crash Course in Offender Profiling
- Profiling the Ripper
- Apply Geographical Offender Profiling to Code
- Learn from the Spatial Movement of Programmers
- Find Your Own Hotspots
- Chapter 3: Creating an Offender Profile
- Mining Evolutionary Data
- Automated Mining with Code Maat
- Add the Complexity Dimension
- Merge Complexity and Effort
- Limitations of the Hotspot Criteria
- Use Hotspots as a Guide
- Dig Deeper
- Chapter 4: Analyze Hotspots in Large-Scale Systems
- Analyze a Large Codebase
- Visualize Hotspots
- Explore the Visualization
- Study the Distribution of Hotspots
- Differentiate Between True Problems and False Positives
- Chapter 5: Judge Hotspots with the Power of Names
- Know the Cognitive Advantages of Good Names
- Investigate a Hotspot by Its Name
- Understand the Limitations of Heuristics
- Chapter 6: Calculate Complexity Trends from Your Code’s Shape
- Complexity by the Visual Shape of Programs
- Learn About the Negative Space in Code
- Analyze Complexity Trends in Hotspots
- Evaluate the Growth Patterns
- From Individual Hotspots to Architectures
- Part 2: Dissect Your Architecture
- Chapter 7: Treat Your Code As a Cooperative Witness
- Know How Your Brain Deceives You
- Learn the Modus Operandi of a Code Change
- Use Temporal Coupling to Reduce Bias
- Prepare to Analyze Temporal Coupling
- Chapter 8: Detect Architectural Decay
- Support Your Redesigns with Data
- Analyze Temporal Coupling
- Catch Architectural Decay
- React to Structural Trends
- Scale to System Architectures
- Chapter 9: Build a Safety Net for Your Architecture
- Know What’s in an Architecture
- Analyze the Evolution on a System Level
- Differentiate Between the Level of Tests
- Create a Safety Net for Your Automated Tests
- Know the Costs of Automation Gone Wrong
- Chapter 10: Use Beauty as a Guiding Principle
- Learn Why Attractiveness Matters
- Write Beautiful Code
- Avoid Surprises in Your Architecture
- Analyze Layered Architectures
- Find Surprising Change Patterns
- Expand Your Analyses
- Part 3: Master the Social Aspects of Code
- Chapter 11: Norms, Groups, and False Serial Killers
- Learn Why the Right People Don’t Speak Up
- Understand Pluralistic Ignorance
- Witness Groupthink in Action
- Discover Your Team’s Modus Operandi
- Mine Organizational Metrics from Code
- Chapter 12: Discover Organizational Metrics in Your Codebase
- Let’s Work in the Communication Business
- Find the Social Problems of Scale
- Measure Temporal Coupling over Organizational Boundaries
- Evaluate Communication Costs
- Take It Step by Step
- Chapter 13: Build a Knowledge Map of Your System
- Know Your Knowledge Distribution
- Grow Your Mental Maps
- Investigate Knowledge in the Scala Repository
- Visualize Knowledge Loss
- Get More Details with Code Churn
- Chapter 14: Dive Deeper with Code Churn
- Cure the Disease, Not the Symptoms
- Discover Your Process Loss from Code
- Investigate the Disposal Sites of Killers and Code
- Predict Defects
- Time to Move On
- Chapter 15: Toward the Future
- Let Your Questions Guide Your Analysis
- Take Other Approaches
- Let’s Look into the Future
- Write to Evolve
- Appendix 1: Refactoring Hotspots
- Refactor Guided by Names
- Bibliography
- You May Be Interested In…
Analyze the Evolution on a System Level
You’ve already learned to analyze temporal coupling between individual modules. Now we’re raising the abstraction level to focus on system boundaries. We start with just two boundaries: the production code and the test code.
Specify Your Architectural Boundaries
The first step is to define application code and test code. In Code Maat, which we’re returning to for this analysis, the definition is simple: everything under the src/code_maat directory is application code, and everything located in test/code_maat is test code.
Once we’ve located the architectural boundaries, we need to tell Code Maat about them. We do that by specifying a transformation. Open a text editor and type in the following text:
| | src/code_maat => Code |
| | test/code_maat => Test |
The text specifies how Code Maat translates files within physical directories to logical names. You can see an example of how individual modifications get grouped in the following figure.
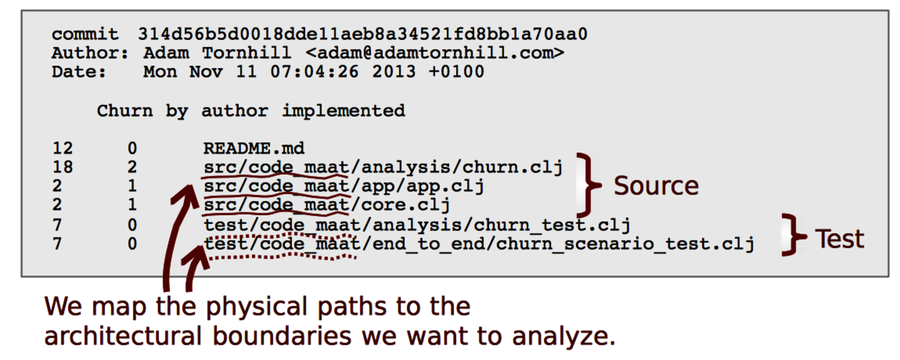
Save your transformations in a file named maat_src_test_boundaries.txt and store it in your Code Maat repository root. You’re now ready to analyze.
We perform an architectural analysis with the same set of commands we’ve been using all along. The only difference is that we must specify the transformation file to use. We do that with the -g flag:
| | prompt> maat -l maat_evo.log -c git -a coupling -g maat_src_test_boundaries.txt |
| | entity,coupled,degree,average-revs |
| | Code,Test,80,65 |
The analysis results are delivered in the same format used in the previous chapter. But this time Code Maat categorizes every modified file into either Code or Test before it performs the analysis.
The results indicate that our logical parts Code and Test have a high degree of temporal coupling. This might be a concern. Are we getting ourselves into an automated-test death march where we spend more time keeping tests up to date than evolving the system? We cannot tell from the numbers alone. So let’s look at the factors we need to consider to interpret the analysis result.
Interpret the Analysis Result
Our analysis results tells us that in 80 percent of all code changes we make, we need to modify some test code as well. The results don’t tell us how much we have to change, how deep those changes go, or what kind of changes we need. Instead, we get the overall change pattern. To interpret it, we need to know the context of our product:
-
What’s the test strategy?
-
Which type of tests are automated?
-
On what level do we automate tests?
Let’s see how Code Maat answers those questions.
As you can see in the test coverage figure, we try to automate as much as we can in Code Maat.
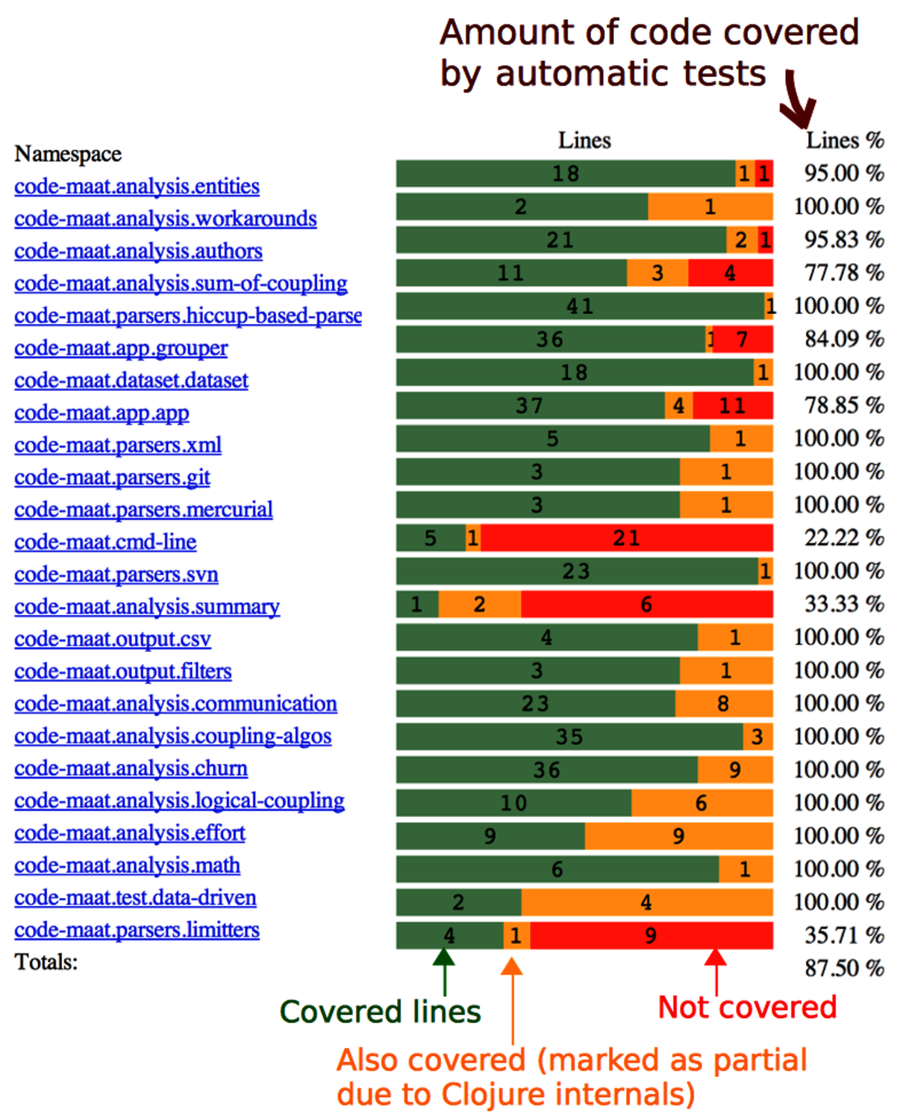
Code Maat has a fairly high code coverage (that is, if we ignore the embarrassing, low-coverage modules such as code-maat.cmd-line and code-maat.analysis.summary that I wish I’d written tests for before I published this data). That coverage has a price. It means our tests have many reasons to change. Here’s why.