Table of Contents for
Kali Linux 2 – Assuring Security by Penetration Testing - Third Edition
 Kali Linux 2 – Assuring Security by Penetration Testing - Third Edition
Published by
Packt Publishing, 2016
Kali Linux 2 – Assuring Security by Penetration Testing - Third Edition
Published by
Packt Publishing, 2016
- Cover
- Table of Contents
- Kali Linux 2 – Assuring Security by Penetration Testing Third Edition
- Kali Linux 2 – Assuring Security by Penetration Testing Third Edition
- Credits
- Disclaimer
- About the Authors
- About the Reviewer
- www.PacktPub.com
- Preface
- What you need for this book
- Who this book is for
- Conventions
- Reader feedback
- Customer support
- 1. Beginning with Kali Linux
- Kali Linux tool categories
- Downloading Kali Linux
- Using Kali Linux
- Configuring the virtual machine
- Updating Kali Linux
- Network services in Kali Linux
- Installing a vulnerable server
- Installing additional weapons
- Summary
- 2. Penetration Testing Methodology
- Vulnerability assessment versus penetration testing
- Security testing methodologies
- General penetration testing framework
- Information gathering
- The ethics
- Summary
- 3. Target Scoping
- Preparing the test plan
- Profiling test boundaries
- Defining business objectives
- Project management and scheduling
- Summary
- 4. Information Gathering
- Using public resources
- Querying the domain registration information
- Analyzing the DNS records
- Getting network routing information
- Utilizing the search engine
- Metagoofil
- Accessing leaked information
- Summary
- 5. Target Discovery
- Identifying the target machine
- OS fingerprinting
- Summary
- 6. Enumerating Target
- Understanding the TCP/IP protocol
- Understanding the TCP and UDP message format
- The network scanner
- Unicornscan
- Zenmap
- Amap
- SMB enumeration
- SNMP enumeration
- VPN enumeration
- Summary
- 7. Vulnerability Mapping
- Vulnerability taxonomy
- Automated vulnerability scanning
- Network vulnerability scanning
- Web application analysis
- Fuzz analysis
- Database assessment tools
- Summary
- 8. Social Engineering
- Attack process
- Attack methods
- Social Engineering Toolkit
- Summary
- 9. Target Exploitation
- Vulnerability and exploit repositories
- Advanced exploitation toolkit
- MSFConsole
- MSFCLI
- Ninja 101 drills
- Writing exploit modules
- Summary
- 10. Privilege Escalation
- Password attack tools
- Network spoofing tools
- Network sniffers
- Summary
- 11. Maintaining Access
- Working with tunneling tools
- Creating web backdoors
- Summary
- 12. Wireless Penetration Testing
- Wireless network recon
- Wireless testing tools
- Post cracking
- Sniffing wireless traffic
- Summary
- 13. Kali Nethunter
- Installing Kali Nethunter
- Nethunter icons
- Nethunter tools
- Third-party applications
- Wireless attacks
- HID attacks
- Summary
- 14. Documentation and Reporting
- Types of reports
- The executive report
- The management report
- The technical report
- Network penetration testing report (sample contents)
- Preparing your presentation
- Post-testing procedures
- Summary
- A. Supplementary Tools
- Web application tools
- Network tool
- Summary
- B. Key Resources
- Paid incentive programs
- Reverse engineering resources
- Penetration testing learning resources
- Exploit development learning resources
- Penetration testing on a vulnerable environment
- Online web application challenges
- Virtual machines and ISO images
- Network ports
- Index
A network sniffer is a software program or a hardware device that is capable of monitoring the network data. It is usually used to examine the network traffic by copying the data without altering the content. With a network sniffer, you can see what information is available in your network.
Previously, network sniffers were used by network engineers to help them solve network problems, but it can also be used for malicious purposes. If your network data is not encrypted and your network uses a hub to connect all the computers, it is very easy to capture your network traffic, such as your username, password, and e-mail content. Fortunately, things become a little bit complex if your network is using a switch, but your data can still be captured.
There are many tools that can be used as network sniffers. In this section, we will describe some of those which are included in Kali Linux. You may want to do network spoofing (refer to the Network spoofing tools section) first because it is often a requirement to conduct a successful sniffing operation.
The dsniff tool can be used to capture the passwords available in the network. Currently, it can capture passwords from the following protocols: FTP, Telnet, SMTP, HTTP, POP, poppass, NNTP, IMAP, SNMP, LDAP, Rlogin, RIP, OSPF, PPTP MS-CHAP, NFS, VRRP, YP/NIS, SOCKS, X11, CVS, IRC, AIM, ICQ, Napster, PostgreSQL, Meeting Maker, Citrix ICA, Symantec pcAnywhere, NAI Sniffer, Microsoft SMB, Oracle SQL*Net, Sybase, and Microsoft SQL protocols.
To start dsniff, use the console to execute the following command:
# dsniff -h
This will display the dsniff usage instructions on your screen. In our exercise, we will capture an FTP password. The FTP client IP address is 192.168.2.20 and the FTP server IP address is 192.168.2.22, and they are connected by a network hub. The attacker machine has the IP address of 192.168.2.21.
Start dsniff in the attacker machine by giving the following command:
# dsniff -i eth0 -m
The -i eth0 option will make dsniff listen to the eth0 network interface and the -m option will enable automatic protocol detection.
In another machine, open the FTP client and connect to the FTP server by entering the username and password.
The following is the result of dsniff:
dsniff: listening on eth0
-----------------
20/08/13 18:54:53 tcp 192.168.2.20.36761 -> 192.168.2.22.21 (ftp)
USER user
PASS user01
You will notice that the username and password entered to connect to the FTP server can be captured by dsniff.
The tcpdump network sniffer is used to dump the packet contents on a network interface that matches the expression. If you don't give the expression, it will display all the packets, but if you give it an expression, it will only dump the packet that matches the expression.
The tcpdump network sniffer can also save the packet data to a file, and it reads the packet data from a file too.
To start tcpdump, you need to use the console to execute the following command:
# tcpdump –i eth0 –s 96
This command will listen on the eth0 network interface (-i eth0) and capture the packet in a size of 96 bytes (-s 96).
Let's try to sniff an ICMP packet from a machine with an IP address of 172.16.43.156 to a machine with an IP address of 172.16.43.150. We sniff on the eth0 interface (-i eth0), don't convert address to names (-n), don't print timestamp (-t), print packet headers and data in hex and ASCII (-X), and set the snaplen value to 64 (-s). The command we use in the machine 172.16.43.150 is as follows:
# tcpdump -n -t -X -i eth0 –s 64 icmp and src 172.16.43.156 and dst 172.16.43.150
The following screenshot shows the result of this command:
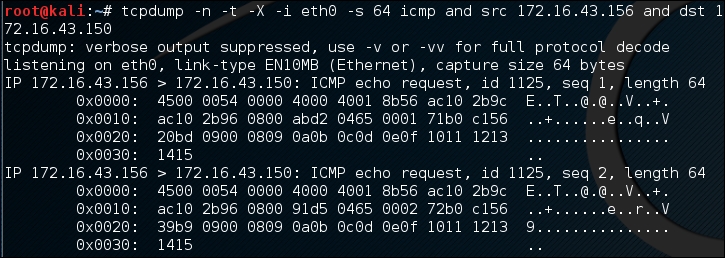
The tcpdump network sniffer will only display the packets that match the given expression. In this case, we only want to display the ICMP packet from the machine with an IP address of 172.16.43.156 to the machine with an IP address of 172.16.43.150.
Wireshark is a network protocol analyzer. The user interface allows the user to understand the information contained in the network packets captured more easily.
Following are several Wireshark features:
- Supports more than 1,000 protocols
- Ability to do live capture and offline analysis
- Has the most powerful display filters in the industry
- Captured network data can be displayed via GUI or via a command-line TShark tool
- Able to read/write many different capture file formats, such as tcpdump (libpcap), Network General Sniffer, Cisco Secure IDS iplog, Microsoft Network Monitor, and others
- Live data can be read from IEEE 802.11, Bluetooth, and Ethernet
- The output can be exported to XML, Postscript, CSV, and plaintext
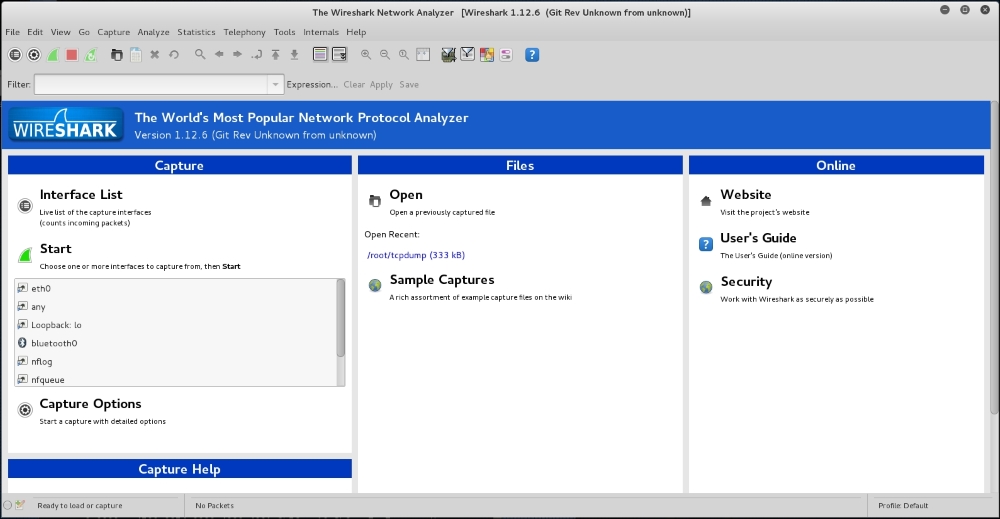
To start Wireshark, go to Applications | Sniffing/Spoofing | wireshark, or use the console to execute the following command:
# wireshark
This will start the Wireshark network protocol analyzer. To start live capture, click on the network interface on which you want to capture network data in Interface List:
If there is network traffic, the packets will be displayed in the Wireshark window. To stop the capture, you can click on the fourth icon on the top, entitled Stop running the live capture, or you can navigate to Capture | Stop in the menu.
To only display particular packets, you can set the display filter:
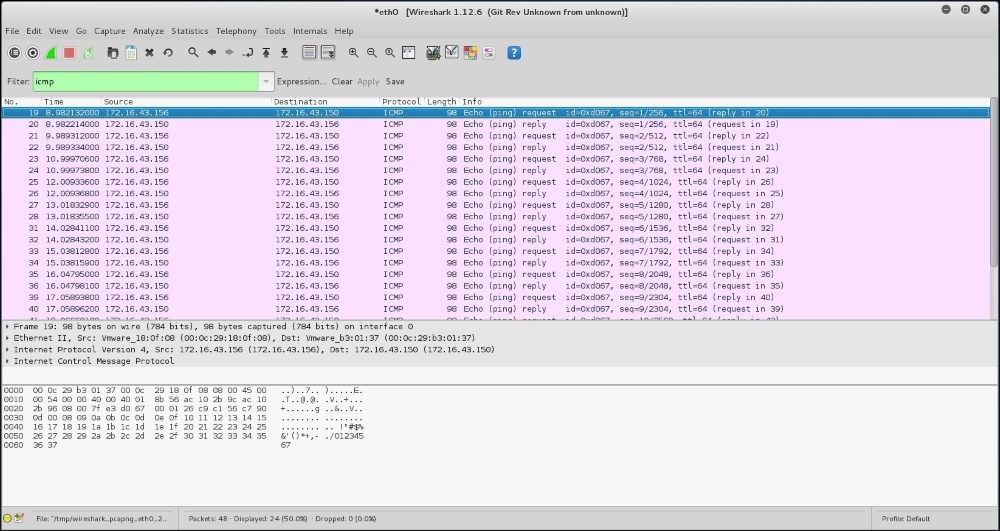
In the preceding screenshot, we only want to see the ICMP packets, so we enter icmp in the display filter.
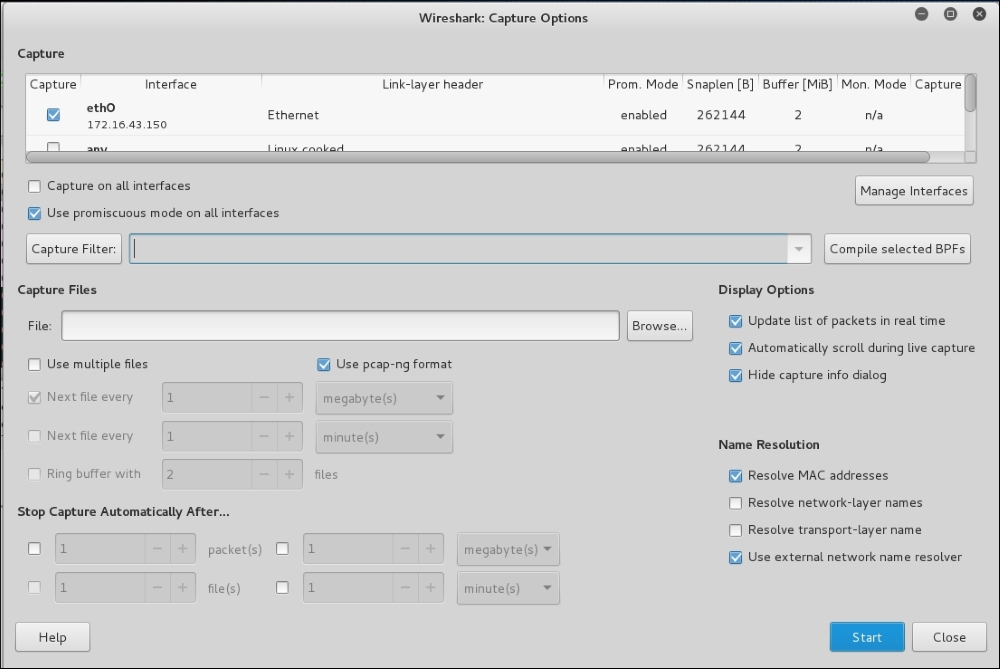
If you want to customize your capture, you can change the options from the menu by navigating to Capture | Options or select the Capture Options from the Wireshark home page.
In this menu, you can change several things, such as the following:
- Network interface
- Buffer size: By default, it is 1 MB
- Packet limitation (in bytes): In the default option, there is no limitation
- Capture filter to be used: The default value does not use any capture filters
If you want to save the captured data, you need to set the output file in the Capture File(s) section.
The Stop Capture section is used to define the condition when your capture process will be stopped. It can be set based on the number of packets, packet size, and capture duration.
In the Name Resolution section, you can define whether Wireshark will do the name resolution for MAC, network name, and transport name: