Table of Contents for
Kali Linux 2 – Assuring Security by Penetration Testing - Third Edition
 Kali Linux 2 – Assuring Security by Penetration Testing - Third Edition
Published by
Packt Publishing, 2016
Kali Linux 2 – Assuring Security by Penetration Testing - Third Edition
Published by
Packt Publishing, 2016
- Cover
- Table of Contents
- Kali Linux 2 – Assuring Security by Penetration Testing Third Edition
- Kali Linux 2 – Assuring Security by Penetration Testing Third Edition
- Credits
- Disclaimer
- About the Authors
- About the Reviewer
- www.PacktPub.com
- Preface
- What you need for this book
- Who this book is for
- Conventions
- Reader feedback
- Customer support
- 1. Beginning with Kali Linux
- Kali Linux tool categories
- Downloading Kali Linux
- Using Kali Linux
- Configuring the virtual machine
- Updating Kali Linux
- Network services in Kali Linux
- Installing a vulnerable server
- Installing additional weapons
- Summary
- 2. Penetration Testing Methodology
- Vulnerability assessment versus penetration testing
- Security testing methodologies
- General penetration testing framework
- Information gathering
- The ethics
- Summary
- 3. Target Scoping
- Preparing the test plan
- Profiling test boundaries
- Defining business objectives
- Project management and scheduling
- Summary
- 4. Information Gathering
- Using public resources
- Querying the domain registration information
- Analyzing the DNS records
- Getting network routing information
- Utilizing the search engine
- Metagoofil
- Accessing leaked information
- Summary
- 5. Target Discovery
- Identifying the target machine
- OS fingerprinting
- Summary
- 6. Enumerating Target
- Understanding the TCP/IP protocol
- Understanding the TCP and UDP message format
- The network scanner
- Unicornscan
- Zenmap
- Amap
- SMB enumeration
- SNMP enumeration
- VPN enumeration
- Summary
- 7. Vulnerability Mapping
- Vulnerability taxonomy
- Automated vulnerability scanning
- Network vulnerability scanning
- Web application analysis
- Fuzz analysis
- Database assessment tools
- Summary
- 8. Social Engineering
- Attack process
- Attack methods
- Social Engineering Toolkit
- Summary
- 9. Target Exploitation
- Vulnerability and exploit repositories
- Advanced exploitation toolkit
- MSFConsole
- MSFCLI
- Ninja 101 drills
- Writing exploit modules
- Summary
- 10. Privilege Escalation
- Password attack tools
- Network spoofing tools
- Network sniffers
- Summary
- 11. Maintaining Access
- Working with tunneling tools
- Creating web backdoors
- Summary
- 12. Wireless Penetration Testing
- Wireless network recon
- Wireless testing tools
- Post cracking
- Sniffing wireless traffic
- Summary
- 13. Kali Nethunter
- Installing Kali Nethunter
- Nethunter icons
- Nethunter tools
- Third-party applications
- Wireless attacks
- HID attacks
- Summary
- 14. Documentation and Reporting
- Types of reports
- The executive report
- The management report
- The technical report
- Network penetration testing report (sample contents)
- Preparing your presentation
- Post-testing procedures
- Summary
- A. Supplementary Tools
- Web application tools
- Network tool
- Summary
- B. Key Resources
- Paid incentive programs
- Reverse engineering resources
- Penetration testing learning resources
- Exploit development learning resources
- Penetration testing on a vulnerable environment
- Online web application challenges
- Virtual machines and ISO images
- Network ports
- Index
Zenmap is the graphical interface of Nmap. The advantages of Zenmap compared to Nmap are as follows:
- Zenmap is interactive; it arranges the scan results in a convenient way. It can even draw a topological map of the discovered network.
- Zenmap can do a comparison between two scans.
- Zenmap keeps a track of the scan results.
- To run the same scan configuration more than once, the penetration tester can use a Zenmap profile.
- Zenmap will always display the command that is run, so the penetration tester can verify that command.
To start Zenmap, navigate to Kali Linux | Information Gathering | Network Scanners | Zenmap, or use the console to execute the following command:
#zenmap
This will display the main Zenmap window. Zenmap comes with 10 profiles that can be chosen. To find which command options are used on each profile, just click on Profile and the command options will be displayed in the Command: box, as shown in the following screenshot:
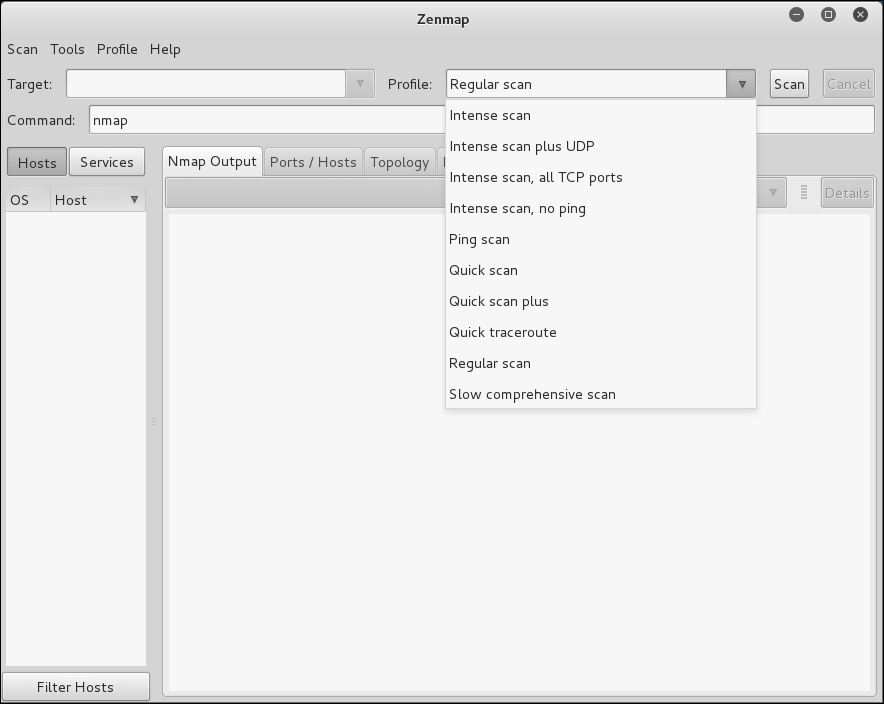
If the provided profiles are not suitable for our needs, we can create our own profile by creating a new profile or editing the existing ones. These tasks can be found under the Profile menu.
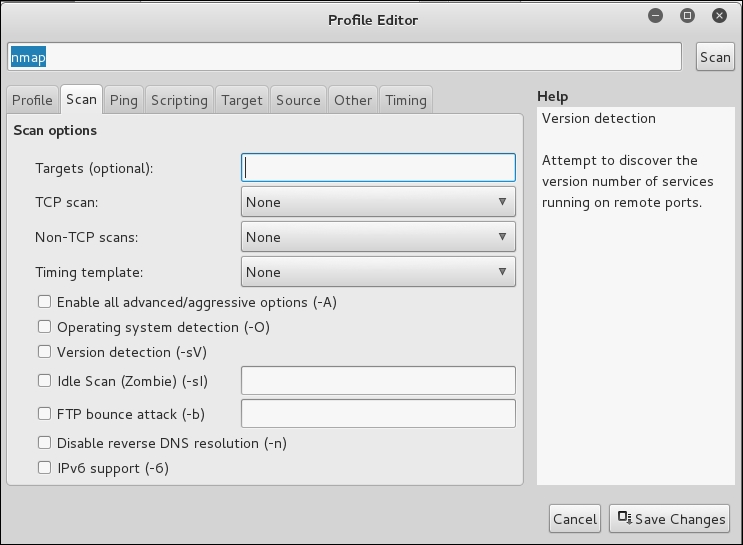
To create a new profile, select the menu New Profile or Command, or you can press the keys Ctrl + P. To edit an existing profile, select the Edit Selected Profile menu or press Ctrl + E.
Select each tab (Profile, Scan, Ping, Scripting, Target, Source, Other, and Timing) and configure it according to your needs. If you have finished configuring the profile, save the profile by clicking on the Save Changes button, as shown in the following screenshot:
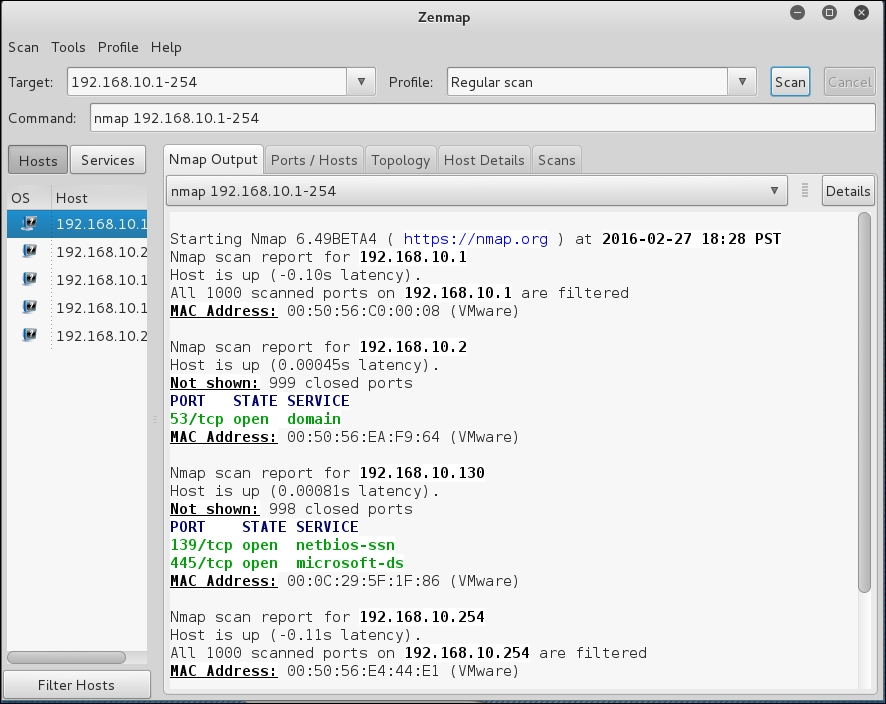
Let's scan the 192.168.10.1-254 host using the Regular scan profile, as shown in the following screenshot:
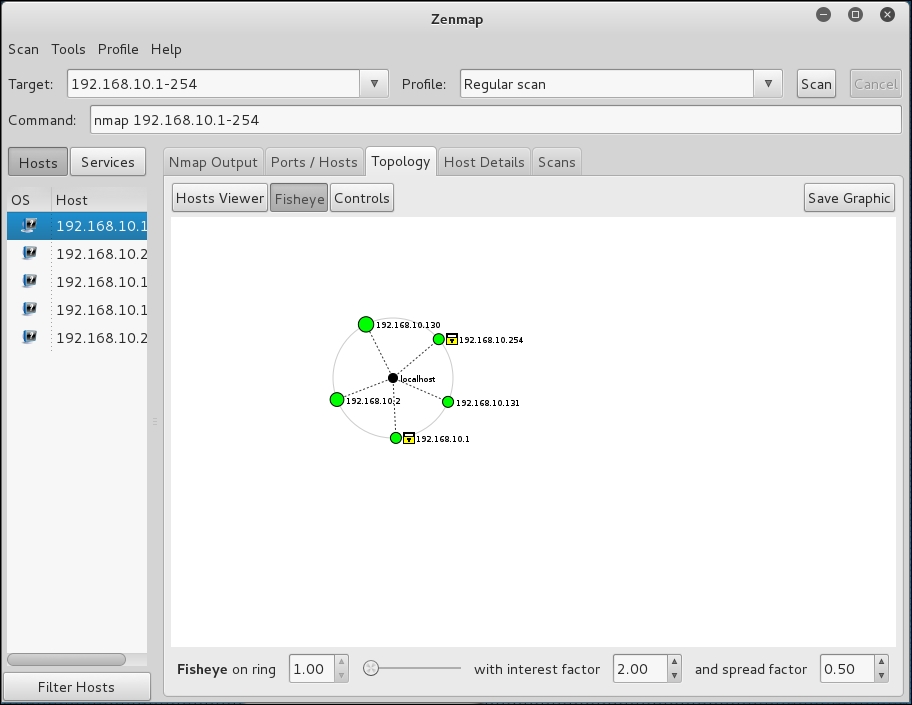
If you want to see the network topology, click on the Topology tab and you will be able to see the details, as shown in the following screenshot:
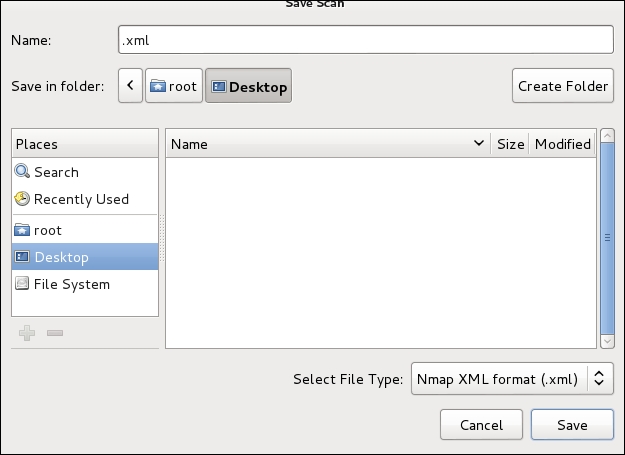
To save the Zenmap result, go to the Scan menu and choose Save Scan. Zenmap will then ask you where you want to save the result. The default format is XML, as shown in the following screenshot:
To find the differences between the scans, perform the first scan and then save the result. Then, make changes to the scan targets. Next, do the second scan and save the result. Later, compare the scan results by going to the Tools menu and selecting Compare Results.
For A Scan, you can select the XML file of the first scan result by clicking on the Open button, while for B Scan, you can select the XML file of the second scan result, as shown in the following screenshot:
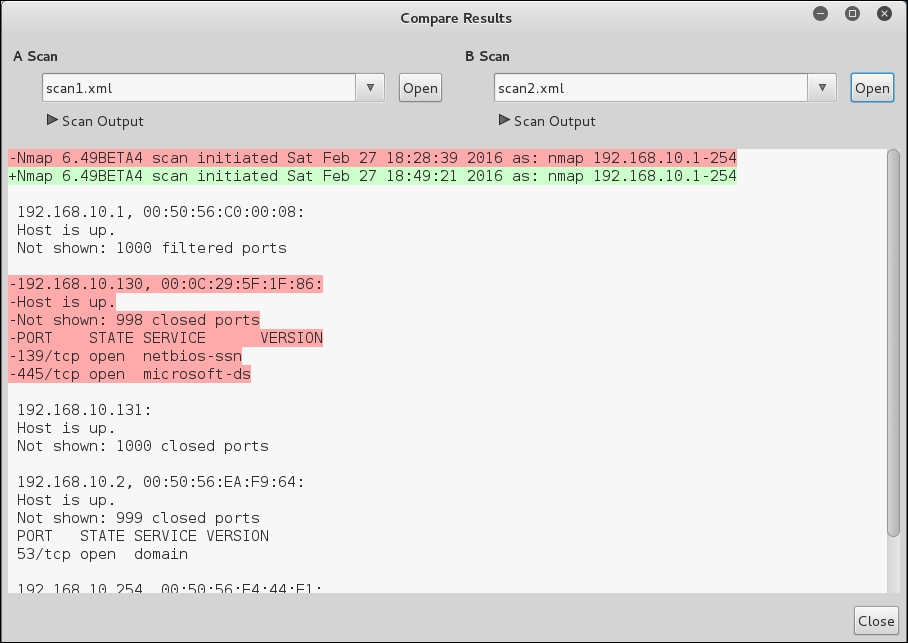
The - character denotes that this line is removed in the B Scan result, while the + character means that this line is added in the B Scan result.
What we notice is that there was an entire host that was visible on the first scan but not the second. This feature also allows the tester to view ports that have been open or closed over time. This is very handy if a target network has a new open port that is indicative of a specific piece of software. This is also handy if you are scanning a large network and want to see if devices have been added or removed.