Table of Contents for
Learning Malware Analysis

Version ebook / Retour

Cover image for bash Cookbook, 2nd Edition Learning Malware Analysis by Monnappa K A Published by Packt Publishing, 2018
  1. Learning Malware Analysis
  2. Title Page
  3. Copyright and Credits
  4. Learning Malware Analysis
  5. Dedication
  6. Packt Upsell
  7. Why subscribe?
  8. PacktPub.com
  9. Contributors
  10. About the author
  11. About the reviewers
  12. Packt is searching for authors like you
  13. Table of Contents
  14. Preface
  15. Who this book is for
  16. What this book covers
  17. To get the most out of this book
  18. Download the color images
  19. Conventions used
  20. Get in touch
  21. Reviews
  22. Introduction to Malware Analysis
  23. 1. What Is Malware?
  24. 2. What Is Malware Analysis?
  25. 3. Why Malware Analysis?
  26. 4. Types Of Malware Analysis
  27. 5. Setting Up The Lab Environment
  28. 5.1 Lab Requirements
  29. 5.2 Overview Of Lab Architecture
  30. 5.3 Setting Up And Configuring Linux VM
  31. 5.4 Setting Up And Configuring Windows VM
  32. 6. Malware Sources
  33. Summary
  34. Static Analysis
  35. 1. Determining the File Type
  36. 1.1 Identifying File Type Using Manual Method
  37. 1.2 Identifying File Type Using Tools
  38. 1.3 Determining File Type Using Python
  39. 2. Fingerprinting the Malware
  40. 2.1 Generating Cryptographic Hash Using Tools
  41. 2.2 Determining Cryptographic Hash in Python
  42. 3. Multiple Anti-Virus Scanning
  43. 3.1 Scanning the Suspect Binary with VirusTotal
  44. 3.2 Querying Hash Values Using VirusTotal Public API
  45. 4. Extracting Strings
  46. 4.1 String Extraction Using Tools
  47. 4.2 Decoding Obfuscated Strings Using FLOSS
  48. 5. Determining File Obfuscation
  49. 5.1 Packers and Cryptors
  50. 5.2 Detecting File Obfuscation Using Exeinfo PE
  51. 6. Inspecting PE Header Information
  52. 6.1 Inspecting File Dependencies and Imports
  53. 6.2  Inspecting Exports
  54. 6.3  Examining PE Section Table And Sections
  55. 6.4 Examining the Compilation Timestamp
  56. 6.5 Examining PE Resources
  57. 7. Comparing And Classifying The Malware
  58. 7.1 Classifying Malware Using Fuzzy Hashing
  59. 7.2 Classifying Malware Using Import Hash
  60. 7.3 Classifying Malware Using Section Hash
  61. 7.4 Classifying Malware Using YARA
  62. 7.4.1 Installing YARA
  63. 7.4.2 YARA Rule Basics
  64. 7.4.3 Running YARA
  65. 7.4.4 Applications of YARA
  66. Summary
  67. Dynamic Analysis
  68. 1. Lab Environment Overview
  69. 2. System And Network Monitoring
  70. 3. Dynamic Analysis (Monitoring) Tools
  71. 3.1 Process Inspection with Process Hacker
  72. 3.2 Determining System Interaction with Process Monitor
  73. 3.3 Logging System Activities Using Noriben
  74. 3.4 Capturing Network Traffic With Wireshark
  75. 3.5 Simulating Services with INetSim
  76. 4. Dynamic Analysis Steps
  77. 5. Putting it All Together: Analyzing a Malware Executable
  78. 5.1 Static Analysis of the Sample
  79. 5.2 Dynamic Analysis of the Sample
  80. 6. Dynamic-Link Library (DLL) Analysis
  81. 6.1 Why Attackers Use DLLs
  82. 6.2 Analyzing the DLL Using rundll32.exe
  83. 6.2.1 Working of rundll32.exe
  84. 6.2.2 Launching the DLL Using rundll32.exe
  85. Example 1 – Analyzing a DLL With No Exports
  86. Example 2 – Analyzing a DLL Containing Exports
  87. Example 3 – Analyzing a DLL Accepting Export Arguments
  88. 6.3 Analyzing a DLL with Process Checks
  89. Summary
  90. Assembly Language and Disassembly Primer
  91. 1. Computer Basics
  92. 1.1 Memory
  93. 1.1.1 How Data Resides In Memory
  94. 1.2 CPU
  95. 1.2.1 Machine Language
  96. 1.3 Program Basics
  97. 1.3.1 Program Compilation
  98. 1.3.2 Program On Disk
  99. 1.3.3 Program In Memory
  100. 1.3.4 Program Disassembly (From Machine code To Assembly code)
  101. 2. CPU Registers
  102. 2.1 General-Purpose Registers
  103. 2.2 Instruction Pointer (EIP)
  104. 2.3 EFLAGS Register
  105. 3. Data Transfer Instructions
  106. 3.1 Moving a Constant Into Register
  107. 3.2 Moving Values From Register To Register
  108. 3.3 Moving Values From Memory To Registers
  109. 3.4 Moving Values From Registers To Memory
  110. 3.5 Disassembly Challenge
  111. 3.6 Disassembly Solution
  112. 4. Arithmetic Operations
  113. 4.1 Disassembly Challenge
  114. 4.2 Disassembly Solution
  115. 5. Bitwise Operations
  116. 6. Branching And Conditionals
  117. 6.1 Unconditional Jumps
  118. 6.2 Conditional Jumps
  119. 6.3 If Statement
  120. 6.4 If-Else Statement
  121. 6.5 If-Elseif-Else Statement
  122. 6.6 Disassembly Challenge
  123. 6.7 Disassembly Solution
  124. 7. Loops
  125. 7.1 Disassembly Challenge
  126. 7.2 Disassembly Solution
  127. 8. Functions
  128. 8.1 Stack
  129. 8.2 Calling Function
  130. 8.3 Returning From Function
  131. 8.4 Function Parameters And Return Values
  132. 9. Arrays And Strings
  133. 9.1 Disassembly Challenge
  134. 9.2 Disassembly Solution
  135. 9.3 Strings
  136. 9.3.1 String Instructions
  137. 9.3.2 Moving From Memory To Memory (movsx)
  138. 9.3.3 Repeat Instructions (rep)
  139. 9.3.4 Storing Value From Register to Memory (stosx)
  140. 9.3.5 Loading From Memory to Register (lodsx)
  141. 9.3.6 Scanning Memory (scasx)
  142. 9.3.7 Comparing Values in Memory (cmpsx)
  143. 10. Structures
  144. 11. x64 Architecture
  145. 11.1 Analyzing 32-bit Executable On 64-bit Windows
  146. 12. Additional Resources
  147. 13. Summary
  148. Disassembly Using IDA
  149. 1. Code Analysis Tools
  150. 2. Static Code Analysis (Disassembly) Using IDA
  151. 2.1 Loading Binary in IDA
  152. 2.2 Exploring IDA Displays
  153. 2.2.1 Disassembly Window
  154. 2.2.2 Functions Window
  155. 2.2.3 Output Window
  156. 2.2.4 Hex View Window
  157. 2.2.5 Structures Window
  158. 2.2.6 Imports Window
  159. 2.2.7 Exports Window
  160. 2.2.8 Strings Window
  161. 2.2.9 Segments Window
  162. 2.3 Improving Disassembly Using IDA
  163. 2.3.1 Renaming Locations
  164. 2.3.2 Commenting in IDA
  165. 2.3.3 IDA Database
  166. 2.3.4 Formatting Operands
  167. 2.3.5 Navigating Locations
  168. 2.3.6 Cross-References
  169. 2.3.7 Listing All Cross-References
  170. 2.3.8 Proximity View And Graphs
  171. 3. Disassembling Windows API
  172. 3.1 Understanding Windows API
  173. 3.1.1 ANSI and Unicode API Functions
  174. 3.1.2 Extended API Functions
  175. 3.2 Windows API 32-Bit and 64-Bit Comparison
  176. 4. Patching Binary Using IDA
  177. 4.1 Patching Program Bytes
  178. 4.2 Patching Instructions
  179. 5. IDA Scripting and Plugins
  180. 5.1 Executing IDA Scripts
  181. 5.2 IDAPython
  182. 5.2.1 Checking The Presence Of CreateFile API
  183. 5.2.2 Code Cross-References to CreateFile Using IDAPython
  184. 5.3 IDA Plugins
  185. 6. Summary
  186. Debugging Malicious Binaries
  187. 1. General Debugging Concepts
  188. 1.1 Launching And Attaching To Processes
  189. 1.2 Controlling Process Execution
  190. 1.3 Interrupting a Program with Breakpoints
  191. 1.4 Tracing Program Execution
  192. 2. Debugging a Binary Using x64dbg
  193. 2.1 Launching a New Process in x64dbg
  194. 2.2 Attaching to an Existing Process Using x64dbg
  195. 2.3 x64dbg Debugger Interface
  196. 2.4 Controlling Process Execution Using x64dbg
  197. 2.5 Setting a Breakpoint in x64dbg
  198. 2.6 Debugging 32-bit Malware
  199. 2.7 Debugging 64-bit Malware
  200. 2.8 Debugging a Malicious DLL Using x64dbg
  201. 2.8.1 Using rundll32.exe to Debug the DLL in x64dbg
  202. 2.8.2 Debugging a DLL in a Specific Process
  203. 2.9 Tracing Execution in x64dbg
  204. 2.9.1 Instruction Tracing
  205. 2.9.2 Function Tracing
  206. 2.10 Patching in x64dbg
  207. 3. Debugging a Binary Using IDA
  208. 3.1 Launching a New Process in IDA
  209. 3.2 Attaching to an Existing Process Using IDA
  210. 3.3 IDA's Debugger Interface
  211. 3.4 Controlling Process Execution Using IDA
  212. 3.5 Setting a Breakpoint in IDA
  213. 3.6 Debugging Malware Executables
  214. 3.7 Debugging a Malicious DLL Using IDA
  215. 3.7.1 Debugging a DLL in a Specific Process
  216. 3.8 Tracing Execution Using IDA
  217. 3.9 Debugger Scripting Using IDAPython
  218. 3.9.1 Example – Determining Files Accessed by Malware
  219. 4. Debugging a .NET Application
  220. Summary
  221. Malware Functionalities and Persistence
  222. 1. Malware Functionalities
  223. 1.1 Downloader
  224. 1.2 Dropper
  225. 1.2.1 Reversing a 64-bit Dropper
  226. 1.3 Keylogger
  227. 1.3.1 Keylogger Using GetAsyncKeyState()
  228. 1.3.2 Keylogger Using SetWindowsHookEx()
  229. 1.4 Malware Replication Via Removable Media
  230. 1.5 Malware Command and Control (C2)
  231. 1.5.1 HTTP Command and Control
  232. 1.5.2 Custom Command and Control
  233. 1.6 PowerShell-Based Execution
  234. 1.6.1 PowerShell Command Basics
  235. 1.6.2 PowerShell Scripts And Execution Policy
  236. 1.6.2 Analyzing PowerShell Commands/Scripts
  237. 1.6.3 How Attackers Use PowerShell
  238. 2. Malware Persistence Methods
  239. 2.1 Running the Registry Key
  240. 2.2 Scheduled Tasks
  241. 2.3 Startup Folder
  242. 2.4 Winlogon Registry Entries
  243. 2.5 Image File Execution Options
  244. 2.6 Accessibility Programs
  245. 2.7 AppInit_DLLs
  246. 2.8 DLL Search Order Hijacking
  247. 2.9 COM hijacking
  248. 2.10 Service
  249. Summary
  250. Code Injection and Hooking
  251. 1. Virtual Memory
  252. 1.1 Process Memory Components (User Space)
  253. 1.2 Kernel Memory Contents (Kernel Space)
  254. 2. User Mode And Kernel Mode
  255. 2.1 Windows API Call Flow
  256. 3. Code Injection Techniques
  257. 3.1 Remote DLL Injection
  258. 3.2 DLL Injection Using APC (APC Injection)
  259. 3.3 DLL Injection Using SetWindowsHookEx()
  260. 3.4 DLL Injection Using The Application Compatibility Shim
  261. 3.4.1 Creating A Shim
  262. 3.4.2 Shim Artifacts
  263. 3.4.3 How Attackers Use Shims
  264. 3.4.4 Analyzing The Shim Database
  265. 3.5 Remote Executable/Shellcode Injection
  266. 3.6 Hollow Process Injection (Process Hollowing)
  267. 4. Hooking Techniques
  268. 4.1 IAT Hooking
  269. 4.2 Inline Hooking (Inline Patching)
  270. 4.3 In-memory Patching Using Shim
  271. 5. Additional Resources
  272. Summary
  273. Malware Obfuscation Techniques
  274. 1. Simple Encoding
  275. 1.1 Caesar Cipher
  276. 1.1.1 Working Of Caesar Cipher
  277. 1.1.2 Decrypting Caesar Cipher In Python
  278. 1.2 Base64 Encoding
  279. 1.2.1 Translating Data To Base64
  280. 1.2.2 Encoding And Decoding Base64
  281. 1.2.3 Decoding Custom Base64
  282. 1.2.4 Identifying Base64
  283. 1.3 XOR Encoding
  284. 1.3.1 Single Byte XOR
  285. 1.3.2 Finding XOR Key Through Brute-Force
  286. 1.3.3 NULL Ignoring XOR Encoding
  287. 1.3.4 Multi-byte XOR Encoding
  288. 1.3.5 Identifying XOR Encoding
  289. 2. Malware Encryption
  290. 2.1 Identifying Crypto Signatures Using Signsrch
  291. 2.2 Detecting Crypto Constants Using FindCrypt2
  292. 2.3 Detecting Crypto Signatures Using YARA
  293. 2.4 Decrypting In Python
  294. 3. Custom Encoding/Encryption
  295. 4. Malware Unpacking
  296. 4.1 Manual Unpacking
  297. 4.1.1 Identifying The OEP
  298. 4.1.2 Dumping Process Memory With Scylla
  299. 4.1.3 Fixing The Import Table
  300. 4.2 Automated Unpacking
  301. Summary
  302. Hunting Malware Using Memory Forensics
  303. 1. Memory Forensics Steps
  304. 2. Memory Acquisition
  305. 2.1 Memory Acquisition Using DumpIt
  306. 3. Volatility Overview
  307. 3.1 Installing Volatility
  308. 3.1.1 Volatility Standalone Executable
  309. 3.1.2 Volatility Source Package
  310. 3.2 Using Volatility
  311. 4. Enumerating Processes
  312. 4.1 Process Overview
  313. 4.1.1 Examining the _EPROCESS Structure
  314. 4.1.2 Understanding ActiveProcessLinks
  315. 4.2 Listing Processes Using psscan
  316. 4.2.1 Direct Kernel Object Manipulation (DKOM)
  317. 4.2.2 Understanding Pool Tag Scanning
  318. 4.3 Determining Process Relationships
  319. 4.4 Process Listing Using psxview
  320. 5. Listing Process Handles
  321. 6. Listing DLLs
  322. 6.1 Detecting a Hidden DLL Using ldrmodules
  323. 7. Dumping an Executable and DLL
  324. 8. Listing Network Connections and Sockets
  325. 9. Inspecting Registry
  326. 10. Investigating Service
  327. 11. Extracting Command History
  328. Summary
  329. Detecting Advanced Malware Using Memory Forensics
  330. 1. Detecting Code Injection
  331. 1.1 Getting VAD Information
  332. 1.2 Detecting Injected Code Using VAD
  333. 1.3 Dumping The Process Memory Region
  334. 1.4 Detecting Injected Code Using malfind
  335. 2. Investigating Hollow Process Injection
  336. 2.1 Hollow Process Injection Steps
  337. 2.2 Detecting Hollow Process Injection
  338. 2.3 Hollow Process Injection Variations
  339. 3. Detecting API Hooks
  340. 4. Kernel Mode Rootkits
  341. 5. Listing Kernel Modules
  342. 5.1 Listing Kernel Modules Using driverscan
  343. 6. I/O Processing
  344. 6.1 The Role Of The Device Driver
  345. 6.2 The Role Of The I/O Manager
  346. 6.3 Communicating With The Device Driver
  347. 6.4 I/O Requests To Layered Drivers
  348. 7. Displaying Device Trees
  349. 8. Detecting Kernel Space Hooking
  350. 8.1 Detecting SSDT Hooking
  351. 8.2 Detecting IDT Hooking
  352. 8.3 Identifying Inline Kernel Hooks
  353. 8.4 Detecting IRP Function Hooks
  354. 9. Kernel Callbacks And Timers
  355. Summary
  356. Other Books You May Enjoy
  357. Leave a review - let other readers know what you think

2.7 Debugging 64-bit Malware

You will use the same technique to debug a 64-bit malware; the difference is, you will be dealing with extended registers, 64-bit memory addresses/pointers, and slightly different calling conventions. If you recall (from Chapter 4Assembly Language and Disassembly Primer), a 64-bit code uses the FASTCALL calling convention and passes the first four parameters to the function in the registers (rcxrdxr8, and r9), and the rest of the parameters are placed on the stack. While debugging the call to a function/API, depending on the parameter you are inspecting, you will have to inspect the register or the stack. The calling convention mentioned previously is applicable to compiler-generated code. An attacker writing code in the assembly language need not follow these rules; as a result, the code can exhibit unusual behavior. When you come across code that is not compiler-generated, a further investigation of the code may be required.

Before we debug a 64-bit malware, let's try to understand the behavior of a 64-bit binary with the following trivial C program, which was compiled for the 64-bit platform using the Microsoft Visual C/C++ compiler:

int main()
{
printf("%d%d%d%d%s%s%s", 1, 2, 3, 4, "this", "is", "test");
return 0;
}

In the preceding program, the printf function takes eight arguments; this program was compiled and opened in x64dbg, and a breakpoint was set at the printf function. The following screenshot shows the program, which is paused before the call to the printf function. In the registers window, you can see that the first four parameters are placed in the rcxrdxr8, and r9 registers. When the program calls a function, the function reserves 0x20 (32 bytes) of space on the stack (space for four items, each 8 bytes in size); this is to make sure that the called function has the necessary space, if it needs to save the register parameters (rcxrdxr8, and r9). This is the reason the next four parameters (the 5th, 6th, 7th, and 8th parameters) are placed on the stack, starting from the fifth item (rsp+0x20). We are showing you this example to give you an idea of how to find the parameters on the stack:

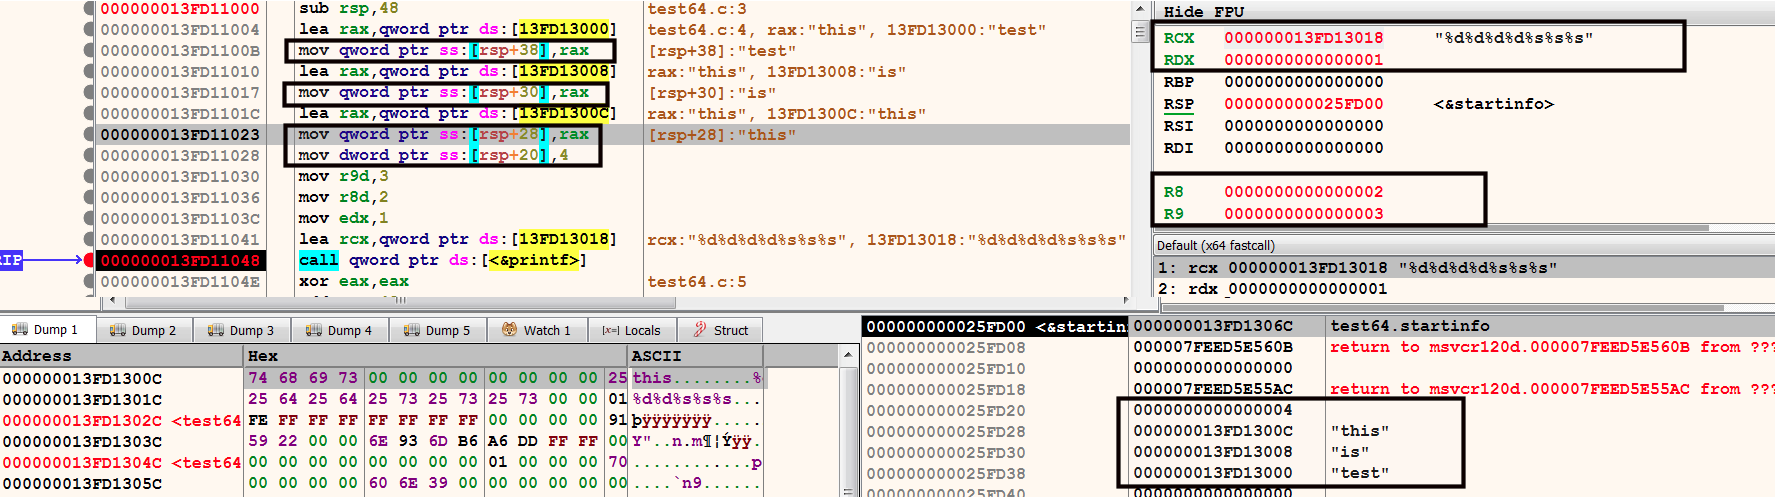
In the case of a 32-bit function, the stack grows as the arguments are pushed, and shrinks when the items are popped. In a 64-bit function, the stack space is allocated at the beginning of the function, and does not change until the end of the function. The allocated stack space is used to store the local variables and the function parameters. In the preceding screenshot, note how the first instruction, sub rsp,48allocates 0x48 (72) bytes of space on the stack, after which no stack space is allocated in the middle of the function; also, instead of using push and pop instructions, the mov instructions are used to place the 5th, 6th, 7th, and 8th parameters on the stack (highlighted in the preceding screenshot). The lack of push and pop instructions makes it difficult to determine the number of parameters accepted by the function, and it is also hard to say whether the memory address is being used as a local variable or a parameter to the function. Another challenge is, if the values are moved into the registers rcx and rdx before the function call, it's hard to say whether they are parameters passed to the function, or if they are moved into registers for any other reason.

Even though there are challenges in reverse engineering a 64-bit binary, you should not have too much difficulty analyzing the API calls, because the API documentation tells you the number of function parameters, the data types of the parameters, and what type of data they return. Once you have an idea of where to find the function parameters and the return values, you can set a breakpoint at the API call and inspect its parameters to understand the malware functionality.

Let's look at an example of a 64-bit malware sample that calls RegSetValueEx to set some value in the registry. In the following screenshot, the breakpoint is triggered before the call to the RegSetValueEx. You will need to look at the values in the registers and the stack window (as mentioned previously) to examine the parameters passed to the function; this will help you determine what registry value is set by the malware. In x64dbg, the easiest way to get a quick summary of function parameters is to look at the Default Window (below the registers window), which is highlighted in the following screenshot. You can set a value in the Default window to display the number of parameters. In the following screenshot, the value is set to 6, because from the API documentation (https://msdn.microsoft.com/en-us/library/windows/desktop/ms724923(v=vs.85).aspx), you can tell that the RegSetValueEx API takes 6 parameters:
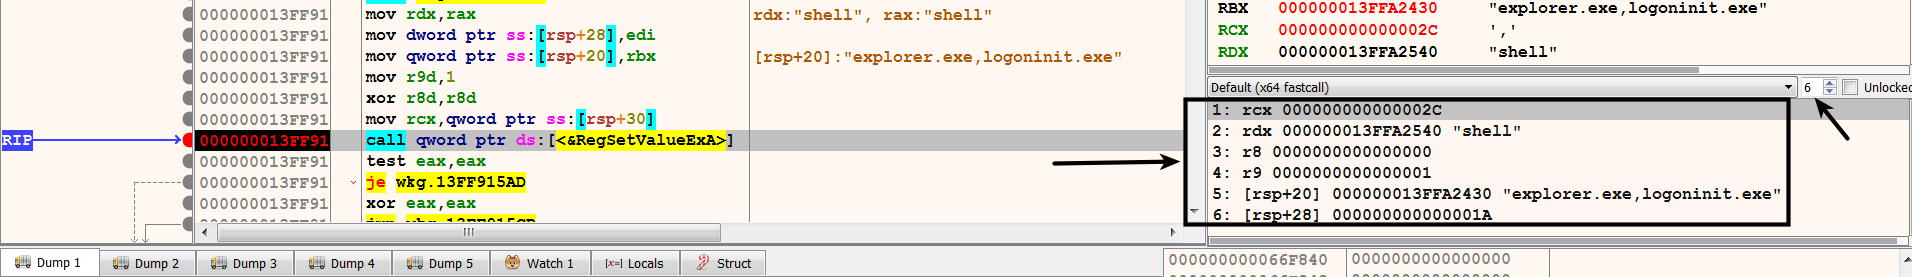
The first parameter value, 0x2cis the handle to the open registry key. Malware can open a handle to the registry key by calling either the RegCreateKey or RegOpenKey API. From the handles window, you can tell that the handle value 0x2c is associated with the registry key shown in the following screenshot. From the handle information, and through inspecting the 1st, 2nd, and 5th parameters, you can tell that malware modifies the registry key, HKEY_LOCAL_MACHINE\SOFTWARE\Microsoft\WindowsNT\CurrentVersion\Winlogon\shelland adds an entry, "explorer.exe,logoninit.exe". On a clean system, this registry key points to explorer.exe (the default Windows shell). When the system starts, the Userinit.exe process uses this value to launch the Windows shell (explorer.exe). By adding logoninit.exealong with explorer.exe, the malware makes sure that logoninit.exe is also launched by Userinit.exe; this is another type of persistence mechanism used by the malware:

At this point, you should have an understanding of how to debug a malicious executable to understand its functionality. In the next section, you will learn how to debug a malicious DLL to determine its behavior.