
When the driver is loaded into the system, the I/O manager creates a driver object (DRIVER_OBJECT structure). The I/O manager then calls the driver's initialization routine, DriverEntry (which is analogous to the main() or WinMain() functions), by passing a pointer to the DRIVER_OBJECT structure as an argument. A driver object (DRIVER_OBJECT structure) represents an individual driver on the system. The DriverEntry routine will use the DRIVER_OBJECT to populate it with various entry points of the driver for handling specific I/O requests. Typically, in the DriverEntry routine, the driver creates a device object (DEVICE_OBJECT structure) that represent logical or physical devices. The device is created using an API called IoCreateDevice or IoCreateDevice-Secure. When the driver creates a device object, it can optionally assign the name to the device and it can also create multiple devices. After the device is created, the pointer to the first created device is updated in the driver object. To help you understand this better, let's list the loaded kernel modules and look at a driver object of a simple kernel module. For this example, we will examine the null.sys kernel driver. As per Microsoft documentation, the Null device driver provides the functional equivalent of \dev\null in the Unix environment. When the system starts during the kernel initialization phase, null.sys gets loaded into the system. In the kernel module listing, you can see that null.sys is loaded at base address 8bcde000:
kd> lm k
start end module name
80ba2000 80baa000 kdcom (deferred)
81e29000 81e44000 luafv (deferred)
[REMOVED]
8bcde000 8bce5000 Null (deferred)
Since null.sys is already loaded, its driver object (DRIVER_OBJECT structure) will be populated with metadata information during the driver initialization. Let's look at its driver object to understand what kind of information it contains. You can display the driver object information using the !drvobj extension command. From the following output, the driver object representing null.sys is at address 86a33180. The value 86aa2750 below Device Object list is the pointer to the device object created by null.sys. If the driver creates multiple devices, you will see multiple entries under the Device Object list:
kd> !drvobj Null
Driver object (86a33180) is for:
 \Driver\Null
Driver Extension List: (id , addr)

Device Object list:
86aa2750
You can use the driver object address 86a33180 to examine the _DRIVER_OBJECT structure of null.sys using the dt (display type) command. From the following output, you can see that the DriverStart field holds the base address (0x8bcde000) of the driver, the DriverSize field contains the size of the driver(0x7000), and the Drivername is the name of the driver object (\Driver\Null). The DriverInit field holds the pointer to the Driver initialization routine (DriverEntry). The DriverUnload field contains the pointer to the driver's unload routine, which normally frees up resources created by the driver during unload process. The MajorFunction field is one of the most important fields, that points to a table of 28 major function pointers. This table will be populated with the addresses of the dispatch routines, and we will look at the MajorFunction table later in this section. The driverscan plugin covered earlier performs pool tag scanning for the driver objects and gets the information related to the kernel module such as base address, size, and the driver name by reading some of these fields:
kd> dt nt!_DRIVER_OBJECT 86a33180
   +0x000 Type : 0n4
   +0x002 Size : 0n168
   +0x004 DeviceObject : 0x86aa2750 _DEVICE_OBJECT
   +0x008 Flags : 0x12
   +0x00c DriverStart : 0x8bcde000 Void
   +0x010 DriverSize : 0x7000
   +0x014 DriverSection : 0x86aa2608 Void
   +0x018 DriverExtension : 0x86a33228 _DRIVER_EXTENSION
   +0x01c DriverName : _UNICODE_STRING "\Driver\Null"
   +0x024 HardwareDatabase : 0x82d86270 _UNICODE_STRING "\REGISTRY\MACHINE\HARDWARE\DESCRIPTION\SYSTEM"
   +0x028 FastIoDispatch : 0x8bce0000 _FAST_IO_DISPATCH
   +0x02c DriverInit : 0x8bce20bc long Null!GsDriverEntry+0
   +0x030 DriverStartIo : (null)
   +0x034 DriverUnload : 0x8bce1040 void Null!NlsUnload+0
   +0x038 MajorFunction : [28] 0x8bce107c
The DeviceObject field in the DRIVER_OBJECT structure contains the pointer to the device object created by the driver (null.sys). You can use the device object address 0x86aa2750 to determine the name of the device created by the driver. In this case, Null is the name of the device created by the driver null.sys:
kd> !devobj 86aa2750
Device object (86aa2750) is for:
 Null \Driver\Null DriverObject 86a33180
Current Irp 00000000 RefCount 0 Type 00000015 Flags 00000040
Dacl 8c667558 DevExt 00000000 DevObjExt 86aa2808
ExtensionFlags (0x00000800) DOE_DEFAULT_SD_PRESENT
Characteristics (0x00000100) FILE_DEVICE_SECURE_OPEN
Device queue is not busy.
You can also look at the actual DEVICE_OBJECT structure by specifying the device object address next to the display type (dt) command, as shown in the following code. If the driver creates more than one device, then the NextDevice field in the DEVICE_OBJECT structure will point to the next device object. Since the null.sys driver creates only one device, the NextDevice field is set to null:
kd> dt nt!_DEVICE_OBJECT 86aa2750
   +0x000 Type : 0n3
   +0x002 Size : 0xb8
   +0x004 ReferenceCount : 0n0
   +0x008 DriverObject : 0x86a33180 _DRIVER_OBJECT
   +0x00c NextDevice : (null)
   +0x010 AttachedDevice : (null)
   +0x014 CurrentIrp : (null)
   +0x018 Timer : (null)
   +0x01c Flags : 0x40
   +0x020 Characteristics : 0x100
   +0x024 Vpb : (null)
   +0x028 DeviceExtension : (null)
   +0x02c DeviceType : 0x15
   +0x030 StackSize : 1 ''
   [REMOVED]
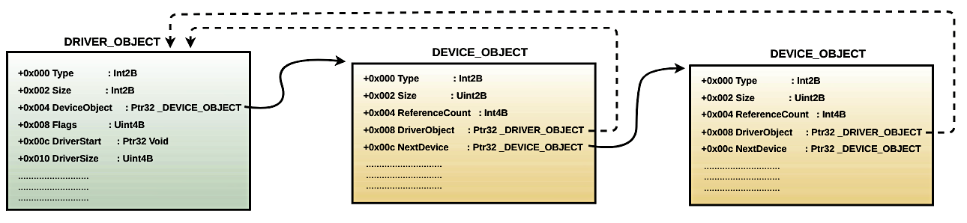
From the preceding output, you can see that the DEVICE_OBJECT contains a DriverObject field that points back to the driver object. In other words, the associated driver can be determined from the device object. This is how the I/O manager can determine the associated driver when it receives the I/O request for a specific device. This concept can be visualized using the following diagram:
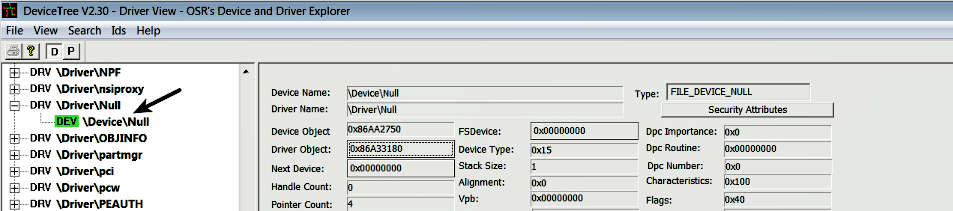
You can use a GUI tool such as DeviceTree (http://www.osronline.com/article.cfm?article=97) to look at the devices created by the driver. The following is a screenshot of the tool showing the Null device created by the null.sys driver:
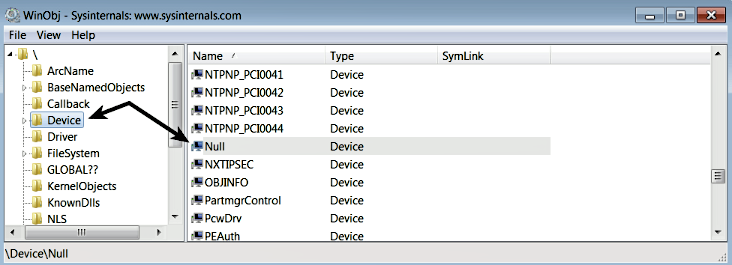
When a driver creates a device, the device objects are placed in the \Device directory in the Windows object manager's namespace. To view the object manager's namespace information, you can use the WinObj tool (https://docs.microsoft.com/en-us/sysinternals/downloads/winobj). The following screenshot shows the device (Null) created by null.sys in the \Device directory. You can also see the devices that have been created by other drivers:
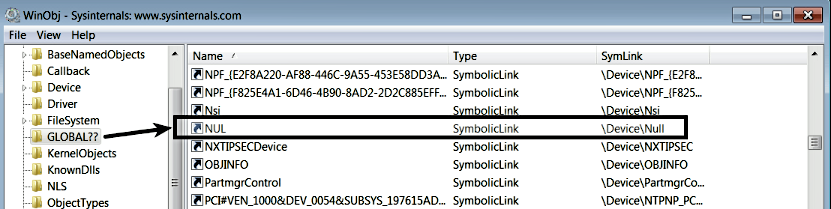
The device created under the \Device directory is not accessible to the applications running in the user mode. In other words, if a user mode application wants to perform I/O operations on the device, it cannot directly open a handle to the device by passing the name of the device (such as \Device\Null) as the argument to the CreateFile function. The CreateFile function is not just used for creating or opening a file, it can also be used to open a handle to the device. If a user mode application cannot access the device, then how can it perform I/O operations? To make the device accessible to the user mode applications, the driver needs to advertise the device. This is done by creating a symbolic link to the device. A driver can create a symbolic link using the kernel API IoCreateSymbolicLink. When a symbolic link is created for a device (such as \Device\Null), you can find it in the \GLOBAL?? directory in the object manager namespace, which can also be viewed using the WinObj tool. In the following screenshot, you can see that NUL is the name of the symbolic link created for the \Device\Null device by the null.sys driver:
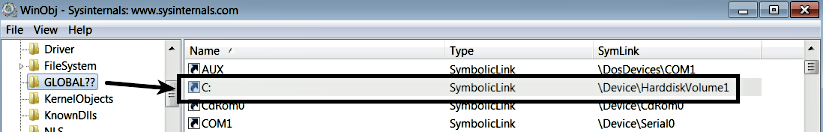
The symbolic link is also referred to as an MS-DOS device name. A user mode application can simply use the name of the symbolic link (MS-DOS device name) to open the handle to the device using the convention \\.\<symboliclink name>. For example, to open a handle to \Device\Null, a user mode application has to just pass \\.\NUL as the first argument (lpFilename) to the CreateFile function, which returns the file handle to the device. To be specific, anything that is a symbolic link within the object manager's directory GLOBAL?? can be opened using the CreateFile function. As shown in the following screenshot, the C: volume is just a symbolic link to \Device\HarddiskVolume1. In Windows, I/O operations are performed on virtual files. In other words, devices, directories, pipes, and files are all treated as virtual files (that can be opened using the CreateFile function):
At this point, you know that the driver, during its initialization, creates the device and advertises it to be used by the user application using symbolic links. Now, the question is, how does the driver tell the I/O manager what type of operation (open, read, write, and so on) it supports for the device? During initialization, another thing the driver normally does is update the Major function table (dispatch routine array) with the addresses of the dispatch routines in the DRIVER_OBJECT structure. Examining the major function table will give you an idea of the type of operations (open, read, write, and so on) supported by the driver, and the addresses of dispatch routines associated with the specific operation. The major function table is an array of 28 function pointers; the index values 0 to 27 represents a particular operation. For example, the index value 0 corresponds to the major function code IRP_MJ_CREATE, the index value 3 corresponds to the major function code IRP_MJ_READ, and so on. In other words, if an application wants to open a handle to a file or device object, the request will be sent to the I/O manager, which will then use the IRP_MJ_CREATE major function code as the index into the major function table to find the address of the dispatch routine that will handle this request. In the same manner for the read operation, IRP_MJ_READ is used as the index to determine the address of the dispatch routine.
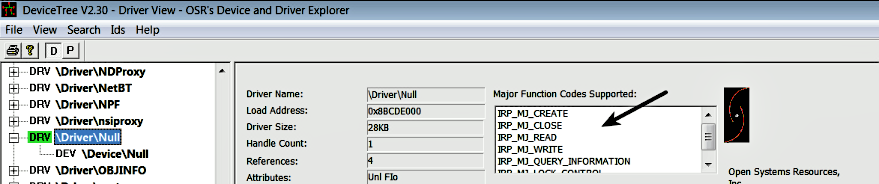
The following !drvobj commands displays the dispatch routine array populated by the null.sys driver. The operations that are not supported by the driver point to IopInvalidDeviceRequest in the ntoskrnl.exe (nt). Based on this information, you can tell that null.sys only supports IRP_MJ_CREATE (open), IRP_MJ_CLOSE (close), IRP_MJ_READ (read), IRP_MJ_WRITE (write), IRP_MJ_QUERY_INFORMATION (query information), and IRP_MJ_LOCK_CONTROL (lock control) operations. Any request to perform any of the supported operations will be dispatched to the appropriate dispatch routine. For example, when the user application performs a write operation, the write request to the device will be dispatched to the MajorFunction[IRP_MJ_WRITE] function, which happens to be at address 8bce107c within the null.sys driver's unload routine. In the case of null.sys, all the supported operations are dispatched to the same address, 8bce107c. Normally, that is not the case; you will see different routine addresses for handling different operations:
kd> !drvobj Null 2
Driver object (86a33180) is for:
 \Driver\Null
DriverEntry: 8bce20bc Null!GsDriverEntry
DriverStartIo: 00000000
DriverUnload: 8bce1040 Null!NlsUnload
AddDevice: 00000000

Dispatch routines:
[00] IRP_MJ_CREATE                   8bce107c Null!NlsUnload+0x3c
[01] IRP_MJ_CREATE_NAMED_PIPE        82ac5fbe nt!IopInvalidDeviceRequest
[02] IRP_MJ_CLOSE                    8bce107c Null!NlsUnload+0x3c
[03] IRP_MJ_READ                     8bce107c Null!NlsUnload+0x3c
[04] IRP_MJ_WRITE                    8bce107c Null!NlsUnload+0x3c
[05] IRP_MJ_QUERY_INFORMATION        8bce107c Null!NlsUnload+0x3c
[06] IRP_MJ_SET_INFORMATION          82ac5fbe nt!IopInvalidDeviceRequest
[07] IRP_MJ_QUERY_EA                 82ac5fbe nt!IopInvalidDeviceRequest
[08] IRP_MJ_SET_EA                   82ac5fbe nt!IopInvalidDeviceRequest
[09] IRP_MJ_FLUSH_BUFFERS            82ac5fbe nt!IopInvalidDeviceRequest
[0a] IRP_MJ_QUERY_VOLUME_INFORMATION 82ac5fbe nt!IopInvalidDeviceRequest
[0b] IRP_MJ_SET_VOLUME_INFORMATION   82ac5fbe nt!IopInvalidDeviceRequest
[0c] IRP_MJ_DIRECTORY_CONTROL        82ac5fbe nt!IopInvalidDeviceRequest
[0d] IRP_MJ_FILE_SYSTEM_CONTROL      82ac5fbe nt!IopInvalidDeviceRequest
[0e] IRP_MJ_DEVICE_CONTROL           82ac5fbe nt!IopInvalidDeviceRequest
[0f] IRP_MJ_INTERNAL_DEVICE_CONTROL  82ac5fbe nt!IopInvalidDeviceRequest
[10] IRP_MJ_SHUTDOWN                 82ac5fbe nt!IopInvalidDeviceRequest
[11] IRP_MJ_LOCK_CONTROL             8bce107c Null!NlsUnload+0x3c
[12] IRP_MJ_CLEANUP                  82ac5fbe nt!IopInvalidDeviceRequest
[13] IRP_MJ_CREATE_MAILSLOT          82ac5fbe nt!IopInvalidDeviceRequest
[14] IRP_MJ_QUERY_SECURITY           82ac5fbe nt!IopInvalidDeviceRequest
[15] IRP_MJ_SET_SECURITY             82ac5fbe nt!IopInvalidDeviceRequest
[16] IRP_MJ_POWER                    82ac5fbe nt!IopInvalidDeviceRequest
[17] IRP_MJ_SYSTEM_CONTROL           82ac5fbe nt!IopInvalidDeviceRequest
[18] IRP_MJ_DEVICE_CHANGE            82ac5fbe nt!IopInvalidDeviceRequest
[19] IRP_MJ_QUERY_QUOTA              82ac5fbe nt!IopInvalidDeviceRequest
[1a] IRP_MJ_SET_QUOTA                82ac5fbe nt!IopInvalidDeviceRequest
[1b] IRP_MJ_PNP                      82ac5fbe nt!IopInvalidDeviceRequest
You can also look at the supported operations in the DeviceTree tool, as shown the following screenshot:
At this point, you know that the driver creates the device, advertises it to be used by the user applications, and it also updates the dispatch routine array (major function table) to tell the I/O manager what operation it supports. Now, let's look at what the role of the I/O manager is and understand how the I/O request received from the user application is dispatched to the driver.