Table of Contents for
Learning Malware Analysis

Version ebook / Retour

Cover image for bash Cookbook, 2nd Edition Learning Malware Analysis by Monnappa K A Published by Packt Publishing, 2018
  1. Learning Malware Analysis
  2. Title Page
  3. Copyright and Credits
  4. Learning Malware Analysis
  5. Dedication
  6. Packt Upsell
  7. Why subscribe?
  8. PacktPub.com
  9. Contributors
  10. About the author
  11. About the reviewers
  12. Packt is searching for authors like you
  13. Table of Contents
  14. Preface
  15. Who this book is for
  16. What this book covers
  17. To get the most out of this book
  18. Download the color images
  19. Conventions used
  20. Get in touch
  21. Reviews
  22. Introduction to Malware Analysis
  23. 1. What Is Malware?
  24. 2. What Is Malware Analysis?
  25. 3. Why Malware Analysis?
  26. 4. Types Of Malware Analysis
  27. 5. Setting Up The Lab Environment
  28. 5.1 Lab Requirements
  29. 5.2 Overview Of Lab Architecture
  30. 5.3 Setting Up And Configuring Linux VM
  31. 5.4 Setting Up And Configuring Windows VM
  32. 6. Malware Sources
  33. Summary
  34. Static Analysis
  35. 1. Determining the File Type
  36. 1.1 Identifying File Type Using Manual Method
  37. 1.2 Identifying File Type Using Tools
  38. 1.3 Determining File Type Using Python
  39. 2. Fingerprinting the Malware
  40. 2.1 Generating Cryptographic Hash Using Tools
  41. 2.2 Determining Cryptographic Hash in Python
  42. 3. Multiple Anti-Virus Scanning
  43. 3.1 Scanning the Suspect Binary with VirusTotal
  44. 3.2 Querying Hash Values Using VirusTotal Public API
  45. 4. Extracting Strings
  46. 4.1 String Extraction Using Tools
  47. 4.2 Decoding Obfuscated Strings Using FLOSS
  48. 5. Determining File Obfuscation
  49. 5.1 Packers and Cryptors
  50. 5.2 Detecting File Obfuscation Using Exeinfo PE
  51. 6. Inspecting PE Header Information
  52. 6.1 Inspecting File Dependencies and Imports
  53. 6.2  Inspecting Exports
  54. 6.3  Examining PE Section Table And Sections
  55. 6.4 Examining the Compilation Timestamp
  56. 6.5 Examining PE Resources
  57. 7. Comparing And Classifying The Malware
  58. 7.1 Classifying Malware Using Fuzzy Hashing
  59. 7.2 Classifying Malware Using Import Hash
  60. 7.3 Classifying Malware Using Section Hash
  61. 7.4 Classifying Malware Using YARA
  62. 7.4.1 Installing YARA
  63. 7.4.2 YARA Rule Basics
  64. 7.4.3 Running YARA
  65. 7.4.4 Applications of YARA
  66. Summary
  67. Dynamic Analysis
  68. 1. Lab Environment Overview
  69. 2. System And Network Monitoring
  70. 3. Dynamic Analysis (Monitoring) Tools
  71. 3.1 Process Inspection with Process Hacker
  72. 3.2 Determining System Interaction with Process Monitor
  73. 3.3 Logging System Activities Using Noriben
  74. 3.4 Capturing Network Traffic With Wireshark
  75. 3.5 Simulating Services with INetSim
  76. 4. Dynamic Analysis Steps
  77. 5. Putting it All Together: Analyzing a Malware Executable
  78. 5.1 Static Analysis of the Sample
  79. 5.2 Dynamic Analysis of the Sample
  80. 6. Dynamic-Link Library (DLL) Analysis
  81. 6.1 Why Attackers Use DLLs
  82. 6.2 Analyzing the DLL Using rundll32.exe
  83. 6.2.1 Working of rundll32.exe
  84. 6.2.2 Launching the DLL Using rundll32.exe
  85. Example 1 – Analyzing a DLL With No Exports
  86. Example 2 – Analyzing a DLL Containing Exports
  87. Example 3 – Analyzing a DLL Accepting Export Arguments
  88. 6.3 Analyzing a DLL with Process Checks
  89. Summary
  90. Assembly Language and Disassembly Primer
  91. 1. Computer Basics
  92. 1.1 Memory
  93. 1.1.1 How Data Resides In Memory
  94. 1.2 CPU
  95. 1.2.1 Machine Language
  96. 1.3 Program Basics
  97. 1.3.1 Program Compilation
  98. 1.3.2 Program On Disk
  99. 1.3.3 Program In Memory
  100. 1.3.4 Program Disassembly (From Machine code To Assembly code)
  101. 2. CPU Registers
  102. 2.1 General-Purpose Registers
  103. 2.2 Instruction Pointer (EIP)
  104. 2.3 EFLAGS Register
  105. 3. Data Transfer Instructions
  106. 3.1 Moving a Constant Into Register
  107. 3.2 Moving Values From Register To Register
  108. 3.3 Moving Values From Memory To Registers
  109. 3.4 Moving Values From Registers To Memory
  110. 3.5 Disassembly Challenge
  111. 3.6 Disassembly Solution
  112. 4. Arithmetic Operations
  113. 4.1 Disassembly Challenge
  114. 4.2 Disassembly Solution
  115. 5. Bitwise Operations
  116. 6. Branching And Conditionals
  117. 6.1 Unconditional Jumps
  118. 6.2 Conditional Jumps
  119. 6.3 If Statement
  120. 6.4 If-Else Statement
  121. 6.5 If-Elseif-Else Statement
  122. 6.6 Disassembly Challenge
  123. 6.7 Disassembly Solution
  124. 7. Loops
  125. 7.1 Disassembly Challenge
  126. 7.2 Disassembly Solution
  127. 8. Functions
  128. 8.1 Stack
  129. 8.2 Calling Function
  130. 8.3 Returning From Function
  131. 8.4 Function Parameters And Return Values
  132. 9. Arrays And Strings
  133. 9.1 Disassembly Challenge
  134. 9.2 Disassembly Solution
  135. 9.3 Strings
  136. 9.3.1 String Instructions
  137. 9.3.2 Moving From Memory To Memory (movsx)
  138. 9.3.3 Repeat Instructions (rep)
  139. 9.3.4 Storing Value From Register to Memory (stosx)
  140. 9.3.5 Loading From Memory to Register (lodsx)
  141. 9.3.6 Scanning Memory (scasx)
  142. 9.3.7 Comparing Values in Memory (cmpsx)
  143. 10. Structures
  144. 11. x64 Architecture
  145. 11.1 Analyzing 32-bit Executable On 64-bit Windows
  146. 12. Additional Resources
  147. 13. Summary
  148. Disassembly Using IDA
  149. 1. Code Analysis Tools
  150. 2. Static Code Analysis (Disassembly) Using IDA
  151. 2.1 Loading Binary in IDA
  152. 2.2 Exploring IDA Displays
  153. 2.2.1 Disassembly Window
  154. 2.2.2 Functions Window
  155. 2.2.3 Output Window
  156. 2.2.4 Hex View Window
  157. 2.2.5 Structures Window
  158. 2.2.6 Imports Window
  159. 2.2.7 Exports Window
  160. 2.2.8 Strings Window
  161. 2.2.9 Segments Window
  162. 2.3 Improving Disassembly Using IDA
  163. 2.3.1 Renaming Locations
  164. 2.3.2 Commenting in IDA
  165. 2.3.3 IDA Database
  166. 2.3.4 Formatting Operands
  167. 2.3.5 Navigating Locations
  168. 2.3.6 Cross-References
  169. 2.3.7 Listing All Cross-References
  170. 2.3.8 Proximity View And Graphs
  171. 3. Disassembling Windows API
  172. 3.1 Understanding Windows API
  173. 3.1.1 ANSI and Unicode API Functions
  174. 3.1.2 Extended API Functions
  175. 3.2 Windows API 32-Bit and 64-Bit Comparison
  176. 4. Patching Binary Using IDA
  177. 4.1 Patching Program Bytes
  178. 4.2 Patching Instructions
  179. 5. IDA Scripting and Plugins
  180. 5.1 Executing IDA Scripts
  181. 5.2 IDAPython
  182. 5.2.1 Checking The Presence Of CreateFile API
  183. 5.2.2 Code Cross-References to CreateFile Using IDAPython
  184. 5.3 IDA Plugins
  185. 6. Summary
  186. Debugging Malicious Binaries
  187. 1. General Debugging Concepts
  188. 1.1 Launching And Attaching To Processes
  189. 1.2 Controlling Process Execution
  190. 1.3 Interrupting a Program with Breakpoints
  191. 1.4 Tracing Program Execution
  192. 2. Debugging a Binary Using x64dbg
  193. 2.1 Launching a New Process in x64dbg
  194. 2.2 Attaching to an Existing Process Using x64dbg
  195. 2.3 x64dbg Debugger Interface
  196. 2.4 Controlling Process Execution Using x64dbg
  197. 2.5 Setting a Breakpoint in x64dbg
  198. 2.6 Debugging 32-bit Malware
  199. 2.7 Debugging 64-bit Malware
  200. 2.8 Debugging a Malicious DLL Using x64dbg
  201. 2.8.1 Using rundll32.exe to Debug the DLL in x64dbg
  202. 2.8.2 Debugging a DLL in a Specific Process
  203. 2.9 Tracing Execution in x64dbg
  204. 2.9.1 Instruction Tracing
  205. 2.9.2 Function Tracing
  206. 2.10 Patching in x64dbg
  207. 3. Debugging a Binary Using IDA
  208. 3.1 Launching a New Process in IDA
  209. 3.2 Attaching to an Existing Process Using IDA
  210. 3.3 IDA's Debugger Interface
  211. 3.4 Controlling Process Execution Using IDA
  212. 3.5 Setting a Breakpoint in IDA
  213. 3.6 Debugging Malware Executables
  214. 3.7 Debugging a Malicious DLL Using IDA
  215. 3.7.1 Debugging a DLL in a Specific Process
  216. 3.8 Tracing Execution Using IDA
  217. 3.9 Debugger Scripting Using IDAPython
  218. 3.9.1 Example – Determining Files Accessed by Malware
  219. 4. Debugging a .NET Application
  220. Summary
  221. Malware Functionalities and Persistence
  222. 1. Malware Functionalities
  223. 1.1 Downloader
  224. 1.2 Dropper
  225. 1.2.1 Reversing a 64-bit Dropper
  226. 1.3 Keylogger
  227. 1.3.1 Keylogger Using GetAsyncKeyState()
  228. 1.3.2 Keylogger Using SetWindowsHookEx()
  229. 1.4 Malware Replication Via Removable Media
  230. 1.5 Malware Command and Control (C2)
  231. 1.5.1 HTTP Command and Control
  232. 1.5.2 Custom Command and Control
  233. 1.6 PowerShell-Based Execution
  234. 1.6.1 PowerShell Command Basics
  235. 1.6.2 PowerShell Scripts And Execution Policy
  236. 1.6.2 Analyzing PowerShell Commands/Scripts
  237. 1.6.3 How Attackers Use PowerShell
  238. 2. Malware Persistence Methods
  239. 2.1 Running the Registry Key
  240. 2.2 Scheduled Tasks
  241. 2.3 Startup Folder
  242. 2.4 Winlogon Registry Entries
  243. 2.5 Image File Execution Options
  244. 2.6 Accessibility Programs
  245. 2.7 AppInit_DLLs
  246. 2.8 DLL Search Order Hijacking
  247. 2.9 COM hijacking
  248. 2.10 Service
  249. Summary
  250. Code Injection and Hooking
  251. 1. Virtual Memory
  252. 1.1 Process Memory Components (User Space)
  253. 1.2 Kernel Memory Contents (Kernel Space)
  254. 2. User Mode And Kernel Mode
  255. 2.1 Windows API Call Flow
  256. 3. Code Injection Techniques
  257. 3.1 Remote DLL Injection
  258. 3.2 DLL Injection Using APC (APC Injection)
  259. 3.3 DLL Injection Using SetWindowsHookEx()
  260. 3.4 DLL Injection Using The Application Compatibility Shim
  261. 3.4.1 Creating A Shim
  262. 3.4.2 Shim Artifacts
  263. 3.4.3 How Attackers Use Shims
  264. 3.4.4 Analyzing The Shim Database
  265. 3.5 Remote Executable/Shellcode Injection
  266. 3.6 Hollow Process Injection (Process Hollowing)
  267. 4. Hooking Techniques
  268. 4.1 IAT Hooking
  269. 4.2 Inline Hooking (Inline Patching)
  270. 4.3 In-memory Patching Using Shim
  271. 5. Additional Resources
  272. Summary
  273. Malware Obfuscation Techniques
  274. 1. Simple Encoding
  275. 1.1 Caesar Cipher
  276. 1.1.1 Working Of Caesar Cipher
  277. 1.1.2 Decrypting Caesar Cipher In Python
  278. 1.2 Base64 Encoding
  279. 1.2.1 Translating Data To Base64
  280. 1.2.2 Encoding And Decoding Base64
  281. 1.2.3 Decoding Custom Base64
  282. 1.2.4 Identifying Base64
  283. 1.3 XOR Encoding
  284. 1.3.1 Single Byte XOR
  285. 1.3.2 Finding XOR Key Through Brute-Force
  286. 1.3.3 NULL Ignoring XOR Encoding
  287. 1.3.4 Multi-byte XOR Encoding
  288. 1.3.5 Identifying XOR Encoding
  289. 2. Malware Encryption
  290. 2.1 Identifying Crypto Signatures Using Signsrch
  291. 2.2 Detecting Crypto Constants Using FindCrypt2
  292. 2.3 Detecting Crypto Signatures Using YARA
  293. 2.4 Decrypting In Python
  294. 3. Custom Encoding/Encryption
  295. 4. Malware Unpacking
  296. 4.1 Manual Unpacking
  297. 4.1.1 Identifying The OEP
  298. 4.1.2 Dumping Process Memory With Scylla
  299. 4.1.3 Fixing The Import Table
  300. 4.2 Automated Unpacking
  301. Summary
  302. Hunting Malware Using Memory Forensics
  303. 1. Memory Forensics Steps
  304. 2. Memory Acquisition
  305. 2.1 Memory Acquisition Using DumpIt
  306. 3. Volatility Overview
  307. 3.1 Installing Volatility
  308. 3.1.1 Volatility Standalone Executable
  309. 3.1.2 Volatility Source Package
  310. 3.2 Using Volatility
  311. 4. Enumerating Processes
  312. 4.1 Process Overview
  313. 4.1.1 Examining the _EPROCESS Structure
  314. 4.1.2 Understanding ActiveProcessLinks
  315. 4.2 Listing Processes Using psscan
  316. 4.2.1 Direct Kernel Object Manipulation (DKOM)
  317. 4.2.2 Understanding Pool Tag Scanning
  318. 4.3 Determining Process Relationships
  319. 4.4 Process Listing Using psxview
  320. 5. Listing Process Handles
  321. 6. Listing DLLs
  322. 6.1 Detecting a Hidden DLL Using ldrmodules
  323. 7. Dumping an Executable and DLL
  324. 8. Listing Network Connections and Sockets
  325. 9. Inspecting Registry
  326. 10. Investigating Service
  327. 11. Extracting Command History
  328. Summary
  329. Detecting Advanced Malware Using Memory Forensics
  330. 1. Detecting Code Injection
  331. 1.1 Getting VAD Information
  332. 1.2 Detecting Injected Code Using VAD
  333. 1.3 Dumping The Process Memory Region
  334. 1.4 Detecting Injected Code Using malfind
  335. 2. Investigating Hollow Process Injection
  336. 2.1 Hollow Process Injection Steps
  337. 2.2 Detecting Hollow Process Injection
  338. 2.3 Hollow Process Injection Variations
  339. 3. Detecting API Hooks
  340. 4. Kernel Mode Rootkits
  341. 5. Listing Kernel Modules
  342. 5.1 Listing Kernel Modules Using driverscan
  343. 6. I/O Processing
  344. 6.1 The Role Of The Device Driver
  345. 6.2 The Role Of The I/O Manager
  346. 6.3 Communicating With The Device Driver
  347. 6.4 I/O Requests To Layered Drivers
  348. 7. Displaying Device Trees
  349. 8. Detecting Kernel Space Hooking
  350. 8.1 Detecting SSDT Hooking
  351. 8.2 Detecting IDT Hooking
  352. 8.3 Identifying Inline Kernel Hooks
  353. 8.4 Detecting IRP Function Hooks
  354. 9. Kernel Callbacks And Timers
  355. Summary
  356. Other Books You May Enjoy
  357. Leave a review - let other readers know what you think

9. Kernel Callbacks And Timers

The Windows operating system allows a driver to register a callback routine, which will be called when a particular event occurs. For instance, if a rootkit driver wants to monitor the execution and termination of all processes running on the system, it can register a callback routine for the process event by calling the kernel function PsSetCreateProcessNotifyRoutinePsSetCreateProcessNotifyRoutineEx, or PsSetCreateProcessNotifyRoutineEx2. When the process event occurs (starts or exits) the rootkit's callback routine will be invoked, which can then take necessary action such as preventing a process from launching. In the same manner, a rootkit driver can register a callback routine to receive notifications when an image (EXE or DLL) gets loaded into memory, when file and registry operations are performed, or when the system is about to be shut down. In other words, the callback functionality gives the rootkit driver the ability to monitor system activities and take necessary action depending on the activity. You can get a list of some of the documented and undocumented kernel functions that the rootkit may use to register callback routines at the following link: https://www.codemachine.com/article_kernel_callback_functions.html. The kernel functions are defined in different header files (ntddk.h, Wdm.h, and so on) in the Windows Driver Kit (WDK). The quickest method to get details on the documented kernel functions is to do a quick Google search, which should take you to the appropriate link in the WDK online documentation.

The way callbacks work is that a particular driver creates a callback object, which is a structure that contains the list of function pointers. The created callback object is advertised so that it can be used by other drivers. The other drivers can then register their callback routines with the driver that created the callback object (https://docs.microsoft.com/en-us/windows-hardware/drivers/kernel/callback-objects). The driver that created the callback can be the same as or different from the kernel driver that is registering for the callback. To look at the system-wide callback routines, you can use callbacks Volatility plugin. On a clean Windows system, you will typically see many callbacks installed by various drivers, which means not all entries in the callbacks output are malicious; further analysis is required to identify the malicious driver from a suspect memory image.

In the following example, the Mader rootkit as which performed SSDT hooking (discussed in the Detecting SSDT Hooking section of this chapter), also installed a process creation callback routine to monitor the execution or termination of all the processes running on the system. In particular, when a process event occurs, the callback routine at address 0xf66eb050 within the malicious module core.sys is invoked. The Module column specifies the name of the kernel module within which the callback function is implemented. The Details column gives the name or description of the kernel object that installed the callback. After you have identified the malicious driver, you can further investigate it or you can dump it to disk for further analysis (disassembly, AV scanning, string extraction, and so on), as shown in the moddump command here:

$ python vol.py -f mader.vmem --profile=WinXPSP3x86 callbacks
Volatility Foundation Volatility Framework 2.6
Type Callback Module Details
--------------------------- ---------- ---------- -------
IoRegisterShutdownNotification 0xf9630c6a VIDEOPRT.SYS \Driver\VgaSave
IoRegisterShutdownNotification 0xf9630c6a VIDEOPRT.SYS \Driver\vmx_svga
IoRegisterShutdownNotification 0xf9630c6a VIDEOPRT.SYS \Driver\mnmdd
IoRegisterShutdownNotification 0x805f5d66 ntoskrnl.exe \Driver\WMIxWDM
IoRegisterFsRegistrationChange 0xf97c0876 sr.sys -
GenericKernelCallback 0xf66eb050 core.sys -
PsSetCreateProcessNotifyRoutine 0xf66eb050 core.sys -
KeBugCheckCallbackListHead 0xf96e85ef NDIS.sys Ndis miniport
[REMOVED]
$ python vol.py -f mader.vmem --profile=WinXPSP3x86 modules | grep -i core
Volatility Foundation Volatility Framework 2.6
0x81772bf8 core.sys 0xf66e9000 0x12000 \system32\drivers\core.sys
$ python vol.py -f mader.vmem --profile=WinXPSP3x86 moddump -b 0xf66e9000 -D dump/
Volatility Foundation Volatility Framework 2.6
Module Base Module Name Result
----------- ----------------- ------
0x0f66e9000 core.sys OK: driver.f66e9000.sys

In the following example, the TDL3 rootkit installs process callback and image load callback notifications. This allows the rootkit to monitor process events and to get notifications when an executable image (EXE, DLL, or kernel module) is mapped into memory. The module names in the entries are set to UNKNOWN; this tells you that callback routine exists in an unknown module, which happens if the rootkit driver tries to hide by unlinking the KLDR_DATA_TABLE_ENTRY structure or if a rootkit is running an orphan thread (a thread that is hidden or detached from the kernel module). In such cases, the UNKNOWN entry makes it easy for you to spot the suspicious entry:

$ python vol.py -f tdl3.vmem --profile=WinXPSP3x86 callbacks
Volatility Foundation Volatility Framework 2.6
Type Callback Module Details
------------------------ ---------- -------- -------
[REMOVED]
IoRegisterShutdownNotification 0x805cdef4 ntoskrnl.exe \FileSystem\RAW
IoRegisterShutdownNotification 0xba8b873a MountMgr.sys \Driver\MountMgr
GenericKernelCallback 0xb878f108 UNKNOWN -
IoRegisterFsRegistrationChange 0xba6e34b8 fltMgr.sys -
GenericKernelCallback 0xb878e8e9 UNKNOWN -
PsSetLoadImageNotifyRoutine 0xb878f108 UNKNOWN -
PsSetCreateProcessNotifyRoutine 0xb878e8e9 UNKNOWN -
KeBugCheckCallbackListHead 0xba5f45ef NDIS.sys Ndis miniport
[REMOVED]

Even though the module name is UNKNOWN, based on the callback routine address, we can deduce that the malicious module should be residing somewhere in the memory region starting with address 0xb878. From the output of the modules plugin, you can see that the module has unlinked itself, but the modscan plugin was able to detect the kernel module which is loaded at 0xb878c000 and with a size of 0x11000. Clearly, all the callback routine addresses fall within the range of this module. Now that the base address of the kernel module is known, you can dump it using the moddump plugin for further analysis:

$ python vol.py -f tdl3.vmem --profile=WinXPSP3x86 modules | grep -i 0xb878
Volatility Foundation Volatility Framework 2.6

$ python vol.py -f tdl3.vmem --profile=WinXPSP3x86 modscan | grep -i 0xb878
Volatility Foundation Volatility Framework 2.6
0x9773c98 TDSSserv.sys 0xb878c000 0x11000 \system32\drivers\TDSSserv.sys

Like callbacks, a rootkit driver may create a timer and get notified when the specified time elapses. A rootkit driver may use this functionality to schedule operations to be performed periodically. The way it works is that the rootkit creates a timer and provides a callback routine known as DPC (Deferred Procedure Call), which will be called when the timer expires. When the callback routine is invoked, the rootkit can perform malicious actions. In other words, the timer is another way by which a rootkit can get to execute its malicious code. For detailed information on how the kernel timer works, refer to the following Microsoft documentation: https://docs.microsoft.com/en-us/windows-hardware/drivers/kernel/timer-objects-and-dpcs.

To list the kernel timers, you can use the timers Volatility plugin. A point to note out is that timers are not malicious, as such; it is a Windows functionality, so on a clean system you will see some of the legitimate drivers installing timers. Like callbacks, further analysis may be required to identify the malicious module. Since most rootkits try to hide their driver, as a result, obvious artifacts are created that can help you quickly identify the malicious module. In the following example, the ZeroAccess rootkit installs a timer for 6000 milliseconds. When this time elapses, the routine at address 0x814f9db0 in an UNKNOWN module is invoked. The UNKNOWN in the Module column tells us that the module is probably hidden, but the routine address points you to the memory range where the malicious code is present:

$ python vol.py -f zaccess1.vmem --profile=WinXPSP3x86 timers
Volatility Foundation Volatility Framework 2.6
Offset(V) DueTime Period(ms) Signaled Routine Module
---------- --------------------- --------- -------- -------- ------
0x805516d0 0x00000000:0x6b6d9546 60000 Yes 0x804f3eae ntoskrnl.exe
0x818751f8 0x80000000:0x557ed358 0 - 0x80534e48 ntoskrnl.exe
0x81894948 0x00000000:0x64b695cc 10000 - 0xf9cbc6c4 watchdog.sys
0xf6819990 0x00000000:0x78134eb2 60000 Yes 0xf68021f8 HTTP.sys
[REMOVED]
0xf7228d60 0x00000000:0x714477b4 60000 Yes 0xf7220266 ipnat.sys
0x814ff790 0x00000000:0xc4b6c5b4 60000 - 0x814f9db0 UNKNOWN
0x81460728 0x00000000:0x760df068 0 - 0x80534e48 ntoskrnl.exe
[REMOVED]

In addition to timers, ZeroAccess also installs callbacks to monitor registry operations. Again, the callback routine address points to the same memory range (starting with 0x814f):

$ python vol.py -f zaccess1.vmem --profile=WinXPSP3x86 callbacks
Volatility Foundation Volatility Framework 2.6
Type Callback Module Details
------------------------------ ---------- ----------- -------
IoRegisterShutdownNotification 0xf983e2be ftdisk.sys \Driver\Ftdisk
IoRegisterShutdownNotification 0x805cdef4 ntoskrnl.exe \FileSystem\RAW
IoRegisterShutdownNotification 0x805f5d66 ntoskrnl.exe \Driver\WMIxWDM
GenericKernelCallback 0x814f2d60 UNKNOWN -
KeBugCheckCallbackListHead 0xf96e85ef NDIS.sys Ndis miniport
CmRegisterCallback 0x814f2d60 UNKNOWN -

Trying to find the UNKNOWN module using the modules, modscan, and driverscan plugins does not return any results:

$ python vol.py -f zaccess1.vmem --profile=WinXPSP3x86 modules | grep -i 0x814f

$ python vol.py -f zaccess1.vmem --profile=WinXPSP3x86 modscan | grep -i 0x814f

$ python vol.py -f zaccess1.vmem --profile=WinXPSP3x86 driverscan | grep -i 0x814f

Inspecting the driverscan listing revealed suspicious entries where the base address and the size are zeroed out (which is not normal and could be a bypass trick). Zeroing out the base address explains why modules, modscan, and driverscan did not return any results. The output also reveals that the name of the malicious driver is composed only of numbers, which adds to the suspicion:

$ python vol.py -f zaccess1.vmem --profile=WinXPSP3x86 driverscan
Volatility Foundation Volatility Framework 2.6
0x00001abf978 1 0 0x00000000 0x0 \Driver\00009602 \Driver\00009602
0x00001b017e0 1 0 0x00000000 0x0 \Driver\00009602 \Driver\00009602

By zeroing out the base address, the rootkit is making it hard for the forensic analyst to determine the start address of the kernel module, which also prevents us from dumping the malicious module. We still know where the malicious code is residing (the address starting with 0x814f). The compelling question is, how do we determine the base address using that information? One method is to take one of the addresses and subtract a certain number of bytes (such as by going backwards) till you find the MZ signature, but the problem with that approach is that it's not easy to determine how many bytes to subtract. The fastest method is to use the yarascan plugin, since this plugin allows you to scan for a pattern (string, hex bytes, or regex) in the memory. Since we are trying to find the module that resides in the kernel memory starting with address 0x814f, we can use yarascan with -K ( which only scans kernel memory) to look for the MZ signature. From the output, you can see the presence of an executable at address 0x814f1b80. You can specify this as the base address to dump the malicious module to disk using the moddump plugin. The dumped module is around 53.2 KB in size, which turns out to be 0xd000 bytes in hex. In other words, the module starts at address 0x814f1b80 and ends at 0x814feb80. All the callback addresses fall within the address range of this module:

$ python vol.py -f zaccess1.vmem --profile=WinXPSP3x86 yarascan -K -Y "MZ" | grep -i 0x814f
Volatility Foundation Volatility Framework 2.6
0x814f1b80 4d 5a 90 00 03 00 00 00 04 00 00 00 ff ff 00 00 MZ..............
0x814f1b90 b8 00 00 00 00 00 00 00 40 00 00 00 00 00 00 00 ........@.......
0x814f1ba0 00 00 00 00 00 00 00 00 00 00 00 00 00 00 00 00 ................
0x814f1bb0 00 00 00 00 00 00 00 00 00 00 00 00 d0 00 00 00 ................
0x814f1bc0 0e 1f ba 0e 00 b4 09 cd 21 b8 01 4c cd 21 54 68 ........!..L.!Th
0x814f1bd0 69 73 20 70 72 6f 67 72 61 6d 20 63 61 6e 6e 6f is.program.canno
0x814f1be0 74 20 62 65 20 72 75 6e 20 69 6e 20 44 4f 53 20 t.be.run.in.DOS.
0x814f1bf0 6d 6f 64 65 2e 0d 0d 0a 24 00 00 00 00 00 00 00 mode....$.......
$ python vol.py -f zaccess1.vmem --profile=WinXPSP3x86 moddump -b 0x814f1b80 -D dump/
Module Base Module Name Result
----------- -------------------- ------
0x0814f1b80 UNKNOWN OK: driver.814f1b80.sys

$ ls -al
[REMOVED]
-rw-r--r-- 1 ubuntu ubuntu 53248 Jun 9 15:25 driver.814f1b80.sys

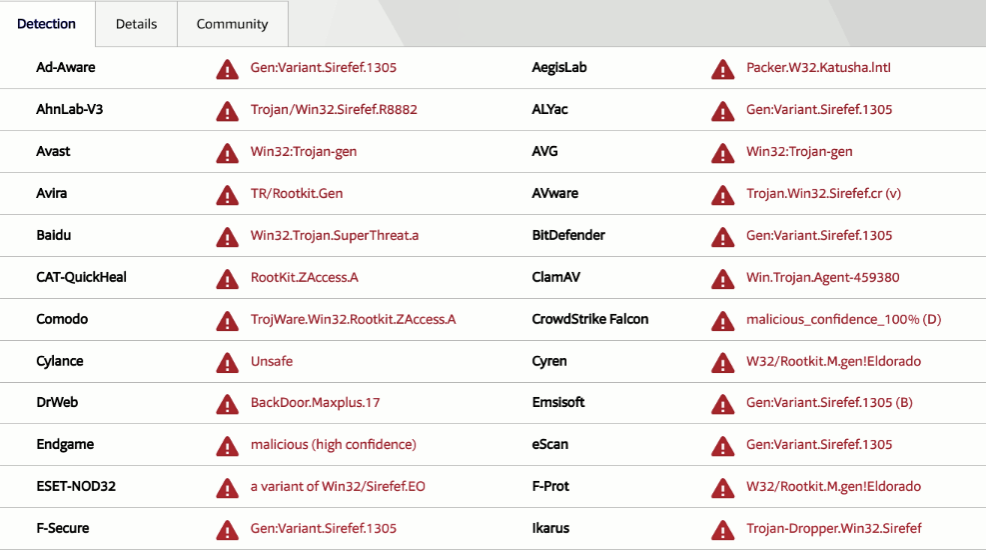
To confirm that the dumped module is malicious, it was submitted to VirusTotal. The results from AV vendors confirm it to be the ZeroAccess Rootkit (also known as Sirefef):