In chapter 3, Dynamic Analysis, you learned techniques to execute a DLL to perform dynamic analysis. In this section, you will use some of the concepts that you learned in chapter 3, Dynamic Analysis, to debug a DLL using x64dbg. If you are not already familiar with the dynamic analysis of a DLL, it is highly recommended to read Section 6, Dynamic-Link Library (DLL) Analysis, from Chapter 3, Dynamic Analysis, before proceeding further.
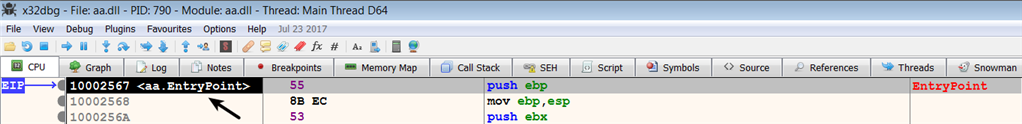
To debug a DLL, launch x64dbg (preferably with administrator privileges) and load the DLL (via File | Open). When you load the DLL, x64dbg drops an executable (named DLLLoader32_xxxx.exe, where xxxx are random hexadecimal characters) into the same directory where your DLL is located; this executable acts as a generic host process, which will be used to execute your DLL (in the same manner as rundll32.exe). After you load the DLL, the debugger may pause at the System Breakpoint, TLS callback, or DLL entry point function, depending on the configuration settings (mentioned earlier, in the Launching a New Process in x64dbg section). With the System Breakpoint* and TLS callback* options unchecked, the execution will pause at the DLL's entry point upon loading the DLL, as shown in the following screenshot. Now, you can debug the DLL like any other program: