
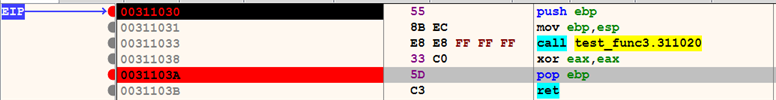
To demonstrate function tracing, consider the program shown in the following screenshot. In this program, the eip is pointing to the first instruction, the breakpoint is set at the fifth instruction (to stop tracing at this point), and the third instruction calls a function at 0x311020. We can use function tracing to determine what other functions are called by the function (0x311020):
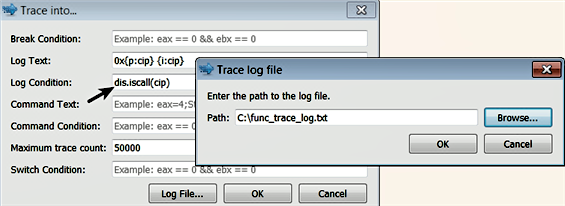
To perform function tracing (Trace into was chosen in this case), the following setting is used. This is similar to instruction tracing, except that in the Log Condition field, an expression, telling the debugger to log only the function call is specified:
The following are the events captured in the log file, as a result of function tracing. From the following events, you can tell that the function 0x311020 calls two other functions, at 0x311000 and 0x311010:
0x00311033      call    0x311020
0x00311023      call    0x311000
0x00311028      call    0x311010
In the preceding examples, the breakpoints were used to control the tracing. When the debugger reaches the breakpoint, the execution is paused, and the instructions/functions till the breakpoint are logged. When you resume the debugger, the rest of the instructions are executed, but not logged.