
To set a software breakpoint in IDA, you can navigate to the location where you want the program to pause, and press the F2 key (or right-click and select Add breakpoint). After you set the breakpoint, the addresses where breakpoints are set are highlighted in a red color. You can remove the breakpoint by pressing F2 on the line containing the breakpoint.
In the following screenshot, the breakpoint was set at the address 0x00401013 (call sub_401000). To pause the execution at the breakpoint address, first, choose the debugger (such as Local Win32 Debugger), as mentioned previously, and then run the program by selecting Debugger | Start Process (or the F9 hotkey). This will execute all of the instructions before reaching the breakpoint, and will pause at the breakpoint address:

In IDA, you can set hardware and conditional breakpoints by editing the breakpoint that is already set. To set a hardware breakpoint, right-click on an existing breakpoint and select Edit breakpoint. In the dialog that pops up, check the Hardware checkbox, shown as follows. IDA allows you to set more than four hardware breakpoints, but only four of them will work; the additional hardware breakpoints will be ignored:
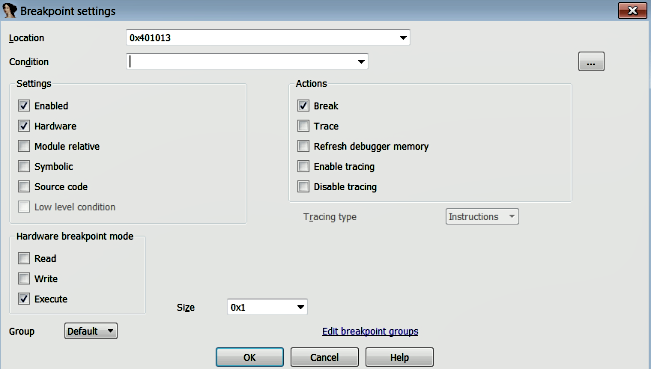
You can use hardware breakpoints to specify whether to break on execute (default), break on write, or break on read/write. The break on write and break on read/write options allow you to create memory breakpoints when the specified memory location is accessed by any instruction. This breakpoint is useful if you want to know when your program accesses a piece of data (read/write) from a memory location. The break on execute option allows you to set a breakpoint when the specified memory location is executed. In addition to specifying a mode, you must also specify a size. A hardware breakpoint's size is combined with its address to form a range of bytes for which the breakpoint may be triggered.
You can set a conditional breakpoint by specifying the condition in the condition field. The condition can be an actual condition, or IDC or IDAPython expressions. You can click on the ... button next to the condition field, which will open up the editor, where you can use IDC or IDAPython scripting language to evaluate the condition. You can find some examples of setting conditional breakpoints at https://www.hex-rays.com/products/ida/support/idadoc/1488.shtml.
You can view all of the active breakpoints by navigating to Debugger | Breakpoints | Breakpoint List (or typing Ctrl + Alt + B). You can right-click on the breakpoint entry and disable or delete the breakpoint.