
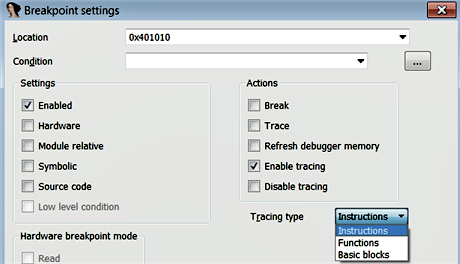
Tracing allows you to record (log) specific events while a process is executing. It can provide detailed execution information on a binary. IDA supports three types of tracing: instruction tracing, function tracing, and basic block tracing. To enable tracing in IDA, you need to set a breakpoint, then right-click on the breakpoint address and choose Edit breakpoint, which will bring up a breakpoint settings dialog. In the dialog, check the Enable tracing option, and choose the appropriate Tracing type. Then, select the debugger via the Debugger | Select debugger menu (as covered previously), and Run (F9) the program. The location field in the following screenshot specifies the breakpoint being edited, and it will be used as the starting address to perform tracing. The tracing will continue until it reaches a breakpoint, or until it reaches the end of the program. To indicate which instructions were traced, IDA highlights the instructions by color-coding them. After tracing, you can view the results of the trace by selecting Debugger | Tracing | Trace window. You can control the tracing options via Debugger | Tracing | Tracing options:
Instruction tracing records the execution of each instruction and displays the modified register values. Instruction tracing is slower, because the debugger internally single-steps through the process, to monitor and log all of the register values. Instruction tracing is useful for determining the execution flow of the program, and to know which registers were modified during the execution of each instruction. You can control the tracing by adding breakpoints.
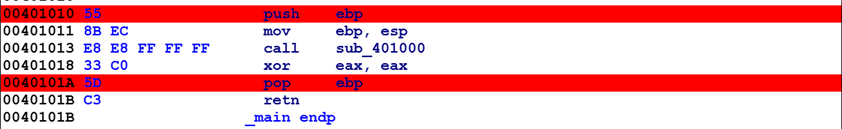
Consider the program in the following screenshot. Let's assume that you want to trace the first four instructions (which also includes a function call, in the third instruction). To do that, first, set a breakpoint at the first instruction and another breakpoint at the fifth instruction, as shown in the following screenshot. Then, edit the first breakpoint (at the address 0x00401010) and enable instruction tracing. Now, when you start debugging, the debugger traces the first four instructions (including the instructions inside the function) and pauses at the fifth instruction. If you don't specify the second breakpoint, it will trace all of the instructions:
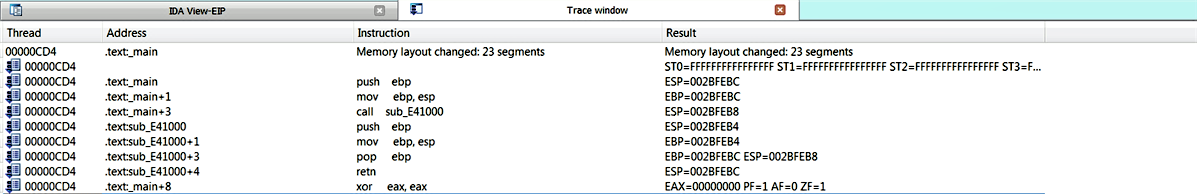
The following screenshot shows the instruction tracing events in the trace window, when the debugger paused at the fifth instruction. Note how the execution flows from main to sub_E41000, and then back to main. If you wish to trace the rest of the instructions, you can do that by resuming the paused process:
Function Tracing: This records all of the function calls and the return, no register values are logged for function trace events. Function tracing is useful for determining which functions and sub-functions are called by the program. You can perform function tracing by setting the Tracing type to Functions and following the same procedure as in instruction tracing.
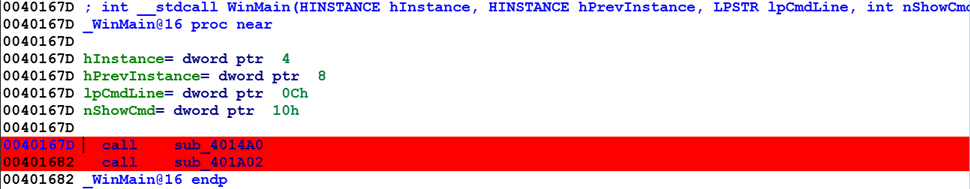
In the following example, the malware sample calls two functions. Let's suppose that we want to get a quick overview of what other functions are called by the first function call. To do that, we can set the first breakpoint at the first instruction and enable function tracing (by editing the breakpoint), and then we can set another breakpoint at the second instruction. The second breakpoint will act as the stop point (tracing will be performed until the second breakpoint is reached). The following screenshot shows both of the breakpoints:
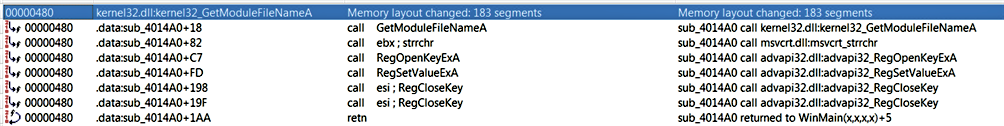
The following screenshot shows the results of function tracing. From the traced events, you can see that the function sub_4014A0 calls registry-related API functions; this tells you that the function is responsible for performing registry operations:
Sometimes, your tracing may take a long time and seem to never end; this happens if the function is not returning to its caller and is running in a loop, waiting for an event to occur. In such a case, you will still be able to see the trace logs in the trace window.
Block Tracing: IDA allows you to perform block tracing, which is useful for knowing which blocks of code were executed during runtime. You can enable block tracing by setting the Tracing type to Basic blocks. In the case of block tracing, the debugger sets the breakpoint at the last instruction of each basic block of every function, and it also sets breakpoints at any call instructions in the middle of the traced blocks. Basic block tracing is slower than normal execution, but faster than instruction or function tracing.