Table of Contents for
Python Geospatial Development - Third Edition
 Python Geospatial Development - Third Edition
Published by
Packt Publishing, 2016
Python Geospatial Development - Third Edition
Published by
Packt Publishing, 2016
- Cover
- Table of Contents
- Python Geospatial Development Third Edition
- Python Geospatial Development Third Edition
- Credits
- About the Author
- About the Reviewer
- www.PacktPub.com
- Preface
- What you need for this book
- Who this book is for
- Conventions
- Reader feedback
- Customer support
- 1. Geospatial Development Using Python
- Geospatial development
- Applications of geospatial development
- Recent developments
- Summary
- 2. GIS
- GIS data formats
- Working with GIS data manually
- Summary
- 3. Python Libraries for Geospatial Development
- Dealing with projections
- Analyzing and manipulating Geospatial data
- Visualizing geospatial data
- Summary
- 4. Sources of Geospatial Data
- Sources of geospatial data in raster format
- Sources of other types of geospatial data
- Choosing your geospatial data source
- Summary
- 5. Working with Geospatial Data in Python
- Working with geospatial data
- Changing datums and projections
- Performing geospatial calculations
- Converting and standardizing units of geometry and distance
- Exercises
- Summary
- 6. Spatial Databases
- Spatial indexes
- Introducing PostGIS
- Setting up a database
- Using PostGIS
- Recommended best practices
- Summary
- 7. Using Python and Mapnik to Generate Maps
- Creating an example map
- Mapnik concepts
- Summary
- 8. Working with Spatial Data
- Designing and building the database
- Downloading and importing the data
- Implementing the DISTAL application
- Using DISTAL
- Summary
- 9. Improving the DISTAL Application
- Dealing with the scale problem
- Performance
- Summary
- 10. Tools for Web-based Geospatial Development
- A closer look at three specific tools and techniques
- Summary
- 11. Putting It All Together – a Complete Mapping System
- Designing the ShapeEditor
- Prerequisites
- Setting up the database
- Setting up the ShapeEditor project
- Defining the ShapeEditor's applications
- Creating the shared application
- Defining the data models
- Playing with the admin system
- Summary
- 12. ShapeEditor – Importing and Exporting Shapefiles
- Importing shapefiles
- Exporting shapefiles
- Summary
- 13. ShapeEditor – Selecting and Editing Features
- Editing features
- Adding features
- Deleting features
- Deleting shapefiles
- Using the ShapeEditor
- Further improvements and enhancements
- Summary
- Index
In this final chapter, we will implement the remaining features of the ShapeEditor system. A large part of this chapter will involve the use of OpenLayers and the creation of a Tile Map Server so that we can display a map with all the shapefile's features on it and allow the user to click on a feature to select it. We'll also implement the ability to add, edit, and delete features, and we'll conclude with an exploration of how the ShapeEditor can be used to work with geospatial data and serve as the springboard for your own geospatial development efforts.
In this chapter, we will learn how to:
- Implement a Tile Map Server using Mapnik and GeoDjango
- Use OpenLayers to display a slippy map on a web page
- Write a custom click handler for OpenLayers
- Use AJAX to send requests to the server
- Perform spatial queries using GeoDjango
- Use GeoDjango's built-in editing widgets in your own application
- Edit geospatial data using GeoDjango's built-in editing widgets
- Customize the interface for GeoDjango's editing widgets
- Add and delete records in a Django web application
Let's get started with the code that lets the user select the feature to be edited.
As we discussed in the Designing ShapeEditor section of Chapter 11, Putting It All Together – a Complete Mapping System, GeoDjango's built-in map widgets can only display a single feature at a time. In order to display a map with all the shapefile's features on it, we will have to use OpenLayers directly, along with a Tile Map Server and a custom AJAX-based click handler. The basic workflow will look like this:
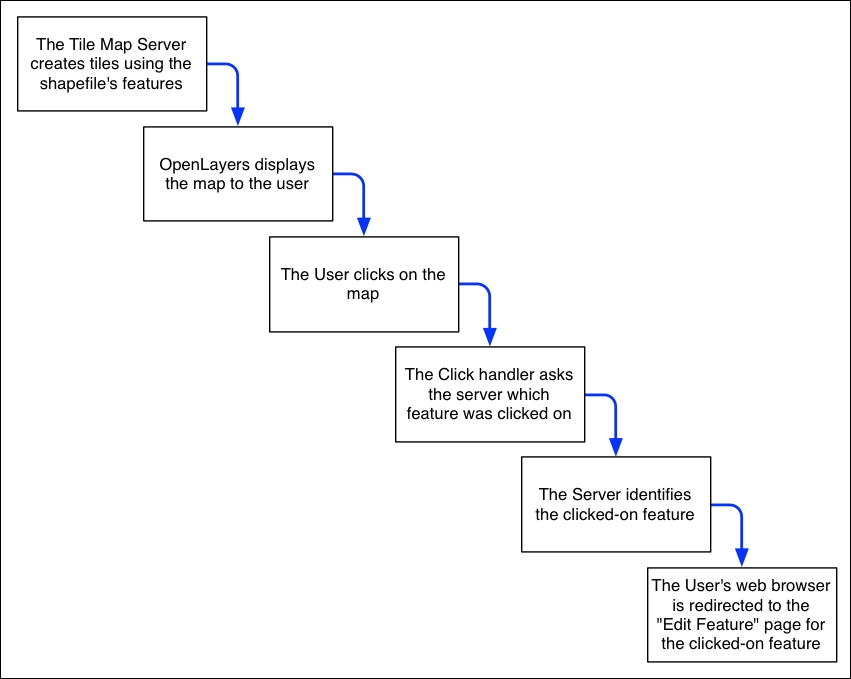
Let's start by implementing the Tile Map Server and then see what's involved in using OpenLayers, along with implementing a custom click handler and some server-side AJAX code to respond when the user clicks on the map.
As we discussed in Chapter 10, Tools for Web-based Geospatial Development, the Tile Map Service (TMS) protocol is a simple RESTful protocol for serving map Tiles. The TMS protocol includes calls to identify the various maps that can be displayed, along with information about the available map Tiles, as well as providing access to the map Tile images themselves.
Let's briefly review the terminology used by the TMS protocol:
- A Tile Map Server is the overall web server that is implementing the TMS protocol.
- A Tile Map Service provides access to a particular set of maps. There can be multiple Tile Map Services hosted by a single Tile Map Server.
- A Tile Map is a complete map of all or part of the Earth's surface, displaying a particular set of features or styled in a particular way. A Tile Map Service can provide access to more than one Tile Map.
- A Tile Set is a collection of Tiles displaying a given Tile Map at a given zoom level.
- A Tile is a single map image representing a small portion of the map being displayed by the Tile Set.
While this may sound confusing, it's actually not too complicated. We'll be implementing a Tile Map Server with just one Tile Map Service, which we'll call the ShapeEditor Tile Map Service. There will be one Tile Map for each shapefile that has been uploaded, and we'll support Tile Sets for a standard range of zoom levels. Finally, we'll use Mapnik to render the individual Tiles within the Tile Set.
Following the Django principle of breaking a large and complex system down into separate self-contained applications, we will implement the Tile Map Server as a separate application within the shapeEditor project. Start by using the cd command to set the current directory to your shapeEditor project directory, and then type the following:
python manage.py startapp tms
This creates our tms application in the top-level directory, making it a reusable application. Move the newly created directory into the shapeEditor sub-directory by typing the following command:
mv tms shapeEditor
This makes the tms application specific to our project. As usual, we won't need the admin.py and tests.py modules in the tms directory, so go ahead and delete them.
We next need to enable the application by editing our project's settings.py module and adding the following entry to the end of the INSTALLED_APPS list:
'shapeEditor.tms',
Next, we want to make our Tile Map Server's URLs available as part of the shapeEditor project. To do this, edit the top-level urls.py module (located inside the main shapeEditor directory), and add the following entry to the urlpatterns list:
url(r'^tms/', include(shapeEditor.tms.urls)),
You will also need to add the following import statement to the top of this module:
import shapeEditor.tms.urls
We now want to define the individual URLs provided by our Tile Map Server application. To do this, create a new module named urls.py inside the tms directory, and enter the following into this module:
# URLConf for the shapeEditor.tms application.

from django.conf.urls import url
from shapeEditor.tms.views import *

urlpatterns = [
    url(r'^$',
        root), # "/tms" calls root()
    url(r'^(?P<version>[0-9.]+)$',
        service), # eg, "/tms/1.0" calls service(version="1.0")
    url(r'^(?P<version>[0-9.]+)/(?P<shapefile_id>\d+)$',
        tileMap), # eg, "/tms/1.0/2" calls
                  # tileMap(version="1.0", shapefile_id=2)
    url(r'^(?P<version>[0-9.]+)/' +
        r'(?P<shapefile_id>\d+)/(?P<zoom>\d+)/' +
        r'(?P<x>\d+)/(?P<y>\d+)\.png$',
        tile), # eg, "/tms/1.0/2/3/4/5" calls
               # tile(version="1.0", shapefile_id=2, zoom=3, x=4, y=5)
]
These URL patterns are more complicated than the ones we've used in the past, because we're now extracting parameters from the URL. For example, consider the following URL:
http://127.0.0.1:8000/tms/1.0
Because of the way our URL modules are set up, the first part of this URL (http://127.0.0.1:8000/tms/) tells Django that this URL will be handled by the tms.urls module. The remainder of the URL, 1.0, will be matched by the second regular expression in our urls.py module:
^(?P<version>[0-9.]+)$
This regular expression will extract the 1.0 portion of the URL and assign it to a parameter named version. This parameter is then passed on to the view function associated with this URL pattern, as follows:
service(version="1.0")
In this way, each of our URL patterns maps an incoming RESTful URL to the appropriate view function within our tms application. The included comments provide an example of how the regular expressions will map to the view functions.
Let's now set up these view functions. Edit the views.py module inside the tms directory, and add the following to this module:
from django.http import HttpResponse

def root(request):
    return HttpResponse("Tile Map Server")

def service(request, version):
    return HttpResponse("Tile Map Service")

def tileMap(request, version, shapefile_id):
    return HttpResponse("Tile Map")

def tile(request, version, shapefile_id, zoom, x, y):
    return HttpResponse("Tile")
Obviously, these are only placeholder view functions, but they give us the basic structure for our Tile Map Server.
To check that this works, launch the ShapeEditor server by running the python manage.py runserver command, and point your web browser to http://127.0.0.1:8000/tms. You should see the text you entered into your placeholder root() view function.
Let's make that top-level view function do something useful. Go back to the tms application's views.py module, and change the root() function to look like the following:
def root(request):
    try:
        baseURL = request.build_absolute_uri()
        xml = []
        xml.append('<?xml version="1.0" encoding="utf-8" ?>')
        xml.append('<Services>')
        xml.append('  <TileMapService ' +
                   'title="ShapeEditor Tile Map Service" ' +
                   'version="1.0" href="' + baseURL + '/1.0"/>')
        xml.append('</Services>')
        response = "\n".join(xml)
        return HttpResponse(response, content_type="text/xml")
    except:
        traceback.print_exc()
        return HttpResponse("Error")
You'll also need to add the following import statement to the top of the module:
import traceback
This view function returns an XML-format response describing the one and only Tile Map Service supported by our TMS server. This Tile Map Service is identified by a version number, 1.0 (Tile Map Services are typically identified by version number). If you now go to http://127.0.0.1:8000/tms, you'll see the TMS response displayed in your web browser:
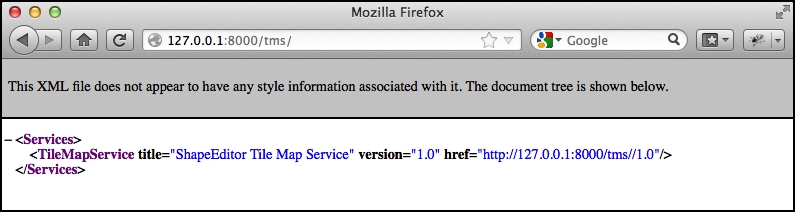
As you can see, this provides a list of the Tile Map Services that this TMS server provides. OpenLayers will use this to access our Tile Map Service.
Note
Error handling
Notice that we've wrapped our TMS view function in a try...except statement and used the traceback standard library module to print out the exception if anything goes wrong. We're doing this because our code will be called directly by OpenLayers using AJAX; Django helpfully handles exceptions and returns an HTML error page to the caller, but in this case, OpenLayers won't display that page if there is an error in your code. Instead, all you'll see are broken image icons instead of a map, and the error itself will remain a mystery.
By wrapping our Python code in a try...except statement, we can catch any exceptions in our Python code and print them out. This will cause the error to appear in Django's web server log, so we can see what went wrong. This is a useful technique to use whenever you write AJAX request handlers in Python.
We're now ready to implement the Tile Map Service itself. Edit the view.py module again, and change the service() function to look like this:
def service(request, version):
    try:
        if version != "1.0":
            raise Http404

        baseURL = request.build_absolute_uri()
        xml = []
        xml.append('<?xml version="1.0" encoding="utf-8" ?>')
        xml.append('<TileMapService version="1.0" services="' +
                   baseURL + '">')
        xml.append('  <Title>ShapeEditor Tile Map Service' +
                   '</Title>')
        xml.append('  <Abstract></Abstract>')
        xml.append('  <TileMaps>')
        for shapefile in Shapefile.objects.all():
            id = str(shapefile.id)
            xml.append('    <TileMap title="' +
                       shapefile.filename + '"')
            xml.append('             srs="EPSG:4326"')
            xml.append('             href="'+baseURL+'/'+id+'"/>')
        xml.append('  </TileMaps>')
        xml.append('</TileMapService>')
        response = "\n".join(xml)
        return HttpResponse(response, content_type="text/xml")
    except:
        traceback.print_exc()
        return HttpResponse("Error")
You'll also need to add the following import statements to the top of the module:
from django.http import Http404
from shapeEditor.shared.models import Shapefile
Notice that this function raises an Http404 exception if the version number is wrong. This exception tells Django to return an HTTP "not found" error, which is the standard error response when an incorrect URL has been used.
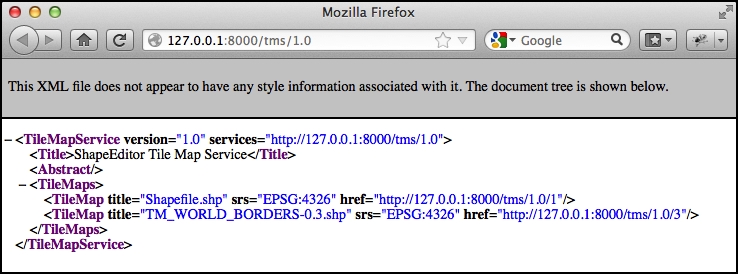
Assuming the version number is correct, we iterate over the various Shapefile objects in the database, listing each uploaded shapefile as a Tile Map.
If you save this file and enter http://127.0.0.1:8000/tms/1.0 into your web browser, you should see a list of the available Tile Maps, in XML format:
We next need to implement the tileMap() function to display the various Tile Sets available for a given Tile Map. Before we can do this, though, we're going to have to learn a bit about the notion of
zoom levels.
As we have seen, a slippy map lets the user zoom in and out to view the map's contents. This zooming is done by controlling the map's zoom level. Typically, a zoom level is specified as a simple number: zoom level 0 is when the map is fully zoomed out, zoom level 1 is when the map is zoomed in once, and so on.
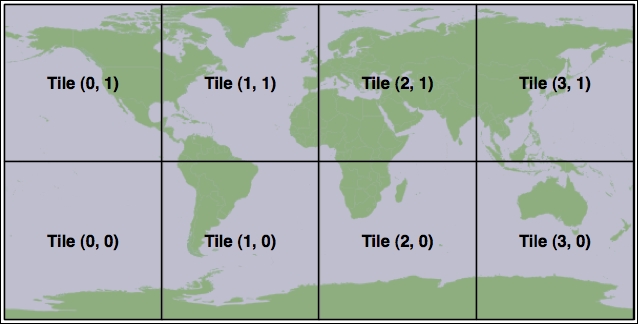
Let's start by considering the map when it is zoomed out completely (in other words, zoom level 0). In this case, we want the entire Earth's surface to be covered by just two map Tiles:
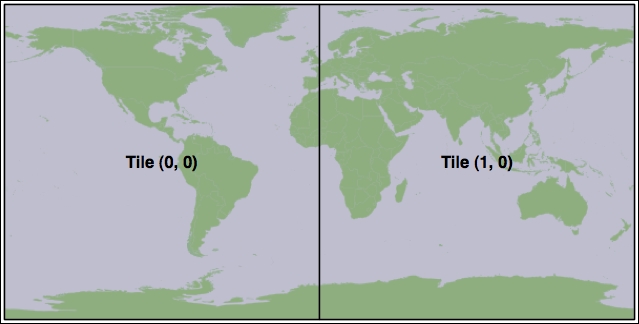
Each map Tile at this zoom level would cover 180 degrees of latitude and longitude. If each Tile were 256 pixels square, this would mean that each pixel would cover 180 / 256 = 0.703125 map units where, in this case, a map unit is a degree of latitude or longitude. This number is going to be very important when it comes to calculating the Tile Maps.
Now, whenever we zoom in (for example, by going from zoom level 0 to zoom level 1), the width and height of the visible area are halved. For example, at zoom level 1, the Earth's surface would be displayed as the following series of eight Tiles:
Following this pattern, we can calculate the number of map units covered by a single pixel on the map, for a given zoom level, using the following formula:
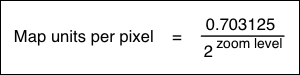
Since we'll be using this formula in our TMS server, let's go ahead and add the following code to the end of our tms/views.py module:
def _unitsPerPixel(zoomLevel):
return 0.703125 / math.pow(2, zoomLevel)You'll also need to add an import math statement to the top of the file.
Next, we need to add some constants to the top of the module to define the size of each map Tile and how many zoom levels we support:
MAX_ZOOM_LEVEL = 10
TILE_WIDTH     = 256
TILE_HEIGHT    = 256
With all this, we're finally ready to implement the tileMap() function to return information about the available Tile Sets for a given shapefile's Tile Map. Edit this function to look like the following:
def tileMap(request, version, shapefile_id):
    if version != "1.0":
        raise Http404

    try:
        shapefile = Shapefile.objects.get(id=shapefile_id)
    except Shapefile.DoesNotExist:
        raise Http404

    try:
        baseURL = request.build_absolute_uri()
        xml = []
        xml.append('<?xml version="1.0" encoding="utf-8" ?>')
        xml.append('<TileMap version="1.0" ' +
                   'tilemapservice="' + baseURL + '">')
        xml.append('  <Title>' + shapefile.filename + '</Title>')
        xml.append('  <Abstract></Abstract>')
        xml.append('  <SRS>EPSG:4326</SRS>')
        xml.append('  <BoundingBox minx="-180" miny="-90" ' +
                   'maxx="180" maxy="90"/>')
        xml.append('  <Origin x="-180" y="-90"/>')
        xml.append('  <TileFormat width="' + str(TILE_WIDTH) +
                   '" height="' + str(TILE_HEIGHT) + '" ' +
                   'mime-type="image/png" extension="png"/>')
        xml.append('  <TileSets profile="global-geodetic">')
        for zoomLevel in range(0, MAX_ZOOM_LEVEL+1):
            href = baseURL + "/{}".format(zoomLevel)
            unitsPerPixel = "{}".format(_unitsPerPixel(zoomLevel))
            order = "{}".format(zoomLevel)

            xml.append('    <TileSet href="' + href + '" ' +
                       'units-per-pixel="'+  unitsPerPixel + '"' +
                       ' order="' + order + '"/>')
        xml.append('  </TileSets>')
        xml.append('</TileMap>')
        response = "\n".join(xml)
        return HttpResponse(response, content_type="text/xml")
    except:
        traceback.print_exc()
        return HttpResponse("Error")
As you can see, we start with some basic error checking on the version and shapefile ID and then iterate through the available zoom levels to provide information about the available Tile Sets. If you save your changes and enter http://127.0.0.1:8000/tms/1.0/2 into your web browser, you should see the following information about the Tile Map for the shapefile object with record ID 2:
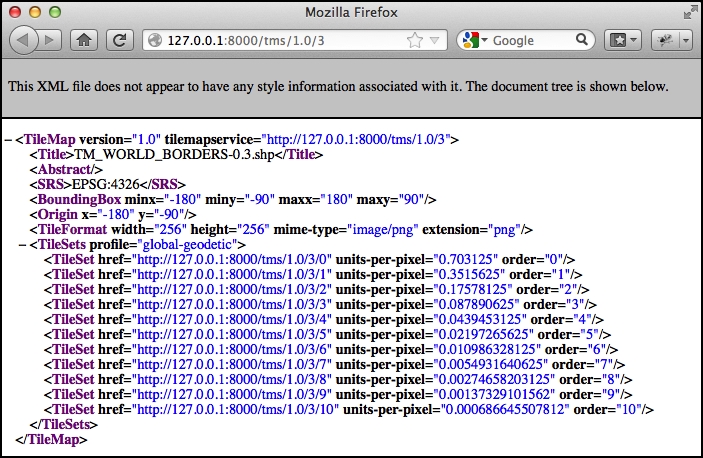
Notice that we provide a total of eleven zoom levels, from 0 to 10, with an appropriately calculated units-per-pixel value for each zoom level.
We have now implemented three of the four view functions required to implement our own Tile Map Server. For the final function, tile(), we are going to write our own Tile renderer. The tile() function accepts a Tile Map Service version, a shapefile ID, a zoom level, and the X and Y coordinates of the desired Tile:
def tile(request, version, shapefile_id, zoom, x, y):
    ...
This function needs to generate the appropriate map Tile and return the rendered image to the caller. Before we implement this function, let's take a step back and think about what the map rendering should look like.
We want the map to include the outline of the various features within the given shapefile. However, by themselves, these features won't look very meaningful:
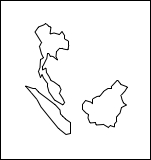
It isn't until these features are shown in context, by displaying a base map behind the features, that we can see what they are supposed to represent:
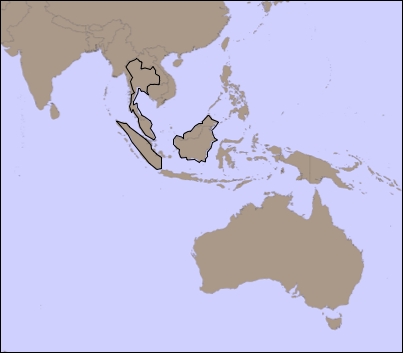
Because of this, we're going to have to display a base map on which the features themselves are drawn. Let's build that base map, and then we can use this, along with the shapefile's features, to render the map Tiles.
For our base map, we're going to use the World Borders Dataset we've used several times throughout this book. While this dataset doesn't look great when zoomed right in, it works well as a base map on which we can draw the shapefile's features.
We'll start by creating a database model to hold the base map's data. Because the base map will be specific to our Tile Map Server application, we want to add a database table specific to this application. To do this, edit the models.py module inside the tms application directory, and change this file to look like the following:
from django.contrib.gis.db import models

class BaseMap(models.Model):
    name     = models.CharField(max_length=50)
    geometry = models.MultiPolygonField(srid=4326)

    objects = models.GeoManager()

    def __str__(self):
return self.nameAs you can see, we're storing the country names as well as their geometries, which happen to be MultiPolygons. Now, from the command line, cd into your project directory and type the following commands:
% python manage.py makemigrations tms
% python manage.py migrate tms
This will create the database table used by the BaseMap object.
Now that we have somewhere to store the base map, let's import the data. Place a copy of the World Borders Dataset shapefile somewhere convenient, and type the following into the command-line window you had open previously:
% python manage.py shell
This runs a Python interactive shell with your project's settings and paths installed. Now create the following variable, replacing the text with the absolute path to the World Borders Dataset's shapefile:
>>> shapefile = "/path/to/TM_WORLD_BORDERS-0.3.shp"
Then, type the following:
>>> from django.contrib.gis.utils import LayerMapping
>>> from shapeEditor.tms.models import BaseMap
>>> mapping = LayerMapping(BaseMap, shapefile, {'name' : "NAME", 'geometry' : "MULTIPOLYGON"}, transform=False, encoding="iso-8859-1")
>>> mapping.save(strict=True, verbose=True)
We're using GeoDjango's LayerMapping module to import the data from this shapefile into our database. The various countries will be displayed as they are imported, which will take a few seconds.
Once this has been done, you can check the imported data by typing commands into the interactive shell, for example:
>>> print(BaseMap.objects.count())
246
>>> print(BaseMap.objects.all())
[<BaseMap: Antigua and Barbuda>, <BaseMap: Algeria>, <BaseMap: Azerbaijan>, <BaseMap: Albania>, <BaseMap: Armenia>, <BaseMap: Angola>, <BaseMap: American Samoa>, <BaseMap: Argentina>, <BaseMap: Australia>, <BaseMap: Bahrain>, <BaseMap: Barbados>, <BaseMap: Bermuda>, <BaseMap: Bahamas>, <BaseMap: Bangladesh>, <BaseMap: Belize>, <BaseMap: Bosnia and Herzegovina>, <BaseMap: Bolivia>, <BaseMap: Burma>, <BaseMap: Benin>, <BaseMap: Solomon Islands>, '...(remaining elements truncated)...']
Feel free to play some more if you want; the Django tutorial includes several examples of exploring your data objects using the interactive shell. When you are done, press Ctrl + D to exit.
Because this base map is going to be part of the ShapeEditor project itself (the application won't run without it), it would be good if Django could treat that data as part of the project's source code. That way, if we ever had to rebuild the database from scratch, the base map would be reinstalled automatically.
Django allows you to do this by creating what is known as a fixture. A fixture is a set of data that can be loaded into the database on demand, either manually, or automatically when the database is initialized. We'll save our base map data into a fixture so that Django can reload that data as required.
Create a directory named fixtures within the tms application directory. Then, in a terminal window, cd into the shapeEditor project directory and type the following:
% python manage.py dumpdata tms > shapeEditor/tms/fixtures/initial_data.json
This will create a fixture named initial_data.json for the tms application. As the name suggests, the contents of this fixture will be loaded automatically if Django ever has to reinitialize the database.
Now that we have a base map, let's use it to implement our Tile-rendering code.
Using our knowledge of Mapnik, we're going to implement the TMS server's tile() function. Our generated map will consist of two layers: a
base layer showing the base map and a feature layer
showing the features in the imported shapefile. Since all our data is stored in a PostGIS database, we'll be using a mapnik.PostGIS data source for both layers.
Our tile() function will involve five steps:
- Parsing the query parameters.
- Setting up the map.
- Defining the base layer.
- Defining the feature layer.
- Rendering the map.
Let's work through each of these in turn.
Edit the tms application's views.py module, and delete the dummy code we had in the tile() function. We'll add our parsing code one step at a time, starting with some basic error-checking code to ensure that the version number is correct and that the shapefile exists, and once again wrapping our code in a try...except statement to catch typos and other errors:
try:
    if version != "1.0":
        raise Http404

    try:
        shapefile = Shapefile.objects.get(id=shapefile_id)
    except Shapefile.DoesNotExist:
        raise Http404
We now need to convert the query parameters (which Django passes to us as strings) into integers so that we can work with them:
    zoom = int(zoom)
    x    = int(x)
    y    = int(y)
We can now check that the zoom level is correct:
    if zoom < 0 or zoom > MAX_ZOOM_LEVEL:
        raise Http404
Our next step is to convert the supplied x and y parameters into the minimum and maximum latitude and longitude values covered by the Tile. This requires us to use the _unitsPerPixel() function we defined earlier to calculate the amount of the Earth's surface covered by the Tile for the current zoom level:
    xExtent = _unitsPerPixel(zoom) * TILE_WIDTH
    yExtent = _unitsPerPixel(zoom) * TILE_HEIGHT

    minLong = x * xExtent - 180.0
    minLat  = y * yExtent - 90.0
    maxLong = minLong + xExtent
    maxLat  = minLat  + yExtent
Finally, we can add some rudimentary error checking to ensure that the Tile's coordinates are valid:
    if (minLong < -180 or maxLong > 180 or
        minLat < -90 or maxLat > 90):
raise Http404We're now ready to create the mapnik.Map object to represent the map. This is straightforward:
    map = mapnik.Map(TILE_WIDTH, TILE_HEIGHT,
                     "+proj=longlat +datum=WGS84")
map.background = mapnik.Color("#7391ad")We now want to define the layer that draws our base map. To do this, we have to set up a mapnik.PostGIS data source for the layer:
    dbSettings = settings.DATABASES['default']
    datasource = \
        mapnik.PostGIS(user=dbSettings['USER'],
                       password=dbSettings['PASSWORD'],
                       dbname=dbSettings['NAME'],
                       table='tms_basemap',
                       srid=4326,
                       geometry_field="geometry",
                       geometry_table='tms_basemap')
As you can see, we get the name of the database, the username, and the password from our project's settings module. We then create a PostGIS data source using these settings. With this data source, we can now create the base layer itself:
    baseLayer = mapnik.Layer("baseLayer")
    baseLayer.datasource = datasource
    baseLayer.styles.append("baseLayerStyle")
We now need to set up the layer's style. In this case, we'll use a single rule with two symbolizers: a PolygonSymbolizer, which draws the interior of the base map's polygons, and a LineSymbolizer to draw the polygon outlines:
    rule = mapnik.Rule()

    rule.symbols.append(
        mapnik.PolygonSymbolizer(mapnik.Color("#b5d19c")))
    rule.symbols.append(
        mapnik.LineSymbolizer(mapnik.Color("#404040"), 0.2))

    style = mapnik.Style()
    style.rules.append(rule)
Finally, we can add the base layer and its style to the map:
    map.append_style("baseLayerStyle", style)
map.layers.append(baseLayer)Our next task is to add another layer to draw the shapefile's features onto the map. Once again, we'll set up a mapnik.PostGIS data source for the new layer:
    geometry_field = \
        utils.calc_geometry_field(shapefile.geom_type)

    query = '(select ' + geometry_field \
          + ' from "shared_feature" where' \
          + ' shapefile_id=' + str(shapefile.id) + ') as geom'

    datasource = \
        mapnik.PostGIS(user=dbSettings['USER'],
                       password=dbSettings['PASSWORD'],
                       dbname=dbSettings['NAME'],
                       table=query,
                       srid=4326,
                       geometry_field=geometry_field,
                       geometry_table='shared_feature')
In this case, we are calling utils.calc_geometry_field() to see which field in the shared_feature table contains the geometry we're going to display.
We're now ready to create the new layer itself:
    featureLayer = mapnik.Layer("featureLayer")
    featureLayer.datasource = datasource
    featureLayer.styles.append("featureLayerStyle")
Next, we want to define the styles used by the feature layer. As before, we'll have just a single rule, but in this case, we'll use different symbolizers depending on the type of feature we are displaying:
    rule = mapnik.Rule()

    if shapefile.geom_type in ["Point", "MultiPoint"]:
        rule.symbols.append(mapnik.PointSymbolizer())
    elif shapefile.geom_type in ["LineString", "MultiLineString"]:
        rule.symbols.append(
            mapnik.LineSymbolizer(mapnik.Color("#000000"), 0.5))
    elif shapefile.geom_type in ["Polygon", "MultiPolygon"]:
        rule.symbols.append(
            mapnik.PolygonSymbolizer(mapnik.Color("#f7edee")))
        rule.symbols.append(
            mapnik.LineSymbolizer(mapnik.Color("#000000"), 0.5))

    style = mapnik.Style()
    style.rules.append(rule)
Finally, we can add our new feature layer to the map:
    map.append_style("featureLayerStyle", style)
map.layers.append(featureLayer)We looked at using Mapnik to render map images in Chapter 7, Using Python and Mapnik to Generate Maps. The basic process of rendering a map Tile is the same, except that we won't be storing the results into an image file on disk. Instead, we'll create a mapnik.Image object, convert it into raw image data in PNG format, and return that data back to the caller using an HttpResponse object:
    map.zoom_to_box(mapnik.Box2d(minLong, minLat,
                                 maxLong, maxLat))
    image = mapnik.Image(TILE_WIDTH, TILE_HEIGHT)
    mapnik.render(map, image)
    imageData = image.tostring('png')

    return HttpResponse(imageData, content_type="image/png")
All that's left now is to add our error-catching code to the end of the function:
except:
    traceback.print_exc()
    return HttpResponse("Error")
That completes the implementation of our Tile Map Server's tile() function. Let's tidy up and do some testing.
Because we've referred to some new modules in our views.py module, we'll have to add some extra import statements to the top of the file:
import mapnik
from django.conf import settings
from shapeEditor.shared import utils
In theory, our Tile Map Server should now be ready to go. Let's test it out. If you don't currently have the Django web server running, cd into the shapeEditor project directory and type the following:
% python manage.py runserver
Start up your web browser and enter the following URL into the address bar:
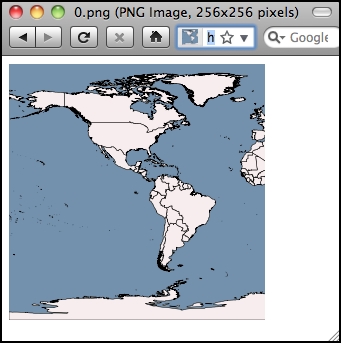
http://127.0.0.1:8000/tms/1.0/2/0/0/0.png
All going well, you should see a 256 x 256 pixel map Tile appear in your web browser:
Tip
Problems?
If an error occurs, there are two likely causes: you might have made a mistake typing in the code, or you might have gotten the record ID of the shapefile wrong. Check the web server log in the terminal window you used to run the python manage.py runserver command: when a Python exception occurs, the traceback will be printed out in this window. This will tell you if you have a syntax or other error, or if an Http404 exception was raised.
If you do get an Http404 exception, it's most likely because you're using the wrong record ID for the shapefile. The URL is structured like this:
http://path/to/tms/<version>/<shapefile_id>/<zoom>/<x>/<y>.png
If you've been working through these chapters in order, the record ID of the World Borders Dataset shapefile you imported earlier should be 2, but if you've imported other shapefiles in the meantime or created more shapefile records while playing with the admin interface, you may need to use a different record ID. To see what record ID a given shapefile has, go to http://127.0.0.1:8000 and click on the Edit hyperlink for the desired shapefile. You'll see a Page Not Found error, but the final part of the URL will be the record ID of the shapefile. Replace the record ID in the previous URL with the correct ID, and the map Tile should appear.
Once you've reached the point of seeing the previous image in your web browser, you deserve a pat on the back—congratulations, you have just implemented your own working Tile Map Server!
Now that we have our TMS server up and running, we can use the OpenLayers library to display the rendered map Tiles within a slippy map. This slippy map will be used within our "Edit Shapefile" view function to display all the shapefile's features, allowing the user to select a feature within the shapefile to edit.
Let's implement this "Edit Shapefile" view, which we'll call edit_shapefile(). Edit the urls.py module within the main shapeEditor directory, and add the following entry to the end of the urlpatterns list:
    url(r'^edit/(?P<shapefile_id>\d+)$',
        shapeEditor.shapefiles.views.edit_shapefile)
This will pass any incoming URLs of the form /edit/N to the edit_shapefile() view function within our shapeEditor.shapefiles application.
Let's implement this function. Edit the shapeEditor.shapefiles application's views.py module and add the following code to the end of this file:
def edit_shapefile(request, shapefile_id):
    try:
        shapefile = Shapefile.objects.get(id=shapefile_id)
    except Shapefile.DoesNotExist:
        return HttpResponseNotFound()

    tms_url = "http://" + request.get_host() + "/tms/"

    return render(request, "select_feature.html",
                  {'shapefile' : shapefile,
                   'tms_url'   : tms_url})
As you can see, we obtain the desired Shapefile object, calculate the URL used to access our TMS server, and pass both of these values to a template called select_feature.html. This template is where all the hard work will take place.
Now, we need to write the template. Start by creating a new file named select_feature.html in the shapeEditor.shapefiles application's templates directory, and enter the following into this file:
<html>
  <head>
    <title>ShapeEditor</title>
    <style type="text/css">
      div#map {
        width:  600px;
        height: 400px;
        border: 1px solid #ccc;
      }
    </style>
  </head>
  <body>
    <h1>Edit Shapefile</h1>
    <b>Please choose a feature to edit</b>
    <br/>
    <div id="map" class="map"></div>
    <br/>
    <div style="margin-left:20px">
      <button type="button"
              onClick='window.location="/";'>
        Cancel
      </button>
    </div>
  </body>
</html>
This is only the basic outline for this template, but it gives us something to work with. With the Django development server running (python manage.py runserver in a terminal window), go to http://127.0.0.1:8000 and click on the Edit hyperlink for a shapefile. You should see the basic outline for the select feature page:
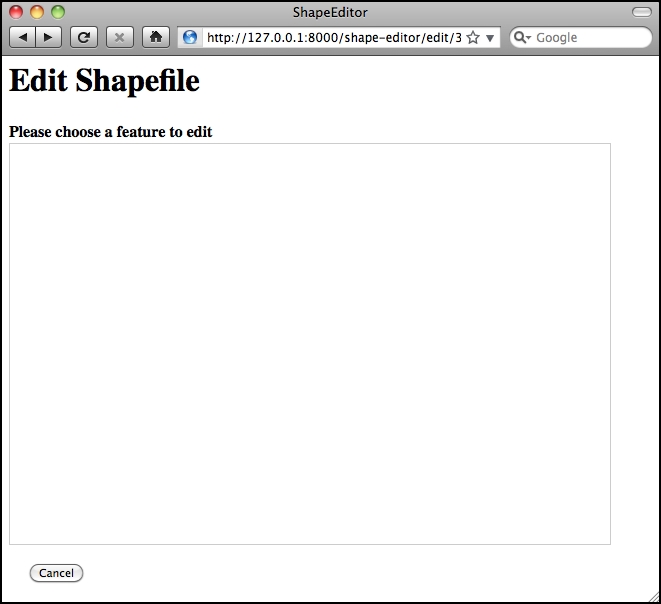
Notice that we've created a <div> element to hold the OpenLayers map, and we use a CSS stylesheet to give the map a fixed size and border. The map itself isn't being displayed yet because we haven't written the JavaScript code needed to launch OpenLayers. Let's do that now.
Add the following to the <head> section of your template:
<link rel="stylesheet"
      href="http://openlayers.org/en/v3.10.1/css/ol.css"
      type="text/css">
<script src="http://openlayers.org/en/v3.10.1/build/ol.js"
        type="text/javascript">
</script>
<script src="http://code.jquery.com/jquery-2.1.4.min.js"
        type="text/javascript">
</script>
<script type="text/javascript">
  function init() {
  }
</script>
Also, change the <body> tag definition to look like this:
<body onload="init()">
Notice that there are three <script> tags: the first loads the OpenLayers.js library from the http://openlayers.org web site, the second one loads the JQuery library from http://code.jquery.com (we'll need this later), and the final <script> tag is used to hold the JavaScript code that we'll write to create the map. We've also defined a JavaScript function called init(), which will be called when the page is loaded.
Let's implement that initialization function. The following code should all be inserted between the function init() { line and its corresponding }, which marks the end of the function.
We'll start by defining a variable named url_template containing the URL to use to access our map Tiles:
var url_template = '{{ tms_url }}/1.0/{{ shapefile.id }}/{z}/{x}/{y}.png';Notice that we use Django's special {{ … }} syntax to embed the URL of our Tile Map Server and the ID of the shapefile into our template. The strings {z}, {x}, and {y} at the end of our template will act as placeholders that we will replace with the zoom level and coordinate for the desired map Tile.
We next need to define the map projection OpenLayers should use for this map:
var projection = ol.proj.get('EPSG:4326');Remember that EPSG code 4326 represents unprojected latitude and longitude coordinates on the WGS84 datum; this is the projection used by our underlying map data.
Our next step is to define an OpenLayers Source object, which represents the source of the map data to be displayed. Unfortunately, OpenLayers version 3 does not include a built-in source for Tile Map Servers, so we have to do a bit more work to obtain the map data from our TMS server:
var source = new ol.source.XYZ({
    crossOrigin: 'null',
    wrapX: false,
    projection: projection,
    tileUrlFunction: function(tileCoord) {
      var z = tileCoord[0] - 1;
      var x = tileCoord[1];
      var y = Math.pow(2, z) + tileCoord[2];
      return url_template.replace('{z}', z.toString())
                         .replace('{x}', x.toString())
                         .replace('{y}', y.toString());
    },
  });
As you can see, we define a tileUrlFunction to calculate the URL to use to obtain a given map Tile. We convert the zoom level and the X and Y coordinates supplied by OpenLayers into the values required by our TMS server, and we then use JavaScript's replace() function to replace the placeholders within our URL template with these calculated values.
Now that we have the source defined, we can create an OpenLayers Tile Layer object to retrieve map Tiles from this source:
  var layer = new ol.layer.Tile({source: source,
                                 projection: projection,
                                });
We then set up an OpenLayers View object to set the initial zoom and display point for our map:
  var view = new ol.View({center: [0, 0],
                          zoom: 1,
                          projection: projection,
                         });
Finally, we define an OpenLayers Map object, which will display our one and only map layer:
  var map = new ol.Map({target: "map",
                        layers: [layer],
                        view: view});
}
Notice that we pass in the ID of our <div> element as the target parameter. This tells OpenLayers to display the map within the <div> element with that ID.
This completes the implementation of our init() function. Let's test what we've written. Save your changes, start up the Django web server if it isn't already running, and point your web browser to http://127.0.0.1:8000. Click on the Edit hyperlink for the shapefile you imported, and you should see a working slippy map:
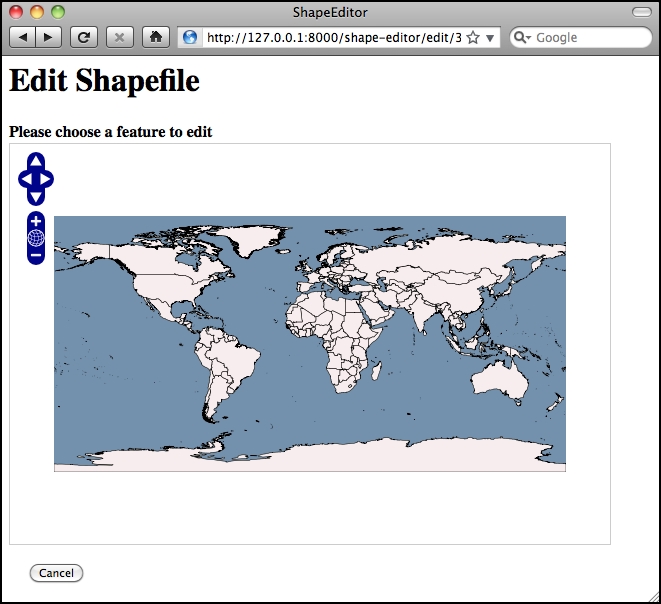
You can zoom in and out, pan around, and click to your heart's content. Of course, nothing actually works yet (apart from the Cancel button), but we have got a slippy map working with our Tile Map Server and the OpenLayers JavaScript widget. That's quite an achievement!
Tip
What if it doesn't work?
If the map isn't being shown for some reason, there are several possible causes. First, check the Django web server log, as we are printing any Python exceptions there. If that doesn't reveal the problem, look at your web browser's error console window to see whether there are any errors at the JavaScript level. Because we are now writing JavaScript code, error messages will appear within the web browser rather than in Django's server log. In Firefox, you can view JavaScript errors by selecting the Error Console item from the Tools menu. Other browsers have similar windows for showing JavaScript errors.
JavaScript debugging can be quite tricky, even for people experienced with developing web-based applications. If you do get stuck, you may find the following article helpful: http://www.webmonkey.com/2010/02/javascript_debugging_for_beginners
When the user clicks on the map, we want to intercept that mouse click, identify the map coordinate that the user clicked on, and then ask the server to identify the clicked-on feature (if any). To intercept mouse clicks, we will add an event listener function to the map. Doing this in OpenLayers is easy: simply edit your select_feature.html template and add the following Javascript code to the end of your init() function:
  map.on("singleclick", function(e) {
    Alert("Click");
  });
This will cause the Click message to be displayed whenever the user clicks on the map. To test it out, reload the Edit Shapefile web page and try clicking on the map. You should see the following message:
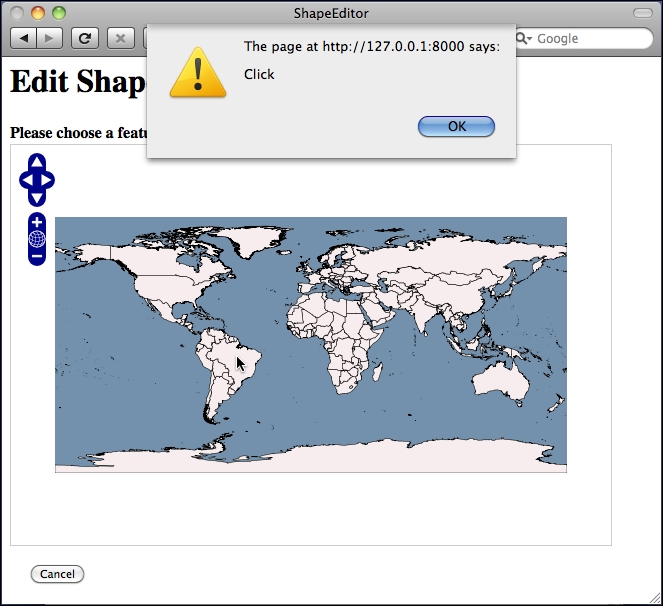
So far, so good. Notice that our click handler only intercepts single clicks; if you double-click on the map, it will still zoom in.
Let's now implement the real code to respond to the user's mouse click. When the user clicks on the map, we're going to send the clicked-on latitude and longitude value to the server using an AJAX request. The server will return the URL of the "Edit Shapefile" page for the clicked-on feature or an empty string if no feature was clicked on. If a URL is returned, we'll then redirect the user's web browser to that URL.
To make the AJAX call, we're going to use the JQuery library's jQuery.ajax() function. Replace the alert("Click"); line with the following:
  var request = jQuery.ajax({
        url     : "/find_feature",
        data    : {shapefile_id : {{ shapefile.id }},
                   latitude     : e.coordinate[1],
                   longitude    : e.coordinate[0]},
        success : function(response) {
                    if (response != "") {
                      window.location.href = response;
                    }
                  }
  });
As you can see, the jQuery.ajax() function accepts the URL to send the request to (in the url entry), a set of parameters to send to the server (in the data entry), and a function to call when the response is received (in the success entry). When we make the request, the query parameters sent to the server will consist of the record ID of the shapefile and the clicked-on latitude and longitude values; when the response is received, our success function will be called with the data returned by the server.
Now that we've finished implementing our HTML template and the JavaScript code to make it work, let's now write the Python code to actually find a feature based on where the user clicked.
We now need to write the view function that receives the AJAX request, checks to see which feature was clicked on (if any), and returns a suitable URL to use to redirect the user's web browser to the "edit" page for that clicked-on feature. To implement this, we're going to make use of GeoDjango's spatial query functions.
Let's start by adding the "Find Feature" view itself. To do this, edit the shapefiles.views module again, and add the following placeholder code:
def find_feature(request):
    return HttpResponse("")
Returning an empty string tells our AJAX callback function that no feature was clicked on. We'll replace this with some proper spatial queries shortly. First, though, we need to add a URL pattern so that incoming requests will get forwarded to the find_feature() view function. Open the top-level urls.py module and add the following entry to the URL pattern list:
url(r'^find_feature$',
    shapeEditor.shapefiles.views.find_feature),
You should now be able to run the ShapeEditor, click on the Edit hyperlink for an uploaded shapefile, see a map showing the various features within the shapefile, and click somewhere on the map. In response, the system should do—absolutely nothing! This is because our find_feature() function is returning an empty string, so the system thinks that the user didn't click on a feature and so ignores the mouse click.
Note
In this case, "absolutely nothing" is good news. As long as no error messages are being displayed either at the Python or JavaScript level, the AJAX code is running correctly. So go ahead and try this, even though nothing happens, just to make sure that you haven't got any bugs in your code. You should see the AJAX calls in the list of incoming HTTP requests being received by the server.
Before we implement the find_feature() function, let's take a step back and think what it means for the user to click on a feature's geometry. The ShapeEditor supports a complete range of possible geometry types: Point, LineString, Polygon, MultiPoint, MultiLineString, MultiPolygon, and GeometryCollection. Seeing if the user clicked on a Polygon or MultiPolygon feature is straightforward enough: we simply check whether the clicked-on point is inside the polygon's bounds. But because lines and points have no interior (their area will always be zero), a given coordinate could never be inside a Point or a LineString geometry. It might get infinitely close, but the user can never actually click inside a Point or a LineString.
Consider the following spatial query:
SELECT * FROM features WHERE ST_Contains(feature.geometry, clickPt)
This is not going to work, because the click point can never be inside a Point or a LineString geometry. Instead, we have to allow for the situation where the user clicks close to the feature rather than within it. To do this, we'll calculate a search radius, in map units, and then use the DWithin spatial query function to find all features within the given search radius of the clicked-on point.
Unfortunately, we have a problem here. When we used the ST_DWithin spatial query in Chapter 8, Working with Spatial Data, we used it to calculate all features within a given number of meters of a given point. We could do this because the features we were working with were stored in a PostGIS Geography column. In this case, however, our spatial data is not stored in a Geography column. Instead, it is stored in a Geometry column. This means that the search radius we supply to Django's DWithin spatial query function needs to be measured in degrees of latitude and longitude rather than in meters.
Because the user can click anywhere on the Earth's surface, we will have to calculate the search radius based on the user's click location. This is because the relationship between map coordinates (latitude/longitude values) and actual distances on the Earth's surface can vary widely depending on whereabouts on the Earth the user clicked: a degree at the equator equals a distance of 111 kilometers, while a degree in Sweden is only half that much.
To ensure that we have a consistent search radius everywhere in the world, we will use the PROJ.4 library to calculate the search radius in map units given the clicked-on location and a desired linear distance. Let's add this function to our shared.utils module:
def calc_search_radius(latitude, longitude, distance):
    geod = pyproj.Geod(ellps="WGS84")

    x,y,angle = geod.fwd(longitude, latitude, 0, distance)
    radius = y-latitude

    x,y,angle = geod.fwd(longitude, latitude, 90, distance)
    radius = max(radius, x-longitude)

    x,y,angle = geod.fwd(longitude, latitude, 180, distance)
    radius = max(radius, latitude-y)

    x,y,angle = geod.fwd(longitude, latitude, 270, distance)
    radius = max(radius, longitude-x)

    return radius
This function calculates the distance, in map units, of a given linear distance measured in meters. It calculates the lat/long coordinates for four points directly north, south, east, and west of the starting location and the given number of meters away from that point. It then calculates the difference in latitude or longitude between the starting location and the end point:
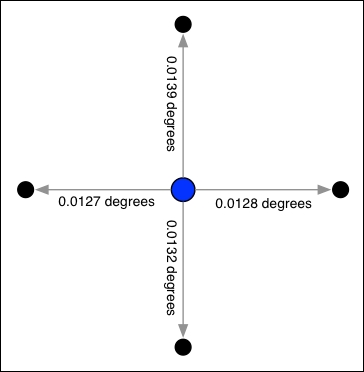
Finally, it takes the largest of these differences and returns it as the search radius, which is measured in degrees of latitude or longitude.
Because our utils.py module is now using pyproj, add the following import statement to the top of this module:
import pyproj
With the calc_search_radius() function written, we can now use Django's DWithin spatial query to identify all features close to the clicked-on location. The general process of doing this in GeoDjango is to use the filter() function to create a spatial query, as shown in the following example:
query = Feature.objects.filter(geometry__dwithin=(pt, radius))
This creates a query set that returns only those Feature objects that match the given criteria. GeoDjango cleverly adds support for spatial queries to Django's built-in filtering capabilities; in this case, the geometry__dwithin=(pt, radius) parameter tells GeoDjango to perform the DWithin spatial query using the two supplied parameters on the field named geometry within the Feature object.
Thus, this statement will be translated by GeoDjango into a spatial database query that looks something like this:
SELECT * from feature WHERE ST_DWithin(geometry, pt, radius)
Knowing this, and having the utils.calc_search_radius() function implemented, we can finally implement our find_feature() view function. Edit the shapefile.views module and replace the body of the find_feature() function with the following:
def find_feature(request):
  try:
    shapefile_id = int(request.GET['shapefile_id'])
    latitude     = float(request.GET['latitude'])
    longitude    = float(request.GET['longitude'])

    shapefile = Shapefile.objects.get(id=shapefile_id)
    pt = Point(longitude, latitude)
    radius = utils.calc_search_radius(latitude, longitude, 100)

    if shapefile.geom_type == "Point":
        query = Feature.objects.filter(
            geom_point__dwithin=(pt, radius))
    elif shapefile.geom_type in ["LineString", "MultiLineString"]:
        query = Feature.objects.filter(
            geom_multilinestring__dwithin=(pt, radius))
    elif shapefile.geom_type in ["Polygon", "MultiPolygon"]:
        query = Feature.objects.filter(
            geom_multipolygon__dwithin=(pt, radius))
    elif shapefile.geom_type == "MultiPoint":
        query = Feature.objects.filter(
            geom_multipoint__dwithin=(pt, radius))
    elif shapefile.geom_type == "GeometryCollection":
        query = feature.objects.filter(
            geom_geometrycollection__dwithin=(pt, radius))
    else:
      print "Unsupported geometry: " + shapefile.geom_type
      return HttpResponse("")

    if query.count() != 1:
      return HttpResponse("")

    feature = query[0]
    return HttpResponse("/edit_feature/" +
                        str(shapefile_id)+"/"+str(feature.id))
  except:
    traceback.print_exc()
    return HttpResponse("")
There's a lot here, so let's take this one step at a time. First off, we've wrapped all our code inside a try...except statement:
def find_feature(request):
  try:
    ...
  except:
    traceback.print_exc()
    return HttpResponse("")
This is the same technique we used when implementing the Tile Map Server; it means that any Python errors in your code will be displayed in the web server's log, and the AJAX function will return gracefully rather than crashing.
We then extract the supplied query parameters, converting them from strings to numbers, load the desired Shapefile object, create a GeoDjango Point object out of the clicked-on coordinates, and calculate the search radius in degrees:
    shapefile_id = int(request.GET['shapefile_id'])
    latitude     = float(request.GET['latitude'])
    longitude    = float(request.GET['longitude'])

    shapefile = Shapefile.objects.get(id=shapefile_id)
    pt = Point(longitude, latitude)
    radius = utils.calc_search_radius(latitude, longitude, 100)
Notice that we use a hardwired search radius of 100 meters: this is enough to let the user select a point or line feature by clicking close to it, without being so large that the user might accidentally click on the wrong feature.
With this done, we're now ready to perform the spatial query. Because our Feature object has separate fields to hold each different type of geometry, we have to build the query based on the geometry's type:
    if shapefile.geom_type == "Point":
      query = Feature.objects.filter(
                geom_point__dwithin=(pt, radius))
    elif shapefile.geom_type in ["LineString", "MultiLineString"]:
      query = Feature.objects.filter(
                geom_multilinestring__dwithin=(pt, radius))
    elif shapefile.geom_type in ["Polygon", "MultiPolygon"]:
      query = Feature.objects.filter(
                geom_multipolygon__dwithin=(pt, radius))
    elif shapefile.geom_type == "MultiPoint":
      query = Feature.objects.filter(
                geom_multipoint__dwithin=(pt, radius))
    elif shapefile.geom_type == "GeometryCollection":
      query = feature.objects.filter(
                geom_geometrycollection__dwithin=(pt, radius))
    else:
      print("Unsupported geometry: " + shapefile.geom_type)
      return HttpResponse("")
In each case, we choose the appropriate geometry field and use __dwithin to perform a spatial query on the appropriate field in the Feature object.
Once we've created the appropriate spatial query, we simply check to see whether the query returned exactly one Feature object. If not, we return an empty string back to the AJAX handler's callback function to tell it that the user did not click on a feature:
    if query.count() != 1:
      return HttpResponse("")
If there is exactly one matching feature, we get the clicked-on feature and use it to build a URL redirecting the user's web browser to the "Edit Feature" URL for the clicked-on feature:
    feature = query[0]
    return HttpResponse("/edit_feature/" +
                        str(shapefile_id)+"/"+str(feature.id))
After typing in all this code, add the following import statements to the top of the views.py module:
import traceback
from django.contrib.gis.geos import Point
from shapeEditor.shared.models import Feature
from shapeEditor.shared import utils
This completes our find_feature() view function. Save your changes, run the Django web server if it is not already running, and try clicking on a shapefile's features. If you click on the ocean, nothing should happen—but if you click on a feature, you should see your web browser redirected to a URL of this form:
http://127.0.0.1:8000/edit_feature/X/Y
Here, X is the record ID of the shapefile, and Y is the record ID of the clicked-on feature. Of course, at this stage, you'll get a Page Not Found error, because you haven't written that page yet. But at least you can click on a feature to select it, which is a major milestone in the development of the ShapeEditor application. Congratulations!