Table of Contents for
Python Geospatial Development - Third Edition
 Python Geospatial Development - Third Edition
Published by
Packt Publishing, 2016
Python Geospatial Development - Third Edition
Published by
Packt Publishing, 2016
- Cover
- Table of Contents
- Python Geospatial Development Third Edition
- Python Geospatial Development Third Edition
- Credits
- About the Author
- About the Reviewer
- www.PacktPub.com
- Preface
- What you need for this book
- Who this book is for
- Conventions
- Reader feedback
- Customer support
- 1. Geospatial Development Using Python
- Geospatial development
- Applications of geospatial development
- Recent developments
- Summary
- 2. GIS
- GIS data formats
- Working with GIS data manually
- Summary
- 3. Python Libraries for Geospatial Development
- Dealing with projections
- Analyzing and manipulating Geospatial data
- Visualizing geospatial data
- Summary
- 4. Sources of Geospatial Data
- Sources of geospatial data in raster format
- Sources of other types of geospatial data
- Choosing your geospatial data source
- Summary
- 5. Working with Geospatial Data in Python
- Working with geospatial data
- Changing datums and projections
- Performing geospatial calculations
- Converting and standardizing units of geometry and distance
- Exercises
- Summary
- 6. Spatial Databases
- Spatial indexes
- Introducing PostGIS
- Setting up a database
- Using PostGIS
- Recommended best practices
- Summary
- 7. Using Python and Mapnik to Generate Maps
- Creating an example map
- Mapnik concepts
- Summary
- 8. Working with Spatial Data
- Designing and building the database
- Downloading and importing the data
- Implementing the DISTAL application
- Using DISTAL
- Summary
- 9. Improving the DISTAL Application
- Dealing with the scale problem
- Performance
- Summary
- 10. Tools for Web-based Geospatial Development
- A closer look at three specific tools and techniques
- Summary
- 11. Putting It All Together – a Complete Mapping System
- Designing the ShapeEditor
- Prerequisites
- Setting up the database
- Setting up the ShapeEditor project
- Defining the ShapeEditor's applications
- Creating the shared application
- Defining the data models
- Playing with the admin system
- Summary
- 12. ShapeEditor – Importing and Exporting Shapefiles
- Importing shapefiles
- Exporting shapefiles
- Summary
- 13. ShapeEditor – Selecting and Editing Features
- Editing features
- Adding features
- Deleting features
- Deleting shapefiles
- Using the ShapeEditor
- Further improvements and enhancements
- Summary
- Index
Because geospatial data is almost impossible to understand until it is displayed, the use of maps to visually represent spatial data is an extremely important topic. In this chapter, we will look at Mapnik, a powerful Python library for transforming geospatial data into great-looking maps. In particular, we will look at:
- The underlying concepts Mapnik uses to generate maps
- An example program using Mapnik to generate a straightforward map
- Various data sources that you can use to add geospatial data to your map
- How to use rules, filters, and styles to control the map-generation process
- The "symbolizers" you can use to add points, lines, polygons, textual labels, and raster images to your maps
- How maps and map layers work together to create a map
- Ways of rendering a map into an image file
We first looked at Mapnik in Chapter 3, Python Libraries for Geospatial Development. If you haven't already done so, please go back to the Mapnik section of that chapter and follow the instructions for installing it onto your computer.
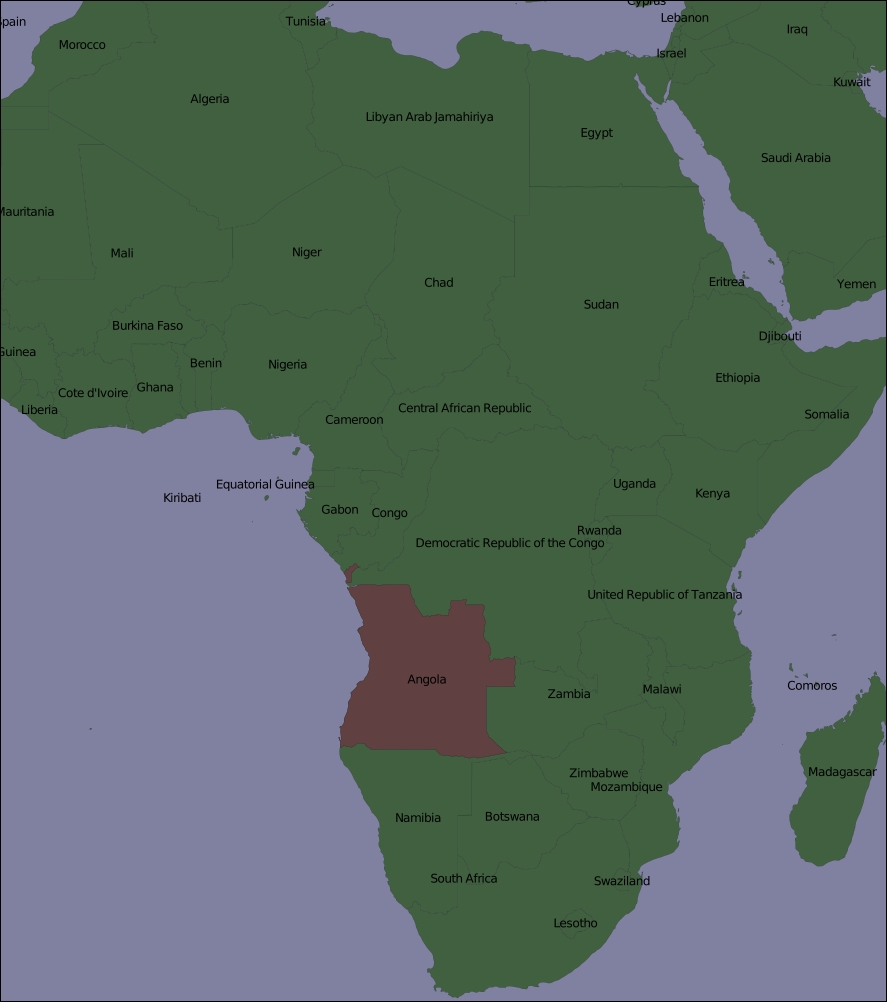
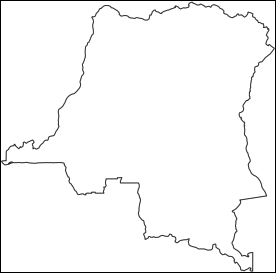
Mapnik is a complex library with many different parts, and it is easy to get confused by the various names and concepts. Let's start our exploration of Mapnik by looking at a simple map:
One thing that may not be immediately obvious is that the various elements within the map are layered, like this:
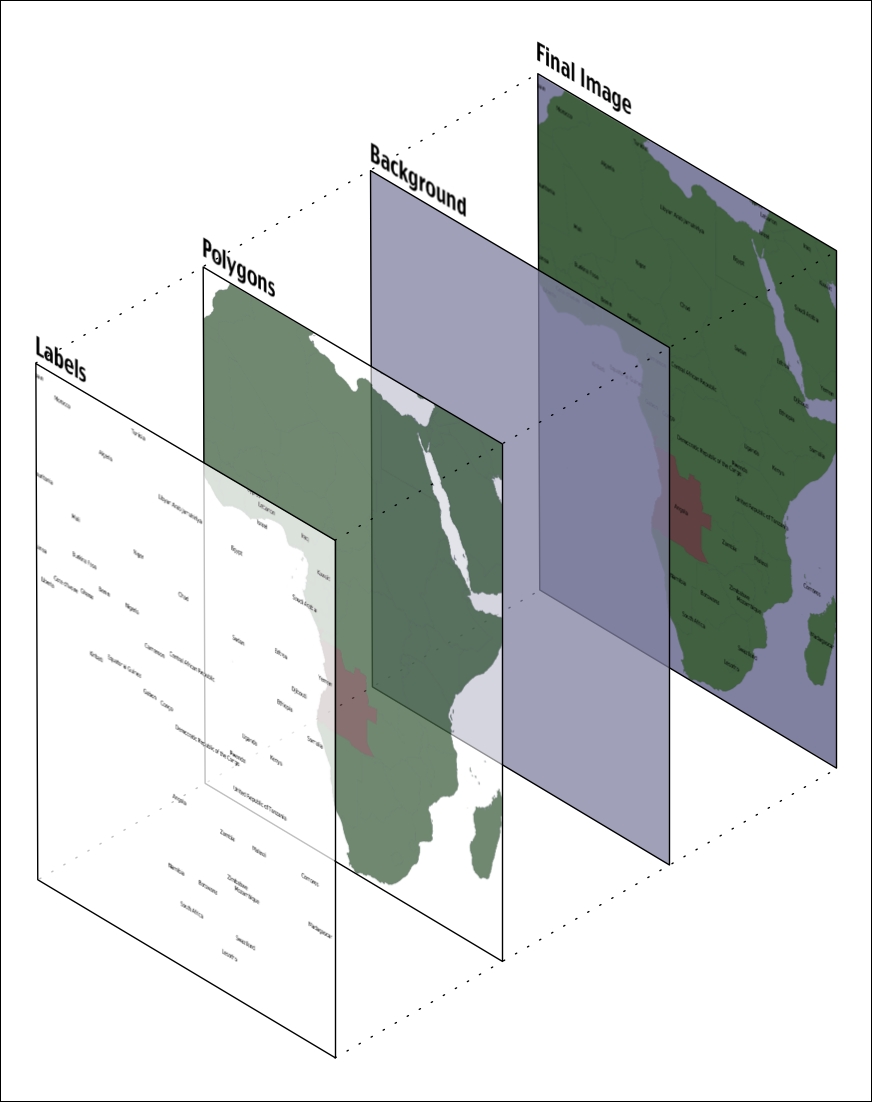
To generate this map, you have to tell Mapnik to initially draw the background, then the polygons, and finally the labels. This ensures that the polygons sit on top of the background and the labels appear in front of both the polygons and the background.
Mapnik allows you to control the order in which the map elements are drawn through the use of Layer objects. A simple map may consist of just one layer, but most maps have multiple layers. The layers are drawn in a strict back-to-front order, so the first layer you define will appear behind all the others. In the example map we just looked at, the Polygons layer would be defined first, followed by the Labels layer. This ensures that the labels appear in front of the polygons. This layering approach is called the painter's algorithm because of its similarity to placing layers of paint onto an artist's canvas.
Each Layer has its own data source, which tells Mapnik where to load the data from. A data source can refer to a shapefile, a spatial database, a raster image file, or any number of other geospatial data sources. In most cases, setting up a Layer's data source is very easy.
Within each Layer, the visual display of the geospatial data is controlled through something called a symbolizer. While there are many different types of symbolizers available within Mapnik, three symbolizers are of interest to us here:
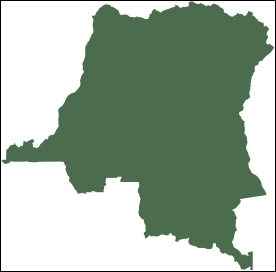
In many cases, these three symbolizers will be enough to draw an entire map. Indeed, almost all of the preceding map was produced using just one PolygonSymbolizer, one LineSymbolizer, and one TextSymbolizer, as shown here:
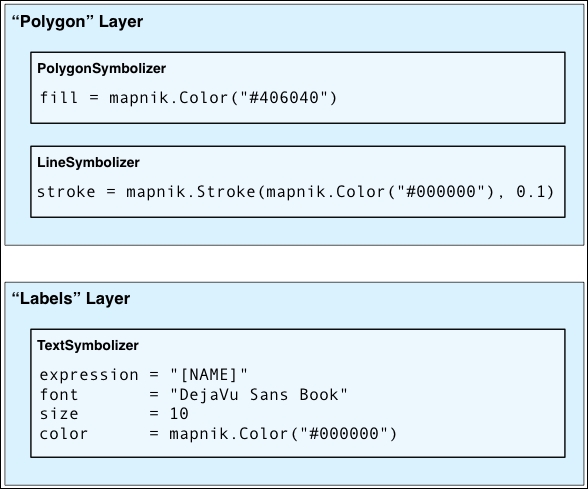
Within each layer, the symbolizers are processed using the same painter's algorithm described earlier. In the case of the "Polygon" layer, the LineSymbolizer would be drawn on top of the PolygonSymbolizer.
Notice that the symbolizers aren't associated directly with a layer. Rather, there is an indirect association of symbolizers with a layer through the use of styles and rules. We'll look at styles in a minute, but for now, let's take a closer look at the concept of a Mapnik rule.
A rule allows a set of symbolizers to be applied only when a given condition is met. For example, the map at the start of this chapter displayed Angola in a different color. This was done by defining two rules within the "Polygons" layer, like this:
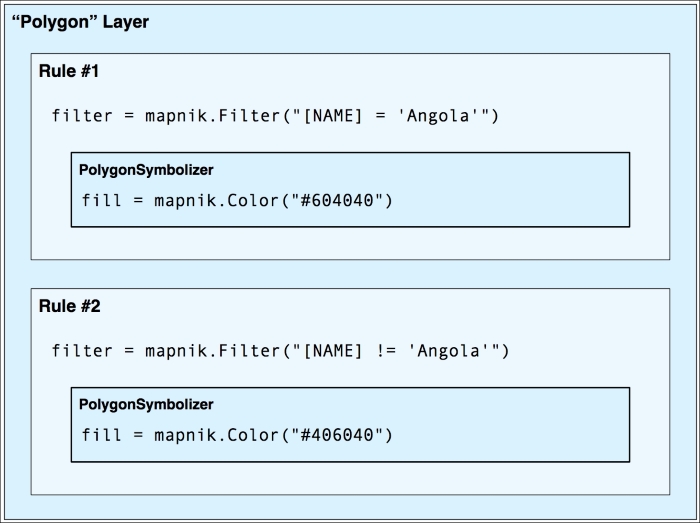
The first rule has a
filter that only applies to features that have a NAME attribute equal to the value "Angola". For features that match this filter condition, the rule's PolygonSymbolizer will be used to draw the feature in dark red.
The second rule has a similar filter, this time checking for features that don't have a NAME attribute equal to "Angola". These features are drawn using the second rule's PolygonSymbolizer, which draws the features in dark green.
Obviously, rules are a very powerful tool for selectively changing the way features are displayed on a map. We'll be looking at rules in more detail in the Rules, filters, and styles section of this chapter.
When you define your symbolizers, you place them into rules. The rules themselves are grouped into styles, which can be used to organize and keep track of your various rules. Each map layer has a list of the styles that apply to that particular layer.
While the relationship between layers, styles, rules, filters, and symbolizers may seem complicated, it also provides much of Mapnik's power and flexibility. It is important that you understand how these various classes work together:
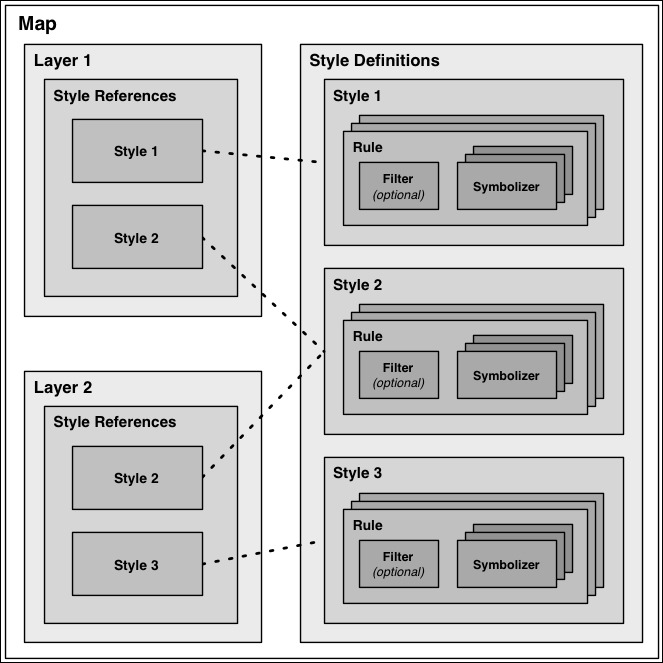
As you can see, the style definitions are stored directly within the map, while the various layers use style references to identify which of the defined styles each layer will use. This works in much the same way as a stylesheet in a word processing document, where you define styles and use them again and again. Note that the same style can be used in multiple layers.
Note
Mapnik provides an alternative way of defining your various styles, though the use of an XML-format map definition file. We will not be using map definition files in this book, however, as the XML-format files are rather hard to read. It is also easier to create your map definitions directly using Python code.