Table of Contents for
Python Geospatial Development - Third Edition
 Python Geospatial Development - Third Edition
Published by
Packt Publishing, 2016
Python Geospatial Development - Third Edition
Published by
Packt Publishing, 2016
- Cover
- Table of Contents
- Python Geospatial Development Third Edition
- Python Geospatial Development Third Edition
- Credits
- About the Author
- About the Reviewer
- www.PacktPub.com
- Preface
- What you need for this book
- Who this book is for
- Conventions
- Reader feedback
- Customer support
- 1. Geospatial Development Using Python
- Geospatial development
- Applications of geospatial development
- Recent developments
- Summary
- 2. GIS
- GIS data formats
- Working with GIS data manually
- Summary
- 3. Python Libraries for Geospatial Development
- Dealing with projections
- Analyzing and manipulating Geospatial data
- Visualizing geospatial data
- Summary
- 4. Sources of Geospatial Data
- Sources of geospatial data in raster format
- Sources of other types of geospatial data
- Choosing your geospatial data source
- Summary
- 5. Working with Geospatial Data in Python
- Working with geospatial data
- Changing datums and projections
- Performing geospatial calculations
- Converting and standardizing units of geometry and distance
- Exercises
- Summary
- 6. Spatial Databases
- Spatial indexes
- Introducing PostGIS
- Setting up a database
- Using PostGIS
- Recommended best practices
- Summary
- 7. Using Python and Mapnik to Generate Maps
- Creating an example map
- Mapnik concepts
- Summary
- 8. Working with Spatial Data
- Designing and building the database
- Downloading and importing the data
- Implementing the DISTAL application
- Using DISTAL
- Summary
- 9. Improving the DISTAL Application
- Dealing with the scale problem
- Performance
- Summary
- 10. Tools for Web-based Geospatial Development
- A closer look at three specific tools and techniques
- Summary
- 11. Putting It All Together – a Complete Mapping System
- Designing the ShapeEditor
- Prerequisites
- Setting up the database
- Setting up the ShapeEditor project
- Defining the ShapeEditor's applications
- Creating the shared application
- Defining the data models
- Playing with the admin system
- Summary
- 12. ShapeEditor – Importing and Exporting Shapefiles
- Importing shapefiles
- Exporting shapefiles
- Summary
- 13. ShapeEditor – Selecting and Editing Features
- Editing features
- Adding features
- Deleting features
- Deleting shapefiles
- Using the ShapeEditor
- Further improvements and enhancements
- Summary
- Index
In the previous chapter, we wrote a complete implementation of the DISTAL system that works as advertised: a user can choose a country, enter a search radius in miles, click on a starting point, and see a high-resolution map showing all the place names within the desired search radius. Unfortunately, the DISTAL application is lacking in a number of areas, and even a cursory look at it will reveal some major problems. In this chapter, we will work on solving these problems. Along the way, we will:
- Learn about the anti-meridian and solve the problems it can cause when working with latitude and longitude-based coordinates
- See how to add a zoom feature to our CGI scripts
- Discover the consequences of working with huge polygons, and how you can improve performance by breaking these polygons down into smaller pieces
- Make huge improvements to the speed of our DISTAL application by splitting the shoreline data into tiles and displaying a single tile rather than the entire shoreline
Let's work through these issues one at a time.
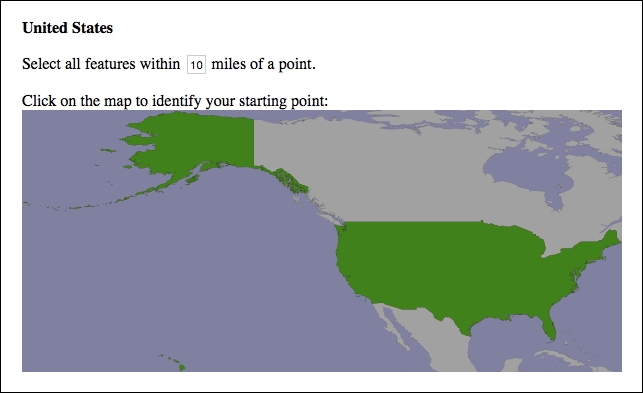
If you explore the DISTAL application, you will soon discover a major usability problem with some of the countries. For example, if you click on United States in the Select Country page, you will be presented with the following map to click on:
Accurately clicking on a desired point using this map would be almost impossible because it covers most of the earth's surface.
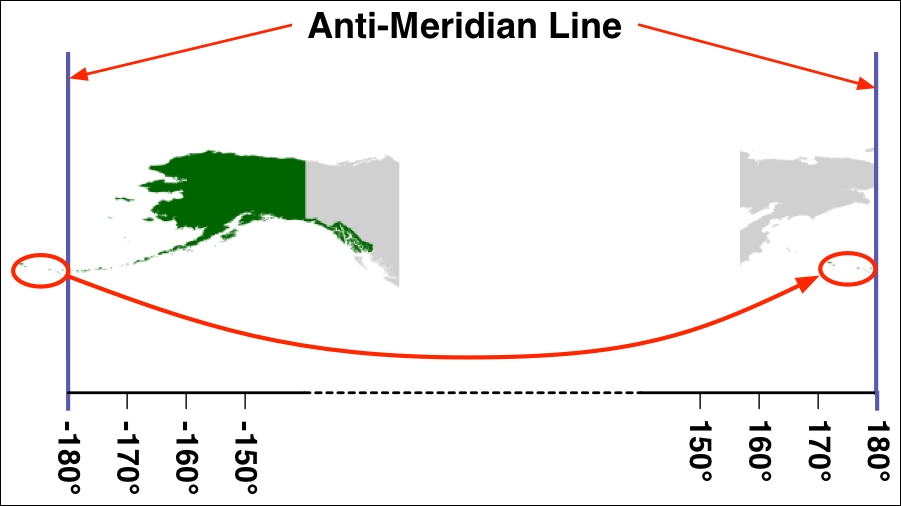
The problem is that Alaska crosses the anti-meridian line. The anti-meridian line is the line where the left and right sides of the world map join, that is, at ±180 degrees of longitude. Because of the way longitude values wrap around the globe, -180 degrees of longitude is the same as +180 degrees of longitude. The ±180 degree line is called the anti-meridian line and is the cause of many problems when dealing with geospatial data.
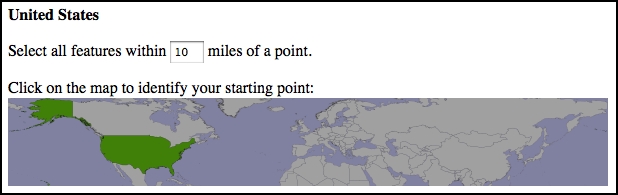
In the case of the USA, part of the Alaskan peninsula extends beyond 180 degrees west and continues across the Aleutian Islands to finish at Attu Island, which has a longitude of 172 degrees east. Because it crosses the anti-meridian line, Alaska appears on both the left and right sides of the world map:
Because the portion of Alaska that sits to the left of the -180 degree line is shifted to the right-hand side of the map, the DISTAL application thinks that Alaska, and hence the entire USA, spans almost the entire globe. This is why we get strange results when we draw a map covering the bounds of the USA.
To solve this problem, we are going to have to identify the countries that cross the anti-meridian line and adjust them so they only appear on one side of the line.
Note
We can do this for the DISTAL application because we only show a single country's outline at a time. If we had to show multiple countries at once, we'd have to create two versions of every country's outline: one in its original place and another shifted by 180 degrees. We could then choose which of the two sets of outlines to display based on which country the user selected.
This adjustment is done by moving the individual polygons that make up the country's outline so they all sit on the same side of the map. The resulting polygons will sit on either side of the anti-meridian line, with some polygons on one side and some on the other:
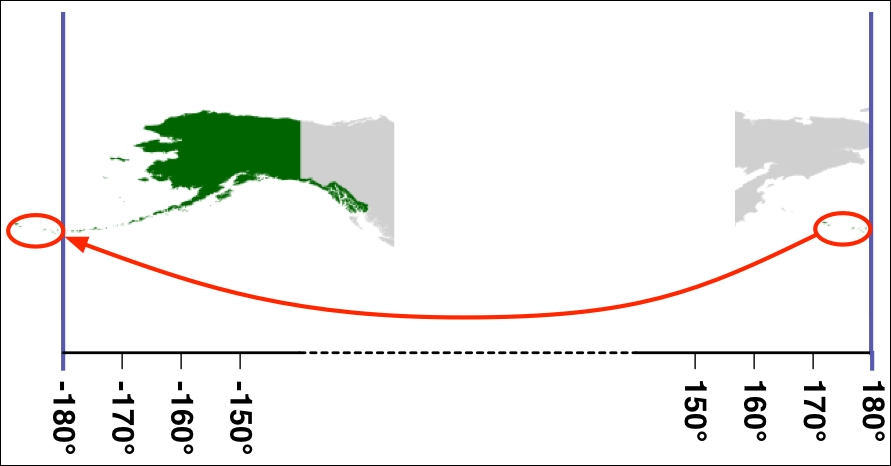
Note that this adjustment moves the overall bounds of the country's polygons beyond ±180 degrees. This isn't a problem, as both PostGIS and Mapnik treat the coordinates as real numbers that can have any value.
To support adjusting the polygons that cross the anti-meridian line, we will need to update the import_world_borders.py script we wrote in the previous chapter. Go back to this script, and add the following highlighted line to this file:
for i in range(layer.GetFeatureCount()):
    feature = layer.GetFeature(i)
    name = feature.GetField("NAME")
    wkt = feature.GetGeometryRef().ExportToWkt()
    wkt = adjust_for_antimeridian(name, wkt)

    cursor.execute("INSERT INTO countries (name,outline) " +
                   "VALUES (%s, ST_GeometryFromText(%s, 4326))",
                   (name, wkt))

    num_done = num_done + 1

connection.commit()

print("Imported {} countries".format(num_done))
As you can see, we're calling a new function called adjust_for_antimeridian() to do the hard work. Before we start writing this function, add the following import statements to the top of your program:
import shapely.wkt
from shapely.geometry import MultiPolygon
from shapely.affinity import translate
Our function is going to use these imported modules. Next, we want to define the function itself. Add the following to your program, immediately after the import statements:
def adjust_for_antimeridian(name, wkt):
As you can see, we're passing in the name of the country as well as the country's outline in WKT format. We need the name of the country so that we can tell the user which country's outline we have adjusted. Upon completion, our function will return either the original WKT outline unchanged or a new WKT outline representing the adjusted outline for the country.
Let's start by creating a Shapely Geometry object from the supplied WKT text and then checking to see whether it is a MultiPolygon. If the outline isn't a MultiPolygon, then the country doesn't have multiple parts and so we can't do any adjusting. Here is the relevant code, which you should enter immediately after the function definition:
    outline = shapely.wkt.loads(wkt)

    if outline.geom_type != "MultiPolygon":
        print("Importing {}".format(name))
        return wkt
Notice that we're printing out the name of the country, so the user knows which country we're importing. We then return the original outline unchanged.
Next, we want to skip any countries that don't sit close to the anti-meridian line on both sides. If a country doesn't sit close to the anti-meridian line on both sides, then it won't span that line, and we can skip it. Here is the relevant code:
    minLong,minLat,maxLong,maxLat = outline.bounds
    if minLong >= -160 or maxLong <= 160:
        print("Importing {}".format(name))
        return wkt
Our next task is to split the country's outline up into individual parts, where each part is a single Polygon within the outline's MultiPolygon. For each part, we record whether the Polygon is closer to the anti-meridian line on the left side or the right. Add the following to the end of your adjust_for_antimeridian() function:
    parts = []

    for geom in outline.geoms:
        left = geom.bounds[0]
        right = geom.bounds[2]
        if left == -180 and right == +180:
            print("{} spans the entire world, so we can't shift it."
                  .format(name))
            return wkt

        distance_to_left_side = -(-180 - left)
        distance_to_right_side = 180 - right

        if distance_to_left_side < distance_to_right_side:
            side = "left"
        else:
            side = "right"

        parts.append({'side' : side,
                      'geom' : geom})
Notice that we check to see whether a single Polygon within the outline spans the entire world. If so, we return the original outline unchanged, as we have no way of adjusting it. Note that this only applies to Antarctica.
Now that we've split the country's outline up into separate parts, let's use this information to decide whether to shift the entire country to the left or right side of the map. To do this, we'll count how many parts are on each side of the map and shift the whole country to the side with the most parts. To do this, add the following to the end of your function:
    num_on_left = 0
    num_on_right = 0

    for part in parts:
        if part['side'] == "left":
            num_on_left = num_on_left + 1
        else:
            num_on_right = num_on_right + 1

    if num_on_left > num_on_right:
        print("Shifting {} to left".format(name))
        shift_direction = "left"
    else:
        print("Shifting {} to right".format(name))
        shift_direction = "right"
We next want to shift the parts to the appropriate side. That is, if we are shifting the entire country to the right, we will shift any parts that are on the left across to the right by adding 360 degrees to the part's longitude. Similarly, if we are shifting the country to the left, we shift any parts that are on the right over to the left by subtracting 360 degrees from the part's longitude. Here is the relevant code:
    for part in parts:
        old_bounds = part['geom'].bounds
        if part['side'] == "left" and shift_direction == "right":
              part['geom'] = translate(part['geom'], 360)
        elif part['side'] == "right" and shift_direction == "left":
            part['geom'] = translate(part['geom'], -360)
Finally, we need to combine the various parts back into a single combined outline, which we can return back to the caller in WKT format:
    polygons = []
    for part in parts:
        polygons.append(part['geom'])
    combined = MultiPolygon(polygons)

    return combined.wkt
This completes our adjust_for_antimeridian() function. You should now be able to re-import the country outlines by running the updated import_world_borders.py script. If you then run the DISTAL application, you will see that the outline of the USA no longer spans the entire globe: