Table of Contents for
Python Geospatial Development - Third Edition
 Python Geospatial Development - Third Edition
Published by
Packt Publishing, 2016
Python Geospatial Development - Third Edition
Published by
Packt Publishing, 2016
- Cover
- Table of Contents
- Python Geospatial Development Third Edition
- Python Geospatial Development Third Edition
- Credits
- About the Author
- About the Reviewer
- www.PacktPub.com
- Preface
- What you need for this book
- Who this book is for
- Conventions
- Reader feedback
- Customer support
- 1. Geospatial Development Using Python
- Geospatial development
- Applications of geospatial development
- Recent developments
- Summary
- 2. GIS
- GIS data formats
- Working with GIS data manually
- Summary
- 3. Python Libraries for Geospatial Development
- Dealing with projections
- Analyzing and manipulating Geospatial data
- Visualizing geospatial data
- Summary
- 4. Sources of Geospatial Data
- Sources of geospatial data in raster format
- Sources of other types of geospatial data
- Choosing your geospatial data source
- Summary
- 5. Working with Geospatial Data in Python
- Working with geospatial data
- Changing datums and projections
- Performing geospatial calculations
- Converting and standardizing units of geometry and distance
- Exercises
- Summary
- 6. Spatial Databases
- Spatial indexes
- Introducing PostGIS
- Setting up a database
- Using PostGIS
- Recommended best practices
- Summary
- 7. Using Python and Mapnik to Generate Maps
- Creating an example map
- Mapnik concepts
- Summary
- 8. Working with Spatial Data
- Designing and building the database
- Downloading and importing the data
- Implementing the DISTAL application
- Using DISTAL
- Summary
- 9. Improving the DISTAL Application
- Dealing with the scale problem
- Performance
- Summary
- 10. Tools for Web-based Geospatial Development
- A closer look at three specific tools and techniques
- Summary
- 11. Putting It All Together – a Complete Mapping System
- Designing the ShapeEditor
- Prerequisites
- Setting up the database
- Setting up the ShapeEditor project
- Defining the ShapeEditor's applications
- Creating the shared application
- Defining the data models
- Playing with the admin system
- Summary
- 12. ShapeEditor – Importing and Exporting Shapefiles
- Importing shapefiles
- Exporting shapefiles
- Summary
- 13. ShapeEditor – Selecting and Editing Features
- Editing features
- Adding features
- Deleting features
- Deleting shapefiles
- Using the ShapeEditor
- Further improvements and enhancements
- Summary
- Index
Now that we have the data, we can start to implement the DISTAL application itself. To keep things simple, we will use CGI scripts to implement the user interface.
Tip
What is a CGI Script?
While the details of writing CGI scripts are beyond the scope of this book, the basic concept is to print the raw HTML output to stdout and to process the incoming CGI parameters from the browser using the built-in cgi module.
To run a Python program as a CGI script on Mac OS X or Linux, you have to do two things: first, you have to add a "shebang" line to the start of the script, like this:
#!/usr/bin/python
The exact path you use will depend on where you have Python installed on your computer. The second thing you need to do is make your script executable, like this:
chmod +x selectCountry.py
On MS Windows computers, the file extension (.py) will automatically cause the CGI scripts to call the Python interpreter, so you shouldn't need to do either of these things.
For more information on CGI scripts, take a look at one of the CGI tutorials available on the Internet, for example http://wiki.python.org/moin/CgiScripts.
CGI scripts aren't the only way we could implement the DISTAL application. Other possible approaches include using web application frameworks such as TurboGears or Django, using AJAX to write your own dynamic web application, using CherryPy (http://cherrypy.org), or even using tools such as Pyjamas (http://pyjs.org) to compile Python code into JavaScript. All of these approaches, however, are more complicated than CGI, and we will be making use of CGI scripts in this chapter to keep the code as straightforward as possible.
Let's take a look at how our CGI scripts will implement the DISTAL application's workflow:
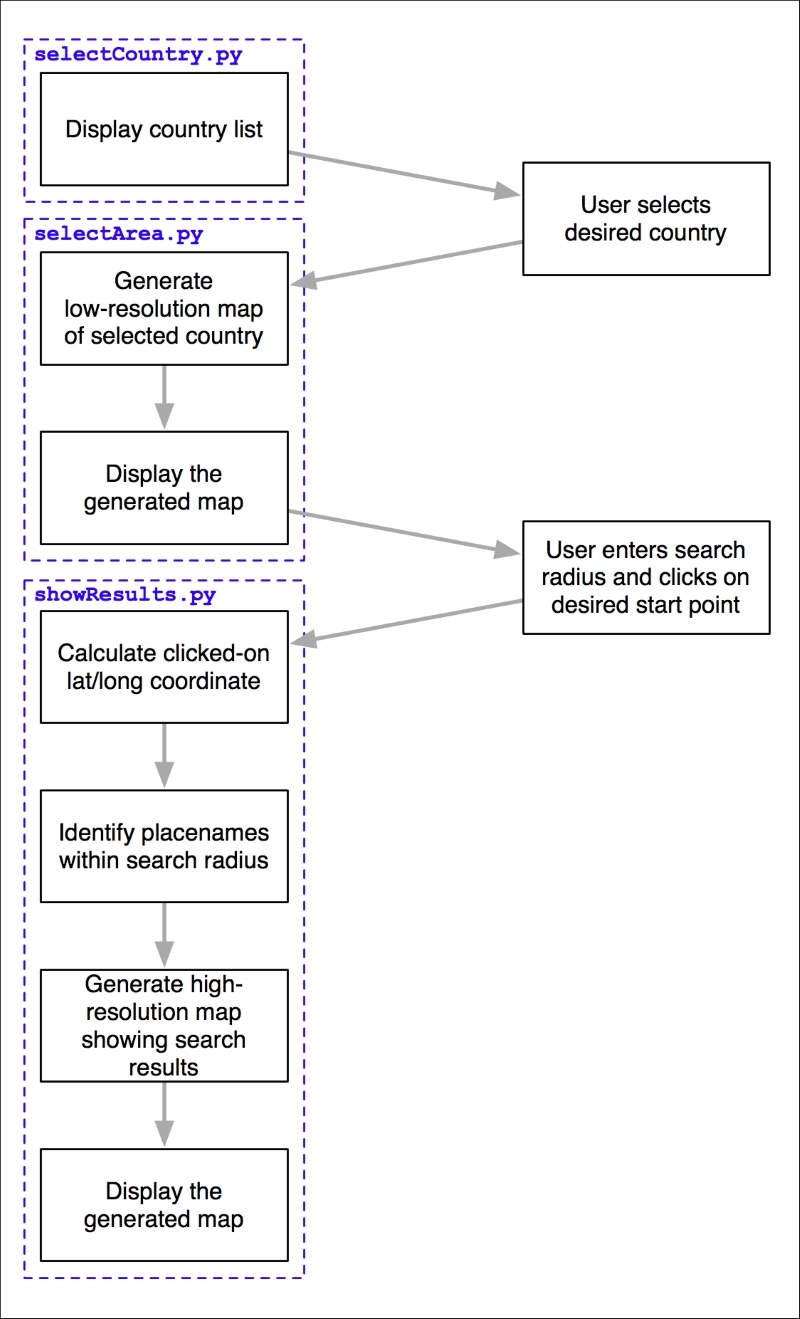
As you can see, there are three separate CGI scripts, selectCountry.py, selectArea.py, and showResults.py, each implementing a distinct part of the DISTAL application.
Let's start by creating a simple web server capable of running our CGI scripts. With Python, this is easy; simply create the following program, which we will call webServer.py:
import http.server

address = ('', 8000)
handler = http.server.CGIHTTPRequestHandler
server = http.server.HTTPServer(address, handler)
server.serve_forever()
Place this file into your main DISTAL directory. Next, create a new subdirectory named cgi-bin in the same directory. This subdirectory will hold the various CGI scripts you create.
Running webServer.py will start up a web server at http://127.0.0.1:8000 which will execute any CGI scripts you place into the cgi-bin subdirectory. So, for example, you could access the selectCountry.py script by entering the following URL into your web browser:
http://127.0.0.1:8000/cgi-bin/selectCountry.py
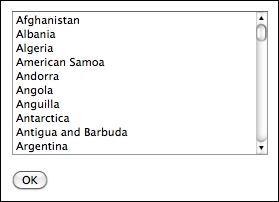
The task of the selectCountry.py script is to display a list of countries to the user. This allows the user to choose a desired country, which is then passed on to the selectArea.py script for further processing.
Here is what the selectCountry.py script's output will look like:
Note
We're not worrying too much about the visual appearance of our program. It would be easy to use a CSS stylesheet, or even a library such as Bootstrap, to make the DISTAL system look more professional. In this chapter, however, we're concentrating on functionality rather than how to make our program look good.
This CGI script is very basic—we simply print out the contents of the HTML page that lets the user choose a country from a list of country names:
#!/usr/bin/python

import psycopg2

connection = psycopg2.connect(database="distal",
                              user="distal_user",
                              password="...")
cursor = connection.cursor()

print('Content-Type: text/html; charset=UTF-8')
print()
print()
print('<html>')
print('<head><title>Select Country</title></head>')
print('<body>')
print('<form method="POST" action="selectArea.py">')
print('<select name="countryID" size="10">')

cursor.execute("SELECT id,name FROM countries " +
               "ORDER BY name")
for id,name in cursor:
    print('<option value="'+str(id)+'">'+name+'</option>')

print('</select>')
print('<p>')
print('<input type="submit" value="OK">')
print('</form>')
print('</body>')
print('</html>')
Make sure you name this script selectCountry.py and place it inside your cgi-bin directory. If you are running this on Mac OS X or Linux, you will need to change the shebang line at the start of the script if you need to use a different Python interpreter. You should also use the chmod command, as described earlier, to make the script executable.
Tip
Understanding HTML forms
If you haven't used HTML forms before, don't panic. They are quite straightforward, and if you want, you can just copy the code from the examples given here. To learn more about HTML forms, check out one of the many tutorials available online. A good example can be found at http://www.pagetutor.com/form_tutor.
You should now be able to run this script by starting up the webserver.py program and typing the following URL into your web browser:
http://127.0.0.1:8000/cgi-bin/selectCountry.py
All going well, you should see the list of countries and be able to select one. If you click on the OK button, you should see a 404 error, indicating that the selectArea.py script doesn't exist yet—which is perfectly correct, as we haven't implemented it yet.
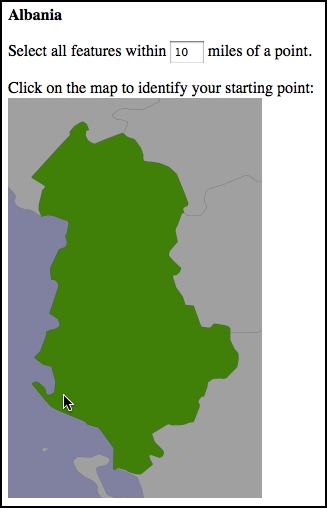
The next part of the DISTAL application is selectArea.py. This script generates a web page that displays a simple map of the selected country. The user can enter a desired search radius and click on the map to identify the starting point for the DISTAL search:
Because this script involves displaying a map, we are going to have to learn how to access Mapnik from a CGI script. We've already seen how Mapnik works in Chapter 7, Using Python and Mapnik to Generate Maps; for the DISTAL application, we're going to write a standalone mapGenerator.py module that generates the map and stores the resulting image into a temporary file so that it can be displayed.
Here is the full source code for the mapGenerator.py module. Even though this isn't a CGI script, it should be placed in your cgi-bin directory so that our various CGI scripts can access it.
# mapGenerator.py

import os, os.path, sys, tempfile
import mapnik

def generateMap(tableName, minX, minY, maxX, maxY,
                mapWidth, mapHeight,
                hiliteExpr=None, points=None):

    extent = "{},{},{},{}".format(minX, minY, maxX, maxY)

    layer = mapnik.Layer("Layer")
    layer.datasource = mapnik.PostGIS(dbname="distal",
                                      table=tableName,
                                      user="distal_user",
                                      password="...",
                                      extent=extent,
                                      geometry_field="outline",
                                      srid=4326)

    map = mapnik.Map(mapWidth, mapHeight,
                     '+proj=longlat +datum=WGS84')
    map.background = mapnik.Color("#8080a0")

    style = mapnik.Style()

    rule = mapnik.Rule()
    if hiliteExpr != None:
        rule.filter = mapnik.Filter(hiliteExpr)

    rule.symbols.append(mapnik.PolygonSymbolizer(
        mapnik.Color("#408000")))
    rule.symbols.append(mapnik.LineSymbolizer(
        mapnik.Stroke(mapnik.Color("#000000"), 0.1)))

    style.rules.append(rule)

    rule = mapnik.Rule()
    rule.set_else(True)

    rule.symbols.append(mapnik.PolygonSymbolizer(
        mapnik.Color("#a0a0a0")))
    rule.symbols.append(mapnik.LineSymbolizer(
        mapnik.Stroke(mapnik.Color("#404040"), 0.1)))

    style.rules.append(rule)

    map.append_style("Map Style", style)
    layer.styles.append("Map Style")
    map.layers.append(layer)

    if points != None:
        memoryDatasource = mapnik.MemoryDatasource()
        context = mapnik.Context()
        context.push("name")
        next_id = 1
        for long,lat,name in points:
            wkt = "POINT (%0.8f %0.8f)" % (long,lat)
            feature = mapnik.Feature(context, next_id)
            feature['name'] = name
            feature.add_geometries_from_wkt(wkt)
            next_id = next_id + 1
            memoryDatasource.add_feature(feature)

        layer = mapnik.Layer("Points")
        layer.datasource = memoryDatasource

        style = mapnik.Style()
        rule = mapnik.Rule()

        pointImgFile = os.path.join(os.path.dirname(__file__),
                                    "point.png")

        shield = mapnik.ShieldSymbolizer(
                   mapnik.Expression('[name]'),
                   "DejaVu Sans Bold", 10,
                   mapnik.Color("#000000"),
                   mapnik.PathExpression(pointImgFile))
        shield.displacement = (0, 7)
        shield.unlock_image = True
        rule.symbols.append(shield)

        style.rules.append(rule)

        map.append_style("Point Style", style)
        layer.styles.append("Point Style")

        map.layers.append(layer)

    map.zoom_to_box(mapnik.Envelope(minX, minY, maxX, maxY))

    scriptDir = os.path.dirname(__file__)
    cacheDir = os.path.join(scriptDir, "..", "mapCache")
    if not os.path.exists(cacheDir):
        os.mkdir(cacheDir)
    fd,filename = tempfile.mkstemp(".png", dir=cacheDir)
    os.close(fd)

    mapnik.render_to_file(map, filename, "png")

return "../mapCache/" + os.path.basename(filename)Most of this should be pretty easy to understand, given the concepts covered in Chapter 7, Using Python and Mapnik to Generate Maps. There are three things you may not have encountered before:
- Using a
ShieldSymbolizerto display the points. - The extra parameters passed to the
PostGISdata source, which are required because Mapnik can't automatically handleGeographycolumns. - The way we use a temporary file to hold the generated map image so it can be displayed on a web page. As you can see, we're returning the path (relative to our main
DISTALdirectory) for the generated map image.
Note that to use this module, you will need to download or create a small image file to represent the position of a place name on the map. This 9 x 9 pixel image looks like this:

A copy of this image is available as a part of the example source code that comes with this book. If you don't have access to the example code, you can create or search for an image that looks like this; make sure the image is named point.png and is placed in the same directory as the mapGenerator.py module.
We're now ready to start writing the selectArea.py script. We'll start with our shebang line and import the various modules we'll need:
#!/usr/bin/python

import cgi, os.path, sys
import psycopg2
import mapGenerator
Next, we will define some useful constants to make the HTML generation easier:
HEADER = "Content-Type: text/html; charset=UTF-8\n\n" \
       + "<html><head><title>Select Area</title>" \
       + "</head><body>"
FOOTER = "</body></html>"
HIDDEN_FIELD = '<input type="hidden" name="{}" value="{}">'

MAX_WIDTH = 600
MAX_HEIGHT = 400
We next open up a connection to the database:
connection = psycopg2.connect(database="distal",
                              user="distal_user",
                              password="...")
cursor = connection.cursor()
Our next task is to extract the ID of the country the user clicked on:
form = cgi.FieldStorage()
if "countryID" not in form:
    print(HEADER)
    print('<b>Please select a country</b>')
    print(FOOTER)
    sys.exit(0)

countryID = int(form['countryID'].value)
Now that we have the ID of the selected country, we're ready to start generating the map. Doing this is a three-step process:
- Calculating the bounding box that defines the portion of the world to be displayed.
- Calculating the map's dimensions.
- Rendering the map image.
Let's look at each of these in turn.
Before we can show the selected country on a map, we need to calculate the bounding box for that country, that is, the minimum and maximum latitude and longitude values. Knowing the bounding box allows us to draw a map centered over the desired country.
Add the following to the end of your selectArea.py script:
cursor.execute("SELECT name," +
               "ST_YMin(ST_Envelope(outline))," +
               "ST_XMin(ST_Envelope(outline))," +
               "ST_YMax(ST_Envelope(outline))," +
               "ST_XMax(ST_Envelope(outline)) " +
               "FROM countries WHERE id=%s",
               (countryID,))

row = cursor.fetchone()
if row != None:
    name     = row[0]
    min_lat  = row[1]
    min_long = row[2]
    max_lat  = row[3]
    max_long = row[4]
else:
    print(HEADER)
    print('<b>Missing country</b>')
    print(FOOTER)
    sys.exit(0)

minLong = minLong - 0.2
minLat = minLat - 0.2
maxLong = maxLong + 0.2
maxLat = maxLat + 0.2
As you can see, we extract the country's bounding box from the database and then increase the bounds slightly so that the country won't butt up against the edge of the map. We also grab the name of the country at the same time, as we'll need this shortly.
Because countries aren't square, we can't simply draw the country onto a map of a fixed size. Instead, we have to calculate the aspect ratio
of the country's bounding box (its width as a proportion of its height) and then calculate the size of the map image based on this aspect ratio, while limiting the overall size of the image so that it can fit within our web page. Here's the necessary code, which you should add to the end of your selectArea.py script:
width = float(maxLong - minLong)
height = float(maxLat - minLat)
aspectRatio = width/height

mapWidth = MAX_WIDTH
mapHeight = int(mapWidth / aspectRatio)

if mapHeight > MAX_HEIGHT:
    # Scale the map to fit.
    scaleFactor = float(MAX_HEIGHT) / float(mapHeight)
    mapWidth = int(mapWidth * scaleFactor)
    mapHeight = int(mapHeight * scaleFactor)
Doing this means that the map is correctly sized to reflect the dimensions of the country we are displaying.
With the bounding box, the map's dimensions, and the data source all set up, we are finally ready to render the map into an image file. This is done using a single function call, as follows:
hilite = "[id] = " + str(countryID)
imgFile = mapGenerator.generateMap("countries",
                                   minLong, minLat,
                                   maxLong, maxLat,
                                   mapWidth, mapHeight,
                                   hiliteExpr=hilite)
Notice that we set the hiliteExpr parameter to the value [id] = "+str(countryID). This visually highlights the country with the given ID.
The mapGenerator.generateMap() function returns a reference to a PNG-format image file containing the generated map. This image file is stored in a temporary directory, and the file's relative pathname is returned to the caller. This allows us to use the returned imgFile directly within our CGI script, like this:
print(HEADER)
print('<b>' + name + '</b>')
print('<p>')
print('<form method="POST" action="showResults.py">')
print('Select all features within')
print('<input type="text" name="radius" value="10" size="2">')
print('miles of a point.')
print('<p>')
print('Click on the map to identify your starting point:')
print('<br>')
print('<input type="image" src="' + imgFile + '" ismap>')
print(HIDDEN_FIELD.format("countryID", countryID))
print(HIDDEN_FIELD.format("countryName", name))
print(HIDDEN_FIELD.format("mapWidth", mapWidth))
print(HIDDEN_FIELD.format("mapHeight", mapHeight))
print(HIDDEN_FIELD.format("minLong", minLong))
print(HIDDEN_FIELD.format("minLat", minLat))
print(HIDDEN_FIELD.format("maxLong", maxLong))
print(HIDDEN_FIELD.format("maxLat", maxLat))
print('</form>')
print(FOOTER)The use of <input type="image" src="..." ismap> in this CGI script has the interesting effect of making the map clickable: when the user clicks on the image, the enclosing HTML form will be submitted with two extra parameters named x and y. These contain the coordinate within the image that the user clicked on.
This completes the selectArea.py CGI script. If you are running this on Mac OS X or a Linux machine, you will need to make sure you added an appropriate shebang line to the start of your program and made it executable, as described earlier, so that it can run as a CGI script.
All going well, you should be able to point your web browser to http://127.0.0.1:8000/cgi-bin/selectCountry.py.
When you select a country, you should see a map of that country displayed within your web browser. If you click within the map, you'll get a 404 error, indicating that the final CGI script hasn't been written yet.
The final CGI script is where the real work is done. Start by creating your showResults.py file, and type the following into this file:
#!/usr/bin/env python

import psycopg2
import cgi

import mapGenerator

############################################################

MAX_WIDTH = 800
MAX_HEIGHT = 600

METERS_PER_MILE = 1609.344

############################################################

connection = psycopg2.connect(database="distal",
                              user="distal_user",
                              password="...")
cursor = connection.cursor()In this script, we will take the (x, y) coordinate the user clicked on along with the entered search radius, convert the (x, y) coordinate into a longitude and latitude, and identify all the place names within that search radius. We will then generate a high-resolution map showing the shorelines and place names within the search radius and display that map to the user.
Let's examine each of these steps in turn.
The selectArea.py script generates an HTML form that is submitted when the user clicks on the low-resolution country map. The showResults.py script receives the form parameters, including the x and y coordinates of the point the user clicked on.
By itself, this coordinate isn't very useful, as it's simply the x and y offset, measured in pixels, of the point the user clicked on. We need to translate the submitted (x, y) pixel coordinate into a latitude and longitude value corresponding to the clicked-on point on the earth's surface.
To do this, we need to have the following information:
- The map's bounding box in geographic coordinates:
minLong,minLat,maxLong, andmaxLat - The map's size in pixels:
mapWidthandmapHeight
These variables were all calculated in the previous section and passed to us using hidden form variables, along with the country name and ID, the desired search radius, and the (x,y) coordinate of the clicked-on point. We can retrieve all of these using the cgi module. To do this, add the following to the end of your showResults.py file:
form = cgi.FieldStorage()

countryID   = int(form['countryID'].value)
radius      = int(form['radius'].value)
x           = int(form['x'].value)
y           = int(form['y'].value)
mapWidth    = int(form['mapWidth'].value)
mapHeight   = int(form['mapHeight'].value)
countryName = form['countryName'].value
minLong     = float(form['minLong'].value)
minLat      = float(form['minLat'].value)
maxLong     = float(form['maxLong'].value)
maxLat      = float(form['maxLat'].value)
With this information, we can now calculate the latitude and longitude that the user clicked on. We start by calculating how far across the image the user clicked, as a number in the range from 0 to 1:
xFract = float(x)/float(mapWidth)
An xFract value of 0.0 corresponds to the left side of the image, while an xFract value of 1.0 corresponds to the right side of the image. We then combine this with the minimum and maximum longitude values to calculate the longitude of the clicked-on point:
longitude = minLong + xFract * (maxLong-minLong)
We then do the same to convert the Y coordinate into a latitude value:
yFract = float(y)/float(mapHeight)
latitude = minLat + (1-yFract) * (maxLat-minLat)
Notice that we are using (1-yFract) rather than yFract in the preceding calculation. This is because the minLat value refers to the latitude of the bottom of the image, while a yFract value of 0.0 corresponds to the top of the image. By using (1-yFract), we flip the values vertically so that the latitude is calculated correctly.
Let's review what we have achieved so far: the user has selected a country, viewed a simple map of the country's outline, entered the desired search radius, and clicked on a point on the map to identify the origin for the search. We then converted this clicked-on point into a latitude and longitude value.
All of this provides us with three numbers: the desired search radius and the latitude and longitude of the point at which to start the search. Our task now is to identify which place names are within the given search radius of the clicked-on point:
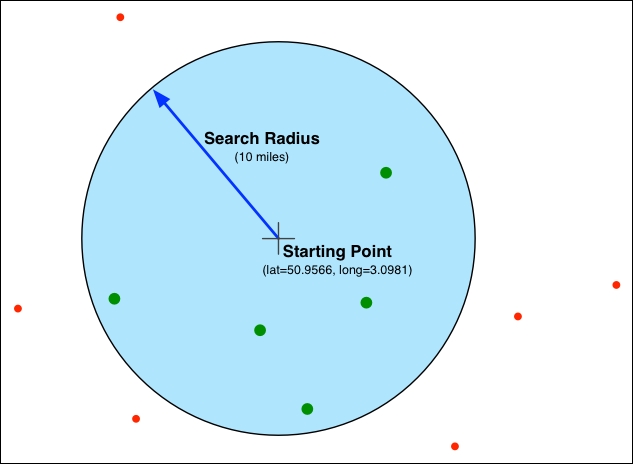
Fortunately, because our places table uses the GEOGRAPHY column type, we can ask PostGIS to do all the hard work for us. Here is the necessary code to find the matching place names:
cursor.execute("SELECT ST_X(position::geometry)," +
               "ST_Y(position::geometry),name " +
               "FROM places WHERE " +
               "ST_DWithin(position, ST_MakePoint(%s, %s), %s)",
               (longitude, latitude, radius * METERS_PER_MILE))

points = []
for name,long,lat in cursor:
points.append([long, lat, name])The matching place names will be stored in the points variable, as a list of (longitude, latitude, name) tuples.
Now that we have calculated the list of place names within the desired search radius, we can use the mapGenerator.py module to display them. To do this, we're going to have to calculate the bounding box for the area to display, based on the clicked-on point, the supplied search radius, and a margin to ensure that we don't draw place names right on the edge of the map:
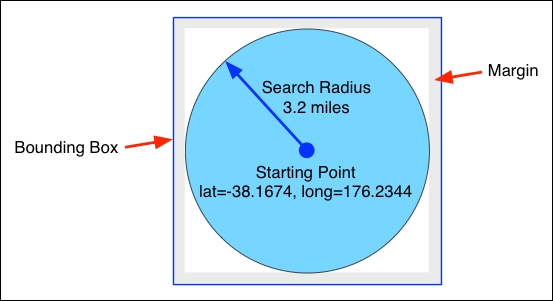
To do this, we'll use pyproj to calculate the position of four coordinates directly north, south, east, and west of the starting point:
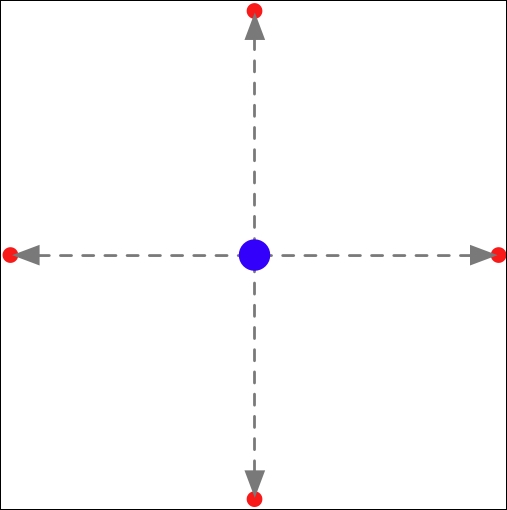
How far north, south, east, or west we go depends on the search radius, but we'll also add a 10% margin to this distance. Using pyproj, this calculation is quite straightforward:
geod = pyproj.Geod(ellps="WGS84")
distance = radius * METERS_PER_MILE * 1.1

x,y,angle = geod.fwd(longitude, latitude, 0, distance)
maxLat = y

x,y,angle = geod.fwd(longitude, latitude, 90, distance)
maxLong = x

x,y,angle = geod.fwd(longitude, latitude, 180, distance)
minLat = y

x,y,angle = geod.fwd(longitude, latitude, 270, distance)
minLong = x
Once this has been done, we can use our mapGenerator.py module to generate a map showing the results we have found:
imgFile = mapGenerator.generateMap("shorelines",
                                   minLong, minLat,
                                   maxLong, maxLat,
                                   600, 600,
                                   points=points)
When we called the map generator previously, we used a filter expression to highlight particular features. In this case, we don't need to highlight anything. Instead, we pass it the list of place names to display on the map in the keyword parameter named points.
The map generator creates a PNG-format file and returns a reference to that file. Let's finish our program by displaying the map so the user can see it:
print(HEADER)
print('<b>' + countryName + '</b>')
print('<p>')
print('<img src="' + imgFile + '">')
print(FOOTER)
This completes our first attempt at the entire DISTAL application. Let's now see how it runs.