Table of Contents for
Python Geospatial Development - Third Edition
 Python Geospatial Development - Third Edition
Published by
Packt Publishing, 2016
Python Geospatial Development - Third Edition
Published by
Packt Publishing, 2016
- Cover
- Table of Contents
- Python Geospatial Development Third Edition
- Python Geospatial Development Third Edition
- Credits
- About the Author
- About the Reviewer
- www.PacktPub.com
- Preface
- What you need for this book
- Who this book is for
- Conventions
- Reader feedback
- Customer support
- 1. Geospatial Development Using Python
- Geospatial development
- Applications of geospatial development
- Recent developments
- Summary
- 2. GIS
- GIS data formats
- Working with GIS data manually
- Summary
- 3. Python Libraries for Geospatial Development
- Dealing with projections
- Analyzing and manipulating Geospatial data
- Visualizing geospatial data
- Summary
- 4. Sources of Geospatial Data
- Sources of geospatial data in raster format
- Sources of other types of geospatial data
- Choosing your geospatial data source
- Summary
- 5. Working with Geospatial Data in Python
- Working with geospatial data
- Changing datums and projections
- Performing geospatial calculations
- Converting and standardizing units of geometry and distance
- Exercises
- Summary
- 6. Spatial Databases
- Spatial indexes
- Introducing PostGIS
- Setting up a database
- Using PostGIS
- Recommended best practices
- Summary
- 7. Using Python and Mapnik to Generate Maps
- Creating an example map
- Mapnik concepts
- Summary
- 8. Working with Spatial Data
- Designing and building the database
- Downloading and importing the data
- Implementing the DISTAL application
- Using DISTAL
- Summary
- 9. Improving the DISTAL Application
- Dealing with the scale problem
- Performance
- Summary
- 10. Tools for Web-based Geospatial Development
- A closer look at three specific tools and techniques
- Summary
- 11. Putting It All Together – a Complete Mapping System
- Designing the ShapeEditor
- Prerequisites
- Setting up the database
- Setting up the ShapeEditor project
- Defining the ShapeEditor's applications
- Creating the shared application
- Defining the data models
- Playing with the admin system
- Summary
- 12. ShapeEditor – Importing and Exporting Shapefiles
- Importing shapefiles
- Exporting shapefiles
- Summary
- 13. ShapeEditor – Selecting and Editing Features
- Editing features
- Adding features
- Deleting features
- Deleting shapefiles
- Using the ShapeEditor
- Further improvements and enhancements
- Summary
- Index
To better understand how the various parts of Mapnik work together, let's write a simple Python program to generate the map shown at the start of this chapter. This map makes use of the World Borders Dataset, which you downloaded in an earlier chapter; copy the TM_WORLD_BORDERS-0.3 shapefile directory into a convenient place, and create a new Python script in the same place. We'll call this program createExampleMap.py.
We'll start by importing the Mapnik toolkit and defining some constants the program will need:
import mapnik

MIN_LAT  = -35
MAX_LAT  = +35
MIN_LONG = -12
MAX_LONG = +50

MAP_WIDTH  = 700
MAP_HEIGHT = 800
The MIN_LAT, MAX_LAT, MIN_LONG, and MAX_LONG constants define the lat/long coordinates for the portion of the world to display on the map, while the MAP_WIDTH and MAP_HEIGHT constants define the size of the generated map image, measured in pixels. Obviously, you can change these if you want.
We're now ready to define the contents of the map. This map will have two layers, one for drawing the polygons and another for drawing the labels. We'll define a Mapnik Style object for each of these two layers. Let's start with the style for the Polygons layer:
polygonStyle = mapnik.Style()
As we discussed in the previous section, a Filter object lets you choose which particular features a rule will apply to. In this case, we want to set up two rules, one to draw Angola in dark red, and another to draw all the other countries in dark green:
rule = mapnik.Rule()
rule.filter = mapnik.Filter("[NAME] = 'Angola'")
symbol = mapnik.PolygonSymbolizer(mapnik.Color("#604040"))
rule.symbols.append(symbol)

polygonStyle.rules.append(rule)

rule = mapnik.Rule()
rule.filter = mapnik.Filter("[NAME] != 'Angola'")
symbol = mapnik.PolygonSymbolizer(mapnik.Color("#406040"))
rule.symbols.append(symbol)

polygonStyle.rules.append(rule)
Notice how we use a PolygonSymbolizer to fill each country's outline with an appropriate color and then add this symbolizer to our current rule. As we define the rules, we add them to our polygon style.
Now that we've filled the country polygons, we'll define an additional rule to draw the polygon outlines:
rule = mapnik.Rule()
symbol = mapnik.LineSymbolizer(mapnik.Color("#000000"), 0.1)
rule.symbols.append(symbol)

polygonStyle.rules.append(rule)
This is all that's required to display the country polygons on the map. Let's now go ahead and define a second Mapnik Style object for the "Labels" layer:
labelStyle = mapnik.Style()

rule = mapnik.Rule()
symbol = mapnik.TextSymbolizer(mapnik.Expression("[NAME]"),
                               "DejaVu Sans Book", 12,
                               mapnik.Color("#000000"))
rule.symbols.append(symbol)

labelStyle.rules.append(rule)
This style uses a TextSymbolizer to draw the labels onto the map. Notice that we create an Expression object to define the text to be displayed—in this case, we want to display the shapefile's NAME attribute; as you might expect, this attribute contains the name of the country.
Note
In this example, we are only using a single Mapnik style for each layer. When generating a more complex map, you will typically have a number of styles that can be applied to each layer, and styles may be shared between layers as appropriate. For this example, though, we are keeping the map definition as simple as possible.
Now that we have set up our styles, we can start to define our map's layers. Before we do this, though, we need to set up our data source:
datasource = mapnik.Shapefile(file="TM_WORLD_BORDERS-0.3/" +
                                   "TM_WORLD_BORDERS-0.3.shp")
We can then define the two layers used by our map:
polygonLayer = mapnik.Layer("Polygons")
polygonLayer.datasource = datasource
polygonLayer.styles.append("PolygonStyle")

labelLayer = mapnik.Layer("Labels")
labelLayer.datasource = datasource
labelLayer.styles.append("LabelStyle")We can now finally create our Map object. A Mapnik Map object has a width and height, a projection, a background color, a list of styles, and a list of the layers that make up the map:
map = mapnik.Map(MAP_WIDTH, MAP_HEIGHT,
               "+proj=longlat +datum=WGS84")
map.background = mapnik.Color("#8080a0")

map.append_style("PolygonStyle", polygonStyle)
map.append_style("LabelStyle", labelStyle)

map.layers.append(polygonLayer)
map.layers.append(labelLayer)
The last thing we have to do is tell Mapnik to zoom in on the desired area of the world and then render the map into an image file:
map.zoom_to_box(mapnik.Box2d(MIN_LONG, MIN_LAT,
                             MAX_LONG, MAX_LAT))
mapnik.render_to_file(map, "map.png")
If you run this program and open the resulting map.png file, you will see the map you generated:
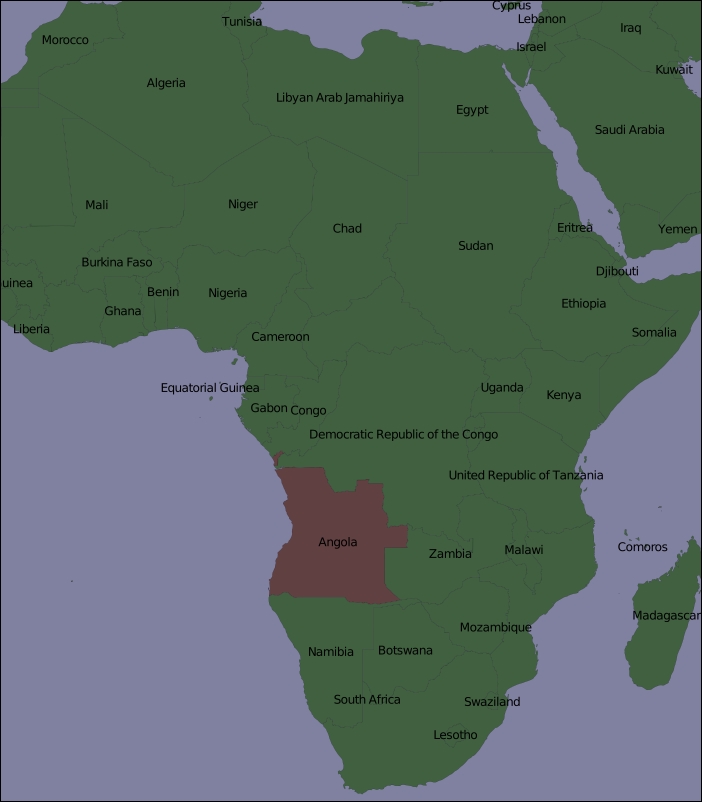
Obviously, there's a lot more that you can do with Mapnik, but this example covers the main points and should be enough to let you start generating your own maps. Make sure that you play with this example to become familiar with the way Mapnik works. Here are some things you might like to try:
- Adjusting the
MIN_LAT,MIN_LONG,MAX_LAT, andMAX_LONGconstants at the start of the program to zoom in on the country where you reside - Changing the size of the generated image
- Altering the map's colors
- Adding extra rules to display the country name in different font sizes and colors based on the country's population