Table of Contents for
The IDA Pro Book, 2nd Edition
 The IDA Pro Book, 2nd Edition
Published by
No Starch Press, 2011
The IDA Pro Book, 2nd Edition
Published by
No Starch Press, 2011
- Cover
- The IDA Pro Book
- PRAISE FOR THE FIRST EDITION OF THE IDA PRO BOOK
- Acknowledgments
- Introduction
- I. Introduction to IDA
- 1. Introduction to Disassembly
- The What of Disassembly
- The Why of Disassembly
- The How of Disassembly
- Summary
- 2. Reversing and Disassembly Tools
- Summary Tools
- Deep Inspection Tools
- Summary
- 3. IDA Pro Background
- Obtaining IDA Pro
- IDA Support Resources
- Your IDA Installation
- Thoughts on IDA’s User Interface
- Summary
- II. Basic IDA Usage
- 4. Getting Started with IDA
- IDA Database Files
- Introduction to the IDA Desktop
- Desktop Behavior During Initial Analysis
- IDA Desktop Tips and Tricks
- Reporting Bugs
- Summary
- 5. IDA Data Displays
- Secondary IDA Displays
- Tertiary IDA Displays
- Summary
- 6. Disassembly Navigation
- Stack Frames
- Searching the Database
- Summary
- 7. Disassembly Manipulation
- Commenting in IDA
- Basic Code Transformations
- Basic Data Transformations
- Summary
- 8. Datatypes and Data Structures
- Creating IDA Structures
- Using Structure Templates
- Importing New Structures
- Using Standard Structures
- IDA TIL Files
- C++ Reversing Primer
- Summary
- 9. Cross-References and Graphing
- IDA Graphing
- Summary
- 10. The Many Faces of IDA
- Using IDA’s Batch Mode
- Summary
- III. Advanced IDA Usage
- 11. Customizing IDA
- Additional IDA Configuration Options
- Summary
- 12. Library Recognition Using FLIRT Signatures
- Applying FLIRT Signatures
- Creating FLIRT Signature Files
- Summary
- 13. Extending IDA’s Knowledge
- Augmenting Predefined Comments with loadint
- Summary
- 14. Patching Binaries and Other IDA Limitations
- IDA Output Files and Patch Generation
- Summary
- IV. Extending IDA’s Capabilities
- 15. IDA Scripting
- The IDC Language
- Associating IDC Scripts with Hotkeys
- Useful IDC Functions
- IDC Scripting Examples
- IDAPython
- IDAPython Scripting Examples
- Summary
- 16. The IDA Software Development Kit
- The IDA Application Programming Interface
- Summary
- 17. The IDA Plug-in Architecture
- Building Your Plug-ins
- Installing Plug-ins
- Configuring Plug-ins
- Extending IDC
- Plug-in User Interface Options
- Scripted Plug-ins
- Summary
- 18. Binary Files and IDA Loader Modules
- Manually Loading a Windows PE File
- IDA Loader Modules
- Writing an IDA Loader Using the SDK
- Alternative Loader Strategies
- Writing a Scripted Loader
- Summary
- 19. IDA Processor Modules
- The Python Interpreter
- Writing a Processor Module Using the SDK
- Building Processor Modules
- Customizing Existing Processors
- Processor Module Architecture
- Scripting a Processor Module
- Summary
- V. Real-World Applications
- 20. Compiler Personalities
- RTTI Implementations
- Locating main
- Debug vs. Release Binaries
- Alternative Calling Conventions
- Summary
- 21. Obfuscated Code Analysis
- Anti–Dynamic Analysis Techniques
- Static De-obfuscation of Binaries Using IDA
- Virtual Machine-Based Obfuscation
- Summary
- 22. Vulnerability Analysis
- After-the-Fact Vulnerability Discovery with IDA
- IDA and the Exploit-Development Process
- Analyzing Shellcode
- Summary
- 23. Real-World IDA Plug-ins
- IDAPython
- collabREate
- ida-x86emu
- Class Informer
- MyNav
- IdaPdf
- Summary
- VI. The IDA Debugger
- 24. The IDA Debugger
- Basic Debugger Displays
- Process Control
- Automating Debugger Tasks
- Summary
- 25. Disassembler/Debugger Integration
- IDA Databases and the IDA Debugger
- Debugging Obfuscated Code
- IdaStealth
- Dealing with Exceptions
- Summary
- 26. Additional Debugger Features
- Debugging with Bochs
- Appcall
- Summary
- A. Using IDA Freeware 5.0
- Using IDA Freeware
- B. IDC/SDK Cross-Reference
- Index
- About the Author
Bochs is an open source x86 emulation environment. Bochs is capable of full-system emulation of x86 computer systems and includes emulation for common I/O devices and a custom BIOS. Bochs provides an emulation-based alternative to virtualization software such as VMware Workstation. Elias Bachaalany of the Hex-Rays development team has taken the lead on integrating Bochs with IDA to provide an emulation-based alternative to traditional debugging.[240] Windows versions of IDA ship with and install a compatible version of Bochs, while non-Windows users wishing to make use of Bochs must make sure that version 2.4.2 or later is installed on their system.
With Bochs installed, IDA offers a Local Bochs debugger choice whenever you have an x86 binary open in IDA. The availability of Bochs offers the opportunity to perform local debugging of Windows applications on non-Windows systems, because the application will be emulated rather than executed as a native process. Because it’s an emulator, Bochs configuration options differ somewhat from those available with more traditional debuggers. One of the most important things to understand about Bochs is that it can operate in three distinct modes: disk image mode, IDB mode, and PE mode. The choice of mode is made using the Bochs specific debugger configuration dialog shown in Figure 26-4.
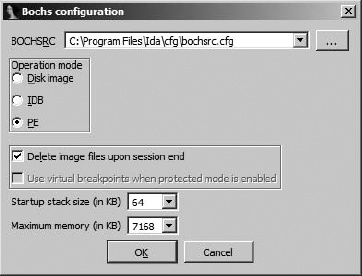
Each of the available modes offers a drastically different degree of fidelity in terms of the quality and type of emulation being performed.
Working from the ground up, IDB is the most basic Bochs mode. In IDB mode, the only code that Bochs is aware of is the code contained in your database. Memory regions are mapped into Bochs and populated by copying bytes from the database. A configurable amount of stack space is provided based on settings in the Bochs options dialog, and IDA will make its own decision as to where the stack will be allocated. Emulated execution begins (meaning the instruction pointer is initially positioned) at the database symbol named ENTRY if one has been defined. If an ENTRY symbol is not present, IDA tests to see if a range of locations is currently selected in the open database and uses the beginning of the range as the debugger entry point. If no selection exists, then the current cursor location is taken as the initial instruction pointer value. When running in IDB mode, keep in mind that Bochs has no notion of any operating system support such as shared libraries or the location of any well-known structures within a typical process address space. It is equally possible to step through a PE file, an ELF file, a Mach-O file, or a raw blob of machine code such as an exploit payload as long as the code makes no reference to anything that might reside outside the database. One way that IDB might be used is for executing a single function in an effort to understand its behavior without the requirement to craft a complete process or disk image to do so.
PE mode offers the opportunity to debug at something approaching the process level. When PE mode is selected and activated, IDA’s Bochs control module (an IDA plug-in) takes over and behaves much like the Windows process loader would if you were actually launching a native Windows process. A PE mode process receives process (PEB) and thread (TEB) environment blocks, along with a stack that mimics those that would be created in an actual process.
The Bochs plug-in also loads (without executing any code) a number of common Windows libraries into the emulated process address space in order to properly handle any library calls made by the process. The exact set of libraries that Bochs loads on debugger start is configurable and is specified in <IDADIR>/plugins/bochs/startup.idc. Any library may be loaded as is or may be designated to be stubbed out. If a library is marked to be stubbed, then the Bochs plug-in will automatically hook every function exported by that library and redirect execution to a Bochs interception function (refer to startup.idc and the IDA help system for more details). This stubbing technique provides an extensible means for users to define custom behaviors for any library function. For any library that is stubbed by IDA, it is possible to define a corresponding script file in which you may define your custom behaviors. For any library, foolib.dll for example, the Bochs plug-in scans for a related script named api_foolib.idc or api_foolib.py within the <IDADIR>/plugins/bochs directory. IDA ships with <IDADIR>/plugins/bochs/api_kernel32.idc, which provides a good example of the structure of such a file and the implementation of custom behaviors for a number of functions.
The ability to hook library functions and define custom implementations is important in PE mode because there is no operating system layer to perform all of the heavy lifting needed by the shared libraries. For example, by providing an alternate, script-based behavior for a function such as VirtualAlloc, which would fail if it could not communicate with the operating system, it is possible to convince (to some degree) the emulated process that it is running as an actual process. The goal when creating such script-based behaviors is to provide the emulated process with the responses it would expect to see if were communicating with the actual library functions, which in turn were communicating with the actual operating system.
If you use IDA on a non-Windows platform, you may take full advantage of Bochs PE mode by copying any required libraries (as specified in startup.idc) from a Windows system onto your IDA system and editing startup.idc to point at the directory containing all of the copied libraries. The following listing shows an example of the required changes.
// Define additional DLL path
// (add triple slashes to enable the following lines)
/// path /home/idauser/xp_dlls/=c:\winnt\system32\
When using PE mode, one difference you will note when launching a process under Bochs is that IDA does not open a warning dialog to remind you of the danger of launching a potentially malicious process under debugger control. This is because the only process that gets created is the Bochs emulator process, and all of the code that you are debugging is viewed by the Bochs emulator as data that happens to represent code for it to emulate. No native process is ever created from the binary that you are debugging.
The third mode of operation for the Bochs debugger is called disk image mode. Aside from IDA’s ability to make use of Bochs, Bochs is a full-blown x86 system emulator on its own. It is quite possible to create hard drive images, using the bximage tool supplied with Bochs; install an operating system on the disk image, using Bochs and any required installation medium for the desired operating system; and ultimately use Bochs to run your guest operating system within an emulated environment.
If your primary goal in using IDA/Bochs is to understand the behavior of a single process, then disk image mode may not be for you. Isolating and observing a single process executing within a fully emulated operating system is not an easy task and requires a detailed understanding of the operating system and how it manages processes and memory. Where you may find IDA/Bochs useful is in analyzing system BIOS and boot code, which can be followed relatively easily before the operating system code takes over.
In disk image mode, you have no executable file image to load into IDA. Instead, IDA ships with a loader that recognizes Bochs configuration (boch-src) files.[241] A bochsrc file is used to describe the hardware execution environment when Bochs is used as a full system emulator. IDA’s default bochsrc file is located at <IDADIR>/cfg/bochsrc.cfg. Among other things, a bochsrc file is used to specify the locations of the system BIOS, video ROM, and disk image files. IDA’s bochsrc loader offers minimal loading services, doing nothing more than reading the first sector of the first disk image file specified in the Bochs configuration file being loaded and then selecting the Bochs debugger for use with the new database. The use of IDA/Bochs in a master boot record development scenario is discussed on the Hex-Rays blog.[242]
[240] See “Designing a minimal operating system to emulate 32/64bits x86 code snippets, shellcode or malware in Bochs” from Recon 2011 (http://www.recon.cx/).
[241] See http://bochs.sourceforge.net/doc/docbook/user/bochsrc.html for information on the bochsrc file format.
[242] See http://www.hexblog.com/?p=103.