Table of Contents for
The IDA Pro Book, 2nd Edition
 The IDA Pro Book, 2nd Edition
Published by
No Starch Press, 2011
The IDA Pro Book, 2nd Edition
Published by
No Starch Press, 2011
- Cover
- The IDA Pro Book
- PRAISE FOR THE FIRST EDITION OF THE IDA PRO BOOK
- Acknowledgments
- Introduction
- I. Introduction to IDA
- 1. Introduction to Disassembly
- The What of Disassembly
- The Why of Disassembly
- The How of Disassembly
- Summary
- 2. Reversing and Disassembly Tools
- Summary Tools
- Deep Inspection Tools
- Summary
- 3. IDA Pro Background
- Obtaining IDA Pro
- IDA Support Resources
- Your IDA Installation
- Thoughts on IDA’s User Interface
- Summary
- II. Basic IDA Usage
- 4. Getting Started with IDA
- IDA Database Files
- Introduction to the IDA Desktop
- Desktop Behavior During Initial Analysis
- IDA Desktop Tips and Tricks
- Reporting Bugs
- Summary
- 5. IDA Data Displays
- Secondary IDA Displays
- Tertiary IDA Displays
- Summary
- 6. Disassembly Navigation
- Stack Frames
- Searching the Database
- Summary
- 7. Disassembly Manipulation
- Commenting in IDA
- Basic Code Transformations
- Basic Data Transformations
- Summary
- 8. Datatypes and Data Structures
- Creating IDA Structures
- Using Structure Templates
- Importing New Structures
- Using Standard Structures
- IDA TIL Files
- C++ Reversing Primer
- Summary
- 9. Cross-References and Graphing
- IDA Graphing
- Summary
- 10. The Many Faces of IDA
- Using IDA’s Batch Mode
- Summary
- III. Advanced IDA Usage
- 11. Customizing IDA
- Additional IDA Configuration Options
- Summary
- 12. Library Recognition Using FLIRT Signatures
- Applying FLIRT Signatures
- Creating FLIRT Signature Files
- Summary
- 13. Extending IDA’s Knowledge
- Augmenting Predefined Comments with loadint
- Summary
- 14. Patching Binaries and Other IDA Limitations
- IDA Output Files and Patch Generation
- Summary
- IV. Extending IDA’s Capabilities
- 15. IDA Scripting
- The IDC Language
- Associating IDC Scripts with Hotkeys
- Useful IDC Functions
- IDC Scripting Examples
- IDAPython
- IDAPython Scripting Examples
- Summary
- 16. The IDA Software Development Kit
- The IDA Application Programming Interface
- Summary
- 17. The IDA Plug-in Architecture
- Building Your Plug-ins
- Installing Plug-ins
- Configuring Plug-ins
- Extending IDC
- Plug-in User Interface Options
- Scripted Plug-ins
- Summary
- 18. Binary Files and IDA Loader Modules
- Manually Loading a Windows PE File
- IDA Loader Modules
- Writing an IDA Loader Using the SDK
- Alternative Loader Strategies
- Writing a Scripted Loader
- Summary
- 19. IDA Processor Modules
- The Python Interpreter
- Writing a Processor Module Using the SDK
- Building Processor Modules
- Customizing Existing Processors
- Processor Module Architecture
- Scripting a Processor Module
- Summary
- V. Real-World Applications
- 20. Compiler Personalities
- RTTI Implementations
- Locating main
- Debug vs. Release Binaries
- Alternative Calling Conventions
- Summary
- 21. Obfuscated Code Analysis
- Anti–Dynamic Analysis Techniques
- Static De-obfuscation of Binaries Using IDA
- Virtual Machine-Based Obfuscation
- Summary
- 22. Vulnerability Analysis
- After-the-Fact Vulnerability Discovery with IDA
- IDA and the Exploit-Development Process
- Analyzing Shellcode
- Summary
- 23. Real-World IDA Plug-ins
- IDAPython
- collabREate
- ida-x86emu
- Class Informer
- MyNav
- IdaPdf
- Summary
- VI. The IDA Debugger
- 24. The IDA Debugger
- Basic Debugger Displays
- Process Control
- Automating Debugger Tasks
- Summary
- 25. Disassembler/Debugger Integration
- IDA Databases and the IDA Debugger
- Debugging Obfuscated Code
- IdaStealth
- Dealing with Exceptions
- Summary
- 26. Additional Debugger Features
- Debugging with Bochs
- Appcall
- Summary
- A. Using IDA Freeware 5.0
- Using IDA Freeware
- B. IDC/SDK Cross-Reference
- Index
- About the Author
Over the last two chapters, we have covered the majority of the debugger’s basic features including scripting debugger actions, as well as its usefulness in de-obfuscating code. In this chapter, we round out our discussion of the debugger by looking at remote debugging with IDA, the use of the Bochs x86 emulator[237] as a debugging platform, and the Appcall[238] feature that effectively extends IDA’s scripting capabilities to include any function defined with a process and its associated libraries.
All versions of IDA ship with server components designed to facilitate remote debugging sessions. In addition, IDA is capable of interfacing with remote gdb sessions that make use of gdb_server or built-in gdb stubs. One of the principal advantages of remote debugging is the ability to use the GUI debugger interface as a frontend for any debugging session. For the most part, other than initial setup and establishing the connection to the remote debugging server, remote debugging sessions differ little from local debugging sessions.
Remote debugging begins by launching an appropriate debugging server component on the computer on which a process is to be debugged. IDA ships with the following server components:
win32_remote.exe Server component executed on Windows computers for the purpose of debugging 32-bit Windows applications |
win64_remotex64.exe Server component executed on 64-bit Windows computers for the purpose of debugging 64-bit Windows applications (IDA Advanced only) |
wince_remote_arm.dll Server component uploaded to Windows CE devices (via ActiveSync) |
mac_server Server component executed on OS X computers for the purpose of debugging 32-bit OS X applications |
mac_serverx64 Server component executed on 64-bit OS X computers for the purpose of debugging 64-bit OS X applications (IDA Advanced only) |
linux_server Server component executed on Linux computers for the purpose of debugging 32-bit Linux applications |
linux_serverx64 Server component executed on 64-bit Linux computers for the purpose of debugging 64-bit Linux applications (IDA Advanced only) |
armlinux_server Server component executed on ARM-based computers for the purpose of debugging ARM applications |
android_server Server component executed on Android devices for the purpose of debugging Android applications |
In order to perform remote debugging on any platform, the only component you are required to execute on that platform is the appropriate server component. It is not necessary to install a full version of IDA on the remote platform. In other words, if you intend to use a Windows version of IDA as your debugging client, and you wish to remotely debug Linux applications, the only file, other than the binary that is being debugged, that you need to copy to and execute on the Linux system is linux_server.[239]
Regardless of the platform you intend to run the server on, the server components accept three command-line options, as listed here:
-p<> is used to specify an alternate TCP port for the server to listen on. The default port is 23946. Note that no space should be entered between the -p and the port number. |
-P<> is used to specify a password that must be supplied in order for a client to connect to the debug server. Note that no space should be entered between the -P and the provided password. |
-v places the server in verbose mode. |
There is no option to restrict the IP address on which the server listens. If you wish to restrict incoming connections, you may do so using host-based firewall rules as applicable to your debugging platform. Once a server has been launched, IDA may be executed from any supported operating system and used to provide a client interface to the debug server; however, a server can handle only one active debugging session at any given time. If you wish to maintain several simultaneous debugging sessions, you must launch several instances of the debugging server on several different TCP ports.
From the client perspective, remote debugging is initiated by specifying a server hostname and ports via the Debugger ▸ Process Options command, as shown in Figure 26-1. This action must be performed prior to starting or attaching to the process you intend to debug.
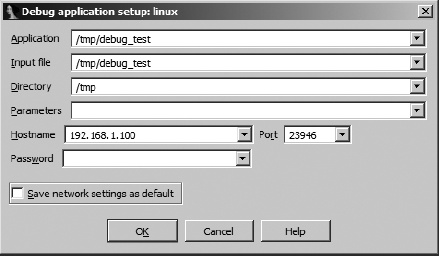
The first four fields in this dialog apply to both local and remote debugging sessions, while the Hostname, Port, and Password fields apply only to remote debugging sessions. The fields of this dialog are summarized here.
| Application The full path to the application binary that you wish to debug. For local debugging sessions, this is a path in the local filesystem. For a remote debugging session, this is the path on the debugging server. If you choose not to use a full path, the remote server will search its current working directory. |
| Input file The full path to the file that was used to create the IDA database. For local debugging sessions, this is a path in the local filesystem. For a remote debugging session, this is the path on the debugging server. If you choose not to use a full path, the remote server will search its current working directory. |
| Directory The working directory in which the process should be launched. For local debugging, this directory must exist in the local file-system. For remote debugging, this is a directory on the debugging server. |
Parameters Used to specify any command-line parameters to be passed to the process when it is started. Note that shell metacharacters (such as <, >, and |) are not honored here. Any such characters will be passed to the process as command-line arguments. Thus it is not possible to launch a process under the debugger and have that process perform any sort of input or output redirection. For remote debugging sessions, process output is displayed in the console that was used to launch the debugging server. |
| Hostname The hostname or IP address of the remote debugging server. Leave this field blank for local debugging sessions. |
| Port The TCP port number on which the remote debugging server is listening. |
| Password The password expected by the remote debugging server. Note that the data entered into this field is not masked, making it possible for the password to be viewed by anyone who can observe your display. Further, this password is transmitted to the remote server as plain text, making it observable by anyone who can intercept your network packets. |
At first glance, the Application and Input File fields in Figure 26-1 may seem to be identical. When the file opened in your IDA database is the same as the executable file that you wish to run on the remote computer, these two fields will hold the same value. However, in some cases, you may wish to debug a library file (such as a DLL) that you are analyzing in an IDA database. It is not possible to debug a library file directly because library files are not standalone executables. In such cases, you will set the Input File field to the path of the library file. The Application field must be set to the name of an application that makes use of the library file that you wish to debug.
The procedures for connecting to a remote gdb server are nearly identical to the procedures for attaching to a remote IDA debugging server with two minor exceptions. First, no password is required to connect to a gdb_server, and second, IDA allows specification of gdb-specific behaviors via the Set specific options button within the debugger setup dialog. Figure 26-2 shows the GDB Configuration dialog.
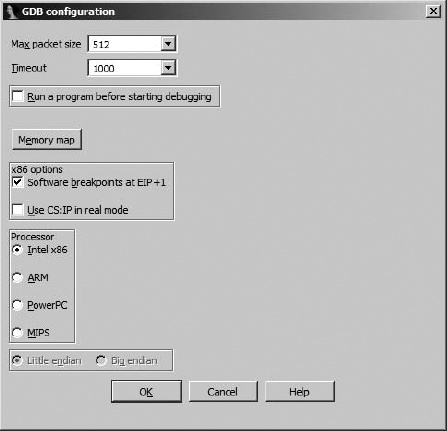
Of note is the fact that IDA has no way of knowing the architecture of the computer on which the gdb_server is running and that you are obligated to specify a processor type (which defaults to Intel x86) and potentially the endian-ness of that processor. IDA is currently capable of providing a debugging interface for x86, ARM, PowerPC, and MIPS processors.
A number of different scenarios exist if you intend to attach to a running process on your remote debugging server. First, if you have no database open in IDA, you may select Debugger ▸ Attach and choose from IDA’s list of available debuggers. If you choose one of IDA’s remote debuggers, you are presented with the configuration dialog shown in Figure 26-3.
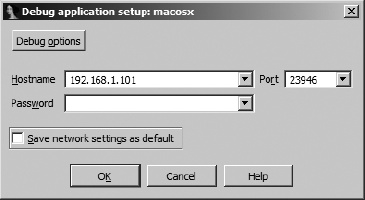
Once you provide the appropriate connection parameters and click OK, IDA obtains and displays a process list from the remote debugging server, allowing you to select and attach to a specific process.
In the second scenario, you might already have a binary open in IDA and wish to attach to a remote process. In this case you may need to select a debugger (if none has been previously specified for the open file type) or switch your debugger type (if a remote debugger is not currently selected). Once a debugger has been selected, you must provide hostname and password information for the remote debugger server, as shown in Figure 26-1, at which point you may attach to a remote process using Debugger ▸ Attach to Process.
In Chapter 25 we discussed the IDA debugger’s handling of exceptions and how to modify the debugger’s exception-handling behavior. During remote debugging sessions, the debugger’s default exception-handling behavior is dictated by the exceptions.cfg file, which resides on the client machine (the machine on which you are actually running IDA). This allows you to modify exceptions.cfg and reload the changes via the Debugger Setup dialog (see Figure 25-4) without the need to access the remote server.
During a remote debugging session, it remains possible to utilize scripts and plug-ins to automate debugging tasks. Any scripts or plug-ins that you choose to execute will run within IDA on the client machine. IDA will in turn handle any actions that are required to interact with the remote process, such as setting breakpoints, querying state, modifying memory, or resuming execution. From the script’s perspective, all behaviors will appear just as if the debugging session was taking place locally. The only thing to remember is to make sure that your scripts and plug-ins are tailored to the architecture on which the target process is running and not the architecture on which the IDA client is running (unless they happen to be the same). In other words, if you are running the Windows version of IDA as a client for remote debugging on Linux, do not expect your Windows debugger-hiding script to do you any good.
[237] See http://bochs.sourceforge.net/.
[238] See http://www.hexblog.com/?p=112.
[239] Note that the *_server binaries distributed with IDA depend on a number of shared libraries. You can use ldd (or otool -L on OS X) to list these dependencies.