Table of Contents for
The IDA Pro Book, 2nd Edition
 The IDA Pro Book, 2nd Edition
Published by
No Starch Press, 2011
The IDA Pro Book, 2nd Edition
Published by
No Starch Press, 2011
- Cover
- The IDA Pro Book
- PRAISE FOR THE FIRST EDITION OF THE IDA PRO BOOK
- Acknowledgments
- Introduction
- I. Introduction to IDA
- 1. Introduction to Disassembly
- The What of Disassembly
- The Why of Disassembly
- The How of Disassembly
- Summary
- 2. Reversing and Disassembly Tools
- Summary Tools
- Deep Inspection Tools
- Summary
- 3. IDA Pro Background
- Obtaining IDA Pro
- IDA Support Resources
- Your IDA Installation
- Thoughts on IDA’s User Interface
- Summary
- II. Basic IDA Usage
- 4. Getting Started with IDA
- IDA Database Files
- Introduction to the IDA Desktop
- Desktop Behavior During Initial Analysis
- IDA Desktop Tips and Tricks
- Reporting Bugs
- Summary
- 5. IDA Data Displays
- Secondary IDA Displays
- Tertiary IDA Displays
- Summary
- 6. Disassembly Navigation
- Stack Frames
- Searching the Database
- Summary
- 7. Disassembly Manipulation
- Commenting in IDA
- Basic Code Transformations
- Basic Data Transformations
- Summary
- 8. Datatypes and Data Structures
- Creating IDA Structures
- Using Structure Templates
- Importing New Structures
- Using Standard Structures
- IDA TIL Files
- C++ Reversing Primer
- Summary
- 9. Cross-References and Graphing
- IDA Graphing
- Summary
- 10. The Many Faces of IDA
- Using IDA’s Batch Mode
- Summary
- III. Advanced IDA Usage
- 11. Customizing IDA
- Additional IDA Configuration Options
- Summary
- 12. Library Recognition Using FLIRT Signatures
- Applying FLIRT Signatures
- Creating FLIRT Signature Files
- Summary
- 13. Extending IDA’s Knowledge
- Augmenting Predefined Comments with loadint
- Summary
- 14. Patching Binaries and Other IDA Limitations
- IDA Output Files and Patch Generation
- Summary
- IV. Extending IDA’s Capabilities
- 15. IDA Scripting
- The IDC Language
- Associating IDC Scripts with Hotkeys
- Useful IDC Functions
- IDC Scripting Examples
- IDAPython
- IDAPython Scripting Examples
- Summary
- 16. The IDA Software Development Kit
- The IDA Application Programming Interface
- Summary
- 17. The IDA Plug-in Architecture
- Building Your Plug-ins
- Installing Plug-ins
- Configuring Plug-ins
- Extending IDC
- Plug-in User Interface Options
- Scripted Plug-ins
- Summary
- 18. Binary Files and IDA Loader Modules
- Manually Loading a Windows PE File
- IDA Loader Modules
- Writing an IDA Loader Using the SDK
- Alternative Loader Strategies
- Writing a Scripted Loader
- Summary
- 19. IDA Processor Modules
- The Python Interpreter
- Writing a Processor Module Using the SDK
- Building Processor Modules
- Customizing Existing Processors
- Processor Module Architecture
- Scripting a Processor Module
- Summary
- V. Real-World Applications
- 20. Compiler Personalities
- RTTI Implementations
- Locating main
- Debug vs. Release Binaries
- Alternative Calling Conventions
- Summary
- 21. Obfuscated Code Analysis
- Anti–Dynamic Analysis Techniques
- Static De-obfuscation of Binaries Using IDA
- Virtual Machine-Based Obfuscation
- Summary
- 22. Vulnerability Analysis
- After-the-Fact Vulnerability Discovery with IDA
- IDA and the Exploit-Development Process
- Analyzing Shellcode
- Summary
- 23. Real-World IDA Plug-ins
- IDAPython
- collabREate
- ida-x86emu
- Class Informer
- MyNav
- IdaPdf
- Summary
- VI. The IDA Debugger
- 24. The IDA Debugger
- Basic Debugger Displays
- Process Control
- Automating Debugger Tasks
- Summary
- 25. Disassembler/Debugger Integration
- IDA Databases and the IDA Debugger
- Debugging Obfuscated Code
- IdaStealth
- Dealing with Exceptions
- Summary
- 26. Additional Debugger Features
- Debugging with Bochs
- Appcall
- Summary
- A. Using IDA Freeware 5.0
- Using IDA Freeware
- B. IDC/SDK Cross-Reference
- Index
- About the Author
Some of the more common questions asked while reverse engineering a binary are along the lines of “Where is this function called from?” and “What functions access this data?” These and other similar questions seek to catalog the references to and from various resources in a program. Two examples serve to show the usefulness of such questions.
Consider the case in which you have located a function containing a stack-allocated buffer that can be overflowed, possibly leading to exploitation of the program. Since the function may be buried deep within a complex application, your next step might be to determine exactly how the function can be reached. The function is useless to you unless you can get it to execute. This leads to the question “What functions call this vulnerable function?” as well as additional questions regarding the nature of the data that those functions may pass to the vulnerable function. This line of reasoning must continue as you work your way back up potential call chains to find one that you can influence to properly exploit the overflow that you have discovered.
In another case, consider a binary that contains a large number of ASCII strings, at least one of which you find suspicious, such as “Executing Denial of Service attack!” Does the presence of this string indicate that the binary actually performs a Denial of Service attack? No, it simply indicates that the binary happens to contain that particular ASCII sequence. You might infer that the message is displayed somehow just prior to launching an attack; however, you need to find the related code in order to verify your suspicions. Here the answer to the question “Where is this string referenced?” would help you to quickly track down the program location(s) that make use of the string. From there, perhaps it can assist you in locating any actual Denial of Service attack code.
IDA helps to answer these types of questions through its extensive cross-referencing features. IDA provides a number of mechanisms for displaying and accessing cross-reference data, including graph-generation capabilities that provide a highly visual representation of the relationships between code and data. In this chapter we discuss the types of cross-reference information that IDA makes available, the tools for accessing cross-reference data, and how to interpret that data.
We begin our discussion by noting that cross-references within IDA are often referred to simply as xrefs. Within this text, we will use xref only where it is used to refer to the content of an IDA menu item or dialog. In all other cases we will stick to the term cross-reference.
There are two basic categories of cross-references in IDA: code cross-references and data cross-references. Within each category, we will detail several different types of cross-references. Associated with each cross-reference is the notion of a direction. All cross-references are made from one address to another address. The from and to addresses may be either code or data addresses. If you are familiar with graph theory, you may choose to think of addresses as nodes in a directed graph and cross-references as the edges in that graph. Figure 9-1 provides a quick refresher on graph terminology. In this simple graph, three nodes  are connected by two directed edges
  .
.
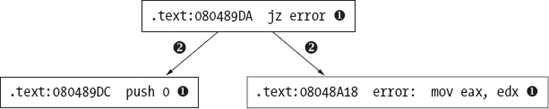
Note that nodes may also be referred to as vertices. Directed edges are drawn using arrows to indicate the allowed direction of travel across the edge. In Figure 9-1, it is possible to travel from the upper node to either of the lower nodes, but it is not possible to travel from either of the lower nodes to the upper node.
Code cross-references are a very important concept, as they facilitate IDA’s generation of control flow graphs and function call graphs, each of which we discuss later in the chapter.
Before we dive into the details of cross-references, it is useful to understand how IDA displays cross-reference information in a disassembly listing. Figure 9-2 shows the header line for a disassembled function (sub_401000) containing a cross-reference as a regular comment (right side of the figure).

The text CODE XREF indicates that this is a code cross-reference rather than a data cross-reference (DATA XREF). An address follows, _main+2A in this case, indicating the address from which the cross-reference originates. Note that this is a more descriptive form of address than .text:0040154A, for example. While both forms represent the same program location, the format used in the cross-reference offers the additional information that the cross-reference is being made from within the function named _main, specifically 0x2A (42) bytes into the _main function. An up or down arrow will always follow the address, indicating the relative direction to the referencing location. In Figure 9-2, the down arrow indicates that _main+2A lies at a higher address than sub_401000, and thus you would need to scroll down to reach it. Similarly, an up arrow indicates that a referencing location lies at a lower memory address, requiring that you scroll up to reach it. Finally, every cross-reference comment contains a single-character suffix to identify the type of cross-reference that is being made. Each suffix is described later as we detail all of IDA’s cross-reference types.
A code cross-reference is used to indicate that an instruction transfers or may transfer control to another instruction. The manner in which instructions transfer control is referred to as a flow within IDA. IDA distinguishes among three basic flow types: ordinary, jump, and call. Jump and call flows are further divided according to whether the target address is a near or far address. Far addresses are encountered only in binaries that make use of segmented addresses. In the discussion that follows, we make use of the disassembled version of the following program:
int read_it;            //integer variable read in main
int write_it;           //integer variable written 3 times in main
int ref_it;             //integer variable whose address is taken in main

void callflow() {}      //function called twice from main

int main() {
   int *p = &ref_it;    //results in an "offset" style data reference
   *p = read_it;        //results in a "read" style data reference
   write_it = *p;       //results in a "write" style data reference
   callflow();          //results in a "call" style code reference
   if (read_it == 3) {  //results in "jump" style code reference
      write_it = 2;     //results in a "write" style data reference
   }
   else {               //results in an "jump" style code reference
      write_it = 1;     //results in a "write" style data reference
   }
   callflow();          //results in an "call" style code reference
}
The program contains operations that will exercise all of IDA’s cross-referencing features, as noted in the comment text.
An ordinary flow is the simplest flow type, and it represents sequential flow from one instruction to another. This is the default execution flow for all nonbranching instructions such as ADD. There are no special display indicators for ordinary flows other than the order in which instructions are listed in the disassembly. If instruction A has an ordinary flow to instruction B, then instruction B will immediately follow instruction A in the disassembly listing. In the following listing, every instruction other than and has an associated ordinary flow to its immediate successor:
Example 9-1. Cross-reference sources and targets
.text:00401010 _main proc near .text:00401010 .text:00401010 p = dword ptr −4 .text:00401010 .text:00401010 push ebp .text:00401011 mov ebp, esp .text:00401013 push ecx .text:00401014mov [ebp+p], offset ref_it .text:0040101B mov eax, [ebp+p] .text:0040101E
mov ecx, read_it .text:00401024 mov [eax], ecx .text:00401026 mov edx, [ebp+p] .text:00401029 mov eax, [edx] .text:0040102B
mov write_it, eax .text:00401030
call callflow .text:00401035
.text:0040104A ; ------------------------------------------------------------- .text:0040104A .text:0040104A loc_40104A:
; CODE XREF: _main+2C↑j .text:0040104A
Instructions used to invoke functions, such as the x86 call instructions at , are assigned a call flow, indicating transfer of control to the target function. In most cases, an ordinary flow is also assigned to call instructions, as most functions return to the location that follows the call. If IDA believes that a function does not return (as determined during the analysis phase), then calls to that function will not have an ordinary flow assigned. Call flows are noted by the display of cross-references at the target function (the destination address of the flow). The resulting disassembly of the callflow function is shown here:
.text:00401000 callflow        proc near               ; CODE XREF: _main+20↓p
.text:00401000                                         ; _main:loc_401054↓p
.text:00401000                 push    ebp
.text:00401001                 mov     ebp, esp
.text:00401003                 pop     ebp
.text:00401004                 retn
.text:00401004 callflow        endp
In this example, two cross-references are displayed at the address of callflow to indicate that the function is called twice. The address displayed in the cross-references is displayed as an offset into the calling function unless the calling address has an associated name, in which case the name is used. Both forms of addresses are used in the cross-references shown here. Cross-references resulting from function calls are distinguished through use of the p suffix (think P for Procedure).
A jump flow is assigned to each unconditional and conditional branch instruction. Conditional branches are also assigned ordinary flows to account for control flow when the branch is not taken. Unconditional branches have no associated ordinary flow because the branch is always taken in such cases. The dashed line break at is a display device used to indicate that an ordinary flow does not exist between two adjacent instructions. Jump flows are associated with jump-style cross-references displayed at the target of the jump, as shown at . As with call-style cross-references, jump cross-references display the address of the referring location (the source of the jump). Jump cross-references are distinguished by the use of a j suffix (think J for Jump).
Data cross-references are used to track the manner in which data is accessed within a binary. Data cross-references can be associated with any byte in an IDA database that is associated with a virtual address (in other words, data cross-references are never associated with stack variables). The three most commonly encountered types of data cross-references are used to indicate when a location is being read, when a location is being written, and when the address of a location is being taken. The global variables associated with the previous example program are shown here, as they provide several examples of data cross-references.
.data:0040B720 read_it dd ? ; DATA XREF: _main+E↑r .data:0040B720 ; _main+25↑r .data:0040B724 write_it dd ? ; DATA XREF: _main+1B↑w .data:0040B724; _main+2E↑w ... .data:0040B728 ref_it db ? ; ; DATA XREF: _main+4↑o .data:0040B729 db ? ; .data:0040B72A db ? ; .data:0040B72B db ? ;
A read cross-reference is used to indicate that the contents of a memory location are being accessed. Read cross-references can originate only from an instruction address but may refer to any program location. The global variable read_it is read at locations marked in Example 9-1. The associated cross-reference comments shown in this listing indicate exactly which locations in main are referencing read_it and are recognizable as read cross-references based on the use of the r suffix. The first read performed on read_it is a 32-bit read into the ECX register, which leads IDA to format read_it as a dword (dd). In general IDA takes as many cues as it possibly can in order to determine the size and/or type of variables based on how they are accessed and how they are used as parameters to functions.
The global variable write_it is referenced at the locations marked in Example 9-1. Associated write cross-references are generated and displayed as comments for the write_it variable, indicating the program locations that modify the contents of the variable. Write cross-references utilize the w suffix. Here again, IDA has determined the size of the variable based on the fact that the 32-bit EAX register is copied into write_it. Note that the list of cross-references displayed at write_it terminates with an ellipsis ( above), indicating that the number of cross-references to write_it exceeds the current display limit for cross-references. This limit can be modified through the Number of displayed xrefs setting on the Cross-references tab in the Options ▸ General dialog. As with read cross-references, write cross-references can originate only from a program instruction but may reference any program location. Generally speaking, a write cross-reference that targets a program instruction byte is indicative of self-modifying code, which is usually considered bad form and is frequently encountered in the de-obfuscation routines used in malware.
The third type of data cross-reference, an offset cross-reference, indicates that the address of a location is being used (rather than the content of the location). The address of global variable ref_it is taken at location in Example 9-1, resulting in the offset cross-reference comment at ref_it in the previous listing (suffix o). Offset cross-references are commonly the result of pointer operations either in code or in data. Array access operations, for example, are typically implemented by adding an offset to the starting address of the array. As a result, the first address in most global arrays can often be recognized by the presence of an offset cross-reference. For this reason, most string data (strings being arrays of characters in C/C++) is the target of offset cross-references.
Unlike read and write cross-references, which can originate only from instruction locations, offset cross-references can originate from either instruction locations or data locations. An example of an offset that can originate from a program’s data section is any table of pointers (such as a vtable) that results in the generation of an offset cross-reference from each location within the table to the location being pointed to by those locations. You can see this if you examine the vtable for class SubClass from Chapter 8, whose disassembly is shown here:
.rdata:00408148 off_408148  dd offset SubClass::vfunc1
(void) ; DATA XREF: SubClass::SubClass(void)+12↑o
.rdata:0040814C          dd offset BaseClass::vfunc2(void)
.rdata:00408150          dd offset SubClass::vfunc3(void)
.rdata:00408154          dd offset BaseClass::vfunc4(void)
.rdata:00408158          dd offset SubClass::vfunc5(void)
Here you see that the address of the vtable is used in the function SubClass::SubClass(void), which is the class constructor. The header lines for function SubClass::vfunc3(void), shown here, show the offset cross-reference that links the function to a vtable.
.text:00401080 public: virtual void __thiscall SubClass::vfunc3(void) proc near
.text:00401080                                      ; DATA XREF: .rdata:00408150↓o
This example demonstrates one of the characteristics of C++ virtual functions that becomes quite obvious when combined with offset cross-references, namely that C++ virtual functions are never called directly and should never be the target of a call cross-reference. Instead, all C++ virtual functions should be referred to by at least one vtable entry and should always be the target of at least one offset cross-reference. Remember that overriding a virtual function is not mandatory. Therefore, a virtual function can appear in more than one vtable, as discussed in Chapter 8. Backtracking offset cross-references is one technique for easily locating C++ vtables in a program’s data section.
With an understanding of what cross-references are, we can now discuss the manner in which you may access all of this data within IDA. As mentioned previously, the number of cross-reference comments that can be displayed at a given location is limited by a configuration setting that defaults to 2. As long as the number of cross-references to a location does not exceed this limit, then working with those cross-references is fairly straightforward. Mousing over the cross-reference text displays the disassembly of the source region in a tool tip–style display, while double-clicking the cross-reference address jumps the disassembly window to the source of the cross-reference.
There are two methods for viewing the complete list of cross-references to a location. The first method is to open a cross-references subview associated with a specific address. By positioning the cursor on an address that is the target of one or more cross-references and selecting View ▸ Open Subviews ▸ Cross-References, you can open the complete list of cross-references to a given location, as shown in Figure 9-3, which shows the complete list of cross-references to variable write_it.
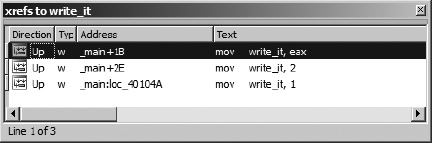
The columns of the window indicate the direction (Up or Down) to the source of the cross-reference, the type of cross-reference (using the type suffixes discussed previously), the source address of the cross-reference, and the corresponding disassembled text at the source address, including any comments that may exist at the source address. As with other windows that display lists of addresses, double-clicking any entry repositions the disassembly display to the corresponding source address. Once opened, the cross-reference display window remains open and accessible via a title tab displayed along with every other open subview’s title tab above the disassembly area.
The second way to access a list of cross-references is to highlight a name that you are interested in learning about and choose Jump ▸ Jump to xref (hotkey ctrl-X) to open a dialog that lists every location that references the selected symbol. The resulting dialog, shown in Figure 9-4, is nearly identical in appearance to the cross-reference subview shown in Figure 9-3. In this case, the dialog was activated using the ctrl-X hotkey with the first instance of write_it (.text:0040102B) selected.
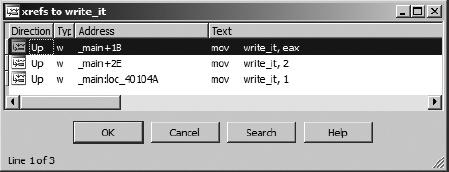
The primary difference in the two displays is behavioral. Being a modal dialog,[52] the display in Figure 9-4 has buttons to interact with and terminate the dialog. The primary purpose of this dialog is to select a referencing location and jump to it. Double-clicking one of the listed locations dismisses the dialog and repositions the disassembly window at the selected location. The second difference between the dialog and the cross-reference subview is that the former can be opened using a hotkey or context-sensitive menu from any instance of a symbol, while the latter can be opened only when you position the cursor on an address that is the target of a cross-reference and choose View ▸ Open Subviews ▸ Cross-References. Another way of thinking about it is that the dialog can be opened at the source of any cross-reference, while the subview can be opened only at the destination of the cross-reference.
An example of the usefulness of cross-reference lists might be to rapidly locate every location from which a particular function is called. Many people consider the use of the C strcpy[53] function to be dangerous. Using cross-references, locating every call to strcpy is as simple as finding any one call to strcpy, using the ctrl-X hotkey to bring up the cross-reference dialog, and working your way through every call cross-reference. If you don’t want to take the time to find strcpy used somewhere in the binary, you can even get away with adding a comment with the text strcpy in it and activating the cross-reference dialog using the comment.[54]
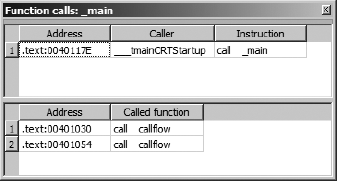
A specialized cross-reference listing dealing exclusively with function calls is available by choosing View ▸ Open Subviews ▸ Function Calls. Figure 9-5 shows the resulting dialog, which lists all locations that call the current function (as defined by the cursor location at the time the view is opened) in the upper half of the window and all calls made by the current function in the lower half of the window.
Here again, each listed cross-reference can be used to quickly reposition the disassembly listing to the corresponding cross-reference location. Restricting ourselves to considering function call cross-references allows us to think about more abstract relationships than simple mappings from one address to another and instead consider how functions relate to one another. In the next section, we show how IDA takes advantage of this by providing several types of graphs, all designed to assist you in interpreting a binary.
[52] A modal dialog must be closed before you can continue normal interaction with the underlying application. Modeless dialogs can remain open while you continue normal interaction with the application.
[53] The C strcpy function copies a source array of characters, up to and including the associated null termination character, to a destination array, with no checks whatsoever that the destination array is large enough to hold all of the characters from the source.
[54] When a symbol name appears in a comment, IDA treats that symbol just as if it was an operand in a disassembled instruction. Double-clicking the symbol repositions the disassembly window, and the right-click context-sensitive menu becomes available.