Table of Contents for
The IDA Pro Book, 2nd Edition
 The IDA Pro Book, 2nd Edition
Published by
No Starch Press, 2011
The IDA Pro Book, 2nd Edition
Published by
No Starch Press, 2011
- Cover
- The IDA Pro Book
- PRAISE FOR THE FIRST EDITION OF THE IDA PRO BOOK
- Acknowledgments
- Introduction
- I. Introduction to IDA
- 1. Introduction to Disassembly
- The What of Disassembly
- The Why of Disassembly
- The How of Disassembly
- Summary
- 2. Reversing and Disassembly Tools
- Summary Tools
- Deep Inspection Tools
- Summary
- 3. IDA Pro Background
- Obtaining IDA Pro
- IDA Support Resources
- Your IDA Installation
- Thoughts on IDA’s User Interface
- Summary
- II. Basic IDA Usage
- 4. Getting Started with IDA
- IDA Database Files
- Introduction to the IDA Desktop
- Desktop Behavior During Initial Analysis
- IDA Desktop Tips and Tricks
- Reporting Bugs
- Summary
- 5. IDA Data Displays
- Secondary IDA Displays
- Tertiary IDA Displays
- Summary
- 6. Disassembly Navigation
- Stack Frames
- Searching the Database
- Summary
- 7. Disassembly Manipulation
- Commenting in IDA
- Basic Code Transformations
- Basic Data Transformations
- Summary
- 8. Datatypes and Data Structures
- Creating IDA Structures
- Using Structure Templates
- Importing New Structures
- Using Standard Structures
- IDA TIL Files
- C++ Reversing Primer
- Summary
- 9. Cross-References and Graphing
- IDA Graphing
- Summary
- 10. The Many Faces of IDA
- Using IDA’s Batch Mode
- Summary
- III. Advanced IDA Usage
- 11. Customizing IDA
- Additional IDA Configuration Options
- Summary
- 12. Library Recognition Using FLIRT Signatures
- Applying FLIRT Signatures
- Creating FLIRT Signature Files
- Summary
- 13. Extending IDA’s Knowledge
- Augmenting Predefined Comments with loadint
- Summary
- 14. Patching Binaries and Other IDA Limitations
- IDA Output Files and Patch Generation
- Summary
- IV. Extending IDA’s Capabilities
- 15. IDA Scripting
- The IDC Language
- Associating IDC Scripts with Hotkeys
- Useful IDC Functions
- IDC Scripting Examples
- IDAPython
- IDAPython Scripting Examples
- Summary
- 16. The IDA Software Development Kit
- The IDA Application Programming Interface
- Summary
- 17. The IDA Plug-in Architecture
- Building Your Plug-ins
- Installing Plug-ins
- Configuring Plug-ins
- Extending IDC
- Plug-in User Interface Options
- Scripted Plug-ins
- Summary
- 18. Binary Files and IDA Loader Modules
- Manually Loading a Windows PE File
- IDA Loader Modules
- Writing an IDA Loader Using the SDK
- Alternative Loader Strategies
- Writing a Scripted Loader
- Summary
- 19. IDA Processor Modules
- The Python Interpreter
- Writing a Processor Module Using the SDK
- Building Processor Modules
- Customizing Existing Processors
- Processor Module Architecture
- Scripting a Processor Module
- Summary
- V. Real-World Applications
- 20. Compiler Personalities
- RTTI Implementations
- Locating main
- Debug vs. Release Binaries
- Alternative Calling Conventions
- Summary
- 21. Obfuscated Code Analysis
- Anti–Dynamic Analysis Techniques
- Static De-obfuscation of Binaries Using IDA
- Virtual Machine-Based Obfuscation
- Summary
- 22. Vulnerability Analysis
- After-the-Fact Vulnerability Discovery with IDA
- IDA and the Exploit-Development Process
- Analyzing Shellcode
- Summary
- 23. Real-World IDA Plug-ins
- IDAPython
- collabREate
- ida-x86emu
- Class Informer
- MyNav
- IdaPdf
- Summary
- VI. The IDA Debugger
- 24. The IDA Debugger
- Basic Debugger Displays
- Process Control
- Automating Debugger Tasks
- Summary
- 25. Disassembler/Debugger Integration
- IDA Databases and the IDA Debugger
- Debugging Obfuscated Code
- IdaStealth
- Dealing with Exceptions
- Summary
- 26. Additional Debugger Features
- Debugging with Bochs
- Appcall
- Summary
- A. Using IDA Freeware 5.0
- Using IDA Freeware
- B. IDC/SDK Cross-Reference
- Index
- About the Author
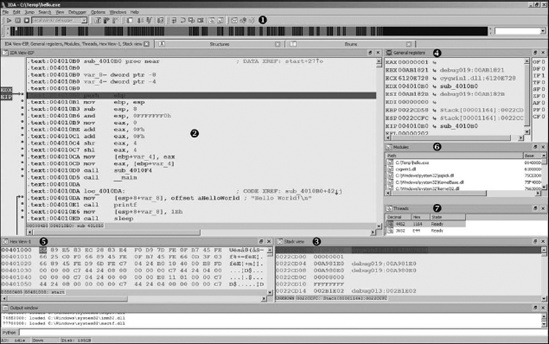
Regardless of how you happen to launch the debugger, once your process of interest has been paused under debugger control, IDA enters its debugger mode (as opposed to normal disassembly mode), and you are presented with several default displays. The default debugger display is shown in Figure 24-5.
If you are accustomed to using other Windows debuggers such as OllyDbg[220] or Immunity Debugger,[221] one of your first thoughts might be that not much information is displayed on the screen. This is primarily a result of the fact that IDA defaults to a font size that is actually readable. If you find yourself missing the micro fonts used in other debuggers, you can easily change things via the Options ▸ Font menu. You may also wish to make use of saved IDA desktops (Windows ▸ Save Desktop) if you develop a fondness for a specific layout of your debugger windows.
As shown in the Figure 24-5, the debugger toolbar  replaces the disassembly toolbar. A number of standard (from a debugging standpoint) tools are present, including process control tools and breakpoint manipulation tools.
The IDA View-EIP  disassembly window is a default disassembly listing window when the debugger is active. It also happens to be synchronized with the current value of the instruction pointer register. If IDA detects that a register points to a memory location within the disassembly window, the name of that register is displayed in the left margin, opposite the address to which the register points. In Figure 24-5, the location to which EIP points is flagged in IDA View-EIP (note that EDX also points to the same location in this example). By default, IDA highlights breakpoints in red and the next instruction to be executed (the one to which the instruction pointer points) in blue. Debugger-related disassemblies are generated via the same disassembly process used in standard disassembly mode. Thus, IDA’s debugger offers perhaps the best disassembly capability to be found in a debugger. Additionally, if you launched the debugger from an open IDA database, IDA is able to characterize all of the executable content based on analysis performed prior to launching the debugger. IDA’s ability to disassemble any library code that has been loaded by the process will be somewhat more limited because IDA has not had a chance to analyze the associated .dll file prior to launching the debugger.
The Stack View  window is another standard disassembly view primarily used to display the data contents of the process’s runtime stack. All registers that point to stack locations are noted as such in the General Registers
  view (such as EBP in this case). Through the use of comments, IDA makes every attempt to provide context information for each data item on the stack. When the stack item is a memory address, IDA attempts to resolve the address to a function location (this helps highlight the location from which a function was called). When the stack item is a data pointer, a reference to the associated data item is displayed. The remaining default displays include the Hex view
  , which offers a standard hex dump of memory, the Modules
  view, which displays a list of modules currently loaded in the process image, and the Threads
  view, which displays a list of threads in the current process. Double-clicking any listed thread causes the IDA View-EIP disassembly window to jump to the current instruction within the selected thread and updates the General Registers view to reflect the current values for registers within the selected thread.
The General Registers window (also shown in Figure 24-6) displays the current contents of the CPU’s general-purpose registers. Additional windows for displaying the contents of the CPU’s segment, floating-point, or MMX registers may be opened from the Debugger menu.
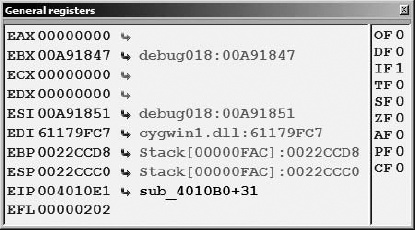
Within the General Registers window, register contents are displayed to the right of the associated register name followed by a description of each register’s content. The CPU flag bits are displayed down the rightmost column. Right-clicking a register value or flag bit provides access to a Modify menu item, which allows you to change the contents of any register or CPU flag. Menu options offer quick access to zero a value, toggle a value, increment a value, or decrement a value. Toggling values is particularly useful for changing CPU flag bits. Right-clicking any register value also provides access to the Open Register Window menu item. Selecting Open Register Window causes IDA to open a new disassembly window centered at the memory location held in the selected register. If you ever find that you have inadvertently closed either IDA View-EIP or IDA View-ESP, use the Open Register Window command on the appropriate register to reopen the lost window. If a register appears to point to a valid memory location, then the right-angle arrow control to the right of that register’s value will be active and highlighted in black. Clicking an active arrow opens a new disassembly view centered on the corresponding memory location.
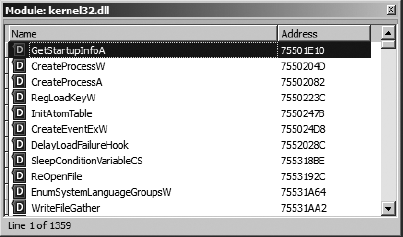
The Modules window displays a list of all executable files and shared libraries loaded into the process memory space. Double-clicking any module named in the list opens a list of symbols exported by that module. Figure 24-7 shows an example of the contents of kernel32.dll. The symbol list provides an easy way to track down functions within loaded libraries if you wish to set breakpoints on entry to those functions.
Additional debugger displays are accessible using various debugger menu selections. Displays pertaining to debugger operations will be discussed in the following section, “Process Control.” Along with the debugger-specific displays, all traditional IDA subviews, such as Functions and Segments, remain available via the Views ▸ Open Subviews command.