Table of Contents for
OpenLayers 3 : Beginner's Guide
 OpenLayers 3 : Beginner's Guide
Published by
Packt Publishing, 2015
OpenLayers 3 : Beginner's Guide
Published by
Packt Publishing, 2015
- Cover
- Table of Contents
- OpenLayers 3 Beginner's Guide
- OpenLayers 3 Beginner's Guide
- Credits
- About the Authors
- About the Reviewers
- www.PacktPub.com
- Preface
- What you need for this book
- Who this book is for
- Sections
- Time for action – heading
- Conventions
- Reader feedback
- Customer support
- 1. Getting Started with OpenLayers
- Advantages of using OpenLayers
- What, technically, is OpenLayers?
- Anatomy of a web mapping application
- Connecting to Google, Bing Maps, and other mapping APIs
- Time for action – downloading OpenLayers
- Time for action – creating your first map
- Where to go for help
- OpenLayers issues
- OpenLayers source code repository
- Getting live news from RSS and social networks
- Summary
- 2. Key Concepts in OpenLayers
- Time for action – creating a map
- Time for action – using the JavaScript console
- Time for action – overlaying information
- OpenLayers' super classes
- Key-Value Observing with the Object class
- Time for action – using bindTo
- Working with collections
- Summary
- 3. Charting the Map Class
- Time for action – creating a map
- Map renderers
- Time for action – rendering a masterpiece
- Map properties
- Time for action – target practice
- Map methods
- Time for action – creating animated maps
- Events
- Views
- Time for action – linking two views
- Summary
- 4. Interacting with Raster Data Source
- Layers in OpenLayers 3
- Common operations on layers
- Time for action – changing layer properties
- Tiled versus untiled layers
- Types of raster sources
- Tiled images' layers and their sources
- Time for action – creating a Stamen layer
- Time for action – creating a Bing Maps layer
- Time for action – creating tiles and adding Zoomify layer
- Image layers and their sources
- Using Spherical Mercator raster data with other layers
- Time For action – playing with various sources and layers together
- Time For action – applying Zoomify sample knowledge to a single raw image
- Summary
- 5. Using Vector Layers
- Time for action – creating a vector layer
- How the vector layer works
- The vector layer class
- Vector sources
- Time for action – using the cluster source
- Time for action – creating a loader function
- Time for action – working with the TileVector source
- Time for action – a drag and drop viewer for vector files
- Features and geometries
- Time for action – geometries in action
- Time for action – interacting with features
- Summary
- 6. Styling Vector Layers
- Time for action – basic styling
- The style class
- Time for action – using the icon style
- Have a go hero – using the circle style
- Multiple styles
- Time for action – using multiple styles
- Style functions
- Time for action – using properties to style features
- Interactive styles
- Time for action – creating interactive styles
- Summary
- 7. Wrapping Our Heads Around Projections
- Time for action – using different projection codes
- Time for action – determining coordinates
- OpenLayers projection class
- Transforming coordinates
- Time for action – coordinate transforms
- Time for action – setting up Proj4js.org
- Time for action – reprojecting extent
- Time for action – using custom projection with WMS sources
- Time for action – reprojecting geometries in vector layers
- Summary
- 8. Interacting with Your Map
- Time for action – converting your local or national authorities data into web mapping formats
- Time for action – testing the use cases for ol.interaction.Select
- Time for action – more options with ol.interaction.Select
- Introducing methods to get information from your map
- Time for action – understanding the forEachFeatureAtPixel method
- Time for action – understanding the getGetFeatureInfoUrl method
- Adding a pop-up on your map
- Time for action – introducing ol.Overlay with a static example
- Time for action – using ol.Overlay dynamically with layers information
- Time for action – using ol.interaction.Draw to share new information on the Web
- Time for action – using ol.interaction.Modify to update drawing
- Understanding interactions and their architecture
- Time for action – configuring default interactions
- Discovering the other interactions
- Time for action – using ol.interaction.DragRotateAndZoom
- Time for action – making rectangle export to GeoJSON with ol.interaction.DragBox
- Summary
- 9. Taking Control of Controls
- Adding controls to your map
- Time for action – starting with the default controls
- Controls overview
- Time for action – changing the default attribution styles
- Time for action – finding your mouse position
- Time for action – configuring ZoomToExtent and manipulate controls
- Creating a custom control
- Time for action – extending ol.control.Control to make your own control
- Summary
- 10. OpenLayers Goes Mobile
- Using a web server
- Time for action – go mobile!
- The Geolocation class
- Time for action – location, location, location
- The DeviceOrientation class
- Time for action – a sense of direction
- Debugging mobile web applications
- Debugging on iOS
- Debugging on Android
- Going offline
- Time for action – MANIFEST destiny
- Going native with web applications
- Time for action – track me
- Summary
- 11. Creating Web Map Apps
- Using geospatial data from Flickr
- Time for action – getting Flickr data
- A simple application
- Time for Action – adding data to your map
- Styling the features
- Time for action – creating a style function
- Creating a thumbnail style
- Time for action – switching to JSON data
- Time for action – creating a thumbnail style
- Turning our example into an application
- Time for action – adding the select interaction
- Time for action – handling selection events
- Time for action – displaying photo information
- Using real time data
- Time for action – getting dynamic data
- Wrapping up the application
- Time for action – adding dynamic tags to your map
- Deploying an application
- Creating custom builds
- Creating a combined build
- Time for action – creating a combined build
- Creating a separate build
- Time for action – creating a separate build
- Summary
- A. Object-oriented Programming – Introduction and Concepts
- Going further
- B. More details on Closure Tools and Code Optimization Techniques
- Introducing Closure Library, yet another JavaScript library
- Time for action – first steps with Closure Library
- Making custom build for optimizing performance
- Time for action – playing with Closure Compiler
- Applying your knowledge to the OpenLayers case
- Time for action - running official examples with the internal OpenLayers toolkit
- Time for action - building your custom OpenLayers library
- Syntax and styles
- Time for action – using Closure Linter to fix JavaScript
- Summary
- C. Squashing Bugs with Web Debuggers
- Time for action – opening Chrome Developer Tools
- Explaining Chrome Developer debugging controls
- Time for action – using DOM manipulation with OpenStreetMap map images
- Time for action – using breakpoints to explore your code
- Time for action – playing with zoom button and map copyrights
- Using the Console panel
- Time for action – executing code in the Console
- Time for action – creating object literals
- Time for action – interacting with a map
- Improving Chrome and Developer Tools with extensions
- Debugging in other browsers
- Summary
- D. Pop Quiz Answers
- Chapter 5, Using Vector Layers
- Chapter 7, Wrapping Our Heads Around Projections
- Chapter 8, Interacting with Your Map
- Chapter 9, Taking Control of Controls
- Chapter 10, OpenLayers Goes Mobile
- Appendix B, More details on Closure Tools and Code Optimization Techniques
- Appendix C, Squashing Bugs with Web Debuggers
- Index
To be able to do a basic save, we have developed a server-side script based on Node.js, a software platform for scalable server-side and networking applications. For the client side, the code will be more classical.
- Install Node and NPM, an executable to manage Node.js library dependencies if you don't already have it, using https://github.com/joyent/node/wiki/installation#installing-without-building.
- Next, retrieve the
index.jsandpackage.jsonfiles from the code fromupcoming_urland put them in theol3_samplesdirectory. - Install the dependencies from the command line firing from the
ol3_samplesfolder path, as follows:npm install
- Download also the file
features.geojsonintool3_samples/assets/data/. - Try if the server side works by firing the node
index.jsand openinghttp://localhost:3000/features.geojson. You should see something like the following:{type: "FeatureCollection", features: [ ]} - Create a new file
2360_08_07_create_new_content.htmlin the usualsandboxfolder by copying2360_08_01_simple_select.html. - Empty the HTML body to replace the HTML content to create a
<div>tag for the map and a form to enable you to choose future drawing types (point, line string, and polygon) with the following code:<div id="map" class="map"> </div> <form class="form-inline"> <label>Geometry type </label> <select id="type"> <option value="Point">Point</option> <option value="LineString">LineString</option> <option value="Polygon">Polygon</option> </select> </form> <script src="../assets/ol3/ol.js"></script> <script src="http://code.jquery.com/jquery-1.11.0.min.js"></script> - Start
<script>without forgetting to close it at the end, and copy the following code into it:var raster = new ol.layer.Tile({ source: new ol.source.MapQuest({layer: 'sat'}) }); var source = new ol.source.GeoJSON({ url: '/features.geojson' }); var vector = new ol.layer.Vector({ id: 'vector', source: source, style: new ol.style.Style({ fill: new ol.style.Fill({ color: 'rgba(255, 255, 255, 0.2)' }), stroke: new ol.style.Stroke({ color: '#ffcc33', width: 2 }), image: new ol.style.Circle({ radius: 7, fill: new ol.style.Fill({ color: '#ffcc33' }) }) }) }); var map = new ol.Map({ layers: [raster, vector], target: 'map', view: new ol.View({ center: [-11000000, 4600000], zoom: 4 }) }); - You can already open your browser at
http://localhost:3000/sandbox/2360_08_07_create_new_content.htmlto see the definitive sample look. - After the previous added code, add the following content:
var typeSelect = document.getElementById('type'); function addInteraction() { draw = new ol.interaction.Draw({ source: source, type: typeSelect.value }); map.addInteraction(draw); } typeSelect.onchange = function(e) { map.removeInteraction(draw); addInteraction(); }; addInteraction(); - Reload the sample, choose the type you want to draw, and click on the map to try out
componentReloadon the page to see that you can draw but there is no persistency. - At the end of the
addInteractionfunction, copy the following code:draw.on('drawend', function(evt) { console.log(evt.feature); var parser = new ol.format.GeoJSON(); var features = source.getFeatures(); var featuresGeoJSON = parser.writeFeatures(features); $.ajax({ url: '/features.geojson', type: 'POST', data: featuresGeoJSON }).then(function(response) { console.log(response); }); }, this); - Reload the sample, and try to draw and reload to see persistency working:
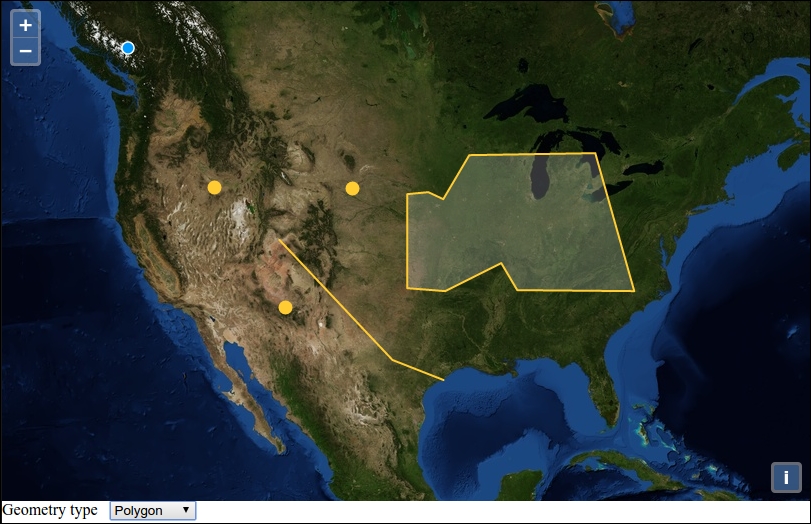
We created a map that uses a drawing component.
Each time you choose a Geometry type, it removes the ol.interaction.Draw component and adds again a new one using the code in typeSelect.onchange.
In the called function, the key feature is the drawend event bound to the draw component. Each time the user finishes drawing, it fires an event that send a feature.
In our case, we chose to get features from the source as GeoJSON using ol.format.GeoJSON and send them via an Ajax post call.
Depending on your backend, or for client storage, you can change what you want to send. The sample sends all features using a GeoJSON format, but you can customize the URL call, change the format to let's say GML, or only send the added feature and not all the features.
For this last case, you can see the log returned from console.log(evt.feature);.