Table of Contents for
OpenLayers 3 : Beginner's Guide
 OpenLayers 3 : Beginner's Guide
Published by
Packt Publishing, 2015
OpenLayers 3 : Beginner's Guide
Published by
Packt Publishing, 2015
- Cover
- Table of Contents
- OpenLayers 3 Beginner's Guide
- OpenLayers 3 Beginner's Guide
- Credits
- About the Authors
- About the Reviewers
- www.PacktPub.com
- Preface
- What you need for this book
- Who this book is for
- Sections
- Time for action – heading
- Conventions
- Reader feedback
- Customer support
- 1. Getting Started with OpenLayers
- Advantages of using OpenLayers
- What, technically, is OpenLayers?
- Anatomy of a web mapping application
- Connecting to Google, Bing Maps, and other mapping APIs
- Time for action – downloading OpenLayers
- Time for action – creating your first map
- Where to go for help
- OpenLayers issues
- OpenLayers source code repository
- Getting live news from RSS and social networks
- Summary
- 2. Key Concepts in OpenLayers
- Time for action – creating a map
- Time for action – using the JavaScript console
- Time for action – overlaying information
- OpenLayers' super classes
- Key-Value Observing with the Object class
- Time for action – using bindTo
- Working with collections
- Summary
- 3. Charting the Map Class
- Time for action – creating a map
- Map renderers
- Time for action – rendering a masterpiece
- Map properties
- Time for action – target practice
- Map methods
- Time for action – creating animated maps
- Events
- Views
- Time for action – linking two views
- Summary
- 4. Interacting with Raster Data Source
- Layers in OpenLayers 3
- Common operations on layers
- Time for action – changing layer properties
- Tiled versus untiled layers
- Types of raster sources
- Tiled images' layers and their sources
- Time for action – creating a Stamen layer
- Time for action – creating a Bing Maps layer
- Time for action – creating tiles and adding Zoomify layer
- Image layers and their sources
- Using Spherical Mercator raster data with other layers
- Time For action – playing with various sources and layers together
- Time For action – applying Zoomify sample knowledge to a single raw image
- Summary
- 5. Using Vector Layers
- Time for action – creating a vector layer
- How the vector layer works
- The vector layer class
- Vector sources
- Time for action – using the cluster source
- Time for action – creating a loader function
- Time for action – working with the TileVector source
- Time for action – a drag and drop viewer for vector files
- Features and geometries
- Time for action – geometries in action
- Time for action – interacting with features
- Summary
- 6. Styling Vector Layers
- Time for action – basic styling
- The style class
- Time for action – using the icon style
- Have a go hero – using the circle style
- Multiple styles
- Time for action – using multiple styles
- Style functions
- Time for action – using properties to style features
- Interactive styles
- Time for action – creating interactive styles
- Summary
- 7. Wrapping Our Heads Around Projections
- Time for action – using different projection codes
- Time for action – determining coordinates
- OpenLayers projection class
- Transforming coordinates
- Time for action – coordinate transforms
- Time for action – setting up Proj4js.org
- Time for action – reprojecting extent
- Time for action – using custom projection with WMS sources
- Time for action – reprojecting geometries in vector layers
- Summary
- 8. Interacting with Your Map
- Time for action – converting your local or national authorities data into web mapping formats
- Time for action – testing the use cases for ol.interaction.Select
- Time for action – more options with ol.interaction.Select
- Introducing methods to get information from your map
- Time for action – understanding the forEachFeatureAtPixel method
- Time for action – understanding the getGetFeatureInfoUrl method
- Adding a pop-up on your map
- Time for action – introducing ol.Overlay with a static example
- Time for action – using ol.Overlay dynamically with layers information
- Time for action – using ol.interaction.Draw to share new information on the Web
- Time for action – using ol.interaction.Modify to update drawing
- Understanding interactions and their architecture
- Time for action – configuring default interactions
- Discovering the other interactions
- Time for action – using ol.interaction.DragRotateAndZoom
- Time for action – making rectangle export to GeoJSON with ol.interaction.DragBox
- Summary
- 9. Taking Control of Controls
- Adding controls to your map
- Time for action – starting with the default controls
- Controls overview
- Time for action – changing the default attribution styles
- Time for action – finding your mouse position
- Time for action – configuring ZoomToExtent and manipulate controls
- Creating a custom control
- Time for action – extending ol.control.Control to make your own control
- Summary
- 10. OpenLayers Goes Mobile
- Using a web server
- Time for action – go mobile!
- The Geolocation class
- Time for action – location, location, location
- The DeviceOrientation class
- Time for action – a sense of direction
- Debugging mobile web applications
- Debugging on iOS
- Debugging on Android
- Going offline
- Time for action – MANIFEST destiny
- Going native with web applications
- Time for action – track me
- Summary
- 11. Creating Web Map Apps
- Using geospatial data from Flickr
- Time for action – getting Flickr data
- A simple application
- Time for Action – adding data to your map
- Styling the features
- Time for action – creating a style function
- Creating a thumbnail style
- Time for action – switching to JSON data
- Time for action – creating a thumbnail style
- Turning our example into an application
- Time for action – adding the select interaction
- Time for action – handling selection events
- Time for action – displaying photo information
- Using real time data
- Time for action – getting dynamic data
- Wrapping up the application
- Time for action – adding dynamic tags to your map
- Deploying an application
- Creating custom builds
- Creating a combined build
- Time for action – creating a combined build
- Creating a separate build
- Time for action – creating a separate build
- Summary
- A. Object-oriented Programming – Introduction and Concepts
- Going further
- B. More details on Closure Tools and Code Optimization Techniques
- Introducing Closure Library, yet another JavaScript library
- Time for action – first steps with Closure Library
- Making custom build for optimizing performance
- Time for action – playing with Closure Compiler
- Applying your knowledge to the OpenLayers case
- Time for action - running official examples with the internal OpenLayers toolkit
- Time for action - building your custom OpenLayers library
- Syntax and styles
- Time for action – using Closure Linter to fix JavaScript
- Summary
- C. Squashing Bugs with Web Debuggers
- Time for action – opening Chrome Developer Tools
- Explaining Chrome Developer debugging controls
- Time for action – using DOM manipulation with OpenStreetMap map images
- Time for action – using breakpoints to explore your code
- Time for action – playing with zoom button and map copyrights
- Using the Console panel
- Time for action – executing code in the Console
- Time for action – creating object literals
- Time for action – interacting with a map
- Improving Chrome and Developer Tools with extensions
- Debugging in other browsers
- Summary
- D. Pop Quiz Answers
- Chapter 5, Using Vector Layers
- Chapter 7, Wrapping Our Heads Around Projections
- Chapter 8, Interacting with Your Map
- Chapter 9, Taking Control of Controls
- Chapter 10, OpenLayers Goes Mobile
- Appendix B, More details on Closure Tools and Code Optimization Techniques
- Appendix C, Squashing Bugs with Web Debuggers
- Index
The use of a tile grid removes the need to implement a loader function; so, there is less work involved in setting it up. Let's see how easy it is to use the TileVector source:
- Starting from the previous example, add the following after the
serverVectorlayer is defined:var tiledSource = new ol.source.TileVector({ format: new ol.format.TopoJSON({ defaultProjection: 'EPSG:4326' }), projection: 'EPSG:3857', tileGrid: new ol.tilegrid.XYZ({ maxZoom: 19 }), url: 'http://{a-c}.tile.openstreetmap.us/vectiles-water-areas/{z}/{x}/{y}.topojson' }); - Now, add create a vector layer using this source:
var tiledVector = new ol.layer.vector({ source: tiledSource, style: vectorStyle }); - And finally, change the map to load the
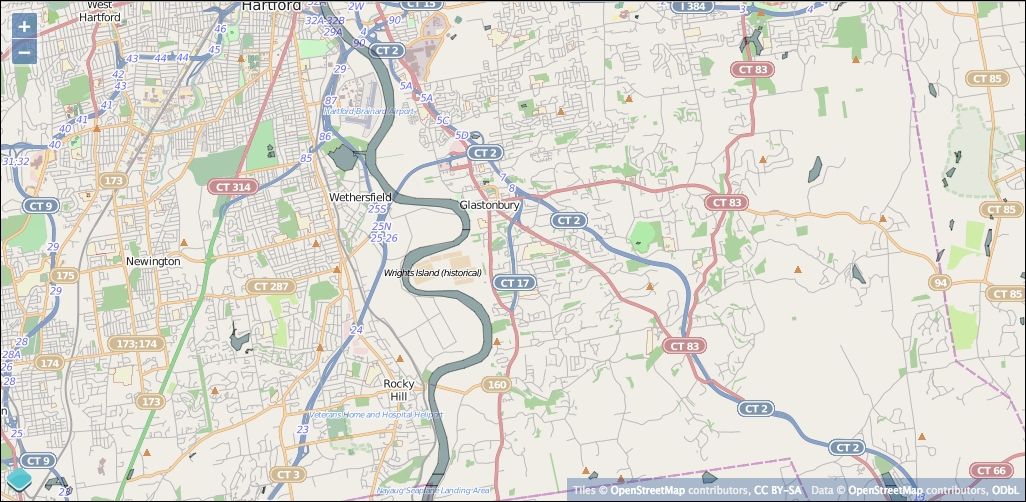
tiledVectorlayer instead of theserverVectorlayer:var map = new ol.Map({ renderer: 'canvas', target: 'map', layers: [tiledRaster, tiledVector], view: view }); - Load this in your browser and you should see something like the following screenshot:
As you can see, the TileVector source is quite a bit simpler than the ServerVector source. For the TileVector, we provided a format, a projection to convert vector features into (typically, the projection used with the map's view), a tileGrid, and a url. The format specifies what format the features will be in, which tells OpenLayers how to read features from the tiles sent by the server. It also can specify the projection used for the features. In this example, the server provides files in the TopoJSON format, a variant of GeoJSON that encodes topology, in a projection of EPSG:4326 (latitude and longitude). The tileGrid tells OpenLayers how to convert geographic coordinates into rows and columns that the server will understand. You can't just use any tileGrid with any server—it's very important that the tileGrid matches what the server expects. The XYZ tile grid, however, is a very common grid used by most tile servers, both raster and vector. The url property tells OpenLayers where to request each tile from. There are some special placeholders that you can put into a url that OpenLayers will replace on the fly when requesting a specific tile:
{z}: This will be replaced by the current zoom level.{y}or{-y}: This will be replaced by the row of the tile. The{-y}option inverts the y axis, this is needed for some servers.{x}: This will be replaced by the column of the tile.
After defining the source, it can be used with the vector layer in the same way the ServerVector source was used, and the layer is added to the map in the same way too.
The result is that when you load the browser, OpenLayers will request vector tiles from the server and render them using the style we defined.
To see what happens when vector tiles are requested, open Web Inspector, switch to the Network tab, and make sure All is selected, then reload the page. You will see the requests that fetch the vector tiles end with the .topojson extension:
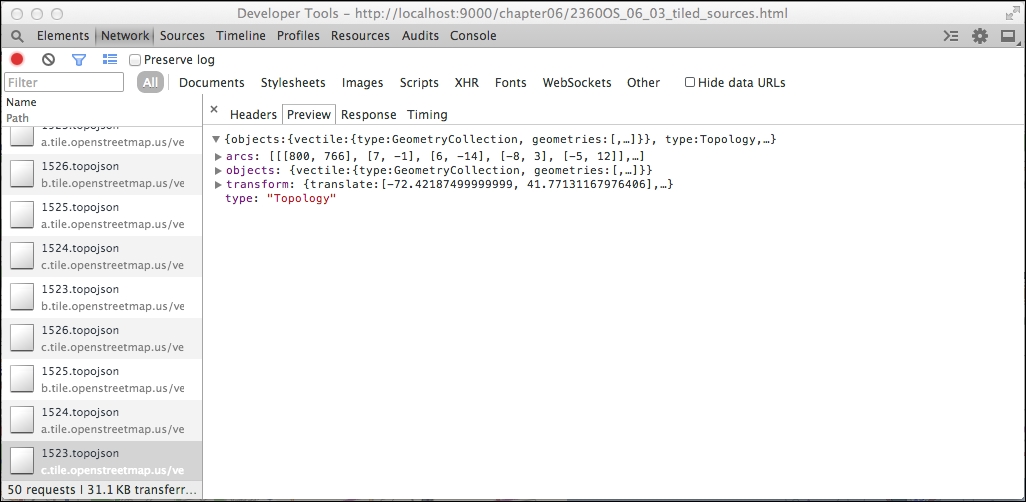
Click on some requests and view the responses. Do you see the difference between this and the ServerVector responses? Here, the features are returned directly as a JavaScript object while in the previous example, they were wrapped in a JavaScript function call.
Look through the requests for the raster tiles they are the ones that end with .png. You should be able to find a raster tile for each vector tile because they are using the same tileGrid.
One of the side effects of using vector tiles is that vector features such as lines and polygons may cross more than one tile and will be split up into different features. If you are rendering polygons with a stroke, or lines with dashed styles, you will see some interesting effects at the edges of the tile boundaries. We can see an example of this when first loading the TileVector, in this particular case. The river that runs vertically through the center of the map has several horizontal lines in it that coincide with the tile boundaries. Line features are typically less affected and point features shouldn't be affected at all. You can use polygon features, but you will probably want to render a fill style only to avoid artifacts at the tile boundaries.
Now, we've seen it in action, let's review all the options available when using a TileVector source: