Table of Contents for
OpenLayers 3 : Beginner's Guide
 OpenLayers 3 : Beginner's Guide
Published by
Packt Publishing, 2015
OpenLayers 3 : Beginner's Guide
Published by
Packt Publishing, 2015
- Cover
- Table of Contents
- OpenLayers 3 Beginner's Guide
- OpenLayers 3 Beginner's Guide
- Credits
- About the Authors
- About the Reviewers
- www.PacktPub.com
- Preface
- What you need for this book
- Who this book is for
- Sections
- Time for action – heading
- Conventions
- Reader feedback
- Customer support
- 1. Getting Started with OpenLayers
- Advantages of using OpenLayers
- What, technically, is OpenLayers?
- Anatomy of a web mapping application
- Connecting to Google, Bing Maps, and other mapping APIs
- Time for action – downloading OpenLayers
- Time for action – creating your first map
- Where to go for help
- OpenLayers issues
- OpenLayers source code repository
- Getting live news from RSS and social networks
- Summary
- 2. Key Concepts in OpenLayers
- Time for action – creating a map
- Time for action – using the JavaScript console
- Time for action – overlaying information
- OpenLayers' super classes
- Key-Value Observing with the Object class
- Time for action – using bindTo
- Working with collections
- Summary
- 3. Charting the Map Class
- Time for action – creating a map
- Map renderers
- Time for action – rendering a masterpiece
- Map properties
- Time for action – target practice
- Map methods
- Time for action – creating animated maps
- Events
- Views
- Time for action – linking two views
- Summary
- 4. Interacting with Raster Data Source
- Layers in OpenLayers 3
- Common operations on layers
- Time for action – changing layer properties
- Tiled versus untiled layers
- Types of raster sources
- Tiled images' layers and their sources
- Time for action – creating a Stamen layer
- Time for action – creating a Bing Maps layer
- Time for action – creating tiles and adding Zoomify layer
- Image layers and their sources
- Using Spherical Mercator raster data with other layers
- Time For action – playing with various sources and layers together
- Time For action – applying Zoomify sample knowledge to a single raw image
- Summary
- 5. Using Vector Layers
- Time for action – creating a vector layer
- How the vector layer works
- The vector layer class
- Vector sources
- Time for action – using the cluster source
- Time for action – creating a loader function
- Time for action – working with the TileVector source
- Time for action – a drag and drop viewer for vector files
- Features and geometries
- Time for action – geometries in action
- Time for action – interacting with features
- Summary
- 6. Styling Vector Layers
- Time for action – basic styling
- The style class
- Time for action – using the icon style
- Have a go hero – using the circle style
- Multiple styles
- Time for action – using multiple styles
- Style functions
- Time for action – using properties to style features
- Interactive styles
- Time for action – creating interactive styles
- Summary
- 7. Wrapping Our Heads Around Projections
- Time for action – using different projection codes
- Time for action – determining coordinates
- OpenLayers projection class
- Transforming coordinates
- Time for action – coordinate transforms
- Time for action – setting up Proj4js.org
- Time for action – reprojecting extent
- Time for action – using custom projection with WMS sources
- Time for action – reprojecting geometries in vector layers
- Summary
- 8. Interacting with Your Map
- Time for action – converting your local or national authorities data into web mapping formats
- Time for action – testing the use cases for ol.interaction.Select
- Time for action – more options with ol.interaction.Select
- Introducing methods to get information from your map
- Time for action – understanding the forEachFeatureAtPixel method
- Time for action – understanding the getGetFeatureInfoUrl method
- Adding a pop-up on your map
- Time for action – introducing ol.Overlay with a static example
- Time for action – using ol.Overlay dynamically with layers information
- Time for action – using ol.interaction.Draw to share new information on the Web
- Time for action – using ol.interaction.Modify to update drawing
- Understanding interactions and their architecture
- Time for action – configuring default interactions
- Discovering the other interactions
- Time for action – using ol.interaction.DragRotateAndZoom
- Time for action – making rectangle export to GeoJSON with ol.interaction.DragBox
- Summary
- 9. Taking Control of Controls
- Adding controls to your map
- Time for action – starting with the default controls
- Controls overview
- Time for action – changing the default attribution styles
- Time for action – finding your mouse position
- Time for action – configuring ZoomToExtent and manipulate controls
- Creating a custom control
- Time for action – extending ol.control.Control to make your own control
- Summary
- 10. OpenLayers Goes Mobile
- Using a web server
- Time for action – go mobile!
- The Geolocation class
- Time for action – location, location, location
- The DeviceOrientation class
- Time for action – a sense of direction
- Debugging mobile web applications
- Debugging on iOS
- Debugging on Android
- Going offline
- Time for action – MANIFEST destiny
- Going native with web applications
- Time for action – track me
- Summary
- 11. Creating Web Map Apps
- Using geospatial data from Flickr
- Time for action – getting Flickr data
- A simple application
- Time for Action – adding data to your map
- Styling the features
- Time for action – creating a style function
- Creating a thumbnail style
- Time for action – switching to JSON data
- Time for action – creating a thumbnail style
- Turning our example into an application
- Time for action – adding the select interaction
- Time for action – handling selection events
- Time for action – displaying photo information
- Using real time data
- Time for action – getting dynamic data
- Wrapping up the application
- Time for action – adding dynamic tags to your map
- Deploying an application
- Creating custom builds
- Creating a combined build
- Time for action – creating a combined build
- Creating a separate build
- Time for action – creating a separate build
- Summary
- A. Object-oriented Programming – Introduction and Concepts
- Going further
- B. More details on Closure Tools and Code Optimization Techniques
- Introducing Closure Library, yet another JavaScript library
- Time for action – first steps with Closure Library
- Making custom build for optimizing performance
- Time for action – playing with Closure Compiler
- Applying your knowledge to the OpenLayers case
- Time for action - running official examples with the internal OpenLayers toolkit
- Time for action - building your custom OpenLayers library
- Syntax and styles
- Time for action – using Closure Linter to fix JavaScript
- Summary
- C. Squashing Bugs with Web Debuggers
- Time for action – opening Chrome Developer Tools
- Explaining Chrome Developer debugging controls
- Time for action – using DOM manipulation with OpenStreetMap map images
- Time for action – using breakpoints to explore your code
- Time for action – playing with zoom button and map copyrights
- Using the Console panel
- Time for action – executing code in the Console
- Time for action – creating object literals
- Time for action – interacting with a map
- Improving Chrome and Developer Tools with extensions
- Debugging in other browsers
- Summary
- D. Pop Quiz Answers
- Chapter 5, Using Vector Layers
- Chapter 7, Wrapping Our Heads Around Projections
- Chapter 8, Interacting with Your Map
- Chapter 9, Taking Control of Controls
- Chapter 10, OpenLayers Goes Mobile
- Appendix B, More details on Closure Tools and Code Optimization Techniques
- Appendix C, Squashing Bugs with Web Debuggers
- Index
Let's walk through creating a simple map from the beginning. Create a new file in your text editor to get started. To make it easy, save this file in the sandbox
folder. Remember that all the samples are set up to use the version of OpenLayers we've provided in the assets folder:
- Start with the HTML code needed to set up the page:
<!doctype html>
<html>
  <head>
    <title> Map Examples </title>
    <link rel="stylesheet" href="../assets/ol3/ol.css" type="text/css" />
    <link rel="stylesheet" href="../assets/css/samples.css" type="text/css" />
  </head>
  <body>
    <div id="map" class="map"></div>
<script src="../assets/ol3/ol.js">
</script>
We are just setting up a standard HTML 5 web page and including our stylesheets and the OpenLayers library.
- Add a
<script>block with the following code:<script> var layer = new ol.layer.Tile({ source: new ol.source.OSM() }); var london = ol.proj.transform([-0.12755, 51.507222], 'EPSG:4326', 'EPSG:3857'); var view = new ol.View({ center: london, zoom: 6, }); var map = new ol.Map({ target: 'map', layers: [layer], view: view }); </script>This code should look familiar to the ones used in the previous chapters, and you'll be seeing it (with minor variations) quite a bit through the rest of this book. We create a layer that will show OSM tiles, use
londonas our starting point for the view and create an instance ofol.Mapin ourmapdiv. - Finish off by closing the body and HTML tags:
</body>
</html>
- Save this file as
map.htmland open it in your web browser, you should see a familiar sight, as shown here: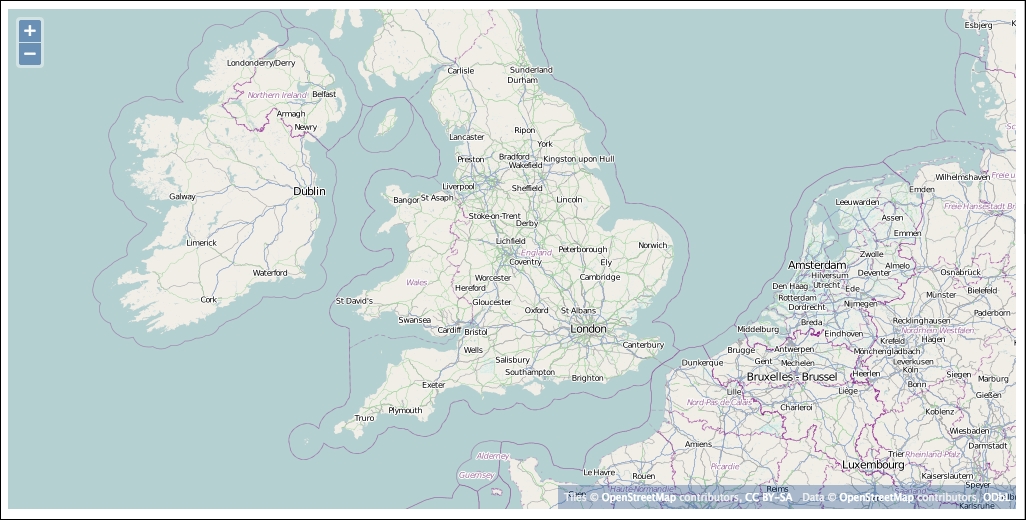
Let's look a little closer at how we create our map object in this block of code:
var map = new ol.Map({
  target: 'map',
  layers: [layer],
  view: view
});
We use the new operator to create an instance of the ol.Map class and pass it an object literal containing several options, namely, target, view, and layers. We've used these before in the previous examples without really explaining them or any of the other options we might want to use. Here's the full list of available options and what they do:
|
Name |
Type |
Description |
|---|---|---|
|
|
|
Controls are covered in detail in Chapter 7, Wrapping Our Heads Around Projections; so, we don't need to go in-depth here. We can define our map's controls when we create the map object by specifying them with this option, or we can add them via the |
|
|
|
The
|
|
|
|
Interactions are used by the map to handle browser events, such as the user clicking or dragging on the map. The map passes browser events to each of its interactions in sequence, allowing each to determine whether it should take action and whether it should consume (stop further processing of) the event. The order of interactions is important—if an interaction consumes a browser event, subsequent interactions will not see the event. Interactions are closely related to controls and are discussed in more detail in Chapter 8, Interacting with Your Map with controls. The default interactions, if this option is not provided, are |
|
|
|
This option indicates which HTML element will be used to receive keyboard events for interactions that use them (such as |
|
|
|
The |
|
|
|
This controls the display of the ol3 logo in the map, |
|
|
|
The overlays option defines which overlays will be added to the map initially. We will review them thoroughly in Chapter 8, Interacting with Your Map. |
|
|
|
The number of physical pixels per screen pixel, normally computed automatically. |
|
|
|
The
We'll discuss what these actually mean a little further on in this chapter. |
|
|
|
The target identifies the HTML element in which the map will be drawn on the web page. In all our examples, we pass a string value that matches the |
|
|
|
The |