Table of Contents for
OpenLayers 3 : Beginner's Guide
 OpenLayers 3 : Beginner's Guide
Published by
Packt Publishing, 2015
OpenLayers 3 : Beginner's Guide
Published by
Packt Publishing, 2015
- Cover
- Table of Contents
- OpenLayers 3 Beginner's Guide
- OpenLayers 3 Beginner's Guide
- Credits
- About the Authors
- About the Reviewers
- www.PacktPub.com
- Preface
- What you need for this book
- Who this book is for
- Sections
- Time for action – heading
- Conventions
- Reader feedback
- Customer support
- 1. Getting Started with OpenLayers
- Advantages of using OpenLayers
- What, technically, is OpenLayers?
- Anatomy of a web mapping application
- Connecting to Google, Bing Maps, and other mapping APIs
- Time for action – downloading OpenLayers
- Time for action – creating your first map
- Where to go for help
- OpenLayers issues
- OpenLayers source code repository
- Getting live news from RSS and social networks
- Summary
- 2. Key Concepts in OpenLayers
- Time for action – creating a map
- Time for action – using the JavaScript console
- Time for action – overlaying information
- OpenLayers' super classes
- Key-Value Observing with the Object class
- Time for action – using bindTo
- Working with collections
- Summary
- 3. Charting the Map Class
- Time for action – creating a map
- Map renderers
- Time for action – rendering a masterpiece
- Map properties
- Time for action – target practice
- Map methods
- Time for action – creating animated maps
- Events
- Views
- Time for action – linking two views
- Summary
- 4. Interacting with Raster Data Source
- Layers in OpenLayers 3
- Common operations on layers
- Time for action – changing layer properties
- Tiled versus untiled layers
- Types of raster sources
- Tiled images' layers and their sources
- Time for action – creating a Stamen layer
- Time for action – creating a Bing Maps layer
- Time for action – creating tiles and adding Zoomify layer
- Image layers and their sources
- Using Spherical Mercator raster data with other layers
- Time For action – playing with various sources and layers together
- Time For action – applying Zoomify sample knowledge to a single raw image
- Summary
- 5. Using Vector Layers
- Time for action – creating a vector layer
- How the vector layer works
- The vector layer class
- Vector sources
- Time for action – using the cluster source
- Time for action – creating a loader function
- Time for action – working with the TileVector source
- Time for action – a drag and drop viewer for vector files
- Features and geometries
- Time for action – geometries in action
- Time for action – interacting with features
- Summary
- 6. Styling Vector Layers
- Time for action – basic styling
- The style class
- Time for action – using the icon style
- Have a go hero – using the circle style
- Multiple styles
- Time for action – using multiple styles
- Style functions
- Time for action – using properties to style features
- Interactive styles
- Time for action – creating interactive styles
- Summary
- 7. Wrapping Our Heads Around Projections
- Time for action – using different projection codes
- Time for action – determining coordinates
- OpenLayers projection class
- Transforming coordinates
- Time for action – coordinate transforms
- Time for action – setting up Proj4js.org
- Time for action – reprojecting extent
- Time for action – using custom projection with WMS sources
- Time for action – reprojecting geometries in vector layers
- Summary
- 8. Interacting with Your Map
- Time for action – converting your local or national authorities data into web mapping formats
- Time for action – testing the use cases for ol.interaction.Select
- Time for action – more options with ol.interaction.Select
- Introducing methods to get information from your map
- Time for action – understanding the forEachFeatureAtPixel method
- Time for action – understanding the getGetFeatureInfoUrl method
- Adding a pop-up on your map
- Time for action – introducing ol.Overlay with a static example
- Time for action – using ol.Overlay dynamically with layers information
- Time for action – using ol.interaction.Draw to share new information on the Web
- Time for action – using ol.interaction.Modify to update drawing
- Understanding interactions and their architecture
- Time for action – configuring default interactions
- Discovering the other interactions
- Time for action – using ol.interaction.DragRotateAndZoom
- Time for action – making rectangle export to GeoJSON with ol.interaction.DragBox
- Summary
- 9. Taking Control of Controls
- Adding controls to your map
- Time for action – starting with the default controls
- Controls overview
- Time for action – changing the default attribution styles
- Time for action – finding your mouse position
- Time for action – configuring ZoomToExtent and manipulate controls
- Creating a custom control
- Time for action – extending ol.control.Control to make your own control
- Summary
- 10. OpenLayers Goes Mobile
- Using a web server
- Time for action – go mobile!
- The Geolocation class
- Time for action – location, location, location
- The DeviceOrientation class
- Time for action – a sense of direction
- Debugging mobile web applications
- Debugging on iOS
- Debugging on Android
- Going offline
- Time for action – MANIFEST destiny
- Going native with web applications
- Time for action – track me
- Summary
- 11. Creating Web Map Apps
- Using geospatial data from Flickr
- Time for action – getting Flickr data
- A simple application
- Time for Action – adding data to your map
- Styling the features
- Time for action – creating a style function
- Creating a thumbnail style
- Time for action – switching to JSON data
- Time for action – creating a thumbnail style
- Turning our example into an application
- Time for action – adding the select interaction
- Time for action – handling selection events
- Time for action – displaying photo information
- Using real time data
- Time for action – getting dynamic data
- Wrapping up the application
- Time for action – adding dynamic tags to your map
- Deploying an application
- Creating custom builds
- Creating a combined build
- Time for action – creating a combined build
- Creating a separate build
- Time for action – creating a separate build
- Summary
- A. Object-oriented Programming – Introduction and Concepts
- Going further
- B. More details on Closure Tools and Code Optimization Techniques
- Introducing Closure Library, yet another JavaScript library
- Time for action – first steps with Closure Library
- Making custom build for optimizing performance
- Time for action – playing with Closure Compiler
- Applying your knowledge to the OpenLayers case
- Time for action - running official examples with the internal OpenLayers toolkit
- Time for action - building your custom OpenLayers library
- Syntax and styles
- Time for action – using Closure Linter to fix JavaScript
- Summary
- C. Squashing Bugs with Web Debuggers
- Time for action – opening Chrome Developer Tools
- Explaining Chrome Developer debugging controls
- Time for action – using DOM manipulation with OpenStreetMap map images
- Time for action – using breakpoints to explore your code
- Time for action – playing with zoom button and map copyrights
- Using the Console panel
- Time for action – executing code in the Console
- Time for action – creating object literals
- Time for action – interacting with a map
- Improving Chrome and Developer Tools with extensions
- Debugging in other browsers
- Summary
- D. Pop Quiz Answers
- Chapter 5, Using Vector Layers
- Chapter 7, Wrapping Our Heads Around Projections
- Chapter 8, Interacting with Your Map
- Chapter 9, Taking Control of Controls
- Chapter 10, OpenLayers Goes Mobile
- Appendix B, More details on Closure Tools and Code Optimization Techniques
- Appendix C, Squashing Bugs with Web Debuggers
- Index
For illustration purposes, we will use data coming from the Geographical Information System at the Commission (GISCO), a Eurostat (an European commission organism) service which promotes and stimulates the use of GIS within the European Statistical System and the Commission. We chose to use the Nomenclature of Units for Territorial Statistics (NUTS), the main administrative units within Europe. Perform these steps to achieve the objective outlined in this paragraph:
- Go to the URL http://www.eea.europa.eu/data-and-maps/data/administrative-land-accounting-u, and click on Download file within the GIS DATA block.
- Go to http://converter.mygeodata.eu, a website to make online conversion of spatial data files, vector, and raster. On the left-hand side part, in the block Upload your data files, click on Browse to select the downloaded
ZIPfile. After that, click on the Submit button. The following screenshot is the result of these two steps: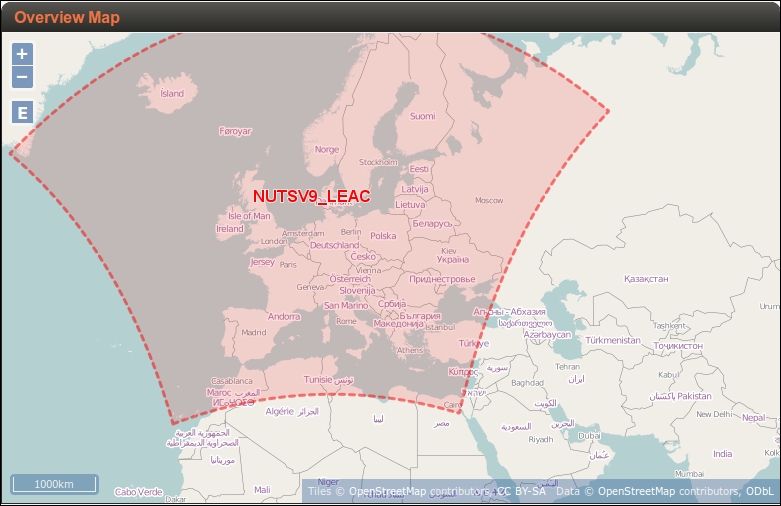
- After this operation, you should see in the block My GeoData on the left-hand side part, below the previous block, a date of upload and the
shpfile nameNUTSV9_LEAC.shp. You will also see in the page center an Overview Map. - Scroll down to change Target vector format: to GeoJSON and Output coordinate system: to WGS84. It should be like the following image.
- Before clicking on the button Convert now!, continue to scroll down to inspect dataset information like the layer name, the input format, the geometry type (polygon, line, or point), the number of elements, the extension, the projection and its associated SRID (read again if you need to Chapter 7, Wrapping Our Heads around Projections) and the column names with their type.
- Now, click for real on the button Convert now!, wait to see a new page appear with a button Download result, and click on it. You will have to wait to see an ad before getting a
ZIPfilemygeodata.json. Here's how the screen will look upon performing these steps: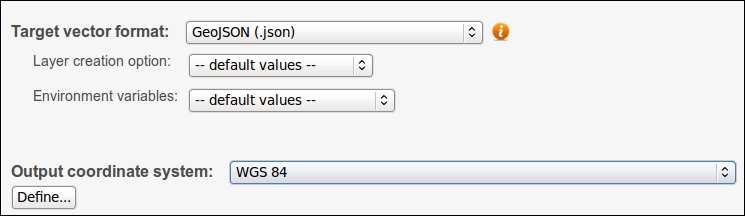
- Unzip the file to get a GeoJSON file named
NUTSV9_LEAC.json. Rename it now tonutsv9_lea.geojson. Our application will use it later.
We saw how we can use an external online website to have a first approach of geographical data conversion without installing specific software on your machine. You also saw that you only review a small part of the possibilities of the online tool to make conversion.
After this small conclusion, let's work more on the topic of data.
Remember that we introduced open data portals during the chapter and GIS files formats in particular in Chapter 5, Using Vector Layers. To revise and go a bit further, perform the following tasks:
- Find out your local and national open data portals, places dedicated to sharing open data and retrieve some GIS datasets
- From the first step, use the raw or converted GIS data to add it to a vector layer in your map example. It can be either GeoJSON or KML.
- Discover the documentation about shapefile, the most common GIS format. If you start to play more with cartography, you will have to know it.
- Try to discover web services such as Web Feature Service (WFS) instead of using a file; they serve content remotely. Use them instead of files, reusing your knowledge from Chapter 5, Using Vector Layers.
- Simplify the returned GeoJSON resulting from the previous conversion: it is too large. Use MapShaper for this (see the following tip to learn about this tool):
Tip
Data conversion tips
We chose to introduce you to an on-line application to make GIS data conversion. Imagine that you need to filter a large dataset and the upload size is big; you may need to use a local application for this. We advise you to do it with QGIS at http://qgis.org, an open source desktop software where you can view the geographical dataset itself in a GUI. If you prefer the command line, you'd better use GDAL (Geospatial Data Abstraction Library), a tool to make GIS data conversion, available at http://gdal.org.
You should also visit the website http://www.mapshaper.org. Contrary to the reviewed use case, the goal of MapShaper is to simplify the data in order to get a lighter dataset, in particular to gain time when loading. Do not hesitate because most of the time, you don't need a high level of precision!