Copyright © 2015 Packt Publishing
All rights reserved. No part of this book may be reproduced, stored in a retrieval system, or transmitted in any form or by any means, without the prior written permission of the publisher, except in the case of brief quotations embedded in critical articles or reviews.
Every effort has been made in the preparation of this book to ensure the accuracy of the information presented. However, the information contained in this book is sold without warranty, either express or implied. Neither the authors, nor Packt Publishing, and its dealers and distributors will be held liable for any damages caused or alleged to be caused directly or indirectly by this book.
Packt Publishing has endeavored to provide trademark information about all of the companies and products mentioned in this book by the appropriate use of capitals. However, Packt Publishing cannot guarantee the accuracy of this information.
First published: March 2011
Second published: January 2015
Production reference: 1210115
Published by Packt Publishing Ltd.
Livery Place
35 Livery Street
Birmingham B3 2PB, UK.
ISBN 978-1-78216-236-0
Authors
Thomas Gratier
Paul Spencer
Erik Hazzard
Reviewers
Jorge Arévalo
Gagan Bansal
Christopher Jennison
Arnaud Vandecasteele
Commissioning Editor
Usha Iyer
Acquisition Editors
Usha Iyer
Sam Wood
Content Development Editor
Sweny Sukumaran
Technical Editor
Parag Topre
Copy Editors
Sarang Chari
Janbal Dharmaraj
Neha Karnani
Project Coordinator
Rashi Khivansara
Proofreaders
Ting Baker
Paul Hindle
Linda Morris
Indexer
Mariammal Chettiyar
Graphics
Valentina D'silva
Disha Haria
Abhinash Sahu
Production Coordinator
Nilesh R. Mohite
Cover Work
Nilesh R. Mohite
Thomas Gratier is a GIS consultant living in Nantes, France, who mainly specializes in web development. He has an MSc degree in geography and urban planning from The Institute Of Alpine Geography of The University of Grenoble. Career-wise, he decided to steer towards more technical work but kept his geospatial passion in mind. He's gained 8 years of geospatial and programming experience, working for public authorities on water and flood risk prevention and management, various private urban consultancies in urban planning and web mapping solutions, and, multinational company CapGemini's GIS Division. He's continued building a stronger knowledge in IT technologies, open source and open data, and both web and geo standards. He does his development work with JavaScript, Pythons and PHP. His favorite libraries and tools for working are GDAL/OGR, PostGIS, QGIS, and OpenLayers, but he also enjoys using OpenStreetMap-related libraries, such as Mapnik or Osm2pgsql. He is an open source advocate, a Charter Member of The Open Source Geospatial Foundation (http://www.osgeo.org)(OSGeo). He gets involved in writing French translations for open source geospatial projects, such as MapServer and Zoo Project. With like-minded professionals, he contributes to weekly geospatial news updates at Geotribu (http://geotribu.net). He currently works as a freelance GIS consultant, providing development, consulting, and training services. More information can be found on his website at Web Geo Data Vore (http://webgeodatavore.com).
Paul Spencer is a software engineer who has worked in the field of open source geospatial software for more than 15 years. He is a strong advocate of open source development and champions its use whenever possible. Paul has architected several successful open source projects and been actively involved in many more. Paul was involved in the early design and development of OpenLayers and continues to be involved as the project evolves. Paul joined DM Solutions Group (DMSG) in 1998, bringing with him advanced software development skills and a strong understanding of the software-development process. In his time with the company, Paul has taken on a leadership role as the CTO and primary architect for DM Solutions Group's web mapping technologies and commercial solutions. Prior to joining DMSG, Paul worked for the Canadian Military, after achieving his master's degree in software engineering from The Royal Military College of Canada.
Erik Hazzard is the author of OpenLayers 2.10 Beginner's Guide, Packt Publishing. He has worked as the lead developer for a GIS-based company, has done contracting work with the design studio, Stamen, and has co-founded two start-ups. Erik is passionate about mapping, game development, and data visualization. In his free time, he enjoys writing and teaching, and can be found at http://vasir.net.
Jorge Arévalo is a computer engineer from Universidad Autónoma de Madrid, UAM. He started developing web applications with JavaScript, PHP, and Python. In 2010, he began working with PostGIS and GDAL projects, after participating in GSoC 2009, creating the PostGIS Raster GDAL driver. He also writes a blog on GIS at http://www.libregis.org. Jorge Arévalo has co-written the book, Zurb Foundation 4 Starter, Packt Publishing. He has also worked as a reviewer for the books, PostGIS 2.0 Cookbook, OpenLayers Beginner's Guide (2nd edition), Memcached, Speed Up your Web Application, and QGIS Cookbook, all by Packt Publishing.
Gagan Bansal has done B.Tech in Civil Engineering and then pursued M.Tech in Remote Sensing. He is experienced in maps application development, geospatial database design, and large-scale mapping using satellite data and aerial photographs. He is also experienced in understanding various market problems and deriving a feasible GIS solution using open source software and database. Currently, he is working with Rediff.com as a maps architect and engaged in developing applications for visualization and overlay of news, socioeconomic data, and business data on maps.
Christopher Jennison is an application developer working in Western Massachusetts with experience in GIS application development and mobile platform development. He has worked in web advertising, mobile advertising and application development, and data science and mapping applications. He has worked for HitPoint Studios, as a brand game developer, and The United States Geological Survey, as well as his own private contracts.
Arnaud Vandecasteele is a map lover and an open source / open data evangelist. After his PhD in computer science and GIS, he decided to move to Canada to conduct research on OpenStreetMap and to promote the use of Open Source GIS software. His experience with OpenLayers started from the very beginning of the library in 2006. From his website (http://geotribu.net), he wrote several tutorials to help beginners to use OpenLayers. Currently, Arnaud runs a GIS consultancy firm called Mapali (http://mapali.re/) that creates online mapping applications and provides consultancy services in the fields of web cartography and online GIS using open source software to a wide range of clients in the Indian Ocean (Réunion island, Mauritius).
For support files and downloads related to your book, please visit www.PacktPub.com.
Did you know that Packt offers eBook versions of every book published, with PDF and ePub files available? You can upgrade to the eBook version at www.PacktPub.com and as a print book customer, you are entitled to a discount on the eBook copy. Get in touch with us at <service@packtpub.com> for more details.
At www.PacktPub.com, you can also read a collection of free technical articles, sign up for a range of free newsletters and receive exclusive discounts and offers on Packt books and eBooks.

https://www2.packtpub.com/books/subscription/packtlib
Do you need instant solutions to your IT questions? PacktLib is Packt's online digital book library. Here, you can search, access, and read Packt's entire library of books.
If you have an account with Packt at www.PacktPub.com, you can use this to access PacktLib today and view 9 entirely free books. Simply use your login credentials for immediate access.
Web mapping is the process of designing, implementing, generating, and delivering maps on the Web and its products. OpenLayers is a powerful, community-driven, open source, pure JavaScript web mapping library. With this, you can easily create your own web map mashup using a myriad of map backends. Interested in knowing more about OpenLayers?
This book is going to help you learn OpenLayers from scratch. OpenLayers 3 Beginner's Guide will walk you through the OpenLayers library in the easiest and most efficient way possible. The core components of OpenLayers are covered in detail, with examples, structured so that you can easily refer back to them later.
The book starts off by showing you how to create a simple map and introduces you to some basic JavaScript programming concepts and tools. You will also find useful resources to learn more about HTML and CSS. Through the course of this book, we will review each component needed to make a map in OpenLayers 3, and you will end with a full-fledged web map application.
You will learn some context to help you understand the key role of each OpenLayers 3 component in making a map. You will also learn important mapping principles such as projections and layers. Maps require sources of data as well; so, you will see how to create your own data files and connect to backend servers for mapping. A key part of this book will also be dedicated to building a mapping application for mobile devices and its specific components.
With OpenLayers 3 Beginner's Guide, you will learn how to create your own map applications independently, without being stuck at the first stage of learning. You will acquire the information you need to develop your skills and knowledge of the OpenLayers 3 library.
Chapter 1, Getting Started with OpenLayers will introduce you to OpenLayers 3 and will help you to learn some basic mapping principles. You will see how to get ready for development in OpenLayers and create your first map.
Chapter 2, Key Concepts in OpenLayers will introduce the main components of the OpenLayers library and illustrate how they are related. We will introduce some key concepts, including events and observable properties, and learn some basic debugging techniques.
Chapter 3, Charting the Map Class will describe two of the core components, the Map and View classes, in detail. We will learn about the properties, methods, and events of both classes and apply them in practical examples.
Chapter 4, Interacting with Raster Data Source will introduce the concept of layers and focus on raster layers. We will explain the difference between tiled and untiled layers and learn how to use OpenLayers to visualize any type of image, even non-geospatial ones.
Chapter 5, Using Vector Layers will introduce vector layers and the related source, format, feature, and geometry classes. We will learn the properties, methods, and events associated with each, and how to use them to load a variety of vector data into an OpenLayers map.
Chapter 6, Styling Vector Layers will expand on our knowledge of vector layers by learning how to apply both static and dynamic styles to them. Through hands-on examples, we'll learn how to modify styles interactively in response to user interaction.
Chapter 7, Wrapping Our Heads Around Projections will cover the basic concepts behind map projections and their characteristics. We will cover projection support within OpenLayers by introducing the Proj4js library and applying it to map, vector, and raster layers.
Chapter 8, Interacting with Your Map will dive into the concept of interactions and introduce the default interactions. After covering the available interactions in detail, we will finish with an example showing how to use interactions to draw a rectangle.
Chapter 9, Taking Control of Controls will demonstrate the use of controls and introduce the default controls provided by OpenLayers. We will also review each of the controls in more detail and learn how to make a custom control.
Chapter 10, OpenLayers Goes Mobile will teach us to take advantage of mobile-specific features such as Geolocation and Device Orientation. We will also learn how to debug mobile web applications and look at some mobile-specific browser features that can be useful for geospatial applications.
Chapter 11, Creating Web Map Apps will build a complete application from scratch and learn how to use the OpenLayers build system to create a production-ready application from our code.
Appendix A, Object-oriented Programming – Introduction and Concepts covers the main concepts of Object-oriented Programming (OOP). After, we will discover how to reuse them exploring the OpenLayers API documentation with OOP in mind.
Appendix B, More details on Closure Tools and Code Optimization Techniques will cover more details on Closure Tools and code optimization techniques. This appendix introduces Closure Tools, a set of tools that OpenLayers 3 library relies on. It provides an understanding on how to use the Closure Library and Closure Compiler with a focus on compressing OpenLayers code files. We will finish with a review of styles and syntax for good coding practices.
Appendix C, Squashing Bugs with Web Debuggers provides JavaScript beginners with an in-depth review of browser developer tools. We will review Chrome Developer Tools, additional extensions and finish with debugging tools in other browsers such as IE and Firefox.
The main thing you'll need for this book is a computer and text editor. Your operating system will come with a text editor, any will do, but you will likely find that a text editor focused on developer needs will be most useful. There are many excellent developer-oriented text editors available for various operating systems, see https://github.com/showcases/text-editors and https://en.wikipedia.org/wiki/List_of_text_editors for some options. An Internet connection will be required to view the maps, and you'll also need a recent version of a modern web browser, such as Firefox, Google Chrome, Safari, Opera, or Internet Explorer (version 9 or higher).
For some advanced uses cases, you will also need Python, NodeJS, Java, and Git (a source code control management software). Installation instructions are provided for these additional tools.
No knowledge of Geographic Information Systems (GIS) is required, nor is extensive JavaScript experience. A basic understanding of JavaScript syntax and HTML/CSS will greatly aid in understanding the material, but is not required.
This book is for anyone who has an interest in using maps on their website, from hobbyists to professional web developers. OpenLayers provides a powerful, but easy-to-use, pure JavaScript and HTML (no third-party plug-ins involved) toolkit to quickly make cross-browser web maps. A basic understanding of JavaScript will be helpful, but there is no prior knowledge required to use this book. If you've never worked with maps before, this book will introduce you to some common mapping topics and gently guide you through the OpenLayers 3 library. If you're an experienced application developer, this book will also serve as a reference to the core components of OpenLayers 3.
Instructions often need some extra explanation to ensure they make sense, so they are followed with these sections:
This section explains the working of the tasks or instructions that you have just completed.
You will also find some other learning aids in the book, for example:
These are short multiple-choice questions intended to help you test your own understanding.
In this book, you will find a number of styles of text that distinguish between different kinds of information. Here are some examples of these styles, and an explanation of their meaning.
Code words in text, folder names, filenames, file extensions, pathnames, URLs, and user input are shown as follows: "You can name the folder whatever you like, but we'll refer to it as the sandbox folder."
A block of code is set as follows:
var map = new ol.Map({
  target: 'map',
  layers: [layer],
  view: view
});
When we wish to draw your attention to a particular part of a code block, the relevant lines or items are set in bold:
var map = new ol.Map({
 target: 'map',
 view: view,
 layers: [layer],
 renderer: 'dom'
});
Any command-line input or output is written as follows:
weinre –boundHost <your ip address>
New terms and important words are shown in bold. Words that you see on the screen, in menus or dialog boxes for example, appear in the text like this: "You can do this in several ways but the easiest is to load your page into a web browser and look at the Network tab".
Feedback from our readers is always welcome. Let us know what you think about this book—what you liked or may have disliked. Reader feedback is important for us to develop titles that you really get the most out of.
To send us general feedback, simply send an e-mail to <feedback@packtpub.com>, and mention the book title via the subject of your message.
If there is a topic that you have expertise in and you are interested in either writing or contributing to a book, see our author guide on www.packtpub.com/authors.
Now that you are the proud owner of a Packt book, we have a number of things to help you to get the most from your purchase.
You can download the example code files for all Packt books you have purchased from your account at http://www.packtpub.com. If you purchased this book elsewhere, you can visit http://www.packtpub.com/support and register to have the files e-mailed directly to you.
We also provide you a PDF file that has color images of the screenshots/diagrams used in this book. The color images will help you better understand the changes in the output. You can download this file from: http://www.packtpub.com/sites/default/files/downloads/B02497_ColorImages.pdf
Although we have taken every care to ensure the accuracy of our content, mistakes do happen. If you find a mistake in one of our books—maybe a mistake in the text or the code—we would be grateful if you would report this to us. By doing so, you can save other readers from frustration and help us improve subsequent versions of this book. If you find any errata, please report them by visiting http://www.packtpub.com/submit-errata, selecting your book, clicking on the errata submission form link, and entering the details of your errata. Once your errata are verified, your submission will be accepted and the errata will be uploaded on our website, or added to any list of existing errata, under the Errata section of that title. Any existing errata can be viewed by selecting your title from http://www.packtpub.com/support.
Piracy of copyright material on the Internet is an ongoing problem across all media. At Packt, we take the protection of our copyright and licenses very seriously. If you come across any illegal copies of our works, in any form, on the Internet, please provide us with the location address or website name immediately so that we can pursue a remedy.
Please contact us at <copyright@packtpub.com> with a link to the suspected pirated material.
We appreciate your help in protecting our authors, and our ability to bring you valuable content.
You can contact us at <questions@packtpub.com> if you are having a problem with any aspect of the book, and we will do our best to address it.
Within the past few years, the popularity of interactive web maps has exploded. In the past, creating interactive maps was reserved for large companies or experts with lots of money. But now, with the advent of free services such as Google and Bing Maps, online mapping is easily accessible to everyone. Today, with the right tools, anyone can easily create a web map with little or even no knowledge of geography, cartography, or programming.
Web maps are expected to be fast, accurate, and easy to use. Since they are online, they are expected to be accessible from anywhere on nearly any platform. There are only a few tools that fulfill all these expectations. OpenLayers is one such tool. It's free, open source, and very powerful. Providing both novice developers and seasoned GIS professionals with a robust library, OpenLayers makes it easy to create modern, fast, and interactive web-mapping applications for desktop and mobile.
In this chapter, we will:
OpenLayers is an open source, client-side JavaScript library for making interactive web maps, viewable in nearly any web browser. Since it is a client-side library, it requires no special server-side software or settings—you can use it without even downloading anything! Originally developed by MetaCarta as a response, in part, to Google Maps, the 2.x series of the library has grown into a mature, popular framework with many passionate developers and a very helpful community. At the time of writing, this version is still actively used and maintained, but this book will focus on the latest version, which is 3.0. For people wishing to switch to OpenLayers 3, particularly people already using the OpenLayers 2 series, the main reasons to change are:
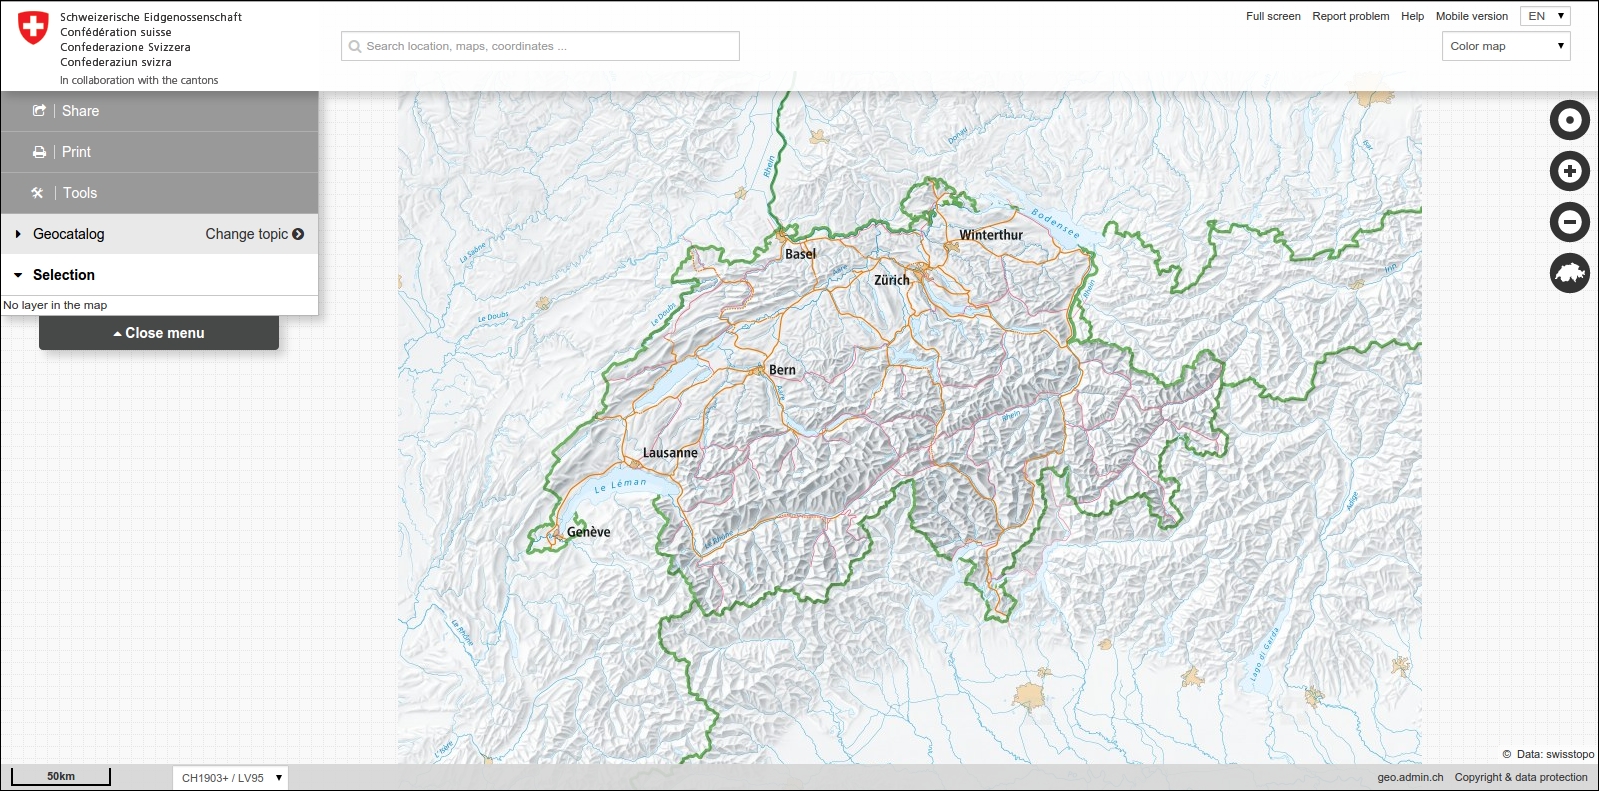
You can also add the fact that the library is already used in production, that demonstrates good performance at the Swiss federal geoportal, http://map.geo.admin.ch (see screenshot for reference ) and the OpenGeo Suite, a commercial open source based solution which already bundles the library:
OpenLayers makes creating powerful web mapping applications easy and fun. It is very simple to use—you don't even need to be a programmer to make a great map with it. It's open source, free, and has a strong community behind it. A big advantage of OpenLayers is that you can integrate it into any closed or open source application because it is released under the BSD 2-Clause license. So, if you want to dig into the internal code, or even improve it, you're encouraged to do so. Cross browser compatibility is handled for you by the Google Closure Library— but you need to have IE9+ because VML rendering (specific to IE8 and older versions) is no longer supported. Furthermore, OpenLayers 3.0 supports modern mobile, touch devices making it easy to develop for mobile technology.
OpenLayers is not tied to any proprietary technology or company, so you don't have to worry much about your application breaking with third party code (unless you break it). Although it's open source, you will get good support from the community and there are commercial support options as well. The library is recognized as well —established by the OSGeo (Open Source Geospatial Foundation), having passed through the OSGeo Incubation process, a kind of open source quality mark for geospatial projects.
You can read further about OSGeo Incubation at http://wiki.osgeo.org/wiki/Incubation_Committee
OpenLayers allows you to build entire mapping applications from the ground up, with the ability to customize every aspect of your map—layers, controls, events, and so on. You can use a multitude of different map server backends together, including a powerful vector layer. It makes creating map mashups extremely easy.
We said OpenLayers is a client-side JavaScript library, but what does this mean? The following context answers this question.
When we say client-side, we are referring to the user's computer, specifically their web browser. The only thing you need to make OpenLayers work is the OpenLayers code itself and a web browser. You can either download it and use it on your computer locally, or download nothing and simply link to the JavaScript file served on the site that hosts the OpenLayers project (http://openlayers.org). OpenLayers works on nearly all modern web browsers and can be served by any web server or your own computer. Using a modern, standard based browser such as Firefox, Google Chrome, Safari, or Opera is recommended.
When we say library, we mean that OpenLayers is a map engine that provides an API (Application Program Interface) that can be used to develop your own web maps. Instead of building a mapping application from scratch, you can use OpenLayers for the mapping part, which is maintained and developed by a bunch of brilliant people.
For example, if you'd want to write a blog, you could either write your own blog engine, or use an existing one such as WordPress or Drupal and build on top of it. Similarly, if you'd want to create a web map, you could either write your own from scratch, or use software that has been developed and tested by a group of developers with a strong community behind it.
By choosing to use OpenLayers, you do have to learn how to use the library (or else you wouldn't be reading this book), but the benefits greatly outweigh the costs. You get to use a rich, highly tested, and maintained code base, and all you have to do is learn how to use it. Hopefully, this book will help you with it.
OpenLayers is written in JavaScript, but don't fret if you don't know it very well. All you really need is some knowledge of the basic syntax, and we'll try to keep things as clear as possible in the code examples.
If you are unfamiliar with JavaScript, Mozilla provides phenomenal JavaScript documentation at https://developer.mozilla.org/en/javascript. We should also visit Eloquent JavaScript at http://eloquentjavascript.net, an online book to get started with the JavaScript language We recommend you also do some interactive exercises at Codecademy, http://codecademy.com, a website dedicated to learn JavaScript programming basics and much more.
First off, what is a web-mapping application? To put it bluntly, it's some type of Internet application that makes use of a map. This could be a site that displays the latest geo-tagged images from Flickr (we'll do this in Chapter 11, Creating Web Map Apps), a map that shows markers of locations you've traveled to, or an application that tracks invasive plant species and displays them. If it contains a map and it does something, you could argue that it is a web map application. The term can be used in a pretty broad sense.
So, where exactly does OpenLayers fit in? We know OpenLayers is a client-side mapping library, but what does that mean? Let's take a look at the following figure:
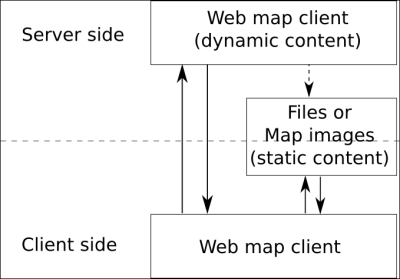
This is called the client/server model and it is, essentially, the core of how all web applications operate. In the case of a web map application, some sort of map client (for example: OpenLayers) communicates with some sort of web map server (for example: a map server using the WMS (Web Map Service) standard, an OpenStreetMap backend, or some satellite images). We've added a bit of complexity in it because the truth is that you can also rely only on client-side for web mapping applications using static content that you have pre-generated. To illustrate, you can use GeoJSON files, a JSON based format to display pins. For example, it is very useful for mobile content.
OpenLayers lives on the client-side. One of the primary tasks the client performs is to get map images from a map server. Essentially, the client asks a map server for what you want to look at. Every time you navigate or zoom around on the map, the client has to make new requests to the server—because you're asking to look at something different.
OpenLayers handles this all for you, and it is happening via AJAX (asynchronous JavaScript + XML) calls to a map server. Refer to http://en.wikipedia.org/wiki/Ajax_(programming) for further information on AJAX. To reiterate—the basic concept is that OpenLayers sends requests to a map server for map data every time you interact with the map, then OpenLayers pieces together all the returned map data (which might be images or vector data) so it looks like one big, seamless map. In Chapter 2, Key Concepts in OpenLayers, we'll cover this concept in more depth.
A map server (or map service) provides the map itself. There are a myriad of different map server backends. The examples include:
If you are unfamiliar with these terms, don't sweat it. The basic principle behind all these services is that they allow you to specify the area of the map you want to look at (by sending a request), and then the map servers send back a response containing the map image. With OpenLayers, you can choose to use as many different backends in any sort of combination as you'd like.
OpenLayers is not a web map server; it only consumes data from them. So, you will need access to some type of WMS. Don't worry about it though. Fortunately, there are a myriad of free and/or open source web map servers available that are remotely hosted or easy to set up yourself, such as MapServer. We speak a lot about web map servers but you must be aware that depending on your web-mapping application, you can use geographic data files to provide the needed data consumed by OpenLayers.
Throughout this book, we'll often use a freely available web-mapping service from http://www.openstreetmap.org/, so don't worry now about having to provide your own.
With many web map servers, you do not have to do anything to use them—just supplying a URL to them in OpenLayers is enough. OSGeo, OpenStreetMap, Google, Here Maps, and Bing Maps, for instance, provide access to their map servers (although some commercial restrictions may apply with various services in some situations).
The Google, Yahoo!, Bing, and ESRI's Mapping APIs allow you to connect with their map server backend. Their APIs also usually provide a client-side interface.
The Google Maps API, for instance, is fairly powerful. You have the ability to add markers, plot routes, and use KML data (things you can also do in OpenLayers)—but the main drawback is that your mapping application relies totally on Google. The map client and map server are provided by a third party. This is not inherently a bad thing, and for many projects, Google Maps and the others like it, are a good fit.
However, there are quite a few drawbacks such as:
Although we mentioned Google Maps API as one of the main maps, its support in OpenLayers is limited. As there are more tiles providers nowadays, it's not worth it to have code maintenance to support Google Maps API, a third party code that can break the main library, as sometimes happened earlier with the OpenLayers 2 API.
So, what's with the layers in OpenLayers? Well, OpenLayers allows you to have multiple different backend servers that your map can use. To access a web map server, you declare a layer and add it to your map with OpenLayers.
For instance, if you wanted to have a Bing Maps and an OpenStreetMap service displayed on your map, you would use OpenLayers to create a layer referencing Bing Maps and another one for OpenStreetMap, and then add them to your OpenLayers map. We'll soon see an example with an OpenStreetMap layer, so don't worry if you're a little confused.
Like layers of an onion, each layer is above and will cover up the previous one; the order that you add in the layers is important. With OpenLayers, you can arbitrarily set the overall transparency of any layer, so you are easily able to control how many layers cover each other up, and dynamically change the layer order at any time.
Most of the time, you make a distinction between base layers and non-base layers. Base layers are layers below the others and are used as a background on your maps to give general context. When you choose one base layer, the others will not be shown. On the top of base layers, you have non-base layers used to emphasize particular topics. You can also choose to use only overlay layers if you're considering that they are enough to understand the map. As a classical example, you could have a Bing map as your base layer, a layer with satellite imagery that is semi-transparent, and a vector layer, all active on your map at once. A vector layer is a powerful layer that allows for the addition of markers and various geometric objects to our maps—we'll cover it in Chapter 5, Using Vector Layers. Thus, in this example, your map would have three separate layers. We'll study in detail about layers and how to use and combine them in Chapter 4, Interacting with Raster Data Source.
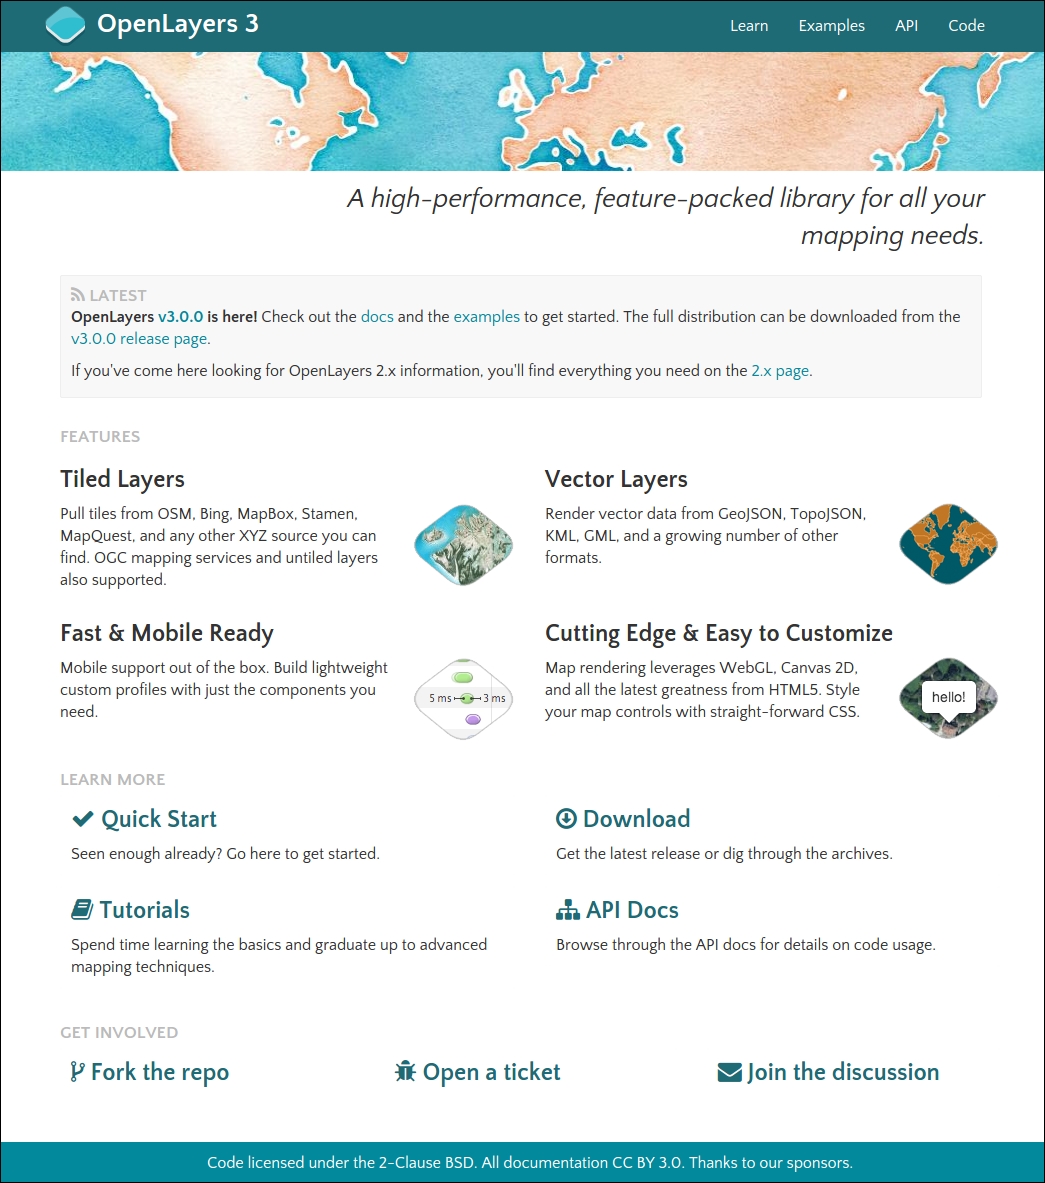
The website for OpenLayers 3 is located at http://openlayers.org. Have a look at the following screenshot:
To begin, you need to download a copy of OpenLayers (or we can directly link to the library—but we'll download a local copy). You can download the compressed library as a .zip by clicking on the green button at the bottom of the release page at https://github.com/openlayers/ol3/releases/tag/v3.0.0.
We will cover the website links by following the different areas of the main web page. Let's start with the navigation bar located at the top right area:
Be aware that currently both versions of OpenLayers exist
Let's download the OpenLayers library. After you're done, you should have the OpenLayers library files set up on your computer. Perform the following steps:
v3.0.0.zip version of the OpenLayers v3.0.0. It's the green button on the bottom left of the Github release page for v3.0.0.v3.0.0 (or whatever your version is).v3.0.0 folder. Once inside, you'll see a lot of folders, but the ones we are concerned with right now are the folders named build and css, as seen in the following screenshot: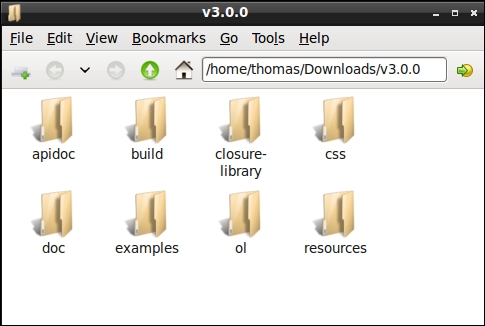
ol3 folder within an assets folder contained within a new folder ol3_samples in your home directory (or C:\ on Windows). Copy the previous build folder from v3.0.0 and rename it as js into the new ol3 directory and also copy the css folder into the same ol3 folder.sandbox into the ol3_samples directory. You can name the folder whatever you like, but we'll refer to it as the sandbox folder. Your new folder structure should look similar to the following screenshot: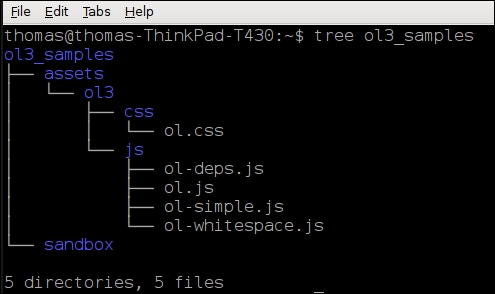
We just installed OpenLayers 3 by copying over different pre-built, compressed JavaScript files containing the entire OpenLayers 3 library code (from the build directory) and the associated assets (style sheets). To use OpenLayers, you'll need at a minimum, the ol.js file (the other .js files will be needed during the book but are not always required) and the ol.css file. For best practice, we already gave you some tips to structure the code like separate assets, such as css and js, or separate library code from your own code.
If you open the ol.js file, you'll notice it is nearly unreadable. This is because this is a minified and obfuscated version, which basically means extra white space and unnecessary characters have been stripped out to cut down on the file size and some variables have been shortened whenever possible. While it is no longer readable, it is a bit smaller and thus requires less time to download. If you want to look at the uncompressed source code, you can view it by looking in the ol-debug.js file within the js folder of the ol3 directory.
You can, as we'll see in the last chapter of this book, build your own custom configurations of the library, including only the things you need. But for now, we'll just use the entire library. Now that we have our OpenLayers library files ready to use, let's make use of them!
The process for creating a map with OpenLayers requires, at a minimum, the following things:
ol.layer.* classol.Map class by adding a layerol.View class to set for the Map class (defining the area where the map will initially be displayed)Now, we're finally ready to create our first map!
Let's dive into OpenLayers and make a map! After you finish this section, you should have a working map, which uses a publicly available OSM server backend from the OpenStreetMap.org project. Execute the following steps:
assets directory, create a folder css, and create a new file called samples.css. Add the following code:map {
height: 500px;
width: 100%;
background-color: #b5d0d0;
}hello_openstreetmap.html and save the file in the sandbox directory. If you are using Windows, we suggest using Notepad++ in particular because you need to be sure you're editing UTF-8 encoded files. On Linux, you can use Gedit or Geany and for Mac OSX, you can use Text Wrangler (free but not open source). Do not try to edit the file in a program such as Microsoft Word, as it will not save properly. The following code will also be used as the base template code for many future examples in this book, so we'll be using it often and coming back to it a lot:<!doctype html>
<head>
<title> Hello OpenStreetMap </title>
<link rel="stylesheet" href="../assets/ol3/css/ol.css" type="text/css" />
<link rel="stylesheet" href="../assets/css/samples.css" type="text/css" />
</head>
<body>
<div id="map" class="map"></div>
<script src="../assets/ol3/js/ol.js">
</script>
<script>
  var osmLayer = new ol.layer.Tile({
  source: new ol.source.OSM()
});
var birmingham = ol.proj.transform([-1.81185, 52.44314], 'EPSG:4326', 'EPSG:3857');
var view = new ol.View({
center: birmingham,
zoom: 6
});
var map = new ol.Map({
target: 'map'
});
map.addLayer(osmLayer);
map.setView(view);
</script>
</body>
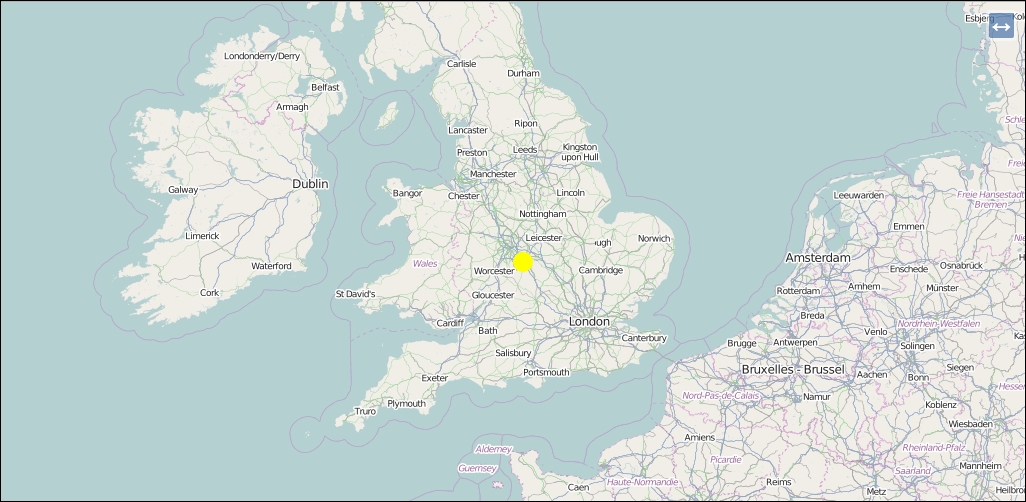
</html>hello_openstreetmap.html in your web browser. It can be hosted on a server or opened as a file. You should see something similar to the screenshot that follows: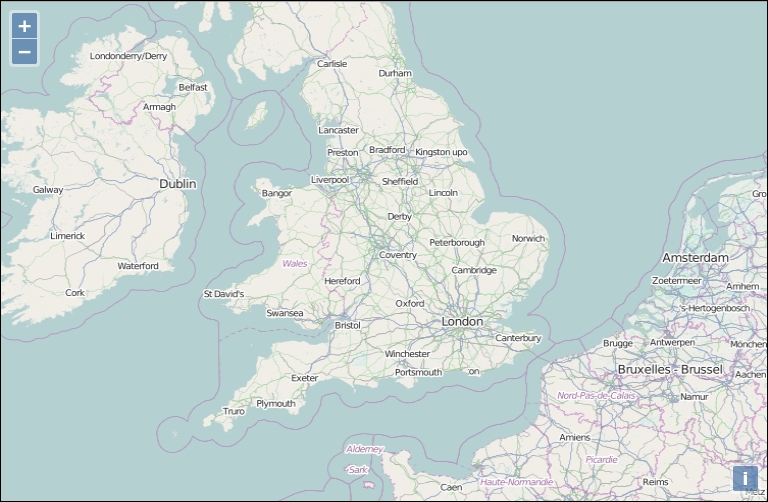
We just created our first map using OpenLayers! If it did not work for you for some reason, try double-checking the code and making sure all the commas and parentheses are in place. You can also open the browser debugger and look for JavaScript errors within the console. If you don't know what a console is, don't worry, we will see it soon. You can also refer to the Preface where a link to code samples used in the book is given. By default, we're given a few controls if we don't specify any. We will use the file we created as a template for many examples throughout the book, so save a copy of it so you can easily refer to it later.
The control on the left side (the navigation buttons) is called the Zoom control, which is a ol.control.Zoom object. You can click the buttons to navigate around the map, drag the map with your mouse, use the scroll wheel to zoom in, or use your keyboard's arrow keys. ol.control.Attribution is added by default. It will be populated if a layer (such as OSM) has attribution info available. This control is on the bottom right corner and gives the credits for the data you're using such as license and data producer.
We'll cover controls in greater detail in Chapter 9, Taking Control of Controls.
Now, let's take a look at the code, line by line.
<html> and <head> tag, and the extraneous code you see specifies various settings that inform your browser that this is an HTML5 compliant page. For example, we include the DOCTYPE declaration in line 1 to specify that the page conforms to standards set by the WC3. We also specify a <title> tag, which contains the title that will be displayed on the page. We also add a css stylesheet content to display correctly the zoom and attribution controls, and set the future map size to a height of 500px and a width of 100% (the width will always be at the max width depending on the browser window).This is the structure that all our code examples will follow, so this basic code template will be implicitly assumed in all examples that follow throughout the book.
<body> <div id="map" class="map"></div>
To make an OpenLayers map, we need an HTML element where the map will be displayed in. Almost always, this element will be a div. You can give it whatever ID you would like, and the ID of this HTML element is passed into the call to create the map object. You can style the <div> tag however you would like—setting the width and height to be 100 percent, for instance, if you want a full page map. We choose a class for this, also called map.
<script src="../assets/ol3/js/ol.js" type="text/javascript"></script>
This includes the OpenLayers library. The location of the file is specified by the src='../assets/ol3/js/ol.js' attribute. Here, we're using a relative path. As the hello_openstreetmap.html page is within the sandbox at the same level as the assets, we need to go outside the sandbox directory and then set the path to ol.js file . The file could either be on your computer, or another computer. Browsers can load it on any computer thanks to the relative path.
We can also use an absolute path, which means we pass in a URL where the script is located at. openlayers.org hosts the script file as well; we could use the following line of code to link to the library file directly:
<script src='http://openlayers.org/en/v3.0.0/build/ol.js></script>
Notice how the src specifies an actual URL which is an absolute path http://openlayers.org/en/v3.0.0/css/ol.css at line 5. Either way works, however, throughout the book we'll assume that you are using a relative path and have the OpenLayers library on your own computer/server. If you use the hosted OpenLayers library, you cannot be sure that it will always be available, so using a local copy is recommended.
Be aware that when browsers load a page, they load it from top to bottom. To use any DOM (Document Object Model) elements (any HTML element on your page) in JavaScript, they first have to be loaded by the browser. So, you cannot reference HTML with JavaScript before the browser sees the element. It'd be similar to trying to access a variable that hasn't yet been created. Because of this behavior, don't forget to call your JavaScript content after the <div id="map" class="map"></div>.
<script> block. We'll set up all our code inside it to create our map. Since the OpenLayers library has been included in line 13, we are able to use all the classes and functions the library contains. var osmLayer = new ol.layer.Tile({
source: new ol.source.OSM()
});In the previous three lines of code, we created a global variable called osmLayer. In JavaScript, any time we create a variable we need to place var in front of it to ensure that we don't run into scope issues (what functions can access which variables). When accessing a variable, you do not need to put var in front of it.
Since we are defining osmLayer as a variable at the global level (outside of any functions), we can access it anywhere in our code. We declare the osmLayer as an ol.layer.Tile object. It means we use an ol.layer.Tile class for creating the variable layerOsm.
The object created is also referred to as an instance of the ol.layer.Tile class. We'll talk about what this means later in the Appendix A, Object-oriented Programming – Introduction and Concepts.
Now, let's look at the right hand side of the equal sign (=): new keyword means that we are creating a new object from the class that follows it. ol.layer.Tile is the class name which we are creating an object from. Notice that something is inside the parenthesis: {source: new ol.source.OSM()}. This means we are passing one thing into the class (called an argument). Every class in OpenLayers expects different arguments to be passed into it, and some classes don't expect anything.
The ol.layer.Tile class expects one parameter following the API doc reference. Take a look at: http://openlayers.org/en/v3.0.0/apidoc/ol.layer.Tile.html. The {source: new ol.source.OSM()} is the layer options, consisting of key:value pairs (for example, {key:value} ). This is also called JavaScript Object Literal Notation, a way to create objects on the fly.
JavaScript object literal notation
In OpenLayers, we often pass in anonymous objects to classes . In JavaScript, anonymous objects are commas separated key:value pairs, and are set up in the format of {key1:value1, key2:value2}. They are, basically, objects that are created without deriving from a class. This format is also referred to as object literal notation.
When we say key1:value1, it's similar to saying key1 = value1, but we use a colon instead of an equals sign. We can also affect to a variable an object and reuse this variable instead of creating it on the line, for example:
var layer_parameters = {source: new ol.source.OSM()};
var osmLayer = new ol.layer.Tile(layer_parameters);
So, the option source new ol.source.OSM() is the way to tell the characteristic of the tiles we want to retrieve such as the URL or the default attribution text, whereas ol.layer.Tile is the way to say how you ask the map image, not where it comes from.
The type of ol.source can be any from a multitude of different services, but we are using OSM here as a source. OSM (OpenStreetMap), is a crowdsourcing project focusing on creating open source map data. The main visible part of the project is the OSM world map we are using.
The arguments, like the source we can pass in for layers, are dependent on the layer class—we cover layers in detail in Chapter 3, Charting the Map Class. If you don't want to wait, you can also check out the documentation at http://openlayers.org/en/v3.0.0/apidoc/ to see what arguments different layers of classes expect.
var birmingham = ol.proj.transform([-1.81185 52.44314], 'EPSG:4326', 'EPSG:3857');
In this line of code, we take coordinates from a place, Birmingham in the UK, and we use a custom function that transforms [longitude, latitude] to the projected coordinate the map will expect in the view.
var view = new ol.View({ center: birmingham zoom: 6 });In the preceding four lines of code, we are defining a view from class ol.View. It's to use a view. Until now, we have defined what we will see, but with the view, we will define from where we are seeing it. Think of view as equivalent to a shot you might see in a cinema and where the cameraman chooses to see actors with more or less light, from far away or near, from below or above. Maps are usually 2D objects but because of new capabilities in the library, you can also have a tilted 2D view. We will not cover it because it requires advanced knowledge.
We have two options here in the JavaScript object: center and zoom.
The first one sets the center of the map with coordinates. These are not using latitude and longitude coordinates but Spherical Mercator coordinates, a common web mapping standard projection. We will explain this topic in Chapter 7, Wrapping Our Heads Around Projections.
The zoom is a way to set the level of details you get on the map when you open the web page. Change this value to understand better. The value for using the OSM layer can be between 0 and 18. The more you increase the value, the more you zoom in. If you set the value to 20, you will see that the image is always of the level 18 but the library resizes the image itself and and the image quality will be reduced.
var map = new ol.Map({ target: 'map' });We previously created a layer in order to add it to a map but this map was not already created. We have done it using the ol.Map class. The map object is the crux of our OpenLayers application— we call its functions to tell the view bound to the map to zoom to areas, fire off events, keep track of layers, and so on.
The ol.Map class expects a JavaScript object parameter. Within this object, we use one object parameter: target. You can provide another parameter renderer to choose the way the image will be displayed in the browser. It can be, DOM, Canvas, or WebGL. Don't worry about these terms, we will explain what they cover. This is not a mandatory option but we'd prefer to tell you already to be aware of this. You will learn more about this in Chapter 2, Key Concepts in OpenLayers.
The other object parameter is target. Its purpose is to set where you will attach your map in the HTML. It refers to the id of an HTML element available in your web page.
Notice, we don't include everything on one line when creating our map object—this improves readability, making it easier to see what we pass in. The only difference is that we are also adding a new line after the comma separating arguments, which doesn't affect the code (but does make it easier to read).
map.addLayer(osmLayer);
Now that we have created both the map and layer, we can add the layer to the map. In OpenLayers, every map needs to have at least one layer. The layer points to the backend, or the server side map server, as we discussed earlier.
Notice, we are calling a function of the map object. There are actually a few ways to go about adding a layer to a map object. We can use the previous code (by calling map.addLayer), where we pass in an individual layer but we can also add the layers when instantiating the ol.Map with something such as the following:
var map = new ol.Map({ target: 'map',
  layers: [osmLayer]
});
In this second case, you have to create your layer before the map. Most official examples use the second syntax but for learning purposes, we thought it would be better to separate map instantiation from layers addition.
map.setView(view);
This line enables you to set the view to render the image and display it at the right place you defined previously in the ol.View instance, the view variable.
    </script>
  </body>
</html>
These lines close the JavaScript block and the remaining HTML blocks.
After reviewing this first example, if the concept of object-oriented programming is unfamiliar to you, we recommend that you take some time to explore this topic. While you don't necessarily need to know OOP concepts thoroughly to use this book, understanding keywords such as class, properties, abstract class, methods, instance, constructor, or inheritance should ring a bell in your mind. If not, we advise you to visit the Appendix A, Object-oriented Programming – Introduction and Concepts.
Now, let's introduce you to the main resources for getting the most important information about OpenLayers and its ecosystem.
Our coverage of the sample code was not meant to be extremely thorough; just enough to give you an idea of how it works. We'll be covering OOP concepts in more detail throughout the remaining chapters, so if anything is a bit unclear, don't worry too much.
As OpenLayers is a library and provides functions for you, it is important to know what these functions are and what they do. There are many places to do this, but the best source is the API docs.
The API documentation is always up-to-date and contains an exhaustive description of all the classes in OpenLayers. It is usually the best and first place to go when you have a question. You can access the documentation at: http://openlayers.org/en/v3.0.0/apidoc/ for the 3.0.0 release. It contains a wealth of information. We will constantly refer to it throughout the book, so keep the link handy! Sometimes, however, the API docs may not seem clear enough, but there are plenty of other resources out there to help you. We'll cover a bit about how to find your way in API documentation in Chapter 2, Key Concepts in OpenLayers and in Appendix A, Object-oriented Programming – Introduction and Concepts.
The extension website for this book can be found at: http://openlayersbook.github.io/openlayersbook/. Current, up-to-date corrections and code fixes, along with more advanced tutorials and explanations, can be found there. You can also grab the code and more information about this book at Packt Publishing's website, located at https://www.packtpub.com/web-development/openlayers-3-beginner%E2%80%99s-guide.
The OpenLayers mailing list is an invaluable resource that lets you not only post questions, but also browse questions others have asked (and answered). There were two main OpenLayers news groups—Users and Dev for the OpenLayers 2 Version. There is a list only for OpenLayers 3 development discussions located at https://groups.google.com/forum/#!forum/ol3-dev. You may find some users' questions in the archives as it was before for both development and users questions.
Now, user questions should be only posted on http://stackoverflow.com and tagged with openlayers. OpenLayers 3 library developers will answer directly here.
When posting a question, please be as thorough as possible, stating your problem, what you have done, and the relevant source code (for example, "I have a problem with using a WMS layer. I have tried this and that, and here is what my source code looks like..."). A good guideline for asking questions in a way that will best elicit a response can be found at http://www.catb.org/~esr/faqs/smart-questions.html.
Books are great, but they're basically just a one way form of communication. If you have any questions that the book does not answer, your favorite search engine is the best place to go to. The Questions and Answers website http://gis.stackexchange.com, the young brother of StackOverflow, dedicated to GIS (Geographical Information System) can also be quite useful. But, at the end, don't forget that mailing lists and IRC are other great resources.
Sometimes, you will hit an error without understanding why you encounter it, for example related to a mobile browser's unexpected behavior. Before asking to check mailing lists or IRC, we encourage you to make a small search in the list of issues located at Github https://github.com/openlayers/ol3/issues. You can search issues by milestone, status (opened, closed, etc), or keywords.
IRC (Internet Relay Chat) is another great place to go to if you have questions about OpenLayers. IRC is used for group communication; a big chat room, essentially. If you have exhausted Google, issues' trackers, and the mailing list, IRC provides you in real time with other people interested in OpenLayers.
Generally, the people who hang out in the OpenLayers chat room are very friendly, but please try to find an answer before asking in IRC. The server is irc.freenode.net and the chat room is #openlayers. You can download an IRC client online; a good Windows one is mIRC (http://mirc.com). More information about how to use IRC can be found at http://www.mirc.com/install.html. For beginners, we recommend using Chatzilla, a Firefox Mozilla add—on http://chatzilla.hacksrus.com or CIRC, a Google Chrome add—on http://flackr.github.io/circ/.
When you've installed it, just type irc://irc.freenode.net/openlayers (for Chatzilla only) in your browser address bar, press enter, wait and you're ready to speak on OpenLayers IRC channel.
The source code repository location is hosted at GitHub. You can access the entire code repository at http://github.com/openlayers/ol3.
Feel free to download a copy and play around with it yourself. When you become an advanced user, you can submit evolutions to the official source code base and become a contributor to the library. Without going so far, it cannot hurt to download a copy of the code base and look around it yourself to figure out how it's really working!
Nowadays, some people prefer to aggregate content using RSS feeds or social networks.
Let's review how you can access alternatively to all the previous resources and more.
For the OpenLayers 3 Developers mailing list, you can use atom or RSS feed, available at https://groups.google.com/forum/#!aboutgroup/ol3-dev
When you want to get news about OpenLayers 3 development, you have to rely on Github website capabilities.
You can see:
In this chapter, we were introduced to OpenLayers and learnt a bit about it.
We saw what web map applications are and how they work. After that, we created our first map with OpenLayers, then analyzed how the code works. Then, we covered a fundamental concept, object-oriented programming, which we'll need to know about while really working with OpenLayers. Lastly, resources for help and information outside this book were provided.
Now that we have a basic handle on OpenLayers, we'll jump straight into Chapter 2, Key Concepts in OpenLayers. We will discover relationships between library core parts. Using examples, we will also review Events and Observe behaviors. It would be impossible to get an interactive map without them. Then, to finish, we will focus on basic debugging techniques. To learn more about JavaScript debugging, you can also refer to Appendix C, Squashing Bugs with Web Debuggers.
Now that we've seen the basics and made our first map with OpenLayers, let's take a step back and look at the big picture. OpenLayers is a software library based on an Object-oriented design principles, which means that it contains classes to encapsulate behavior, formal relationships between those classes, and standardized mechanisms for communication between objects. While OpenLayers contains many classes, there are just a few that form the foundation of the OpenLayers architecture. In this chapter, we will introduce these core components of the library and also two key concepts— events and observable properties—that are the basis for standardized communication between objects. Along the way, we'll use concrete examples and introduce some basic debugging techniques you can use to solve problems and explore the relationships between objects in a running application.
In this chapter, we will:
The OpenLayers library provides web developers with components useful to build web mapping applications. Following the principles of an Object-oriented design, these components are called classes. The relationship between all the classes in the OpenLayers library is part of the deliberate design, or architecture, of the library. There are two types of relationships that we, as developers using the library, need to know about: relationships between classes and inheritance between classes. We briefly talked about object-oriented programming in Chapter 1, Getting Started with OpenLayers and a more detailed discussion is included in Appendix A, Object-oriented Programming – Introduction and Concepts but for the purpose of this chapter, let's summarize the two types of relationships we are interested in:
We'll start our discussion of the key components of OpenLayers by focusing on the first of these—the relationship between classes. OpenLayers includes a lot of classes for our use, and we'll cover a lot of these in later chapters, but for now, we'll start by looking at the Map class—ol.Map.
Instances of the map class are at the center of every OpenLayers application. These objects are instances of the ol.Map class and they use instances of other classes to do their job, which is to put an interactive map onto a web page. Almost every other class in the OpenLayers is related to the Map class in some direct or indirect relationship. The following diagram illustrates the direct relationships that we are most interested in:
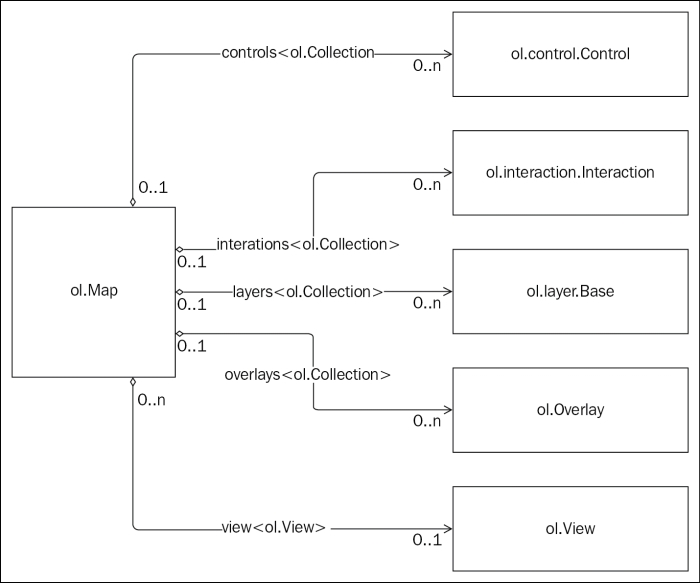
The preceding diagram shows the most important relationships between the Map class and other classes it uses to do its job. It tells us several important things:
view to refer to it. A view may be associated with multiple maps, however.Collection class and a layer may be associated with 0 or one Map class. The Map class has a member variable named layers that it uses to refer to this collection.Collection class and an overlay may be associated with 0 or one Map class. The Map class has a member variable named overlays that it uses to refer to this collection.ol.Collection (more on collections at the end of this chapter) and controls may be associated with 0 or one Map class. The Map class has a member variable named controls that it uses to refer to this collection.Collection class and an interaction may be associated with 0 or one Map class. The Map class has a member variable named interactions that it uses to refer to this collection.Although these are not the only relationships between the Map class and other classes, these are the ones we'll be working with the most. We've already seen some of these classes in action in the examples from the previous chapter. We'll do another example in a moment, but first let's introduce each of these new classes.
View class (ol.View) manages information about the current position of the Map class.If you are familiar with the programming concept of MVC (Model-View-Controller), be aware that the view class is not a View in the MVC sense. It does not provide the presentation layer for the map, rather it acts more like a controller (although there is not an exact parallel because OpenLayers was not designed with MVC in mind.)
Layer class (ol.layer.Base) is the base class for classes that provide data to the map to be rendered.Overlay class (ol.Overlay) is an interactive visual element like a control, but it is tied to a specific geographic position.Control class (ol.control.Control) is the base class for a group of classes that collectively provide the ability to a user to interact with the map. Controls have a visible user interface element (such as a button or a form input element) with which the user interacts.Interaction class (ol.interaction.Interaction) is the base class for a group of classes that also allow the user to interact with the map, but differ from controls in which they have no visible user interface element. For example, the DragPan interaction allows the user to click on and drag the map to pan around.Let's create a new OpenLayers application and identify the components as we go:
components.html in the sandbox directory and put in the standard HTML structure for our applications as follows:<!doctype html>
<html>
<head>
<title>OpenLayers Components</title>
<link rel="stylesheet" href="../assets/ol3/css/ol.css" type="text/css" />
<link rel="stylesheet" href="../assets/css/samples.css" type="text/css" />
</head>
<body>
<div id="map" class="map"></div>
<script src="../assets/ol3/js/ol.js"></script>
<script>
</script>
</body>
</html>layers collection:var layer = new ol.layer.Tile({
source: new ol.source.OSM()
});DragRotateAndZoom:var interaction = new ol.interaction.DragRotateAndZoom();
FullScreen:var control = new ol.control.FullScreen();
<div> tag containing our map:<div id="overlay" style="background-color: yellow; width: 20px; height: 20px; border-radius: 10px;">
var center = ol.proj.transform([-1.812, 52.443], 'EPSG:4326', 'EPSG:3857');
var overlay = new ol.Overlay({
position: center,
element: document.getElementById('overlay')
});var view = new ol.View({
center: center,
zoom: 6
});var map = new ol.Map({
target: 'map',
layers: [layer],
interactions: [interaction],
controls: [control],
overlays: [overlay],
view: view
});
If you try to interact with the map, you'll notice something immediately—you can't click and drag to pan. Instead, if you hold down the Shift key while clicking and dragging, you'll get a whole new behavior. We've also lost the zoom in and out buttons at the top left corner, and the attribution icon in the bottom right corner, but there is a new button in the top-right corner. What does it do?
In the first step, we added our boilerplate HTML code for a simple OpenLayers application. This includes standard HTML tags suitable for any web page, and also includes the OpenLayers CSS and JavaScript files.
Next, we started creating instances of various OpenLayers components to use with our map. The first one was a layer that renders tiles from the OpenStreetMap tile servers. Next, we created an interaction called DragRotateAndZoom. This interaction has no visible element, but rather is triggered by holding down the Shift key while dragging the map. As the name suggests, this interaction will rotate and zoom the map in response to dragging the mouse cursor. Then we created a control called FullScreen. Again, the name gives away what it does—launches the web page into fullscreen mode. Because it is a control, it has a button that is clicked to activate its behavior. Next, we created an overlay, which displays an HTML element at a specific geographic location. Finally, we created the view, giving it the same center as the position we provided to the overlay.
The last step is to tie it all together with the Map class object by passing all our components as part of the constructor. We'll look at the Map class's constructor in more detail in Chapter 3, Charting the Map Class but for now, it's enough to know that we can provide arrays of layers, interactions, controls, and overlays as options, and the Map class will know what to do with them.
We saw that by providing our own set of interactions and controls; we changed the default behavior of an OpenLayers application. This is because the Map class has a default set of interactions and controls that it creates when they are not explicitly provided as options to the constructor. There are two ways we can restore the default behavior and add our new components as well.
The first way is to use helper functions provided by OpenLayers to obtain the collection of default interactions and default controls and extend those with our new components. We will do something like this (this example is not complete as the Map class is missing a view):
// create our interaction
var interaction = new ol.interaction.DragRotateAndZoom();
// get the default interactions and add our new one
var interactions = ol.interaction.defaults().extend([interaction]);
// create our control
var control = new ol.control.FullScreen();
// get the default controls and add our new one
var controls = ol.control.defaults().extend([control]);
// create the map and pass in the extended set of interactions and controls
var map = new ol.Map({
interactions: interactions,
controls: controls
});The second method is to add them to the map after calling the constructor, for instance, (again, this example is not complete):
var interaction = new ol.interaction.DragRotateAndZoom(); var control = new ol.control.FullScreen(); var map = new ol.Map(); map.addInteraction(interaction); map.addControl(control);
The advantage of the first method (passing constructor options) is that it gives you complete control over which interactions and controls are in use, while the second method (adding them after creating the map) has the advantage of being simpler if you want to add to the existing set of interactions and controls.
In many parts of OpenLayers, you will discover that there are multiple ways of accomplishing a given task. This is part of the design of the OpenLayers library and provides developers with the option to write code in a way that makes most sense for them.
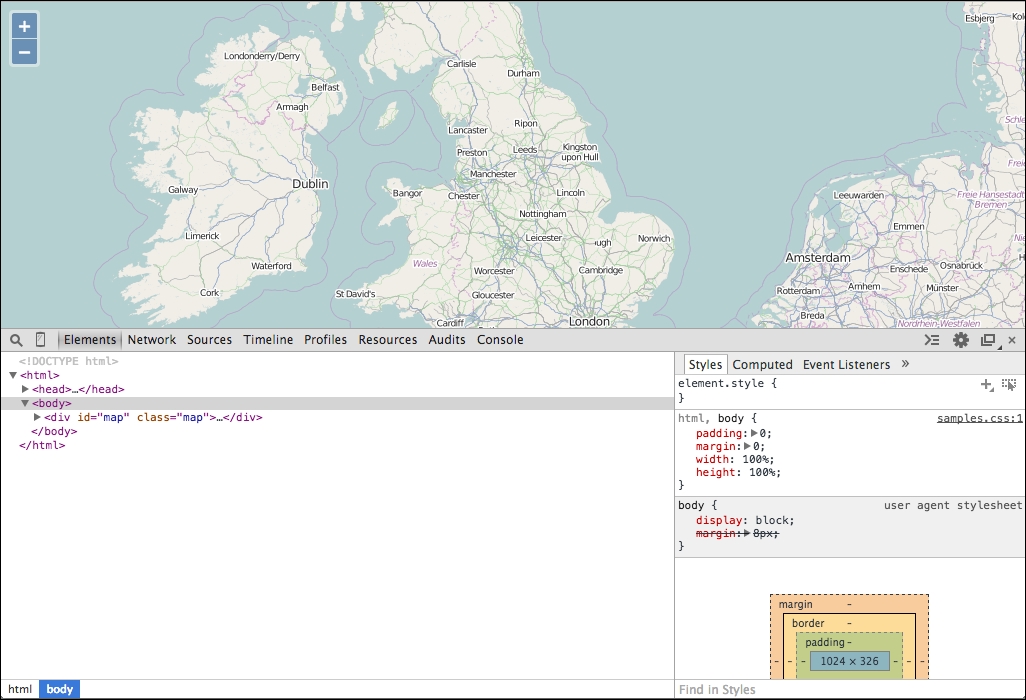
We noted at the end of the previous example that the map wasn't working normally. We replaced the default controls and interactions and so the default behavior wasn't present any more. Let's take a moment to try to fix this. In many cases, mistakes or oversights in our code will produce unexpected results. Web developers have a number of tools available to help them diagnose and fix these problems. In this example, we'll work with the Developer Tools available in the Chrome browser. Similar tools exist for all major browsers; if you are not using Chrome, you should still be able to follow along using your browser's Developer Tools. With the previous example open in your browser, let's get started:
Using any of these methods, a new Developer Tools window will open. By default, the Developer Tools window will be docked to the current tab at the bottom. You can change this by detaching it to a separate window or moving it to one side, but for now, let's keep it at the bottom. It should look something like the following screenshot:
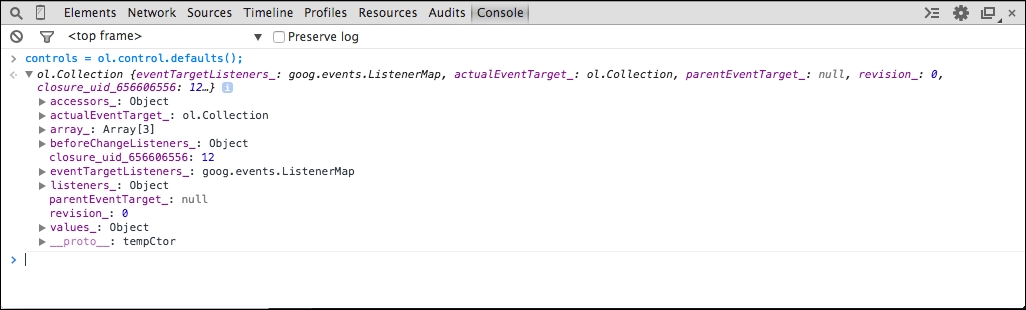
controls = ol.control.defaults();
This should output the value that was assigned to the variable controls, something like the following screenshot:
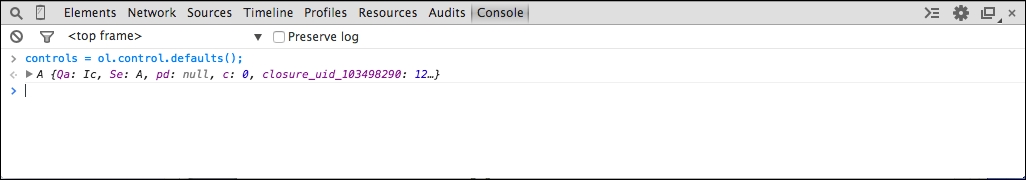
You can click the small triangle next to the line of output to expose properties of the object, like the following screenshot:
We can't even tell what kind of object this is! Let's fix that first.
ol.js to load the debug version ol-debug.js:<script src="../assets/ol3/js/ol-debug.js"></script>
The build process used to create production and debug versions of OpenLayers is covered in detail in Chapter 11, Creating Web Map Apps and Appendix B, More details on Closure Tools and Code Optimization Techniques.
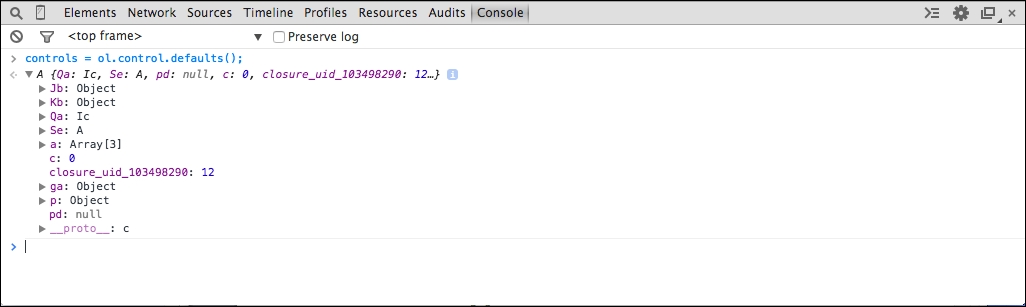
Now, we can see that the controls variable is an instance of ol.Collection and we should be able to add each of the elements of the collection to the map. The line of output expanded, you can see the properties of the collection object.
The last entry is labeled __proto__ and has a triangle next to it. The __proto__ property is a special property that shows us an object's prototype, essentially the methods it gains from the class the object was created from. We can explore this property for methods available to be called on the object. Note that the __proto__ property may also have a __proto__ property revealing further methods inherited from other classes in the inheritance hierarchy.
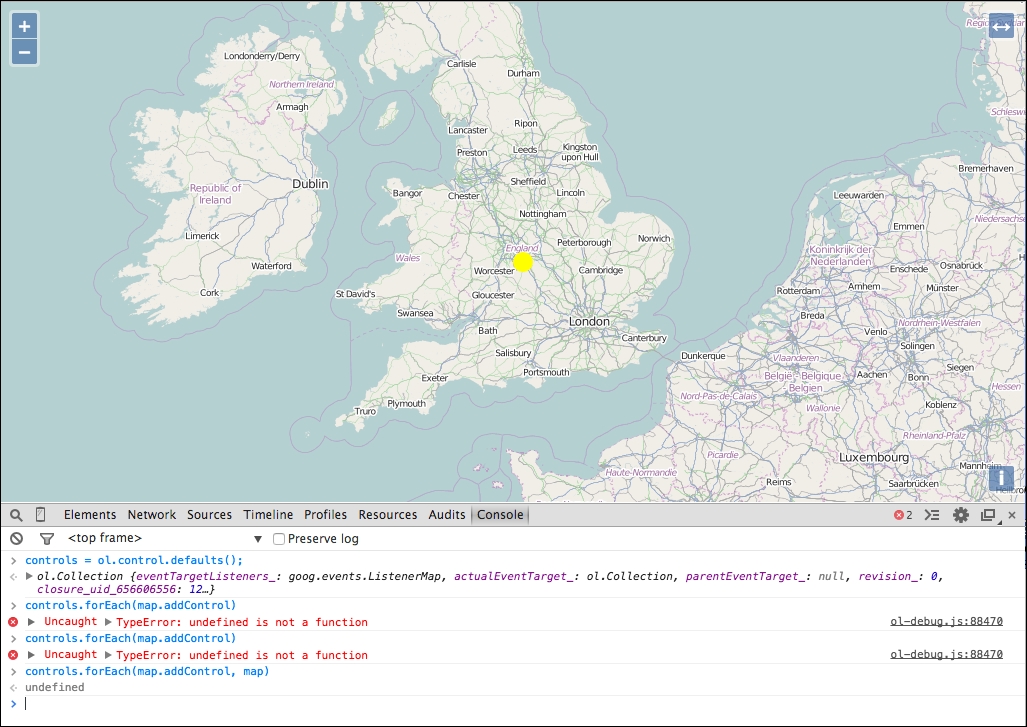
addControl method to add one control at a time, so we need a way of doing this for each individual controls in the collection. Collections have a forEach method that invokes a function for each item in the collection, which sounds ideal! Let's give it a try by running the following code in the Console tab:controls.forEach(map.addControl);
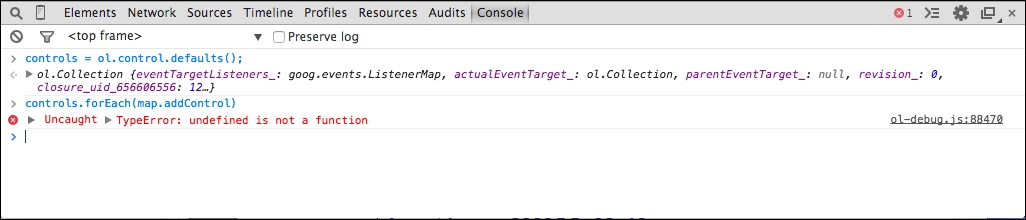
Something is not right, we are getting an error. Let's investigate.
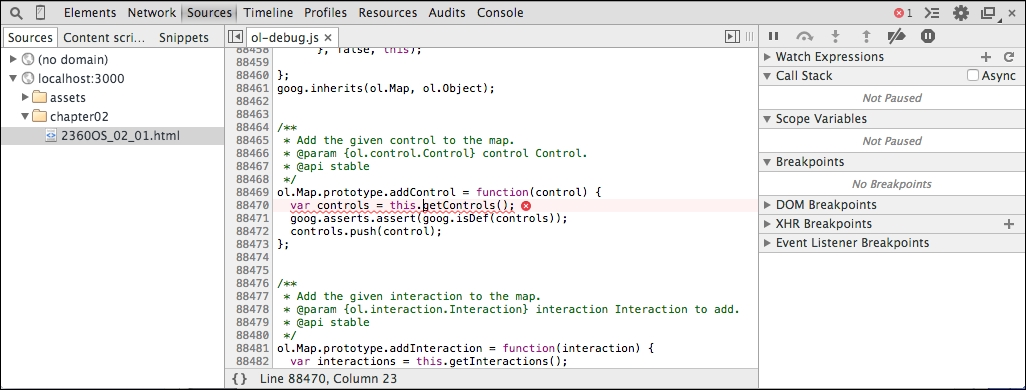
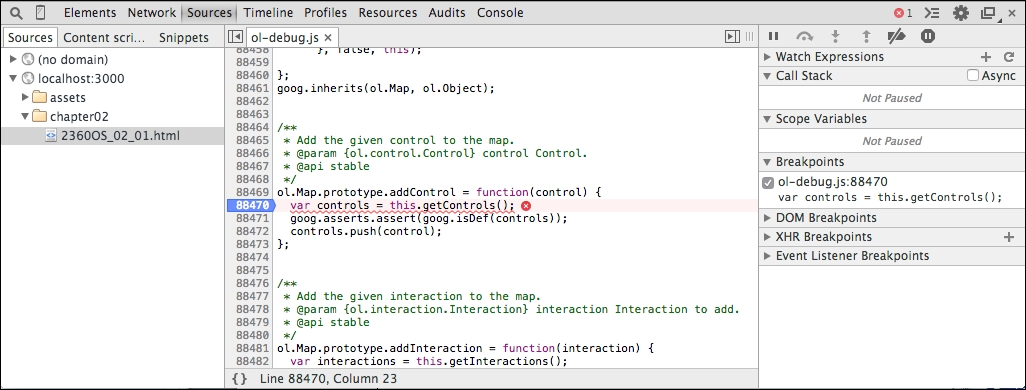
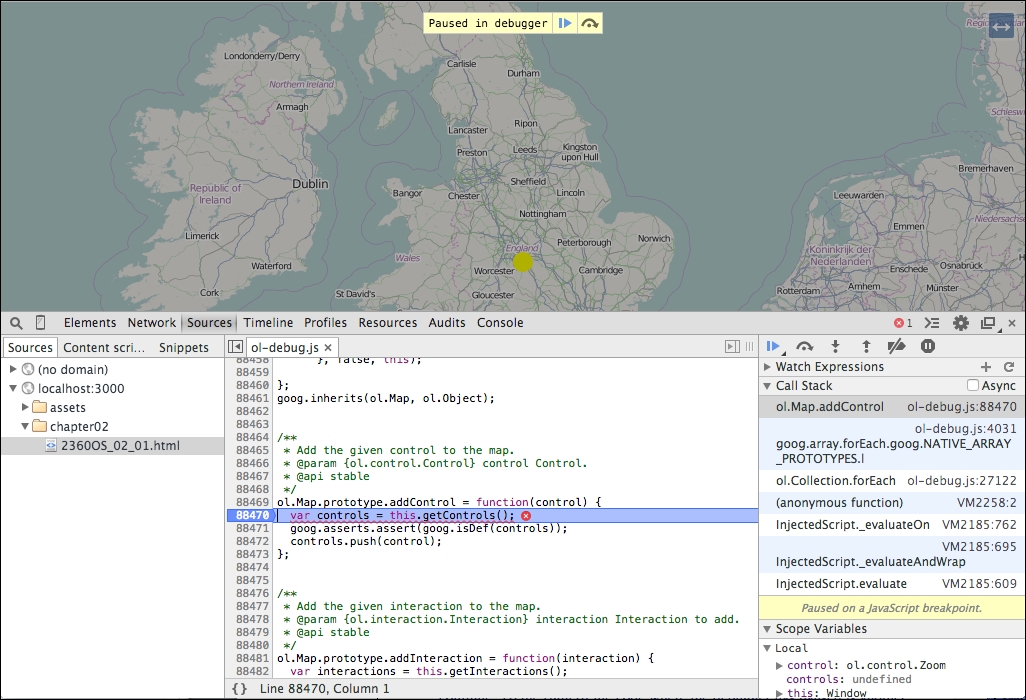
this.getControls(). Move the mouse over the this keyword and the debugger will show us what its value is. Now, we can see that this is the Window object and not a Map class object, which is why the getInteractions method is undefined! We need to provide the correct object, map, as the scope of the forEach function call by passing it as the second argument.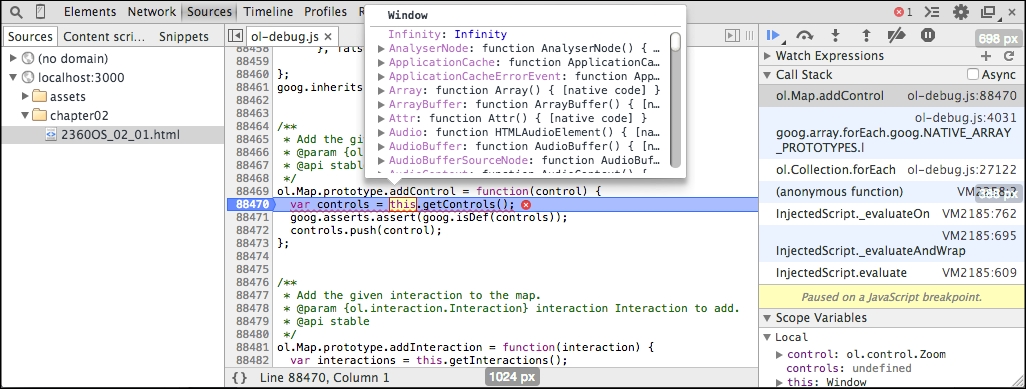
controls.forEach(map.addControl, map);
Much better! Now, we have all our controls back.
We used the Developer tools console to execute some JavaScript and modify our running application to add the default zoom controls that were missing. Along the way, we ran into a problem and switched to the debug build of the OpenLayers library so that we could get more useful information about problems we ran into. We touched briefly on using the powerful Developer tools, including the Console and Sources panels.
There are a great many things we can do with the Developer tools, and this just touches briefly on one aspect of them. Please read Appendix C, Squashing Bugs with Web Debuggers to learn more about using the Developer tools in application development.
In the following sections, we'll look a little more closely at each of the components we've introduced so far, starting with the view class.
Based on the previous example, use the Console to add the default interactions to the running application. You can get the default interactions by calling the ol.interaction.defaults() method.
The OpenLayers view class, ol.View, represents a simple two-dimensional view of the world. It is responsible for determining where, and to some degree how, the user is looking at the world. We'll cover views in more detail at the end of Chapter 3, Charting the Map Class, but briefly, it is responsible for managing the following information:
Although you can create a map without a view, it won't display anything until a view is assigned to it. Every map must have a view in order to display any map data at all. However, a view may be shared between multiple instances of the Map class. This effectively synchronizes the center, resolution, and rotation of each of the maps. In this way, you can create two or more maps in different HTML containers on a web page, even showing different information, and have them look at the same world position. Changing the position of any of the maps (for instance, by dragging one) automatically updates the other maps at the same time! We'll see an example of this in the next chapter.
So, if the view is responsible for managing where the user is looking in the world, which component is responsible for determining what the user sees there? That's the job of layers and overlays.
A layer provides access to a source of geospatial data. There are two basic kinds of layers, that is, raster and vector layers:
Layers are not the only way to display spatial information on the map. The other way is to use an overlay. As we saw in the example earlier in this chapter, we can create instances of ol.Overlay and add them to the map at specific locations. The overlay then positions its content (an HTML element) on the map at the specified location. The HTML element can then be used like any other HTML element.
The most common use of overlays is to display spatially relevant information in a pop-up dialog in response to the mouse moving over, or clicking on a geographic feature.
In the previous example, we added an overlay but we didn't really investigate how it behaves. Let's do something a bit more interesting with overlays to illustrate what they do. In this example, we'll build an OpenLayers application that displays the latitude and longitude of the mouse position in an overlay when you click on the map:
overlay.html in the sandbox directory. Add the standard boilerplate content to get started:<!doctype html>
<html>
<head>
<title>OpenLayers Overlays</title>
<link rel="stylesheet" href="../assets/ol3/css/ol.css" type="text/css" />
<link rel="stylesheet" href="../assets/css/samples.css" type="text/css" />
</head>
<body>
<div id="map" class="map"></div>
<script src="../assets/ol3/js/ol.js"></script>
<script>
</script>
</body>
</html>var layer = new ol.layer.Tile({
source: new ol.source.OSM()
});
var center = ol.proj.transform([-1.812, 52.443], 'EPSG:4326', 'EPSG:3857');
var view = new ol.View({
center: center,
zoom: 6
});
var map = new ol.Map({
target: 'map',
layers: [layer],
view: view
});<div> element. You can change the style of the element if you wish:<div id="overlay" style="background-color: white; border-radius: 10px; border: 1px solid black; padding: 5px 10px;">
Map class:var overlay = new ol.Overlay({
element: document.getElementById('overlay'),
positioning: 'bottom-center'
});map.on('click', function(event) {
var coord = event.coordinate;
var degrees = ol.proj.transform(coord, 'EPSG:3857', 'EPSG:4326')
var hdms = ol.coordinate.toStringHDMS(degrees);
var element = overlay.getElement();
element.innerHTML = hdms;
overlay.setPosition(coord);
map.addOverlay(overlay);
});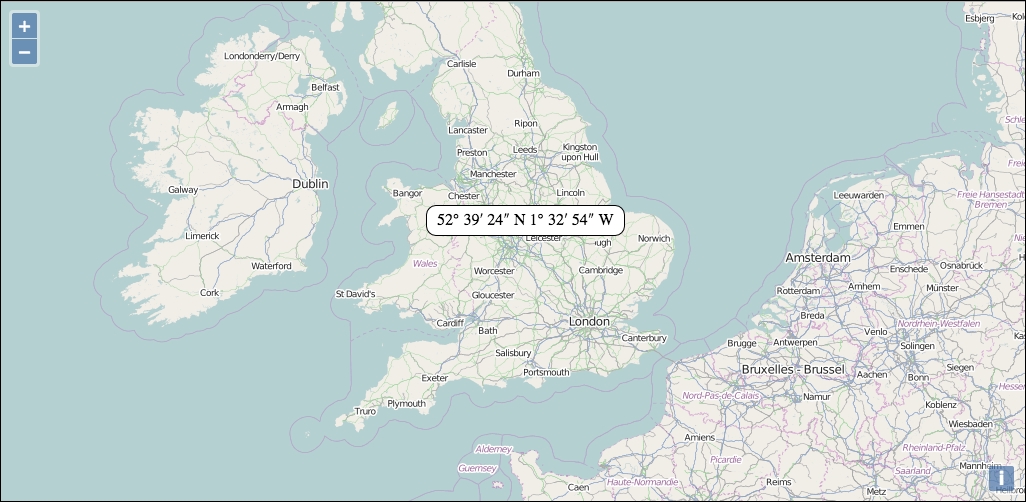
In this example, we illustrated how an overlay is positioned at a geographic location on the map, how it moves with the map to stay at that same location, and how it can be used to display information about some location.
After setting up the boilerplate HTML structure for the page, we added a raster layer with the OpenStreetMap data, a view, and a map to the application. We then created an overlay object pointing at an HTML element for content and with the positioning set to 'bottom-center', which tells OpenLayers to align the bottom, center of the HTML element with the geographic position of the overlay. This means that the overlay will appear above the location, centered on it.
The last step was to register an event handler (more on events later in this chapter) for the map's click event. When the user clicks on the map, the event handler function is called with an event object that contains coordinate (the geographic position) of the click on the map. We transform the coordinate from the map's projection into decimal degrees (longitude and latitude values) and use a helper function in the OpenLayers library to format this into degrees minutes and seconds (a standard way of representing geographic location in human readable form). We then update the content of our overlay's HTML element with this information, set the position of the overlay to the coordinate provided with the event, and add it to the map using the addOverlay method.
If some of this seems overwhelming, don't worry, we'll be covering all of this in later chapters.
As mentioned earlier, the two components that allow users to interact with the map are interactions and controls. Let's look at them in a bit more detail.
Interactions are components that allow the user to interact with the map via some direct input, usually by using the mouse (or a finger with a touch screen). Interactions have no visible user interface. The default set of interactions are:
ol.interaction.DoubleClickZoom: If you double-click the left mouse button, the map will zoom in by a factor of 2ol.interaction.DragPan: If you drag the map, it will pan as you move the mouseol.interaction.PinchRotate: On touch-enabled devices, placing two fingers on the device and rotating them in a circular motion will rotate the mapol.interaction.PinchZoom: On touch-enabled devices, placing two fingers on the device and pinching them together or spreading them apart will zoom the map out and in respectivelyol.interaction.KeyboardPan: You can use the arrow keys to pan the map in the direction of the arrowsol.interaction.KeyboardZoom: You can use the + and – keys to zoom in and outol.interaction.MouseWheelZoom: You can use the scroll wheel on a mouse to zoom the map in and outol.interaction.DragZoom: If you hold the Shift key while dragging on map, a rectangular region will be drawn and when you release the mouse button, you will zoom into that area.We will discuss interactions in detail in Chapter 8, Interacting with Your Map.
Controls are components that allow the user to modify the map state via some visible user interface element, such as a button. In the examples we've seen so far, we've seen zoom buttons in the top-left corner of the map and an attribution control in the bottom-right corner of the map. In fact, the default controls are:
ol.control.Zoom: This displays the zoom buttons in the top-left corner.ol.control.Rotate: This is a button to reset rotation to 0; by default, this is only displayed when the map's rotation is not 0.ol.control.Attribution: This displays attribution text for the layers currently visible in the map. By default, the attributions are collapsed to a single icon in the bottom-right corner and clicking the icon will show the attributions.We will discuss these controls and more in detail in Chapter 9, Taking Control of Controls.
This concludes our brief overview of the central components of an OpenLayers application. We saw that the Map class is at the center of everything and there are some key components—the view, layers, overlays, interactions, and controls—that it uses to accomplish its job of putting an interactive map onto a web page. At the beginning of this chapter, we talked about both relationships and inheritance. So far, we've only covered the relationships. In the next section, we'll show the inheritance architecture of the key components and introduce three classes that have been working behind the scenes to make everything work.
In this section, we will look at three classes in the OpenLayers library that we won't often work directly with, but which provide an enormous amount of functionality to most of the other classes in the library. The first two classes, Observable and Object, are at the base of the inheritance tree for OpenLayers—the so-called super classes that most classes inherit from. The third class, Collection, isn't actually a super class but is used as the basis for many relationships between classes in OpenLayers—we've already seen that the Map class relationships with layers, overlays, interactions, and controls are managed by instances of the Collection class.
Before we jump into the details, take a look at the inheritance diagram for the components we've already discussed:
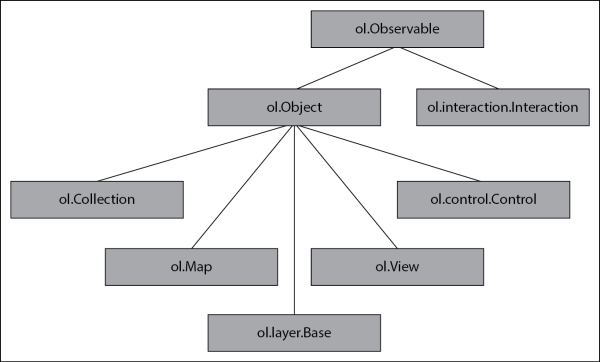
As you can see, the Observable class, ol.Observable, is the base class for every component of OpenLayers that we've seen so far. In fact, there are very few classes in the OpenLayers library that do not inherit from the Observable class or one of its subclasses. Similarly, the Object class, ol.Object, is the base class for many classes in the library and itself is a subclass of Observable. Because the functionality contained in these two classes is so fundamental to the understanding of how OpenLayers works, we'll be relying on them for the rest of the book.
The Observable and Object classes aren't very glamorous. You can't see them in action and they don't do anything very exciting from a user's perspective. What they do though is provide two common sets of behaviour that you can expect to be able to use on almost every object you create or access through the OpenLayers library—Event management and Key-Value Observing (KVO).
An event is basically what it sounds like—something happening. Events are a fundamental part of how various components of OpenLayers—the map, layers, controls, and pretty much everything else—communicate with each other. It is often important to know when something has happened and to react to it. One type of event that is very useful is a user-generated event, such as a mouse click or touches on a mobile device's screen. We used this earlier in the chapter to display an overlay at the location of a mouse click. Knowing when the user has clicked and dragged on the Map class allows some code to react to this and move the map to simulate panning it. Other types of events are internal, such as the map being moved or data finishing loading. To continue the previous example, once the map has moved to simulate panning, another event is issued by OpenLayers to say that the map has finished moving so that other parts of OpenLayers can react by updating the user interface with the center coordinates or by loading more data.
Classes inheriting from ol.Observable (including ol.Object) get the following event related methods:
It is very important to pass the exact same listener and scope values to un() as were passed to on(). A common practice is to pass anonymous functions as arguments to functions such as on(), which takes function arguments. Because un() needs the exact same listener argument to work correctly, we can't use anonymous functions if we want to call un() later. However, we can store the key returned by on() and use it with unByKey(). Let's look at some code examples:
var map = new ol.Map({
target: 'map',
view: view
});This creates a Map class object, nothing new here.
map.on( 'moveend', function() {
console.log('move end event!');
});Next, we will register for the moveend
event. The moveend event is triggered by the map after it has been panned or zoomed. The function we provide will be called every time the map moves. Our code will output some text to the debug console. Because we used an inline or anonymous function, we have no way to remove our function if we no longer want to receive events. Or do we?
var key = map.on('moveend', function() {
console.log('move end event!');
});
map.unByKey(key);This code registers for the same moveend event using an anonymous function but this time we will assign the return value to key. We can then use the value assigned to key to unregister our handler.
Let's look at another way:
function onMoveEnd(event) {
console.log('moveend event 2');
}
map.on('moveend', onMoveEnd);
map.un('moveend', onMoveEnd);This block declares a function called onMoveEnd() and registers it for the moveend event. The last line unregisters it. This achieves exactly the same result as the previous code; so, what's the difference? It is mostly to accommodate different coding styles and patterns. Some people prefer to write their code a certain way, or perhaps they have to follow a particular coding style guide (see Appendix B, More details on Closure Tools and Code Optimization Techniques for more information on this), and OpenLayers provides various ways to make it easier.
What about the scope parameter? This is useful for code that is written in an Object oriented style. Here is a contrived example that illustrates how it will be used:
var MyClass = function(label) {
this.label = label;
this.onMoveEnd = function() {
console.log( this.label + ': moveend event');
}
}
var obj1 = new MyClass('Object 1');
var obj2 = new MyClass('Object 2');A simple class called MyClass is defined, which contains a single attribute, label, and a single method, onMoveEnd(). Next, two instances of this class are created with different label values. We can use the onMoveEnd() method of our instances as a function in the second parameter of the on() method. When the onMoveEnd() method is called, it will log a message to the debug console containing the value of the label attribute. Here are some examples of how this can be used:
map.on('moveend', obj1.onMoveEnd);Registering the onMoveEnd() method for the moveend event will work, but the output will be as follows:
Undefined: zoomend event
What's wrong? It turns out that this.label is not defined because the value of this is the global window object. We can correct this by passing a scope object as the third parameter to the on() function:
map.on('moveend', obj1.onMoveEnd, obj1);
map.on('moveend', obj2.onMoveEnd, obj2);Now, the output will be what we expected:
Object 1: moveend event Object 2: moveend event
We then need to use the scope to unregister for the events as follows:
map.un('moveend', obj1.onMoveEnd, obj1);
map.un('moveend', obj2.onMoveEnd, obj2);OpenLayers' Object class inherits from Observable and implements a software pattern called Key-Value Observing (KVO). With KVO, an object representing some data maintains a list of other objects that wish to observe it. When the data value changes, the observers are notified automatically.
The following methods are available in all OpenLayers classes, which inherit from ol.Object. Note that the Object class also contains all the methods provided by the Observable class even though they are not listed here:
The bindTo method is extremely powerful and makes many seemingly advanced tasks quite easy to accomplish. Let's set up an HTML checkbox element that we can use to control the visibility of a map layer.
<div id="map"> and the <script> tag:<input type="checkbox" id="visible" checked> Toggle Layer Visibility
This will add a new HTML element, a checkbox, to our web page and we will use this to turn our layer on and off.
var visible = new ol.dom.Input(document.getElementById('visible'));
visible.bindTo('checked', layer, 'visible');This code creates a new instance of ol.dom.Input, an OpenLayers helper class that connects to our checkbox element. It then uses the bindTo() method to observe changes in the checked attribute and send them to the layer, specifically to the visible property.
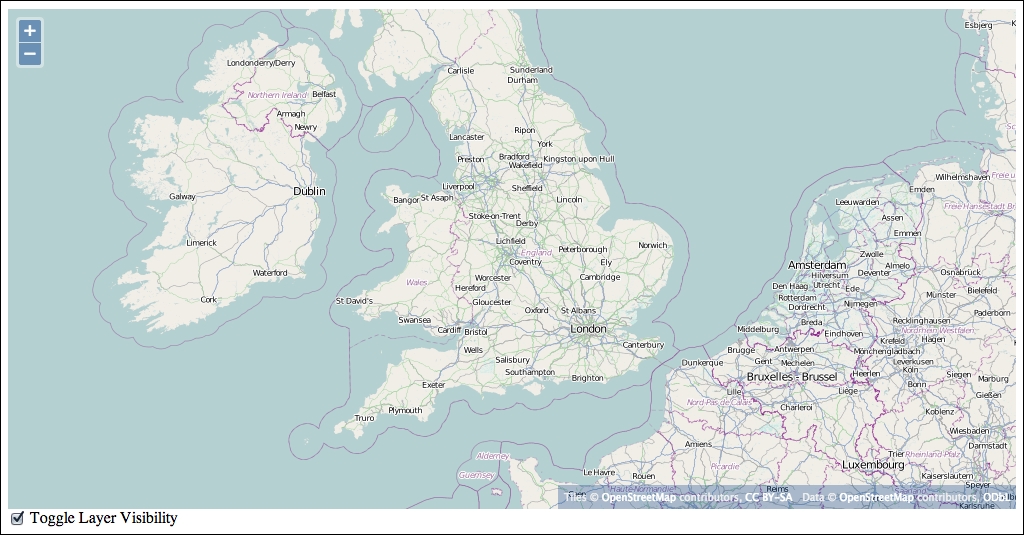
You successfully used the bindTo() method to establish the layer as an observer of the checkbox using the ol.dom.Input helper class. We bound the visible property of our layer to the checked property of the ol.dom.Input. When the checkbox is clicked, ol.dom.Input updates the checked property and notifies observers of the checked property that it has changed. Because we bound the visible property of the layer to the checked property of the input, the layer is notified of the change and updates the visible property, which causes the layer to turn on and off.
Property binding works both ways. You can manually change the visibility of the layer using the Console in Web Inspector. Try the following and observe what happens to the checkbox:
layer.setVisible(false); layer.setVisible(true);
You should see the checkbox change state as if you had clicked it.
Sometimes, the property value that you are sharing between two objects is not exactly what you need. For instance, you might want to synchronize two maps so that they are looking at the same center point, but at different resolutions. If we share a view between the maps, we can't have one of them at a different resolution. We could use two views and use events to manually synchronize them—and this is a perfectly valid approach—but wouldn't it be nice if we could use bindTo and just modify the resolution value a little bit? This is exactly what the object returned from bindTo allows us to do. The return value from bindTo is an object with a single function, transform, that you can invoke with two functions as arguments. The first function is used to transform the value going from the source to the target and the second is used to transform the value going to the source from the target. For instance:
var transformer = view1.bindTo(resolution', view2);
var from = function(value) {
return value * 2;
};
var to = function(value) {
return value / 2;
};
transformer.transform(from, to);This example binds the resolution property of view2 (the target) to the resolution property of view1 (the source). We can capture the return value in the variable transformer, create two functions that will transform the resolution value, and call the transformer variable's transform function with our two functions. The result is that view2 parameter's resolution property will be bound to view1 parameter's property but will always have a value twice that of view1.
Most classes in the OpenLayers library have one or more KVO properties (these are specified in the library documentation) and have some special features. As we saw, the name of the property can be used as the key parameter in any of the KVO methods described earlier. Additionally, three events are triggered when the value of a property changes.
The first event is beforepropertychange and is triggered before a property will change. It provides the name of the property that will change to the listener:
layer.on('beforepropertychange', function(event) {
console.log('layer changed in some way');
// event.type == 'beforepropertychange'
// event.key == '<the key that is changing>'
});The second event is propertychange is triggered as (effectively after) the property is changed:
layer.on('propertychange', function(event) {
console.log('layer changed in some way');
// event.type == 'propertychange'
// event.key == '<the key that has changed>'
});A third event is a change event specific to the property that changed. The name of the event is derived from the property name with the prefix change:. This means that we can be notified of changes to individual properties. In our previous example of binding a layer's visibility to a checkbox, we can register to be notified of the change like this:
layer.on('change:visible', function(event) {
console.log('layer visibility changed');
// event.type == 'change:visible'
// event.target == layer
});It may seem like there are a lot of events that happen in response to a KVO property changing and you are right, there are! Each event, though, is slightly different and provides both convenient and optimal ways of responding to changes that happen to objects in OpenLayers.
In addition to events, KVO properties also have special accessor functions called setters and getters defined for them. This means that instead of using the KVO methods get(key) and set(key, value), you can use get<Property>() and set<Property>(value), where <Property> is the capitalized property name. For instance:
layer.get('visible');
layer.getVisible();
layer.set('visible', true);
layer.setVisible(true);These methods are primarily for convenience and you can use either depending on your own preferences.
The last section for this chapter is about the OpenLayers' Collection class, ol.Collection. As mentioned, the Collection class is not a super class like Observable and Object, but it is an integral part of the relationship model. Many classes in OpenLayers make use of the Collection class to manage one-to-many relationships.
At its core, the Collection class is a JavaScript array with additional convenience methods. It also inherits directly from the Object class and inherits the functionality of both Observable and Object. This makes the Collection class extremely powerful and we will use it many times in the rest of this book.
A collection is created just like any other class, just use the new operator:
var collection = new ol.Collection();
The Collection constructor takes one optional argument, an array that is used to initially populate the collection with elements. The elements in the array can be of any type, but if you are using the collection with one of the OpenLayers API methods, the type of the values will typically be specified in the API documentation. For instance, the Map class constructor allows passing a collection of layers, interactions, controls, and overlays. In these cases, the contents of the collection must be instances of the correct type of an object. For instance, check the following code snippet:
var layer1 = new ol.layer.Tile({/*options */);
var layer2 = new ol.layer.Vector({/* options */});
var layerCollection = new ol.Collection([layer1, layer2]);
var map = new ol.Map({
layers: layerCollection
});A Collection class, inherited from the Object class, has one observable property, length. When a collection changes (elements are added or removed), its length property is updated. This means it also emits an event, change:length, when the length property is changed.
A Collection class also inherits the functionality of the Observable class (via Object class) and emits two other events—add and remove. Registered event handler functions of both events will receive a single argument, a CollectionEvent, that has an element property with the element that was added or removed.
The Collection class has the following methods (the ones from Object and Observable classes are not included in this list, but those methods are also available):
This wraps up our overview of the key concepts in the OpenLayers library. We took a quick look at the key components of the library from two different aspects—relationships and inheritance. With the Map class as the central object of any OpenLayers application, we looked at its main relationships to other classes including views, layers, overlays, interactions, and controls. We briefly introduced each of these classes to give an overview of primary purpose. We then investigated inheritance related to these objects and reviewed the super classes that provide functionality to most classes in the OpenLayers library—the Observable and Object classes. The Observable class provides a basic event mechanism and the Object class adds observable properties with a powerful binding feature. Lastly, we looked at the Collection class. Although this isn't part of the inheritance structure, it is crucial to know how one-to-many relationships work throughout the library (including the Map class relationships with layers, overlays, interactions, and controls).
In the next chapter, we'll dig into the Map and View class in much more detail.
The Map class is, as you have probably realized by now, the core piece behind your map. The map object(s) you create is the most important thing behind your map, as without a map object you can't do anything with layers or controls. In this chapter, we'll talk about the Map class, which we've been taking for granted so far.
We will also introduce the concept of a view, which is used to change what we see in a map, and several core concepts you'll need to understand the rest of this book.
We used the Map and View classes so far in this book, without really understanding what's going on. This chapter aims to not only explain how and why we've been doing things, but will also provide thorough coverage of two core classes—the Map and View classes. Specifically, we'll look at:
Map class isMap class relates to the other classes we've discussedMap classView class to change the location displayed by the mapThe OpenLayers' Map class is the core component of OpenLayers. We use it to manage the layers, controls, interactions, and overlays. We've worked with it already by creating a map object, adding layers to it, then using its view to modify its extent. We are yet to discuss the functionality behind the Map class, the core component of our applications.
In OpenLayers, everything belongs to the Map class. The Layer, Control, and Interaction classes must be hooked up to a map if we want them to do anything. So, we need a map object to actually create a useful map—and as you might imagine, we'll see later in this chapter that it is possible to make an application that uses multiple map objects.
Let's walk through creating a simple map from the beginning. Create a new file in your text editor to get started. To make it easy, save this file in the sandbox
folder. Remember that all the samples are set up to use the version of OpenLayers we've provided in the assets folder:
<!doctype html>
<html>
<head>
<title> Map Examples </title>
<link rel="stylesheet" href="../assets/ol3/ol.css" type="text/css" />
<link rel="stylesheet" href="../assets/css/samples.css" type="text/css" />
</head>
<body>
<div id="map" class="map"></div>
<script src="../assets/ol3/ol.js">
</script>We are just setting up a standard HTML 5 web page and including our stylesheets and the OpenLayers library.
<script> block with the following code: <script>
var layer = new ol.layer.Tile({
  source: new ol.source.OSM()
});
var london = ol.proj.transform([-0.12755, 51.507222],
'EPSG:4326', 'EPSG:3857');
var view = new ol.View({
center: london,
zoom: 6,
});
var map = new ol.Map({
target: 'map',
layers: [layer],
view: view
});
</script>This code should look familiar to the ones used in the previous chapters, and you'll be seeing it (with minor variations) quite a bit through the rest of this book. We create a layer that will show OSM tiles, use london as our starting point for the view and create an instance of ol.Map in our map div.
</body> </html>
map.html and open it in your web browser, you should see a familiar sight, as shown here: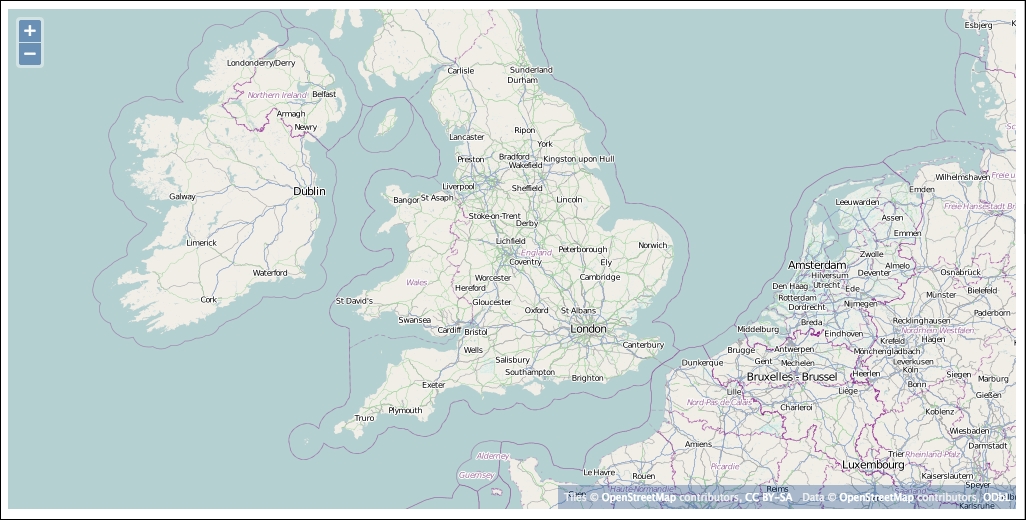
Let's look a little closer at how we create our map object in this block of code:
var map = new ol.Map({
target: 'map',
layers: [layer],
view: view
});We use the new operator to create an instance of the ol.Map class and pass it an object literal containing several options, namely, target, view, and layers. We've used these before in the previous examples without really explaining them or any of the other options we might want to use. Here's the full list of available options and what they do:
|
Name |
Type |
Description |
|---|---|---|
|
|
|
Controls are covered in detail in Chapter 7, Wrapping Our Heads Around Projections; so, we don't need to go in-depth here. We can define our map's controls when we create the map object by specifying them with this option, or we can add them via the |
|
|
|
The
|
|
|
|
Interactions are used by the map to handle browser events, such as the user clicking or dragging on the map. The map passes browser events to each of its interactions in sequence, allowing each to determine whether it should take action and whether it should consume (stop further processing of) the event. The order of interactions is important—if an interaction consumes a browser event, subsequent interactions will not see the event. Interactions are closely related to controls and are discussed in more detail in Chapter 8, Interacting with Your Map with controls. The default interactions, if this option is not provided, are |
|
|
|
This option indicates which HTML element will be used to receive keyboard events for interactions that use them (such as |
|
|
|
The |
|
|
|
This controls the display of the ol3 logo in the map, |
|
|
|
The overlays option defines which overlays will be added to the map initially. We will review them thoroughly in Chapter 8, Interacting with Your Map. |
|
|
|
The number of physical pixels per screen pixel, normally computed automatically. |
|
|
|
The
We'll discuss what these actually mean a little further on in this chapter. |
|
|
|
The target identifies the HTML element in which the map will be drawn on the web page. In all our examples, we pass a string value that matches the |
|
|
|
The |
By default, OpenLayers draws, or renders, the map in the browser using an HTML 5 canvas element and its associated 2D drawing context. This is known as the Canvas renderer. However, OpenLayers actually comes with three renderers. The ability to choose a different renderer for the map can be very powerful but it should also be used with care. Each renderer has some specific capabilities and limitations. In particular, only the Canvas renderer is considered stable at the time of writing this book.
The Canvas renderer draws the map's contents onto an HTML 5 canvas element (http://en.wikipedia.org/wiki/Canvas_element). The canvas element is a high-performance 2D drawing surface supported by all modern web browsers (on Internet Explorer, Canvas support starts with version 9). The canvas renderer is the most fully supported renderer in OpenLayers. It does not support some of the advanced features of the WebGL renderer, including 3D, controlling the contrast, brightness, hue and saturation of a layer, and other advanced capabilities requiring the power of WebGL.
You will most likely want to use this renderer until WebGL is more broadly supported, unless you are building an application that can target browsers that specifically support WebGL.
WebGL (http://en.wikipedia.org/wiki/WebGL) is a powerful technology that gives the web browser access to hardware-accelerated 2D and 3D graphics rendering, normally available only to desktop software, typically games. With this renderer, OpenLayers will be able to efficiently render a lot of vector and raster data simultaneously. At the time of this writing, rendering of vector data with WebGL was still in development and not yet available.
It even provides the ability to render data in 3D and give full 3D navigation. Given how fantastic all this sounds, why wouldn't you use it all the time? Unfortunately, WebGL support in a browser is dependent on two things. First, the user's computer must have a graphics card and software drivers that are capable of supporting it. Second, the web browser itself must support it. Since WebGL is a relatively new specification, only the newest versions of Google Chrome, Safari, and Firefox will enable WebGL on systems with capable hardware. Internet Explorer up to version 10 does not provide WebGL support at all, although there are third-party plugins that can be added by users to provide it. Finally, mobile browser support is very limited and varies widely at this time.
In summary, the WebGL renderer can give your application amazing performance and some cutting edge capabilities if your intended users can be relied on to have the latest web browser versions and capable hardware. It isn't suitable if you need to support older web browsers, Internet Explorer, or mobile users.
The DOM renderer draws the map's contents using HTML elements (<img> and <div> tags) and uses CSS to position them. This renderer is supported by older versions of most browsers, including Internet Explorer 8. However, it does not provide many of the capabilities enjoyed by the Canvas renderer. Of the features that it does not support, the most important is vector support covered in Chapter 6, Styling Vector Layers. The DOM renderer will also generally exhibit poorer performance.
There is some effort being undertaken by community members to provide some vector capabilities for the DOM renderer, including support for Internet Explorer 8, but in general, you will probably not want to use the DOM renderer unless you need to support older browsers that do not provide Canvas support.
Let's modify our example and add a renderer option to see what happens:
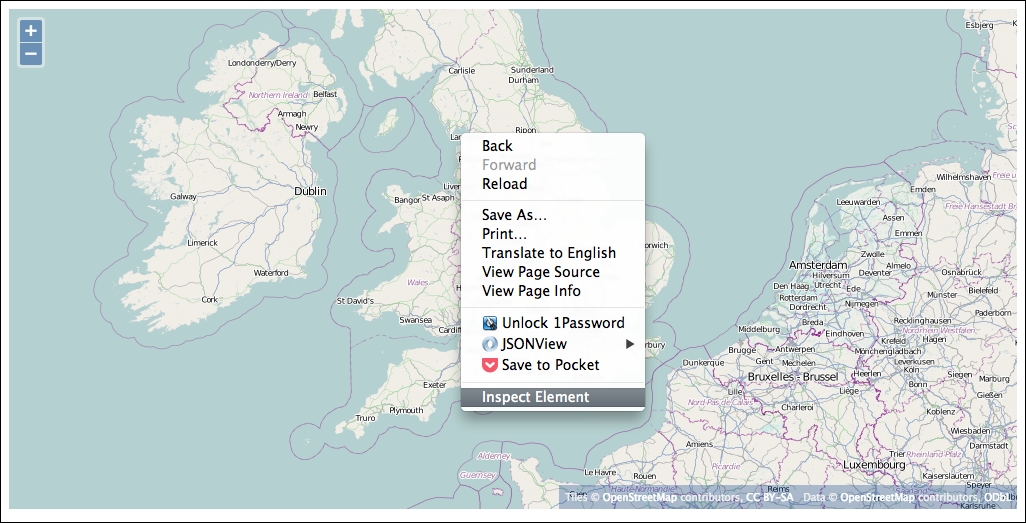
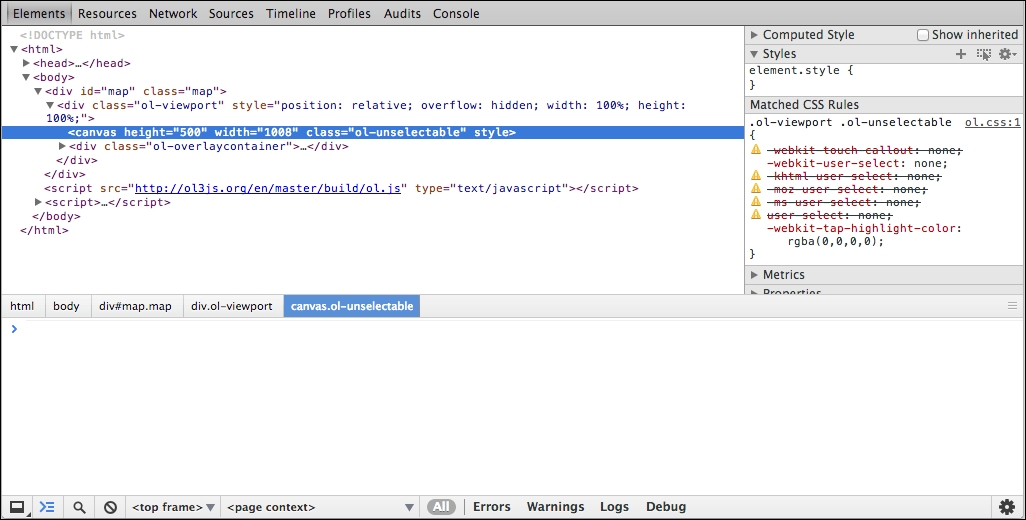
The inspector is highlighting the HTML element used to render the map. In this case, that element is the <canvas> element. This element is used for both the WebGL and Canvas renderers. Let's see what happens when we change the renderer.
var map = new ol.Map({
target: 'map',
view: view,
layers: [layer],
renderer: 'dom'
});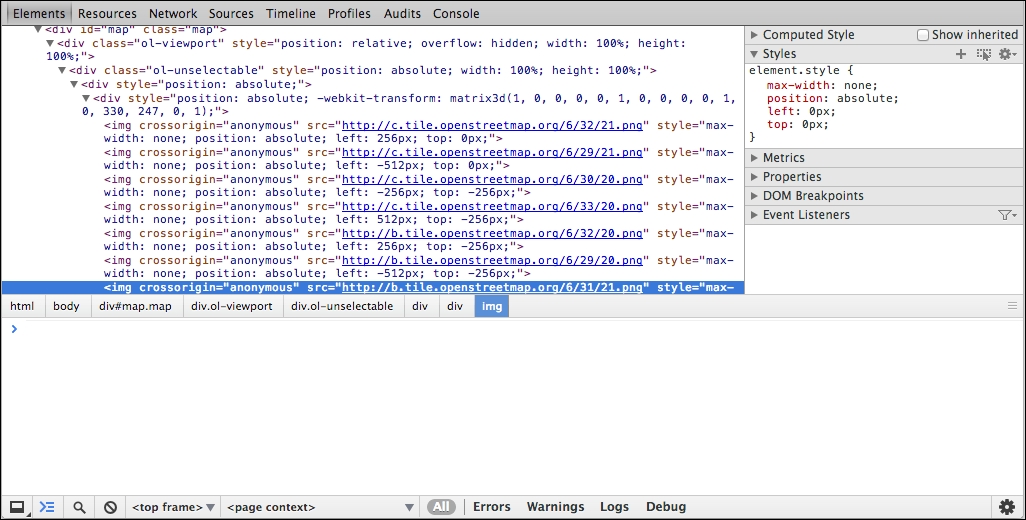
Now, we see a lot of <img> elements. By choosing the DOM renderer, we have asked OpenLayers to use a different way of presenting the map in the browser. OpenLayers now creates a new <img> element for each map tile coming from the remote server and positions it next to the others to create the complete map.
In Chapter 2, Key Concepts in OpenLayers, we introduced the concept of observable, or KVO, properties and how they can be used. Here are the KVO properties of the Map class:
All properties on the Map class, and all other classes in OpenLayers that inherit from ol.Object, can be used with the KVO methods described previously.
In this example, we'll use the target property to move the map around in our web page:
<div> tag for the map and a <button> tag after the <input> element we added for the bindTo() example. Change the class of both <div> tags to half-map—this class tells the <div> tag to only take up to 50 percent of the width of the page. When the user clicks the button, we'll move the map between the two <div> tags:<div id="map" class="half-map"></div> <div id="map2" class="half-map"></div> <input type="checkbox" id="visible" checked> Toggle Layer Visibility <button onclick="changeTarget();">Change Target</button>
<script> element that contains our new code, right after the code we added in the bindTo() example. The function will first call map.getTarget() to get the ID of the element that the map is currently in. If the ID is map, then we set the target to map2; otherwise, we set it to map:function changeTarget() {
var target = map.getTarget();
if (target == 'map') {
map.setTarget('map2');
} else {
map.setTarget('map');
}
}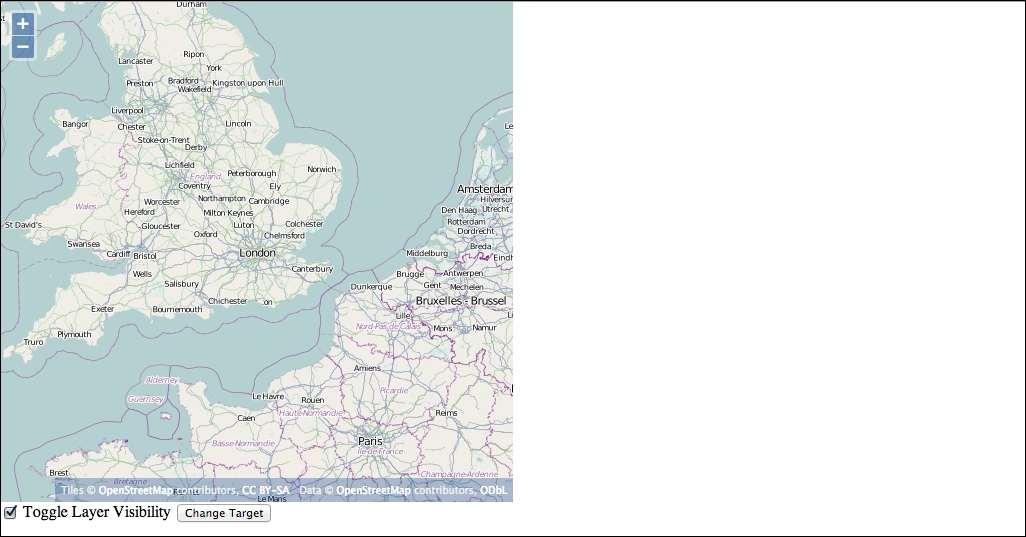
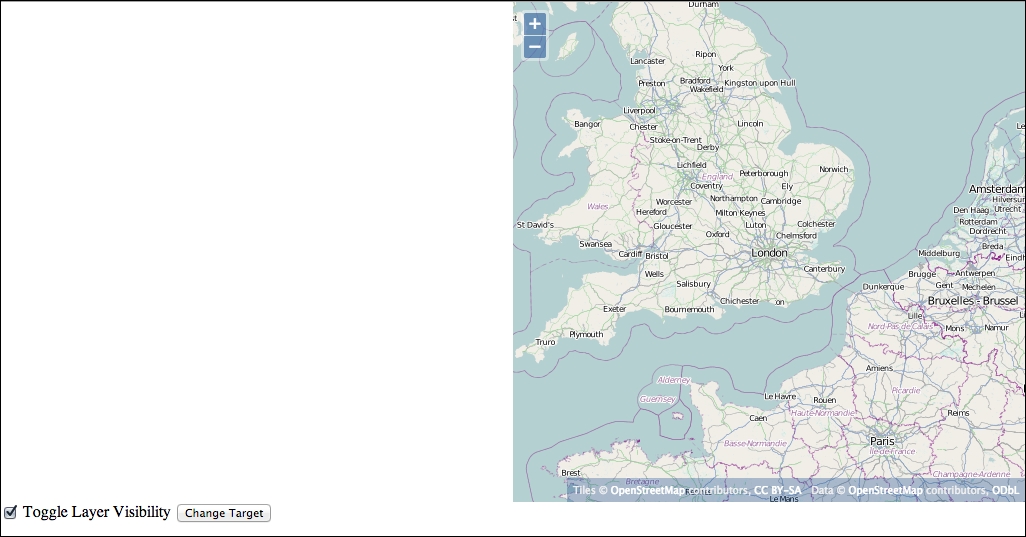
When you click the button, the changeTarget() function is called. This function uses getTarget() to find out which element the map is rendered in and setTarget() to move it to the other map element.
Moving the map between two HTML elements is really a contrived example to illustrate how the methods work. A more likely use of these methods might be to show and hide the map entirely. Try changing the above example to show and hide the map, rather than moving it. Also, try using get() and set() instead of getTarget() and setTarget() methods.
The Map class, being the central organizing point for OpenLayers, provides methods for managing many aspects of the map. As there are quite a few methods, we've grouped them into some logical groups—Control methods, Interaction methods, Layer methods, Overlay methods, Rendering methods, Conversion methods, and other methods.
These methods are used to manage Controls associated with a map. Controls are covered in more detail in Chapter 9, Taking Control of Controls; so, we won't go into any detail here:
These methods are used to manage interactions associated with a map. Interactions are covered in more detail in Chapter 8, Interacting with Your Map; so, we won't go into any detail here:
The methods are used to manage layers in the map. Layers can also be managed through the layergroup property but these methods are a bit easier to use:
These methods are used to manage overlays associated with a map. Overlays are covered in more detail in Chapter 8, Interacting with Your Map; so, we won't go into any detail here:
When we programmatically change the map's view (which we'll discuss at the end of this chapter), the state of the map changes and a redraw of the map is scheduled. This means that if we change the center of the view from London to New York, the map will re-center on New York and fetch tiles for that area and the screen will be updated almost instantly. This behavior can produce a jarring effect for the user. Fortunately, the Map class provides some ways to modify how the map will change state by using the beforeRender() method and how the map will appear using the render() and renderSync() methods.
The primary use of the beforeRender() method is to add animation effects to our map's navigation. After we add a function using beforeRender(), the map will call the function and allow it to update the state of the map. This function can be used to smoothly animate any of the view's state including location, level of detail, and rotation.
While the creation of animation functions is beyond the scope of this book, their use is straightforward, and OpenLayers provides some useful ways for creating animation functions for most common scenarios. Let's indulge ourselves in a bit of fun by exploring how to create and use them.
All the following methods take a single options argument with three common parameters: start, duration, and easing.
start: This is a number, the time in milliseconds to start the animation at. If not provided, the default is to start immediately. You can use the JavaScript Date object to get the current time in milliseconds, such as var start = (new Date()).getTime();. To specify a start time in the future, just add a number of milliseconds to this number; for instance, to start an effect one second from now, use var start = (new Date()).getTime() + 1000;.duration: This is a number, the duration of the animation in milliseconds, the default is 1000 (1 second).easing: This function is an easing function. An easing function is a function that computes a smooth transition for an animation. The default is ol.easing.inAndOut, which provides a smooth acceleration into and out of an animated transition. These are the built-in easing functions:ol.easing.bounce: This adds a bounce effect to the end of a transitionol.easing.easeIn: This smoothly accelerates the start of the transitionol.easing.easeOut: This smoothly decelerates the end of the transitionol.easing.inAndOut: This smoothly accelerates the start and decelerates the end of the transitionol.easing.elastic: This is similar to the bounce effectol.easing.upAndDown: This applies the transition, and then, reverses itIn addition to the three common options, each animation function has at least one additional property you can provide. Here are the functions with a note on the additional properties that can be passed. We'll try out these functions afterwards:
As you might guess, some of the built-in controls such as the zoom controls use these animation functions to create nice effects.
The best way to understand these animation functions is to try them out. Start from the previous example:
<button onclick="doBounce(london);">Bounce To London</button> <button onclick="doBounce(rome);">Bounce To Rome</button <button onclick="doPan(london);">Pan To London</button> <button onclick="doPan(rome);">Pan To Rome</button> <button onclick="doRotate();">Rotate</button> <button onclick="doZoom(2);">Zoom Out</button> <button onclick="doZoom(0.5);">Zoom In</button>
These are regular HTML buttons that call a function when clicked. We'll add the functions in a moment.
Rome, next to the line where we defined the location of London:var rome = ol.proj.transform([12.5, 41.9], 'EPSG:4326', 'EPSG:3857');
<script> tag to handle the button clicks. Start with the doBounce() function:function doBounce(location) {
var bounce = ol.animation.bounce({
resolution: map.getView().getResolution() * 2
});
var pan = ol.animation.pan({
source: map.getView().getCenter()
});
map.beforeRender(bounce);
map.beforeRender(pan);
map.getView().setCenter(location);
}doPan() function:function doPan(location) {
var pan = ol.animation.pan({
source: map.getView().getCenter()
});
map.beforeRender(pan);
map.getView().setCenter(location);
}doRotate() function:function doRotate() {
var rotate = ol.animation.rotate({
rotation : Math.PI * 2
});
map.beforeRender(rotate);
}doZoom() function:function doZoom(factor) {
var resolution = map.getView().getResolution();
var zoom = ol.animation.zoom({
resolution: resolution
});
map.beforeRender(zoom);
map.getView().setResolution(resolution * factor);
}London and Rome.Not too bad! In a few lines of code, we managed to create some pretty impressive animation effects using ol.animation functions and the Map's beforeRender() method.
In step 3, we created the doBounce() function. This function takes a single parameter, location, which is the location that we want to bounce to. The effect we want to achieve is to smoothly zoom out from our current location and then into the new location. We called ol.animation.bounce() to create a function that implements the bounce animation effect. For this example, we provided only the resolution property and let the other properties (start, duration, and easing) take their default values. We set the resolution property to two times the current resolution of the map's view. This is equivalent to clicking the ZoomOut control (the button in the top-left corner of the map with the minus sign) once. What this does is smoothly zoom out from the current resolution to the next zoom level, and then back into the current resolution.
Next, we created a function that implements the pan animation effect. Again, we used the defaults for start, duration, and easing by not specifying them and set the source property to the current center of the map's view. We added both bounce and pan functions to the map by calling beforeRender(); then, we changed the map's view to go to the location we passed into this function.
In step 4, the doPan() function takes a single parameter, location, and smoothly pans the map to it. To do this, we called ol.animation.pan() with the map's current center for the source as we did in the doBounce() function, then we told the map's view to go to the new location.
In step 5, the doRotate() function doesn't take any parameters; we just wanted to spin the map 360 degrees. We used the ol.animation.rotate() function for this and set the rotation option to specify how much to rotate. When we add this to the map using beforeRender(), the effect happens immediately.
In OpenLayers, rotation is always specified in radians. When we think about rotation, we normally think in degrees. To convert from degrees to radians, it is useful to remember that 180 degrees = PI * radians. We don't need to know the value of PI, JavaScript provides us with the useful constant, Math.PI. The formula to convert degrees to radians is var radians = degrees * Math.PI / 180;. The inverse is var degrees = radians * 180 / Math.PI;. In our example, we wanted to rotate the map 360 degrees. Using the formula above, this becomes 2 * Math.PI, which is the value we used.
Step 6 adds the doZoom() function. It takes a single parameter, factor, which is the amount to zoom. We used ol.animation.zoom() to create our animation function using the view's current resolution as our starting point. Then, we added our animation function and told the map's view to zoom to a new resolution by multiplying the current resolution by the factor parameter. A factor of two will cause the map to zoom out to the next zoom level and a factor of 0.5 will cause the map to zoom in to the next zoom level.
Now that we've seen how the basic animations work, try modifying the animation properties in each function to see how to change its parameters and overriding the default duration, start time and easing functions. You can also try combining the animations in different ways.
When we click on a web page, the browser generates a MouseEvent that contains, among other things, the position that the click happened at. This position is in pixels and is relative to the browser window. In an OpenLayers application, we will often want to respond to the user interacting with the map and it is important to understand these events specify the position in pixels. It is common to need to determine the geographic coordinate that corresponds to this position. OpenLayers provides several methods that allow us to convert between the browser's pixel space and geographic coordinates:
The map object contains a few other methods that don't neatly fit into the previous groups; so, we've included them here for completeness:
The standard KVO events beforepropertychange and change are available, as well as one event for each of the observable properties: change:layergroup, change:size, change:target, and change:view. Review the section on KVO in Chapter 2, Key Concepts in OpenLayers if you don't remember how these events work.
In addition to the KVO related events, however, there are quite a few new events that can be triggered from a map object. As with any other event, you can register for these events using the on() and once() methods discussed earlier. We'll group these events into browser events, map events, and render events.
The Browser events are all events that are provided in response to the user interacting with the map's HTML element. The available events are:
click: This event is fired once for every discrete click on the map. If the user double-clicks on the map, this event will be fired twice. If you want to distinguish between a click and a double-click, use the singleclick event instead.dblclick: This event is fired if the user double-clicks the map.pointerdrag: This event is fired when the user moves the mouse while holding down one of the mouse buttons.pointermove: This event is fired when the user moves the mouse.singleclick: This event is fired when the user single-clicks on the map. There is a short 250 ms delay after the click event before this event is triggered to ensure that the user is not double-clicking the map.Listeners attached to the Browser events will receive an object of the ol.MapBrowserEvent type that contains the following properties:
type – This is a string, MapBrowserEvent.map: The ol.Map is a reference to the map object on which the event happened.browserEvent: The DOMEvent is a standard browser event that was originally issued by the browser. This will contain information about the event (its position and what the user did—move, click, and so on) that you'd be usually looking for.frameState: This is an object representing the current frame state of the map.There are two events that are triggered when the map state changes.
Listeners attached to the map events will receive an object of the ol.MapEvent type, which contains the following properties:
There are two events that are triggered when the map is being rendered. These can be used to programmatically alter the appearance of the rendered map image in interesting ways:
precompose: This event is triggered when the map is rendered, just before all the layers will be drawn into the rendering context.postrender: This event is triggered when the map has completed rendering all the layers into the current rendering context. This is a very interesting event as it provides an opportunity to modify the canvas (for Canvas and WebGL renderers) after the map has been rendered. We'll explore this in Chapter 6, Styling Vector Layers when we discuss vector styling.Listeners attached to the render events will receive an object of the ol.render.Event type that contains the following properties:
type: This is a MapEvent stringtarget: The ol.Map is a reference to the map object on which the event happenedvectorContext: This is a rendering API capable of drawing to the contextframeState: This is an object representing the current frame state of the mapcontext: This is the 2D context associated with the canvas (if applicable)glContext: This is a WebGL rendering context (if applicable)The map object is the central component of an OpenLayers web application. It is a central place to add and remove things such as layers and controls, and bind them all together. The remaining chapters in the book will introduce you to these other things, but one of those bits is really very closely tied to the map object, and that is the view object. The view object provides the map with the information it needs to decide what location and level of detail—or zoom level—you are looking at. A view also has a projection (which we discussed in Chapter 2, Key Concepts in OpenLayers) that determines the geospatial reference system of the map.
OpenLayers currently provides a single View class, ol.View. This class represents a simple 2D view, which can be manipulated through three key properties: center, resolution, and rotation. We will create a new instance of ol.View in the same way that we create a map object, like the following:
var view = new ol.View(ViewOptions);
We've used views in all our examples because a view is a mandatory parameter when creating a new map instance, but we haven't discussed it in detail yet. Let's dive in.
The options you can use when creating a new ol.View instance are as follows:
It is important to understand what is meant by the term resolution and how the various view options related to resolution work together.
In the context of OpenLayers, the term resolution means the number of projection units per pixel. A projection determines how the real world, which is a sphere, is represented in 2D space. The definition of a projection includes a number of things, including a 2D coordinate system and an algorithm for converting real-world locations (latitude and longitude) to and from the projection's coordinate system. The projection's coordinate system is defined in a particular set of units, such as meters, feet, or even decimal degrees. The projection's coordinate system has a bounding box defined as values in the projection's unit system. When we say projection units per pixel, we mean a value expressed in the unit system of the projection.
The most zoomed out state of the map will render the bounds of the projection into a 256 x 256 pixel tile. This is considered the maximum resolution and can be calculated as the width of the projection's bounds divided by 256. When the map is at its most zoomed in, the minimum resolution can be calculated as the width of the projection's bounds divided by the number of tiles wide times 256. We yet don't know how many tiles are required to draw the map at the most zoomed in level; so, this has to be known or computed in some way.
The most zoomed out state of the map is, by convention, called ZoomLevel 0. When a user zooms in or out, they change to the next zoom level. Zooming effectively changes the number of tiles used to represent the projection's bounds. The default zoom factor is 2, which means that zooming in to the next zoom level doubles the number of tiles in the map (in each dimension) and halves the resolution. If ZoomLevel 0 is 1 tile (wide and high), then ZoomLevel 1 is 4 tiles (2 wide and 2 high). ZoomLevel 3 is 16 tiles (4 wide and 4 high). In fact, the number of tiles required for the width and height of any zoom level can be easily calculated as numTiles = 2 ^ zoom. Each zoom level has a resolution defined by the projection's bounds divided by the zoom level's width in tiles. For any given zoom level z, the resolution can be computed as resolution = projection width / (2 ^ z). Likewise, the zoom level equivalent to any resolution can be computed by rearranging the algorithm to z = log(projection width / resolution)/log(2).
When a view is configured, it needs to know a maximum and minimum resolution and a zoom factor for determining the resolutions between the maximum and minimum for zooming. The View class provides several options that are used together to determine the resolution constraints. Since zoom level and resolution can be computed from each other, the constraints can be determined in terms of resolution (maxResolution and minResolution), zoom levels (minZoom is equivalent to maxResolution, maxZoom is equivalent to minResolution), or some combination of these. OpenLayers uses the resolution options in preference to the zoom options if both are provided.
In practice, it is usually sufficient to define just the maxZoom or minResolution because minZoom defaults to 0 (the maximum resolution computed from the projection bounds).
As with the Map class, the View class has a number of KVO properties that have accessor methods (get and set), property binding, and events as discussed earlier:
The View class has several methods in addition to its properties:
We'll wrap up this chapter with a final update to our example by adding a second map and linking the two maps together.
<div> tags; it's the HTML that looks like this:<button onclick="changeTarget();">Change Target</button>
changeTarget(), as we won't need it any more.ol.Map and put it into the map2 <div> tag. Note that there is no view option!var map2 = new ol.Map({
target: 'map2',
layers: [layer]
});view property to the other map object:map2.bindTo('view', map);With a single line of code, we bound the view property of the two maps and were able to produce a pretty interesting effect. By itself, this doesn't do much that could be considered useful but it is the basis for building some interesting functionalities such as creating an overview map or a highlight map that shows the same area as a main map but at a different level of detail.
One thing you probably noticed with the previous example is that changes from one map aren't animated in the other one. This behavior is to be expected. If you recall, we mentioned in the animation section that programmatic changes are applied instantly. Since we aren't adding animation effects with beforeRender(), the changes applied from one view to the other happen instantly and the result is sometimes quite jarring.
Use the knowledge you've gained in this chapter to adapt the previous example into something more useful. Try to make the second map respond to changes in the first map, but zoomed out three times. Remember that zooming out once is equivalent to doubling the zoom level. When the page loads, it should look like this:
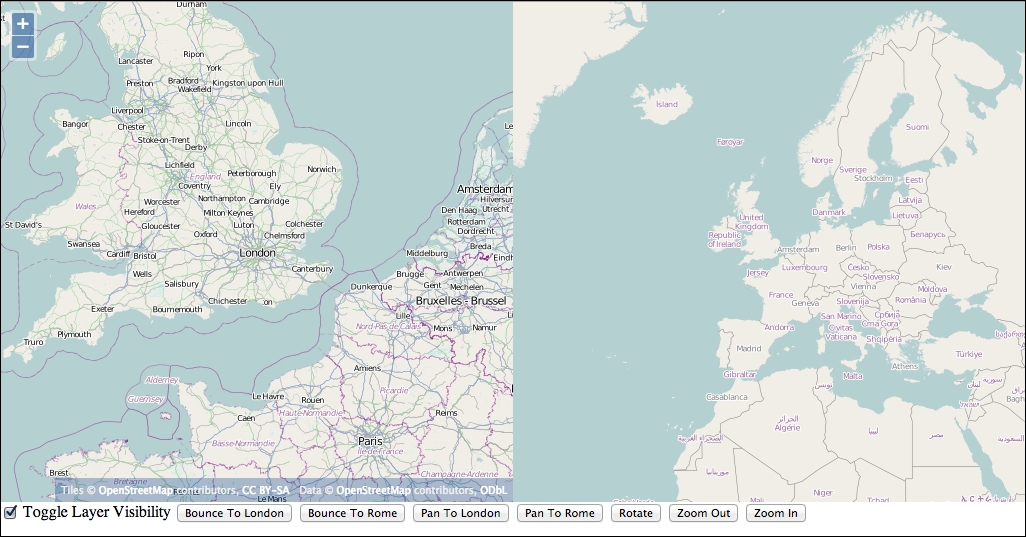
When the first map is panned or zoomed, the second map should center on the same location and stay zoomed out in three levels. The second map should not have any controls or interactions—set both the controls and interactions option to new ol.Collection() to achieve this.
Let's do a series of questions to see what you understood during the chapter:
Q1. I want to start my map looking at a specific location and level of detail. Which object is responsible for this?
Q2. I want to take some action when the user pans the map. What event should I listen for?
moveendzoomendQ3. Which object files this event?
Q4. I want to update a property called center of the view object when the center property on another object obj, changes. Which class provides the bindTo() method that I'll use?
ol.Mapol.Viewol.ObjectThis brings us to the end of the Map and View classes. We covered a lot of detail in these two classes and also uncovered some of the common methods used throughout the OpenLayers library that will help us work with events and key-value observing. We tried out many of the methods in various examples.
In the next chapter, we'll dive into raster layers and discover how to add various types of raster data sources to our OpenLayers applications.
Web maps are very popular today, and are growing in popularity. After Google Maps was introduced, there was an explosion of interactive web maps. Google provides an API to interact with its mapping service, as others do now, and OpenLayers works well with most of them. Not only can we use these third-party APIs with OpenLayers, we can also mash up other layers on top of them. Those services are the most popular, but they suffer from bottleneck depending on your web mapping application. So, you need to know mainstream API and alternatives to display raster images.
In this chapter, we will learn the following:
A layer is basically a way to show multiple levels of information independent of each other. Layers are not just a mapping or cartography concept; graphic designers and digital artists make heavy use of layers.
Imagine a printed map of a city. Let's say you also have two sheets of transparent paper. One sheet has blue lines that indicate bus routes, and the other sheet contains green lines that indicate bicycle routes. Now, if you placed the transparent sheet of paper with bicycle routes on top of the map, you will see a map of the city with the bicycle routes outlined.
Putting on or taking off these transparent pieces of paper will be equivalent to turning a layer on or off. The order you place the sheets on top of each other also affects what the map will look like—if two lines intersect, you will either see the green line or the blue line on top. This is the basic concept of a layer.
OpenLayers is a JavaScript library, and as discussed earlier is built using Object Oriented Programming (OOP). When we want to actually create a layer, we will create (or instantiate) an object from an ol.layer.Layer subclass.
OpenLayers has many different ol.layer classes. The layer types are only for different kinds of data (tiles, images, and vector). Using an attached ol.source.* will allow you to connect to a different type of map server 'back end.' Each layer object is independent of other layer objects; so, doing things to one layer won't necessarily affect the other.
How many layers can I have?
The safest maximum amount of layers you can have on a map at one time depends largely on the user's machine (that is, their processing power and memory). Too many layers can also overwhelm users; many popular web maps (for example, Google and Yahoo!) contain just a few layers. We recommend that you don't use a lot of layers or limit the number of layers that you can turn on at the same time. Adding layers is cheap but making composition of the map image is expensive, particularly with Canvas renderer. If you turn on many layers at the same time, you will end up with an unusable map, whereas if only some of them are turned on, you will have good performance. You also need to be aware that using vector layers instead of raster layers is better for composition performances.
Whatever the purpose of your web map application is, you will need at least one layer to have a usable map. An OpenLayers map without any layers would be like an atlas without any maps. You need at least one layer—at least one base layer. All other layers that sit above the base layer are called overlay layers. The concept inherits from the existing OpenLayers 2 series and was seen in Chapter 1, Getting Started with OpenLayers.
A base layer is at the very bottom of the layer list, and all other layers are on top of it. This would be our printed map from the earlier example. The order of the other layers can change, but the base layer is always below the overlay layers. By default, the first layer that you add to your map acts as the base layer. You can, however, change the order of any layer on your map to act as the base layer.
You can also have multiple base layers. Although you can set more than one base layer active at a time, for visual readability, most of the time, you only use one.
Any layer that is not a base layer is called an overlay layer. Like we talked about earlier, the order that you add layers to your map is important. Every time you add a layer to the map, it is placed above the previous one.
After this reminder about layers concepts, see what's happening at the OpenLayers 3 library level inheritance to discover the main layers type.
There are two types of layers: raster and vector layers. The main differences between both are:
PNG or JPEG. They can be generated on server-side or are static. In most cases, your browser doesn't manipulate them but only consumes them.To give you an overview of layers organization at the library level, let's look at the following diagram:
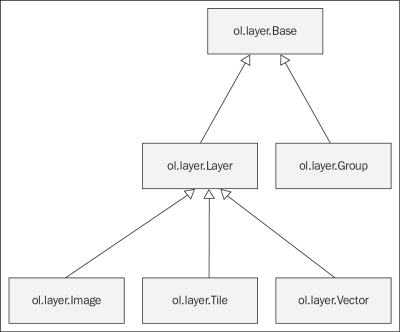
When you are creating a new web mapping application, you have to make a choice between benefits and drawbacks of those layers. For raster, it's mainly that images do not overload the browser as vector layers mostly can. As you can see in the diagram, raster layers such as vector layers are derived from a common ol.layer.Layer class. This ol.layer.Layer class inherits from an ol.layer.Base class, (base in this case means common behavior between layers). This class is also inherited by an ol.layer.Group class designed to group layers to treat them as a single layer. In our case, we will focus mainly on the two raster layer classes, ol.layer.Image and ol.layer.Tile. We will also do a review of the common ol.layer.Layer methods. Moreover, you can divide raster in two categories: tiled or untiled. We will cover both types in this chapter. The ol.layer.Vector class will be covered in Chapter 5, Using Vector Layers.
All raster layers inherit from ol.layer.Layer.
The following table is the list of available properties. You can also use them with vector although it's not required in this chapter:
|
Name |
Type |
Description |
|---|---|---|
|
|
|
This property sets the layer brightness. See Wikipedia webpage (https://en.wikipedia.org/wiki/Brightness) for more information. |
|
|
| |
|
|
|
This property sets the layer hue. You can discover more about hue with the Wikipedia page, https://en.wikipedia.org/wiki/Hue. |
|
|
|
This property sets the layer opacity. Possible values are between |
|
|
|
This property sets the layer saturation. See the dedicated Wikipedia article (https://en.wikipedia.org/wiki/Colorfulness) for more. |
|
|
|
This property defines the source for the layer. Sources are a way to access a resource such as single, tiled images or geographic features. |
|
|
|
This property sets the visibility. The default value is |
|
|
|
This is the minimum resolution (inclusive) at which this layer will be visible. |
|
|
|
This is the maximum resolution (exclusive) below which this layer will be visible. |
You can use those properties to set layer properties at startup. If you need to change one of those properties after layer creation, you always have setters and getters. Getters, if you don't remember the part about JavaScript initialization, are methods of objects you can use to get properties. Setters are also methods but to set properties. The setter and getter for a property are derived from the property name. It starts with a get or set keyword followed by the property with the first letter using uppercase. For example, for opacity, the getter name is getOpacity and the setter name is setOpacity.
You also have some methods that are specific to ol.layer.Layer and not related to properties.
The following are the main methods. We will not cover methods related to events: the ol.layer.Layer inherits from ol.Object via ol.layer.Base (http://openlayers.org/en/v3.0.0/apidoc/ol.html). It's because we already explained how events works within Chapter 2, Key Concepts in OpenLayers.
Let's try to play with the simplest cases.
Follow these steps to change layer properties:
Use the example derived from the first example from Chapter 1, Getting Started with OpenLayers, also available at chapter04/2360_04_01_changing_layer_properties.html:
<!doctype html>
<html lang="en">
<head>
<title>Simple example</title>
<link rel="stylesheet" href="../assets/ol3/css/ol.css" type="text/css" />
<link rel="stylesheet" href="../assets/css/samples.css" type="text/css" />
</head>
<body>
<div id="map" class="map"></div>
<script src="../assets/ol3/ol.js" ></script>
<script>
var osmLayer = new ol.layer.Tile({
source: new ol.source.OSM(),
opacity: 0.6,
brightness: 0.2
});
var view = new ol.View({
center: ol.proj.transform([-1.8118500054456526, 52.4431409750608], 'EPSG:4326', 'EPSG:3857'),
zoom: 6
});
var map = new ol.Map({
target: 'map'
});
map.addLayer(osmLayer);
map.setView(view);
</script>
</body>
</html>ol.source.Source from the osmLayer:console.log(osmLayer.getSource());
osmLayer.setProperties({opacity: 0.4, contrast:0.6});
console.log(osmLayer.get('contrast'));
console.log(osmLayer.get('opacity')); osmLayer.setProperties({opacity: 0.7, contrast:0.3});
console.log(osmLayer.getOpacity());
console.log(osmLayer.getContrast()); osmLayer.set('opacity',1);
osmLayer.setContrast(1);
osmLayer.setBrightness(0);
osmLayer.set('myId', 'myUnique');
console.log(osmLayer.get('myId'));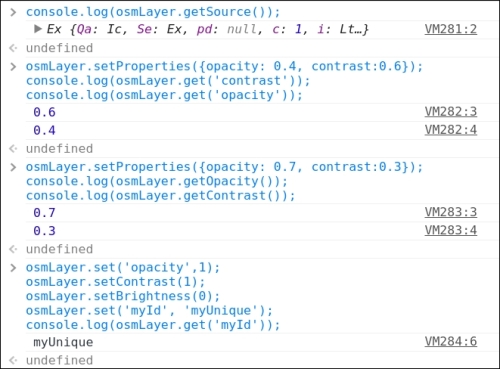
We reviewed how to manage main methods attached to the ol.layer.Layer subclass (remember that ol.layer.Tile inherits from it).
The interesting thing here, is that you are able to manipulate and create generic properties for all the ol.layer.Layer subclasses.
The most common operations on layers have their custom getters/setters such as getVisible() / setVisible(property), but you can replace them with the ol.layer.Layer getters/setters, get('visible')/set('visible', property). These are inherited from ol.Object, and consequently, ol.layer.Tile inherits them too. In the normal case, you use these getters/setters only for arbitrary properties we want to add, such as a name.
Another benefit you may not be aware of is that when you add new properties to a layer object, you can attach information for new applications related to layers. For example, you can set a property to reference metadata for the layer (intellectual properties, license, link to a PDF file to download, or more). Some other ways to use it are to define groups, set a unique identifier, set a display name to reuse in a custom layer manager, and set a reference to a legend resource (URL, image, and so on).
The possibilities are endless.
Now, after this short introduction to manage layer properties, we will review different raster layers and also the source property. It's mainly these elements that make the difference between raster layers in the OpenLayers 3 library.
We mentioned earlier that there are two types of raster layers: tiled and untiled.
Before sharing ideas about tiling, the first thing to do is define tiling. According to Wikipedia, https://en.wikipedia.org/wiki/Tiled_rendering, it can be considered as the process of subdividing an image by regular grid.
So, why is this needed? Again, like for Closure Tools, it's for web performances. You can review about Closure tools in more detail in Appendix B, More details on Closure Tools and Code Optimization Techniques. Raster data and layers are built from other images or from vector data. The idea here with tiles is to balance the time for data processing and the time for transferring the resource (the image) through the network. It's also because using a regular tile grid can be cached, both by the browser and by the server.
Imagine that you require a complex layer. Would you want to wait for five minutes until it renders? (Rendering is the process to generate an image from geographic sources).
The following table shows a summary of pros and cons for using tiled, untiled resources:
To summarize, if you want performance with less flexibility, choose tiled raster, and if you need fresh data and your layers are based on one or two data sources, choose untiled raster. You can also make a mix of both solutions: use tiles at some levels and untiled content at other levels. Another difference we don't really show in the table for tiles, is that you can pregenerate image tiles for an upper level (such as the country level or lower) and choose to generate tiles on the fly only for lower levels (the street level). Depending on the context, you don't choose: you have to connect to a third-party map server where the choice is restricted to the available web services / images.
The purpose of this comparison is to help you understand how to make a good decision concerning the required layers you have to choose. OpenLayers 3 is only a client-side library; however, knowledge about the principle to provide layers is a requirement to use it well. Also, you may need to host, or own, your map server to serve raster data.
If you ever need to serve your own tiles or raster data, you can take a look at the following open source software:
Geoserver: http://geoserver.org
It is a server software that allows you to serve maps and data from a variety of formats to standard clients such as web browsers and desktop GIS programs.
Mapnik: http://www.mapnik.org
It's a toolkit for rendering beautiful maps, with clean, soft feature edges provided by quality anti-aliasing graphics, intelligent label placement, and scalable, SVG symbolization. Most popularly, Mapnik is used to render the OpenStreetMap main map layers.
Mapserver: http://www.mapserver.org
It is an open source geographic data rendering engine written in C. Beyond browsing GIS data, MapServer allows you to create geographic image maps, that is, maps that can direct users to web content. Like GeoServer, it allows map publications via Open Web Standards.
Degree: http://www.deegree.org/
Degree is open source software for spatial data infrastructures and the geospatial web. It shares with GeoServer and Mapserver the ability to serve map via Open Web Standards.
We can also mention that there are map proxy applications such as MapCache http://mapserver.org/mapcache/, GeoWebCache http://geowebcache.org, or MapProxy http://mapproxy.org.
Their important purposes are creating tiles for dynamic web server, caching requested map images using GeoServer, MapServer, Mapnik, Degree, or any other map servers.
So far, we focused on the differences between tiled and untiled, but you also have some differences coming from the source property.
So, how can we define a source? What is its purpose?
Sources in OpenLayers 3 language define how and where you can access the layer. You always need a source from an ol.source subclass in order to retrieve and display layers.
Why did OpenLayers 3 development team invent this concept?
It was mainly for the organization of the code and reusability of the same principles. You gain modularity because you have only three types of layers but more sources. It enables you to decouple the type of layer you are using from the data source and the way you call it. It's simpler to manage a new source than to create a new layer by example if a new source appears.
You can see in the following diagram that ol.source.Source has three main child subclasses, ol.source.Vector, ol.source.TileSource, and ol.source.ImageSource.
They are abstract classes. It means, they work as a skeleton for all types of sources but are never directly used:
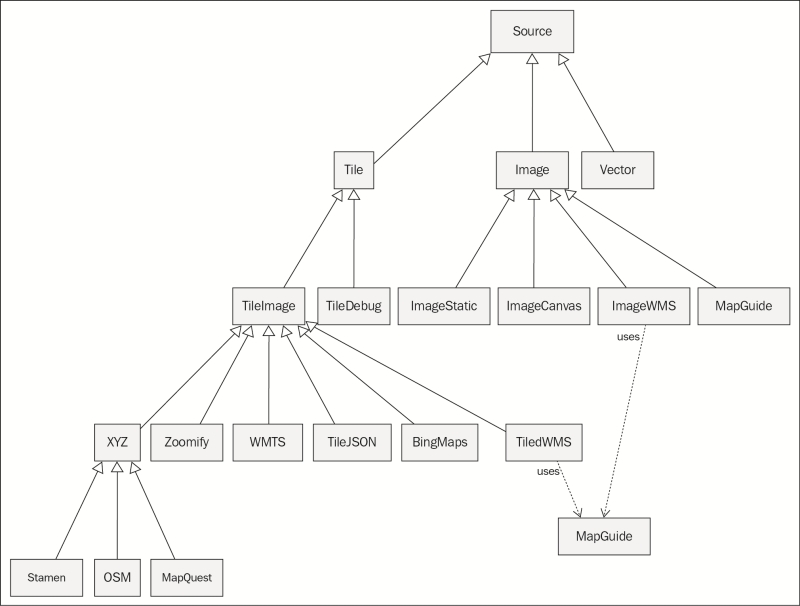
Most of the layers we are manipulating are inherited from the past.
Web-based maps are commonplace today. The catalyst for the explosive growth of web maps was the introduction of Google Maps. Web maps existed before, but they were not quick or developer friendly. In June 2005, Google released an API for Google Maps, which provided a frontend client (the role OpenLayers plays), along with an access to the backend map server via their frontend client API.
This allowed anyone to insert not just a Google Map on their site, but also allowed them to add in their own point data and manipulate the map in other ways. Google Maps grew in popularity, and other companies such as Microsoft, Yahoo, MapQuest, MapBox, Nokia, and others followed in their footsteps, creating their own web mapping APIs.
Most of them are more likely to make mashups.
The term mashup refers to an application that combines various different data sources and functionality together. A map mashup is a map that combines different layers and data. Third-party mapping APIs, such as MapQuest and Microsoft Bing Maps, allow people to more easily create these map mashups. For example, a map with an OpenStreetMap base layer overlaid with markers that track places you've traveled to can be considered a map mashup.
OpenLayers did not introduce map mashups, but it allows us to create very powerful ones with ease. Combining an OpenStreetMap layer, a WMS layer, and a vector layer is pretty simple with OpenLayers.
OpenLayers 2 had some third-party mapping APIs embedded into its core, enabling you to use its maps inside your Openlayers-based application. Nowadays, for better decoupling of OpenLayers API from third-party APIs, the OpenLayers 3 team choose to have no support for other mapping APIs that tie together tiles and an associated JavaScript API library.
Why this decision?
One of the main goals of OpenLayers 3 was to rewrite OpenLayers 2, making its API cleaner. The support for Google Maps API in OpenLayers 2 has also put a significant maintenance burden on both library and application developers, to keep up with changes of the Google Maps API. To avoid this in OpenLayers 3, the support for Google Maps using Google Maps API is nonexistent. However, Google does provide its tiles independent from their API, but only to paying customers. Fortunately, you have more alternatives to Google Maps API. We will try to show you that Bing (Microsoft) Maps (with its tiles service) or OpenStreetMap and its derived map images' data services API such as MapQuest can fill the missing provider.
Now, it's time to review all the tiled layers, in particular, to use beautiful background layers for your maps.
All tiled layers share some common properties. They inherit from the ol.source.TileImage. Those common properties are quite useful for other ol.source.* that inherit from it, for example, in some cases to put a logo or give attributions (also called credits) for the maps data and/or tiles. You have to be careful in the API docs online as these properties are considered unstable. You have to uncheck the Stable Only checkbox on the top banner. Unstable doesn't mean that you don't have to use those properties but that they may change with future OpenLayers releases. It's very useful for application developers to see what they may need to use or migrate in the future. See the following table for further information:
The most important functions are mostly those that do not start with the word tile. The tileClass, tileGrid, tileLoadFunction and tilePixelRatio exist but we choose to not cover them as they seem out of the scope for beginners; they help setting access to backend with particular tile grids. Along this book, we will sometimes refer to source as layer but it means a layer with the source adapted for a particular backend.
OpenStreetMap (OSM) is a free, Wikipedia style map of the world driven by user contributed content. You are able to use your own OSM tiles or ones provided through the OpenStreetMap servers.
Setting up an OpenStreetMap service and tiles yourself is not too difficult, but it is outside the scope of this book (visit http://switch2osm.org for more information on this). Accessing OSM with OpenLayers, however, isn't.
More information on the OpenStreetMap project can be found at http://www.openstreetmap.org. To access OpenStreetMap, only using the ol.source.OSM constructor without any options is enough. In the previous examples, we were already using this source, so we will not give you another similar example.
Though using constructor without options can be enough, you can also use other properties. The default constructor code uses the publicly available OSM tiles, but it is easy to point it at your own tiles. To do so, create the layer in this format:
var osmLayer = new ol.layer.Tile({
source: new ol.source.OSM({
url: 'http://{a-c}.tile.opencyclemap.org/cycle/{z}/{x}/{y}.png'
})
});To use this, you will have to replace http://{a-c}.tile.opencyclemap.org/cycle/ with the server hosting your OSM tiles. {z}, {x}, and {y} are variables that OpenLayers will replace with the appropriate values to reference specific map tiles.
The {a-c} parameters mean to say you can access tiles using these URLs:
http://a.tile.opencyclemap.org/cycle,
http://b.tile.opencyclemap.org/cycle,
http://c.tile.opencyclemap.org/cycle
This behavior comes from restrictions from your browser: you can't simultaneously ask images from a same domain. It can only request a certain number of resources from the same domain simultaneously, usually 2 or 4. Using subdomains is a way to bypass this limit and speed up the map displaying.
If you have different sources for tiling, it is not only to provide different URLs to access different map images. The way tiling is done depends on established standards.
For example, Stamen layers, OpenStreetMap layers, and MapQuest layers are using the same tiling convention, whereas WMTS (Web Map Tile Service) can adopt other patterns to display tiles. These patterns are set with the ol.tilegrid.TileGrid object that describe for each arbitrary zoomlevel how the tiles are split.
The rules are the following. In reality, the Earth is not a sphere, but in this case, our planet is assimilated to a sphere because we are using Spherical Mercator projection (mainly known as EPSG 900913 or EPSG 3857). Do not worry about projections at the moment, we will review them in a later chapter as it can be a difficult topic to understand.
The entire sphere is projected on a single square at the 0 level. Then, for each zoom, you increase a level and for each tile at the previous zoom, we get 4 tiles at this one.
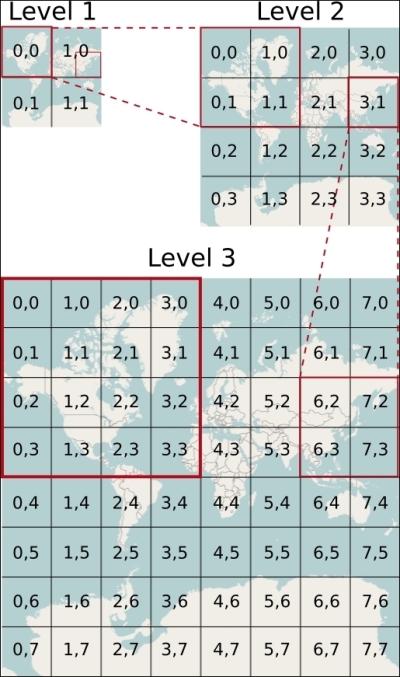
With the preceding diagram, you will know how to access a tile covering East Europe such as Poland at the 3 level. The URL always looks like URL_TO_TILES/level_z/x_in_grid_for_level/y_for_grid_in_level.png. So, for Poland that has a zoom level 3, x equal to 4, an y to 2, the URL could be http://b.tile.openstreetmap.org/3/4/2.png or http://c.tile.openstreetmap.org/3/4/2.png to get the right tile.
This source enables your layer to consume OpenStreetMap data and customize OpenStreetMap specific properties.
The constructor is ol.source.OSM and its properties can use following options:
MapQuest was, until around 2008, the leading provider for web mapping API. With the entry of Google Maps, the leadership was lost. In 2010, the company chose to change its position concerning web mapping API, by choosing to exclusively rely on OpenStreetMap data to do the job.
Two layers are available freely. They also provide other services such as their own web mapping API. You can get further information at the Open developer part website at http://developer.mapquest.com/web/products/open/.
The MapQuest source class refers directly to the MapQuest tiles server URL.
The constructor is ol.source.MapQuest.
You are only required to use the source constructor included in an ol.layer.Tile object to add the layer. There are only two options' properties. The first one is the layer. It can take values such as osm (roads), sat (satellite), and hyb (hybride) depending on the tiles you want to display. The other property tileLoadFunction will not be covered here: it's not a common requirement for beginners and we already listed it in the ol.source.OSM. At least, you just need to know that it helps change call to tiles with rules defined in your code.
setVisible to be able to see one layer and hide it to show the other underlying layer.You will get something like the following screenshot if you center on the Statue of Liberty and use the MapQuest OSM layer:
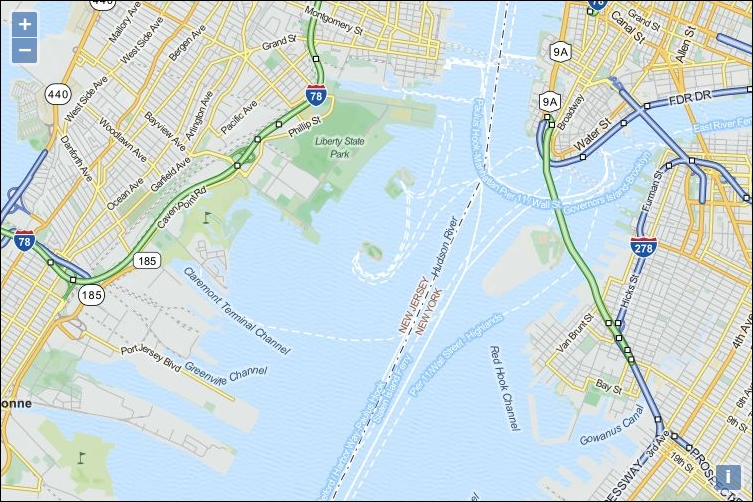
The Stamen layers were named so after a company. To cite the OpenstreetMap wiki, Stamen (http://stamen.com) is a San Francisco design and development studio focused on data visualization and map-making. These layers extensively use OpenStreetMap data in many of their map visualizations and have provided three CC-BY OpenStreetMap tilesets: Toner, Terrain, and Watercolor. You can see how the styles look at the official demo website, http://maps.stamen.com.
Follow these steps to create a Stamen layer:
var stamenLayer = new ol.layer.Tile({
source: new ol.source.Stamen({
layer: 'toner'
})
}); var map = new ol.Map({
layers: [stamenLayer],
target: 'map',
view: new ol.View({
center: ol.proj.transform([2.35239, 48.858391], 'EPSG:4326', 'EPSG:3857'),
zoom: 12
})
});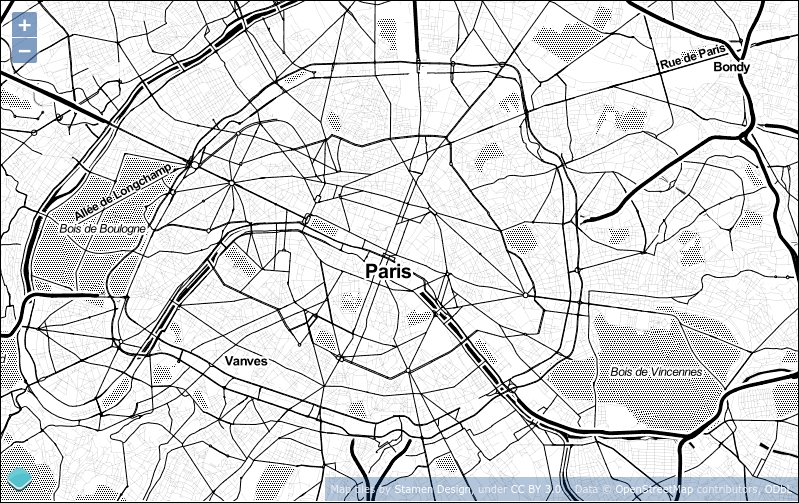
The map we've just created shows a black and white Stamen layer. You can look at other available layers for Stamen, the list is available just after the Stamen Layers' properties below.
Stamen source class refers to the beautiful tiles from Stamen. You can declare their source using the following content.
The constructor is ol.source.Stamen.
We will not review all properties, as most of them are configured by default. You can refer to the API docs at
http://openlayers.org/en/v3.0.0/apidoc/ol.source.Stamen.html.
The most important property to remember is the layer where you set the name of the available layer you want with:
new ol.source.Stamen({
layer: 'toner'
})
You will find all the available layers names derived from the three Stamen layers in the following table, their image type, and their default state. Be careful, particularly when you are using the .jpg images and the opaque property option together, the .jpg image format is unable to work with transparency. Refer to the following table for further information:
|
Name |
Extension |
opaque |
|---|---|---|
|
terrain |
|
true |
|
terrain-background |
|
true |
|
terrain-labels |
|
false |
|
terrain-lines |
|
false |
|
toner-background |
|
true |
|
toner |
|
true |
|
toner-hybrid |
|
false |
|
toner-labels |
|
false |
|
toner-lines |
|
false |
|
toner-lite |
|
true |
|
watercolor |
|
true |
Microsoft provides an interface to their mapping services as well. Their mapping service previously was referred to as Virtual Earth, but they have since rebranded it as Bing Maps. The official Microsoft documentation can be found at http://msdn.microsoft.com/en-us/library/dd877180.aspx.
Bing Maps tiles can be viewed using the official Bing Maps API, but they can also be used through an API that gives direct access to their tiles. This is what we will see now:
style property but also the key. Contrary to the previous examples, a tile access control is done and works through an account associated with a key to use in your code: var sourceBingMaps = new ol.source.BingMaps({
key: 'AibU6zHqoTPYDuNRtHPMJq557poKb9AVTIJ0NWWnNZf8LfoRRwoigHTQ0Frrsr5m',
imagerySet: 'Road',
});ol.layer.Tile layer: var bingMapsRoad = new ol.layer.Tile({
source: sourceBingMaps
}); var bingMapsAerial = new ol.layer.Tile({
source: new ol.source.BingMaps({
key: 'AibU6zHqoTPYDuNRtHPMJq557poKb9AVTIJ0NWWnNZf8LfoRRwoigHTQ0Frrsr5m',
style: 'Aerial',
})
}); var map = new ol.Map({
layers: [bingMapsRoad, bingMapsAerial],
target: 'map',
view: new ol.View({
center: ol.proj.transform([6.562783, 46.517814], 'EPSG:4326', 'EPSG:3857'),
zoom: 13
})
});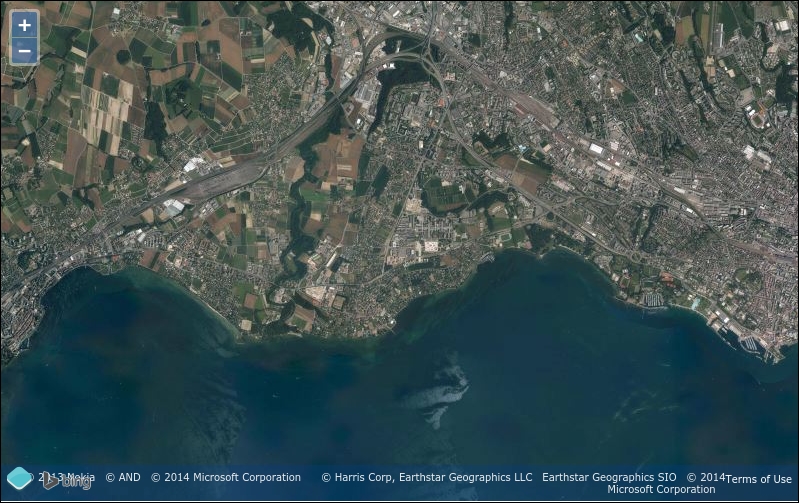
To make the example work, it's required to put your file on a web server. It can be Apache, but with Python, you can simply do it in the command line in your demo file root directory:
python -mSimpleHTTPServer
Next, open your browser to http://localhost:8000/sandbox/your_file_name.html.
Another way can be to use the node index.js command (if you downloaded the samples code) and open http://localhost:3000/sandbox/your_file_name.html.
Also, you don't have the obligation to create an API key when you are on your local machine. The one used in this book works only when using localhost or the official book website at http://openlayersbook.github.io.
We just made a map using the Microsoft Bing Map tiles' API. It works similar to the OpenStreetMap tiles layers but required to be authenticated. We can communicate with Microsoft tiles API server and use different properties. Let's go over the properties, as there are some that the other third-party sources do not provide.
Bing Maps source helps you consume Bing tiles representing road and imagery in your layer.
The constructor is ol.source.BingMaps and the following table is for the options:
|
Name |
Type |
Description |
|---|---|---|
|
|
|
It is the language and the localization you want to display for your labels. The supported Culture Codes for each style are listed in the official Microsoft documentation at http://msdn.microsoft.com/en-us/library/hh441729.aspx. |
|
|
|
This is the Bing Maps API key. Get yours at http://bingmapsportal.com. |
|
|
|
This is a type of imagery. It can be |
|
|
|
The TileJSON format was invented by MapBox, another company providing OpenStreetMap related services. It relies on JSON notation.
According to the specification, TileJSON is an open standard for representing map metadata. Its main goal is to reference the name, the attribution, the server URL, the minimum and max zoom, the center, the bounds, and the scheme of the tile (for OSM, numbering go top to bottom but other tiles' systems start numbering upwards). You can see all available parameters looking at the official specification at https://github.com/mapbox/tilejson-spec.
As it is not the mainstream way to get tiles, although it's a smart way, we will not review it through an example but directly advise you to go the official demo available at http://openlayers.org/en/v3.0.0/examples/tilejson.html and look into the code.
TileJSON source permits you to display in a tiled layer custom tile. You can declare their source using the following constructor:
ol.source.TileJSON
You can also review the available properties, particularly the required URL parameter on the official API docs at http://openlayers.org/en/v3.0.0/apidoc/ol.source.TileJSON.html.
The WMTS layer is based on the WMTS standards. The specification defines it as The Web Map Tile Service described in this standard builds on earlier efforts to develop scalable, high-performance services for web-based distribution of cartographic maps.
A WMTS-enabled server application can serve map tiles of spatially referenced data using tile images with predefined content, extent, and resolution.
This type of layer is quite different from most of the previous tiled layers we've seen. WMTS layers are more customizable. You can make a request to get tiles in custom projection, you can also choose your grid without caring about the implicit rules, that each tile when you zoom it will give you four tiles, as illustrated with the following figure:
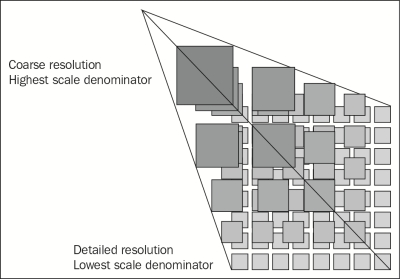
It's really not the most common tiles layer, but you can see it as the most efficient tile system for custom requirements. You can better choose your level of tiling or you can also use custom tile size. For example, for mobile, a smaller tile with 64 pixels for its side can be used instead of the standard 256 pixels size. We recommend, if you are curious, to see the official examples at http://openlayers.org/en/v3.0.0/examples/ using the WMTS keyword. We will not be covering the details here. You can learn more about the standard itself by going to the official dedicated web pages at http://www.opengeospatial.org/standards/wmts.
You also need to understand that one of its main goals was to fill the issue for fast rendering contrary to OGC WMS standard as it can be cached.
WMTS sources are complex to declare. They require more parameters than other sources because of their flexibility. For example, the ability to customize for each tile levels grid means also as a drawback, complexity.
The constructor is ol.source.WMTS. To see its options, we recommend that you visit the official API docs at http://openlayers.org/en/v3.0.0/apidoc/ol.source.WMTS.html.
The DebugTileSource source is only a way to debug tiles rendering in OpenLayers 3. It doesn't use the tile numbering from the source but the internal that OpenLayers use. We just mentioned it to be exhaustive. You use it into a ol.layer.Tile class. You can look at the demo to learn more about it at http://openlayers.org/en/v3.0.0/examples/canvas-tiles.html. It can really help you to debug special grid, for example, in WMTS.
The TileDebugTile source enables you to display numbered grids to show how tiles are regrouped in the OpenLayers Canvas rendering. Canvas is a renderer to display a map in your browser.
The constructor is ol.source.TileDebug and for the options, you should visit the official API docs at http://openlayers.org/en/v3.0.0/apidoc/ol.source.TileDebug.html.
A WMS (Web Map Service) is a standard protocol for serving georeferenced map images over the Internet that are generated by a map server. You can watch the full reference at the official OGC (Open Geospatial Consortium) website, the organization managing this standard (http://www.opengeospatial.org/standards/wms).
The two versions of WMS available are 1.1.1 and 1.3.0.
WMS is dynamic: you can generate on the fly images.
So, why do I see a reference to a tiled WMS in OpenLayers 3?
It's just a way to lower charge on server-side—when you are generating small images, the process is faster, the memory cost does not really change as the number of requests increase, but you gain the ability to cache the tiles.
But wait, so why can't we use ImageWMS with WMS if we can have the advantage of both tiled (caching) and untiled system (freshness)?
We will not directly answer this right now, but will give you the hint in the section dedicated to ImageWMS.
You can refer to the official example to see a simple example as a reference at http://openlayers.org/en/v3.0.0//examples/wms-tiled.html.
To find out what projections a WMS service supports, you can make a getCapabilities request to the server. To make this request, specify the request, service, and version properties in the URL. For example, http://suite.opengeo.org/geoserver/wms?service=WMS&version=1.1.1&request=GetCapabilities.
You also have to be cautious. Here, we use the Version 1.1.1 version call but the specification supports two versions: 1.1.1 and 1.3.0. It's recommended to use 1.3.0 nowadays, but you can meet external WMS web services using only 1.1.1. Just use the VERSION parameter in the params options.
Tiled WMS source helps you set tiled WMS calls for your layer. The constructor is ol.source.TiledWMS and the options are listed in the following table:
Contrary to most components that are useful only in a map context, this component helps you to display any arbitrary images. It's really useful when you need to display a large image and want performances associated with tiles displayed and the usual interactions of mapping such as panning and zooming.
Some use cases can be game maps, discovery of scanned historical documents such as birth certificates for genealogy, or the old maps with no referencing, meaning that they do not overlay well with existing imagery and geographical data.
To make the ol.source.Zoomify component work, you will need to preprocess a large image to create tiles.
ZoomifyImage directory from the third step and generate the tiles for the image. It can take some time, so don't worry, although the program output is not verbose:
python ZoomifyFileProcessor.py path_to_dublin_map/1797-map-of-Dublin.jpg
ol3_samples/assets/data/ directory, the created folder from path_to_dublin_map/1797-map-of-Dublin/. <script> and </script> tags.http://openlayers.org/en/v3.0.0/examples/zoomify.js in your script block.ImageProperties.xml from ol3_samples/assets/data/1797-map-of-Dublin/ file and inspect the WIDTH and HEIGHT attributes from the IMAGE_PROPERTIES xml tag.imgWidth and imgHeight.url variable to /assets/data/1797-map-of-Dublin/ and change the zoom property in the view to 1 instead of 0.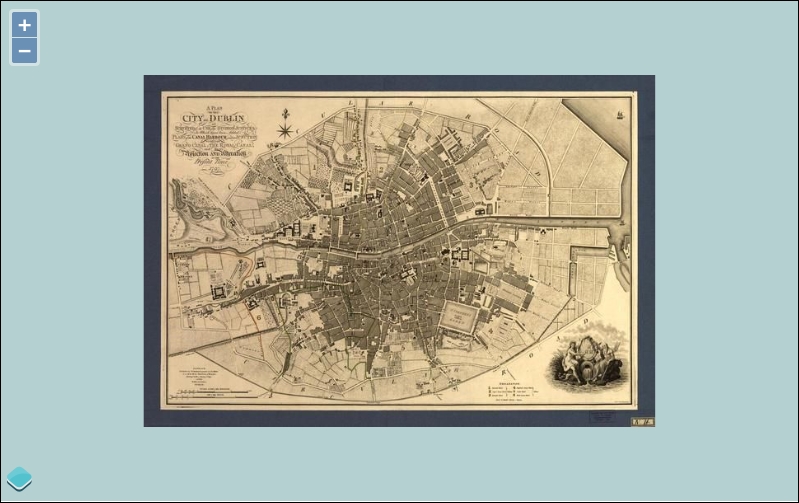
If you have some difficulty, do not hesitate to retrieve the file from samples.
We just made a map using images' tiles using Zoomify source with its particular grid.
The main particular thing to understand in the sample is to set a projection definition that uses image pixel coordinates, for example:
var proj = new ol.proj.Projection({
code: 'ZOOMIFY',
units: 'pixels',
extent: [0, 0, imgWidth, imgHeight]
});We use units' pixels instead of the more usual degrees or meters and the original image width and height are used to define the extent. Then, we use pixels as extent units, instead of meters or degrees.
The component retrieves each tile as we zoom in/out. To get an overview of this behavior, we recommend that you open the Network panel and play a bit with the demo.
Now, it's time to review untiled layers.
Although there are really less image layers' sources available than a tiled one, they are also useful depending on your goal or your backend.
We will start with the image WMS layer and then cover other types.
Like the tile layer WMS already reviewed, this component is also using the WMS standard to retrieve the map, imayer. The thing that differs here is that you add a layer using an ol.layer.Image constructor instead of the now more usual ol.layer.Tile and, your ol.source is ol.source.ImageWMS instead. Next, you just have to complete the parameters like for a tiled WMS.
Now, let's see why we need to use untiled WMS.
See the two following images coming from the official example when you zoom in. The first one comes from http://openlayers.org/en/v3.0.0/examples/wms-tiled.html. See the following screenshot:
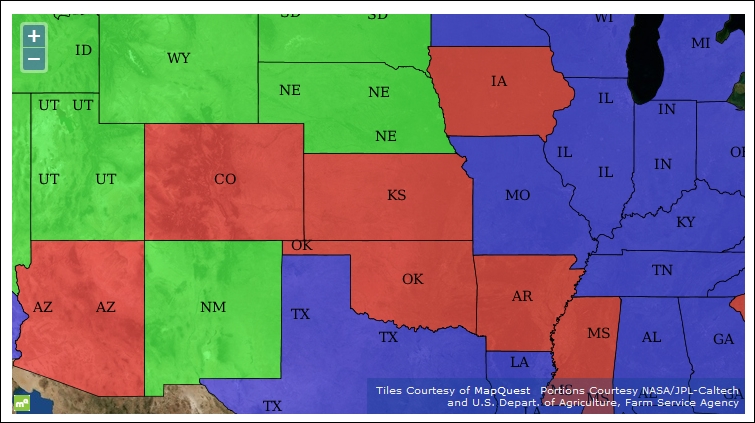
The second image, as shown here, is the untiled one from http://openlayers.org/en/v3.0.0/examples/wms-image.html:
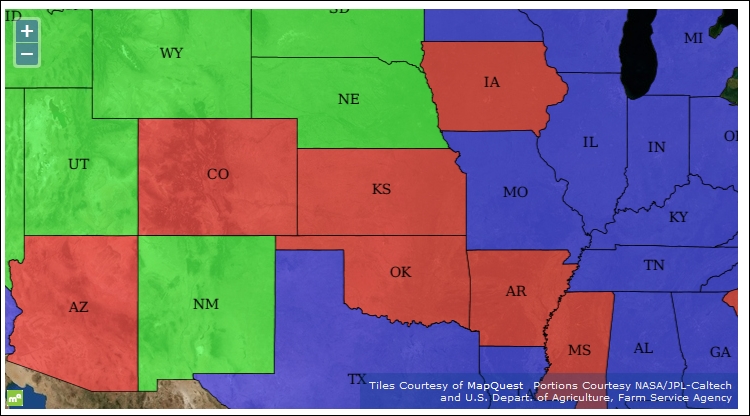
You can see that, particularly for labels, they are duplicated. This behavior is quite simple: each tile is requested separately in a tiled WMS. Most of the time the position of the label depends on the position of the object, but here you can request it more than one time because of your tiles. In conclusion, be careful to not use tiled WMS when you are using automatic labeling in WMS or you will suffer from labels' duplications.
After this functional review, let's inspect the WMS layer ImageWMS source class properties:
The constructor is ol.source.ImageWMS. Contrary to the tiled version, you can't call multiple URLs. The options are available as follows:
After this raster overview, it's time to review a bit more on how to combine those different layers in a big mashup. We will illustrate it combining the layers based on OpenStreetMap projection, the Spherical Mercator.
Getting other layers to play nicely with these layers involve three things. These rules are also available for others projections:
Using what we've learned so far, let's make a mashup. We'll use OSM derived layers with Bing Maps layer and put at the top a WMS layer. We will also set a small layer switcher (as there is no available component in OpenLayers core code for this).
To achieve your task, combine our knowledge and just follow these instructions:
<!doctype html>
<html lang="en">
<head>
<title>Playing with various sources and layers </title>
<link rel="stylesheet" href="../assets/ol3/css/ol.css" type="text/css" />
<link rel="stylesheet" href="../assets/css/samples.css" type="text/css" />
</head>
<body>
<div id="map" class="map"></div>
<script src="../assets/ol3/ol.js" ></script>
<script>
</script>
</body>
</html><script> tag. We add together two Bing Maps layers and add to them a name using set . We will reuse this parameter later:var bingMapsAerial = new ol.layer.Tile({
source: new ol.source.BingMaps({
key: 'AlQLZ0-5yk301_ESrmNLma3LYxEKNSg7w-e_knuRfyYFtld-UFvXVs38NOulku3Q',
imagerySet: 'Aerial'
})
});
bingMapsAerial.set(
'name', 'Bings Maps Aerial'
);
var bingMapsRoad = new ol.layer.Layer({
source: new ol.source.BingMaps({
key: 'AlQLZ0-5yk301_ESrmNLma3LYxEKNSg7w-e_knuRfyYFtld-UFvXVs38NOulku3Q',
imagerySet: 'Road',
culture: 'fr-FR'
})
});
bingMapsRoad.set(
'name', 'Bings Maps Road'
);var mapQuestAerial = new ol.layer.Tile({
source: new ol.source.MapQuest({layer: 'sat'})
});
mapQuestAerial.set('name', 'MapQuest Open Aerial');topp:states layer from the URL http://demo.boundlessgeo.com/geoserver/wms and various label layers back from the WMS server. We'll also set the opacity to 0.6, that is 60 percent opaque. The projection is not specified: it comes from the view and we know that the remote layer service available has the right projection (using getCapabilities). Go ahead and create the WMS layer and add again a name:var simpleWMS = new ol.layer.Image({
opacity: 0.6,
source: new ol.source.ImageWMS({
url: 'http://demo.boundlessgeo.com/geoserver/wms',
params: {
'LAYERS': 'topp:states'
},
extent: [-13884991, -7455066, 2870341, 6338219]
})
});
simpleWMS.set('name', 'USA layer from Geoserver WMS demo');var layers = [bingMapsAerial, bingMapsRoad, mapQuestAerial, simpleWMS];
map object, add into the layers object and the view too.var map = new ol.Map({
layers: layers,
target: 'map',
view: new ol.View({
center: ol.proj.transform([-90, 40], 'EPSG:4326', 'EPSG:3857'),
zoom: 3
})
});Now, we'll create a function with a special purpose: creating an HTML label tag and also and HTML input checkbox. It will have three parameters: one for the name, one to create an id for the HTML input, and the planned place where we want to create this checkbox:
function generate_checkbox(id_checkbox, label_name, html_element) {
var checkbox = document.createElement('input');
checkbox.type = "checkbox";
checkbox.id = id_checkbox;
var label = document.createElement('label');
label.htmlFor = id_checkbox;
label.appendChild(document.createTextNode(label_name));
html_element.appendChild(checkbox);
html_element.appendChild(label);
}ol.dom.Input and bindTo but don't bother about it at the moment:for (var i = layers.length - 1; i >= 0; i--) {
var id = layers[i].get('id');
var name = layers[i].get('name');
generate_checkbox('layer_id_' + i, name, document.body);
var visible = new ol.dom.Input(document.getElementById('layer_id_' + i));
visible.bindTo('checked', layers[i], 'visible');
};We just created a map using different tiles' layers with a WMS overlay. We also create, as a bonus, a simple but dynamic layer switcher. All the layers use the map's projection, EPSG:3857, and line up with the lower aerial Bing Maps.
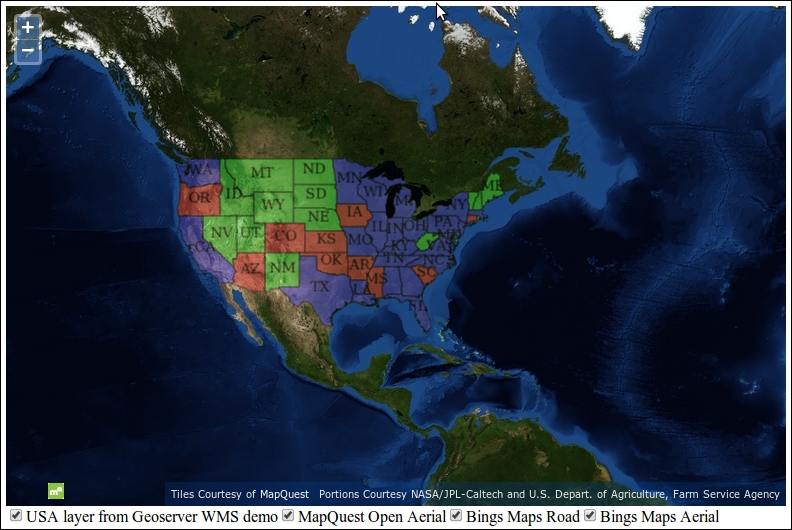
We choose, for learning purposes, to only use the OpenLayers library code to manage layers display but an external component to the library is also available for this goal at https://github.com/walkermatt/ol3-layerswitcher. Try it on your own and enjoy! It will be a good opportunity to learn more about ol.layer.Group, we didn't really review until now.
After revising, it's time to see another source to display the image: the ol.source.MapGuide source.
We didn't review this server, although an open source version of this server is available at http://mapguide.osgeo.org, when we saw the various servers available to provide images for the OpenLayers 3 library. We chose to not cover it in detail, because this solution is not mainstream and beginners will not be able to dive deeper in to this complex solution.
You just need to understand that this image source is unusual and is mostly used by people coming from the CAD (Computer-aided design) world because this software was released as open source by AutoDesk, the leading company for 2D/3D drawing software.
There are some quite important differences to make an equivalent map version of the Zoomify sample. Let's see how:
sandbox directory./assets/data/1797-map-of-Dublin.jpg.imgCenter variable to [imgWidth / 2, imgHeight / 2];.var crossOrigin = 'anonymous';.ol.layer.Tile with ol.layer.Image.var source = new ol.source.ImageStatic({
attributions: [
new ol.Attribution({
html: '© <a href="https://commons.wikimedia.org/wiki/File:1797-map-of-Dublin.jpg#Summary">Wikipedia Commons</a>'
})
],
url: url,
imageSize: [imgWidth, imgHeight],
projection: proj,
imageExtent: proj.getExtent()
});You changed the center for the view by using a positive value for the second value in the imgCenter variable. It's because the ol.source.ImageStatic doesn't use the same origin as the ol.source.Zoomify.
We also set as an option, attributions referencing the credits to the Wikipedia Commons image.
The most important parts for configuration for the constructor are the url, imageSize, and imageExtent.
We also reused the projection based on pixels' units to set the projection for the source. As a reminder, you can inspect the available properties for the source.
The class helps to use any image as a layer using a pixel-based projection.
Its constructor is ol.source.ImageStatic. The constructor options are as follows:
To be complete, an ultimate source to review is the ol.source.ImageCanvas.
The ImageCanvas source is already an advanced topic, which is out of this book's scope; so, we will only explain its purpose.
If you remember, the default OpenLayers 3 behavior is to generate an HTML Canvas element to display the map image.
The purpose of ol.source.ImageCanvas is to help you inject in the HTML Canvas map element any arbitrary Canvas element. It's more flexible but the main drawback is the requirement to manage conversions between map units and the canvas element you want to add.
So, if you want to go further, you will need to learn Canvas drawing and also some projection calculations. At best, you will be able to integrate Canvas produced by other libraries. You also need to understand that a Canvas element can be built from vector elements and not only from raster images. It's a silly use case compared to the ideal separation between raster and vector layers.
Its constructor is ol.source.ImageCanvas. If you need it for a special purpose, the best way is to refer to the official documentation at http://openlayers.org/en/v3.0.0/apidoc/ol.source.ImageCanvas.html.
You can see it in action with D3 (another JavaScript library to generate graphic, charts, plots, and also maps), that can produce a canvas element you can use as a layer, as demonstrated in the official example at http://openlayers.org/en/v3.0.0/examples/d3.html.
For getting started with Canvas, use the Mozilla Developer part about the HTML 5 Canvas API at https://developer.mozilla.org/en-US/docs/Web/API/Canvas_API.
In this chapter, we quickly reviewed the layer structure inheritance, focusing on raster. Then, we talked about what raster data layers are, how they work, and what benefits you can get from using different sources to display your maps. We learned how to use the Microsoft Bing Maps layer, all API depending on tiles using OpenStreetMap data. We also discussed tiling in OpenStreetMap that use Spherical Mercator and how to create a map mashup with a layer switcher, mixing various layers and sources' types together. We didn't restrict the chapter to maps as it's possible to also use images unrelated to cartography.
In the next chapter, Using Vector Layers, we will see the concept of vector layer in-depth and the OpenLayers main classes for using them. Like for raster, you will discover not only their specific sources but also the various vector data formats and how to manipulate features and geometry.
Having explored raster layers, it's time to explore the other layer type that OpenLayers supports—vector layers. In this chapter, we'll introduce the vector layer and discover how to display and interact with vector data on the fly. We'll see how we can use vector sources to load vector data in a variety of formats. Through several hands-on examples, we'll explore the Format, Feature, and Geometry classes that are the foundation of OpenLayers 3 vector support.
In this chapter, we will cover using the vector layer class, ol.layer.vector, and some related classes to display vector data. Specifically, we'll:
In OpenLayers, the vector layer is used to display vector data on top of a map and allow real-time interaction with the data. What does this mean? Basically, it means we can load raw geographic data from a variety of sources, including geospatial file formats such as KML and GeoJSON, and display that data on a map, styling the data however we see fit. For example, take a look at the map that follows:
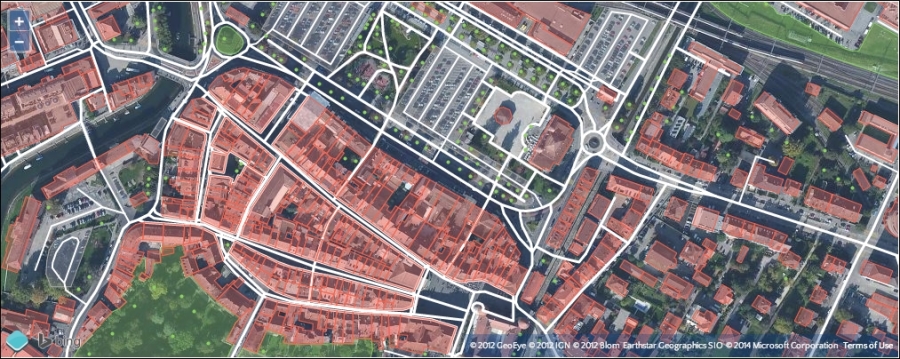
It shows a map with a Bing satellite raster layer and a vector layer on top of it. The vector layer loads data using the OSM XML Vector source and draws it in real time with different styles based on the type and attribute of each feature (the individual points, lines, and polygons). In this example, a small subset of the OSM data has been requested and is styled by OpenLayers to highlight roads (white lines), parking lots (gray polygons), buildings (red polygons), green space (in green, of course) and the location of trees (the green dots). We'll cover vector styles in detail in Chapter 6, Styling Vector Layers.
With a raster image, what you see is what you get. If you were to look at some close up satellite imagery on your map and see a bunch of buildings clustered together, you wouldn't necessarily know any additional information about those buildings. You might not even know they are buildings. Since raster layers are made up of images, it is up to the user to interpret what they see. This isn't necessarily a bad thing, but vector layers provide much more.
With a vector layer, you can show the actual geometry of the building and attach additional information to it—such as its address, who owns it, its square footage, and so on. As we'll see later in this chapter, it's easy to put a vector layer on top of your existing raster layers and create features in a specific location. We'll also see how we can get additional information about features just by clicking or hovering our mouse over them.
We can display any type of geometric shape with the vector layer—points, lines, polygons, squares, markers, any shape you can imagine. We can use the vector layer to draw lines or polygons and then calculate the distance between them. We can draw shapes and then export the data using a variety of formats, then import that data in other programs, such as Google Earth. These are just a few basic cases though, and throughout this chapter, you'll see how powerful the vector layer can be.
Another fundamental difference is that the vector layer is a client side layer. This means that interaction with the actual vector data happens on the client side. When you display vector data, for instance, its visual representation is generated by OpenLayers in response to the rules you define in your code. Raster data looks the way it looks and you can't easily change the color of roads or decide not to display buildings. When you navigate your map, vector data is generally already available and can be displayed immediately. With raster layers, each time you zoom in or out, OpenLayers has to request more image tiles from the server and wait for them to arrive unless they are already in the browser cache.
Since, in most cases, the vector data is loaded on the client side, presentation of and interaction with the vector layer usually happens nearly instantaneously. However, there are some practical limitations. Most vector sources make a lot more data available than can be loaded and rendered in the browser. Network bandwidth, memory and processor speed all have limits and, although computers and web browsers are getting faster and more powerful all the time, there are always practical boundaries to what can be done with vector data. The OpenLayers developers have worked hard to push these boundaries and many things that were impossible to consider even two years ago are now practical—we'll highlight some best practices along the way.
In computer graphics, there are essentially two types of data: raster and vector. The majority of image files—.jpeg, .png, .gif, and other bitmap image formats—are raster images. A photograph, for example, is a raster image. A raster image is a rectangular grid—like graph paper—of color information, and each color point in an image is called a pixel. When you look at a raster image on your computer, it interprets the color information in each pixel and maps this to physical pixels on your screen. As you zoom in on a raster image, there is a point at which each pixel in the raster image can be rendered to a single physical pixel on your screen. This is referred to as the resolution of the image, the most information that the image can accurately represent. As you zoom in further, each pixel in the raster image is drawn into more than one physical pixel and the quality of the image starts to degrade—we say it is pixelated. When you zoom out, each pixel in the raster image requires only part of a physical pixel on the screen and so several adjacent raster pixels are combined to compute a color to display in the physical pixel.
A vector, on the other hand, encodes information about how to draw a particular shape. There might be many ways of representing vector shapes—a straight line can be represented as a starting point and an ending point, or a starting point, direction and distance. When you display a vector on a computer screen, it has to be converted from its encoded format into colors for physical pixels—a process called rasterization. However, because the computer has detailed instructions on how to draw the shape, it can choose a resolution that exactly matches the physical pixels of your computer display every single time it draws it, regardless of how much you zoom in or out. In fact, the same vector information can be drawn on any other screen at the appropriate resolution. For this reason, we often call vector data resolution independent.
Here is an example of how a circle appears when drawn as a vector and a raster. The left side is rendered as a vector and the right side is rendered as a raster. When the image is zoomed, the vector remains sharp and clear but the raster becomes blocky.
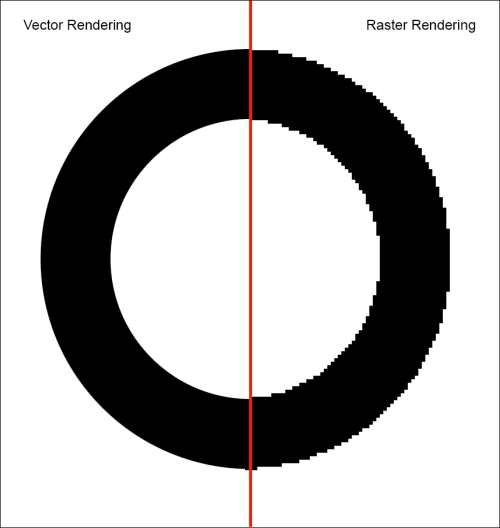
We'll begin by creating a basic vector layer. Start a new page using the sandbox template. We'll use some existing vector data (found in the assets/data folder of the sample code that comes with this book) that contains polygons outlining countries of the world and display it in a map:
<script> tag to create our vector layer:var vectorSource = new ol.source.GeoJSON({
projection: 'EPSG:3857',
url: '../assets/data/countries.geojson'
});
var vectorLayer = new ol.layer.vector({
source: vectorSource
});var center = ol.proj.transform([0, 0], 'EPSG:4326', 'EPSG:3857');
var view = new ol.View ({
center: center,
zoom: 1,
});map variable and add the vector layer the same way you would add any other layer:var map = new ol.Map({
target: 'map',
layers: [vectorLayer],
view: view
});
Zoom in on the countries and notice how quickly the map zooms and how sharp the outlines of the countries remain.
We just demonstrated how easy it is to incorporate vector data into a map. First, we created a source, specifically one that knows how to read features in the GeoJSON format. We told the source where to find the data (its url property) and what projection we need the data to be in (The view's projection is EPSG:3857, a standard Spherical Mercator projection used in many common commercial maps such as Google and Bing. We'll discuss projections in more detail in Chapter 7, Wrapping Our Heads Around Projections). Next, we created a vector layer and provided it with the source we just created. The view object centers the map at 0 degrees latitude and longitude, and we added all of this to the map in the same way we've used in all the other examples.
Vector layers tend to be very quick, as the data can be stored entirely on the client. Interaction happens instantly, which can greatly enhance the user's experience. Which of the following would be good choices for using vector layers?
Now, before we jump into more advanced uses of the vector layer, first, let's see how it actually works.
There are five things we need to cover to understand how the vector layer works:
Recall from Chapter 3, Charting the Map Class that OpenLayers supports three separate renderer technologies, WebGL, Canvas, and DOM. When OpenLayers draws the layers in a map, it uses one of these renderers to do the actual work of drawing. The renderer requests data from the layer's source for the area being displayed, and then transforms this into the final map image. For raster layers, images are fetched from a remote server and are composited into a Canvas element (for WebGL and Canvas renderers) or <img> tags (for the DOM render). Vector layers work in the same way, but are only supported by the Canvas renderer at the time this book was written. The renderer asks the layer's source to fetch the data it needs and then applies algorithms for rendering the vector data to the Canvas element. As we mentioned earlier, the vector data is not just an image. It can contain additional information such as the coordinates of the data. This additional information can be used for styling features (which we'll cover in detail in the next chapter) or to provide interactive feedback (as we'll see in an example later in this chapter).
The vector layer, by itself, is a layer like the other layers we've discussed so far. To really get the most out of the vector layer class, we'll be working mostly with other classes. For example, to get a basic example working (like the first one in this chapter), we will make use of at least one other class—the ol.source.Source class—to read features from a particular vector format. In fact, under the hood, OpenLayers was using a format, features, geometries, and some styles for this example. All of this happens automatically for the simplest case of drawing some vector data, but in practice, it's necessary to understand how these other classes function as well to get the most out of OpenLayers.
Before we get into too much detail, let's cover the vector layer class, ol.layer.Vector, itself. It is a direct subclass of ol.layer.Layer and inherits its methods and observable properties. Refer to Chapter 2, Key Concepts in OpenLayers if you need a refresher on those methods.
The ol.layer.vector class is used to create a vector layer instance:
var layer = new ol.layer.vector(options);
The options can include all the options for ol.layer.Layer (see Chapter 4, Interacting with Raster Data Source for a refresher if necessary) plus the following additional options that are specific to a vector layer:
The vector layer class also has several methods in addition to those it inherits from ol.layer.Layer.
The vector layer class by itself isn't very useful—it relies on other classes to do all the interesting work. Let's look at the source class, ol.source.vector, and its subclasses first as it's the only thing that is absolutely needed to get a working vector layer.
The vector source class is named after its purpose—to be a source of vector features for a vector layer. It is responsible for fetching features when needed, providing them to the vector layer for rendering, and also for retrieving features based on various criteria. We won't actually use the vector source class as it is a base class for the classes we'll actually be using, such as ol.source.GeoJSON in the preceding example. The following diagram shows how the vector source classes fit together in the OpenLayers architecture:
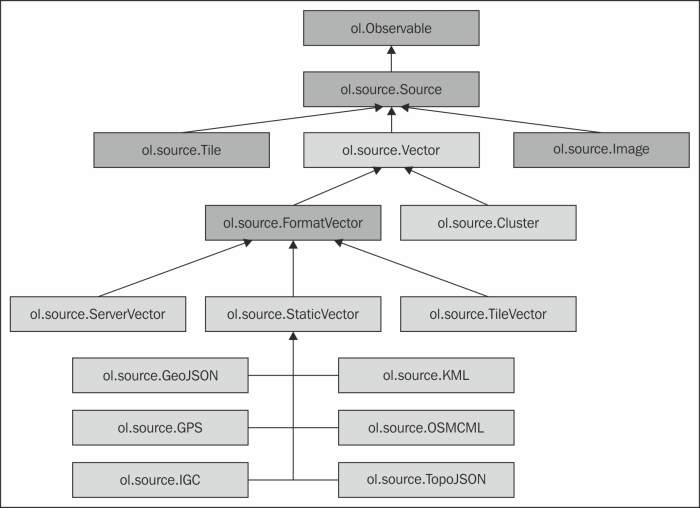
As you can see, there are quite a few classes in the OpenLayers library that deal with vector formats. The classes that you can create new objects from are highlighted in green. We'll briefly describe each class before we get into more detail:
ol.source.Vector: This is the base class for all vector sources. It provides a common API for accessing features in a vector source.ol.source.Cluster: This source automatically groups features together when they are close to each other, and represents the group as a single feature. The cluster source uses another vector source to access features to be clustered.ol.source.FormatVector: This class provides a common API for sources that use a format for reading and writing features. You cannot create an instance of this class.ol.source.ServerVector: This source uses a loader function that can retrieve vector features on the fly from a server, for example, a WFS (Web Feature Service) server.ol.source.TileVector: This source loads vector features in batches based on a tiling scheme similar to how raster layers load image tiles.ol.source.StaticVector: This source loads vector features from a file in a specific format. It is considered static in that all the available features are read from the file when it is loaded. Although you can create an instance of this class, you will normally use one of the format-specific subclasses.ol.source.GeoJSON: This source reads a file containing features in the GeoJSON format, a standardized encoding of geographic features using JSON.ol.source.GPX: This source reads a file containing features in the GPX (GPS Exchange format), a common file format for GPS devices.ol.source.IGC: This source reads a file in the IGC (International Glider Commission) format, a standard format for recording glider flights.ol.source.KML: This source reads a file in the KML (Keyhole Markup Language), an XML-based format used in Google Maps and related products.ol.source.OSMXML: This source reads a file using the Open Street Map XML schema.ol.source.TopoJSON: This source reads a file encoded in JSON using the TopoJSON specification, an extension of GeoJSON that encodes topology information.The vector source class, ol.source.vector, not only provides a common API for all vector sources but is also be instantiated and used directly. All of its subclasses primarily deal with actually retrieving vector features, but all the useful methods for actually interacting with features once they have been processed exist in this class. You can use this class if you have an existing set of vector features or are getting features in some way not directly supported by the subclasses. Some examples might include:
The vector source constructor takes the following options:
The vector source also provides the following methods:
The vector source can trigger the following events:
There are two subclasses of the vector source, FormatVector and Cluster. The FormatVector class is the basis for many subclasses that obtain features by reading them from some specifically formatted data such as GeoJSON or KML. We'll look into these classes shortly, but first let's take a brief look at the cluster source.
The cluster source dynamically groups (or clusters) features that are near each other based on the current resolution, or zoom level, of a map's view and represents those groups as individual features. It does this by finding features within a certain distance of each other and creating a new feature to represent them. The new feature contains a reference to the original features that are represented by the clustered feature.
Creating a cluster source is the same as creating a vector source except the constructor options include two additional properties:
The cluster source may be used with any type of feature, but it is typically used with a set of point features. This example illustrates using the cluster source with some randomly generated points that are included with the sample files for this project in assets / data / cluster.geojson. We'll first show the original data, then modify the example to use the cluster source. The following are the steps:
var originalSource = new ol.source.GeoJSON({
url: '../assets/data/cluster.geojson'
});var originalLayer = new ol.layer.vector({
source: originalSource,
});layers array:var map = new ol.Map({
target: 'map',
layers: [vectorLayer, originalLayer],
view: view
});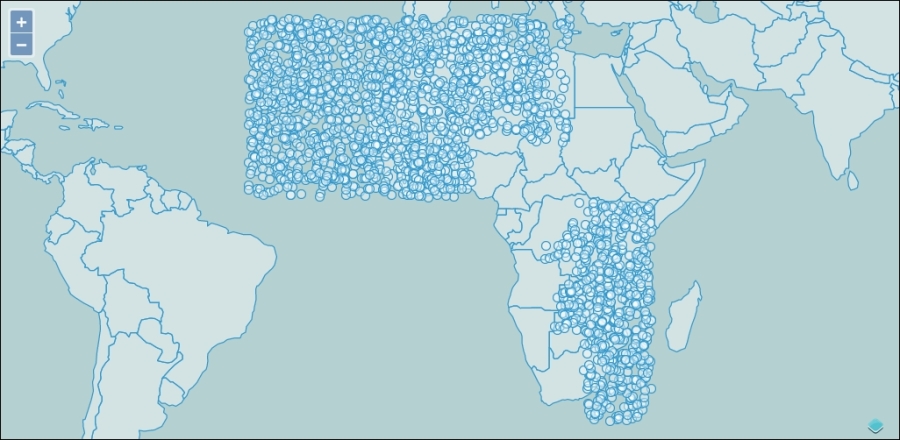
originalLayer:var clusterSource = new ol.source.Cluster({
source: originalSource
});
var clusterLayer = new ol.layer.vector({
source: clusterSource,
});originalLayer with clusterLayer in the map's layers:var map = new ol.Map({
target: 'map',
layers: [vectorLayer, clusterLayer],
view: view
});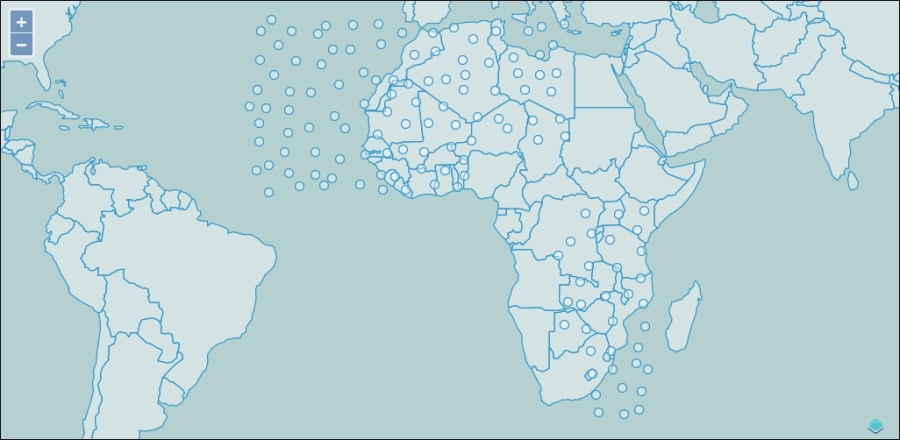
In this example, we discovered how the cluster source works. First, we created a vector layer containing about 5000 points and displayed it on the map. As we saw, it's very hard to see these points when zoomed out. Next, we added a cluster source and a new layer based on the cluster source. Now the number of points displayed on the map changes dynamically as we zoom in and out, and the number of points on the map at any one time is much more manageable.
Typically, when displaying a cluster of features, we would represent the cluster differently depending on how many features are in the cluster—perhaps by adding a text label or changing the size of the point. We'll revisit this example in the next chapter and deal with the styling options then.
The other direct subclass of the vector source is the FormatVector source. This class cannot be directly created, rather it is an abstract class that adds a single method, readFeatures, to the API of all its concrete subclasses. This means that all the other source classes provide a readFeatures method that gets features from some data structure such as a string, array, or JavaScript object. The type of the data structure is determined by the format.
A feature format is responsible for reading features from a structured format that organizes spatial features in a structured way. Each feature format is based on a recognized specification document that defines how that format represents the geospatial data it contains. The feature formats are organized into three distinct groups:
There are two JSON-based formats, GeoJSON and TopoJSON. The GeoJSON format defines a schema used to represent spatial data as JSON data. JSON looks a lot like JavaScript object literals, but it has specific rules for formatting. The main differences between JSON and JavaScript object literals are:
To find out more about the JSON format, see http://www.json.org.
A GeoJSON file may contain either a Feature or FeatureCollection. A Feature is represented in JSON as an object with three keys: type, geometry, and properties. The type is always "Feature". The geometry is an object with a type and coordinates, where the type can be one of "Point", "MultiPoint", "LineString", "MultiLineString", "Polygon", "MultiPolygon", or "GeometryCollection", and the coordinates are an array containing the coordinates in a structure dependency on the type. The properties key is an object that contains keys and values representing nonspatial data associated with the feature.
A FeatureCollection is represented as an object containing two keys: type and features. The type is always "FeatureCollection" and features is an array of GeoJSON features structured as in the preceding paragraph.
An example of a Feature looks like the following:
{
"type": "Feature",
"geometry": {
"type": "Point",
"coordinates": [125.6, 10.1]
},
"properties": {
"name": "Dinagat Islands"
}
}A FeatureCollection looks like the following:
{ "type": "FeatureCollection",
"features": [
{ "type": "Feature",
"geometry": {"type": "Point", "coordinates": [102.0, 0.5]},
"properties": {"prop0": "value0"}
},
{ "type": "Feature",
"geometry": {
"type": "LineString",
"coordinates": [ [102.0, 0.0], [103.0, 1.0], [104.0, 0.0], [105.0, 1.0] ]
},
"properties": {
"prop0": "value0",
"prop1": 0.0
}
},
{ "type": "Feature",
"geometry": {
"type": "Polygon",
"coordinates": [ [ [100.0, 0.0], [101.0, 0.0], [101.0, 1.0],[100.0, 1.0], [100.0, 0.0] ] ]
},
"properties": {
"prop0": "value0",
"prop1": {"this": "that"}
}
}
]
}As you might imagine, this structure is quite easy to use with JavaScript applications and GeoJSON is a popular format for web mapping applications. Read more about this format at http://geojson.org.
The TopoJSON format is an extension of the GeoJSON format that encodes topology. A discussion of topology is beyond the scope of this book; briefly, topology defines rules for representing spatial features in a region. The most common example of this is adjacent polygons sharing a common border. Topological rules require two adjacent polygons sharing a common boundary will share the points that define the common boundary between them such that moving one point changes the boundary of both polygons simultaneously. You can find out more about the TopoJSON format at https://github.com/mbostock/topojson.
The XML formats are based on XML, a metalanguage that describes structured content using tags denoted by the < and > signs. HTML, which we've seen many times in this book already, looks like XML, and the tags in HTML instruct a web browser how to render the page.
Most HTML is not valid XML. HTML does not follow the strict formatting rules required by XML— particularly, there are many tags in HTML that do not require a closing tag. The <img> tag is an example of this. There is a variant of HTML, called XHTML, that defines a valid XML schema for HTML. While there are some advantages to using XHTML, it has not gained widespread adoption because it is more work for developers to ensure a valid document and the perceived benefits are low.
Structured documents based on XML have a specific set of tags and a set of rules on tag content and nesting. Collectively, the tags and rules are called a schema. There are several geospatial formats based on XML and each defines a specific schema. The schema allows developers to write code to parse the spatial information out of the structured document in the same way that the GeoJSON format proscribes a specific JSON object structure.
The XML-based formats are GML, GPX, KML, OSM XML, and WFS. Let's describe each briefly:
While all the formats we've discussed so far can be represented in a plain text file, the text formats differ in that they are not based on standard representation. Rather, they define their own unique structure. There are currently two text formats supported by OpenLayers—IGC and WKT.
Now, we know something about formats, let's look at the next class in the vector source hierarchy—StaticVector. OpenLayers provides the StaticVector source and some format-specific subclasses designed to simplify loading vector features from the supported formats. They are as follows:
ol.source.GeoJSONol.source.TopoJSONol.source.GMLol.source.GPXol.source.KMLol.source.OSMXMLol.source.IGCol.source.WKTEach of these is a vector source that works in exactly the same way, the only difference between them is the format they use internally to read features.
The StaticVector source, as the name suggests, loads a set of vector features from a source that does not change. This means the features are loaded, and parsed, just once, The actual features in the source never change in response to panning or zooming. In all other respects, the StaticVector source works in the same way as the other vector sources.
You can create an instance of StaticVector directly and pass it a format and a source of data, or you can use one of the format-specific subclasses. Let's look first at creating StaticVector instance. Note that several of the options only apply for particular formats, as noted in the description.
It is worth emphasizing at this point that for all the OpenLayers formats, the data stored in files are actually text files. Loading these files in a browser will result in the data being loaded as a JavaScript string. Some libraries will automatically convert data from its text-based representation into another type of object for you. For instance, loading XML data from a text file will often give you a reference to a Document Object after it is loaded. In OpenLayers, every format supports loading data from a string value, but the string must contain data that is in the structure expected by the format.
The actual format-specific source classes generally work the same way and support only those options that make sense from the StaticVector class. However, there are some important differences that are worth noting. All the following source constructors support the attributions, logo, text, url, and urls options listed in the preceding table. For the sake of brevity, these options have been omitted from the following tables.
The two JSON formats, ol.source.GeoJSON and ol.source.TopoJSON, support the two additional constructor options. These are shown in the following table:
The GPX format constructor has no additional options, but will read data from the node and doc options.
The KML format specification requires that the geometry data for features be represented in EPSG:4326. In addition to supporting the node and doc options, the KML format supports two other options. Refer to the following table:
Time to put our new knowledge into action. There are sample files included with the book's code samples in assets / data in each of the formats discussed earlier. Try adding each of them to a map. Remember, you will need to create an appropriate source and a vector layer, and add the vector layer to the map. As with earlier examples, you should be able to use the url option to load the data without having to load and parse it yourself.
The ServerVector source requests features from a server by sending the geographic coordinates of some region it needs features for to a server. As you might imagine, there are many different ways of doing this based on what a particular server understands. Each server has its own unique language for requesting features. Many servers implement a common language based on an open standard called WFS (Web Feature Service) that can simplify the job. Even so, there are different versions and different flavours of WFS that make it difficult to support them all. To avoid this problem, OpenLayers provides a generic mechanism for requesting features for the ServerVector source; specifically it requires that you implement the loader function yourself!
Creating a loader function isn't as hard as it might sound, let's walk through a concrete example that loads features from a WFS server. In this example, we will be using the popular jQuery library to help us load data. If you are not familiar with jQuery, see http://jquery.com for more information.
<script> tag to load jQuery:<!doctype html>
<html>
<head>
<title>vector Examples</title>
<link rel="stylesheet" href="../assets/ol3/ol.css" type="text/css" />
<link rel="stylesheet" href="../assets/css/samples.css" type="text/css" />
</head>
<body>
<div id="map" class="map"></div>
<script src="../assets/ol3/ol.js" type="text/javascript"></script>
<script src="//code.jquery.com/jquery-1.11.0.min.js"></script>
<script>
var tiledRaster = new ol.layer.Tile({
source: new ol.source.OSM()
});
var center = ol.proj.transform([-72.6, 41.7], 'EPSG:4326', 'EPSG:3857');
var view = new ol.View({
center: center,
zoom: 12,
});
var map = new ol.Map({
target: 'map',
layers: [tiledRaster],
view: view
});
</script>
</body>
</html>Next, we'll need to create a style object for displaying our vectors. Don't worry too much about what this is, we'll cover it in detail in Chapter 6, Styling Vector Layers. Add this after the tiledRaster and before the center:
var fill = new ol.style.Fill({
color: 'rgba(0,0,0,0.2)'
});
var stroke = new ol.style.Stroke({
color: 'rgba(0,0,0,0.4)'
});
var circle = new ol.style.Circle({
radius: 6,
fill: fill,
stroke: stroke
});
var vectorStyle = new ol.style.Style({
fill: fill,
stroke: stroke,
image: circle
});vector_template.html and make a copy of it to use for the rest of this example. We'll be using vector_template.html as the starting point for several examples.vectorStyle object, which will handle loading features from the remote server:var vectorLoader = function(extent, resolution, projection) {
var url = 'http://demo.boundlessgeo.com/geoserver/wfs?service=WFS&' +
'version=1.1.0&request=GetFeature&typename=osm:builtup_area&' +
'outputFormat=text/javascript&format_options=callback:loadFeatures' +
'&srsname=EPSG:3857&bbox=' + extent.join(',') + ',EPSG:3857';
$.ajax({
url: url,
dataType: 'jsonp'
});
};
var loadFeatures = function(response) {
var features = vectorSource.readFeatures(response);
vectorSource.addFeatures(features);
};loadFeatures function:var vectorSource = new ol.source.ServerVector({
format: new ol.format.GeoJSON(),
loader: vectorLoader,
strategy: ol.loadingstrategy.createTile(new ol.tilegrid.XYZ({
maxZoom: 19
})),
projection: 'EPSG:3857',
});
var serverVector = new ol.layer.vector({
source: vectorSource,
style: vectorStyle
});serverVector layer to the map's layers:var map = new ol.Map({
renderer: 'canvas',
target: 'map',
layers: [tiledRaster, serverVector],
view: view
});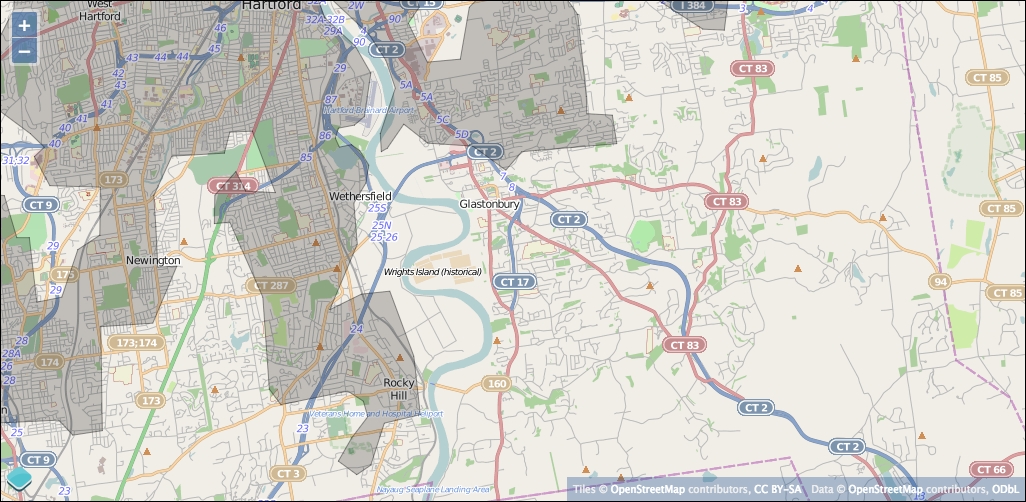
We just created a vector layer that reads features from a remote WFS server as the map is panned and zoomed. A lot just happened, so let's review each step in detail.
In step 1, we set up a new OpenLayers application using the same structure as we've used for all the other examples so far. Nothing new here, except we've chosen a center for the map view somewhere in the north eastern United States and named our base layer tiledRaster to help differentiate it from the vector layers we will be working with.
In step 2, we created a simple vector style object to use with all our vector layers. A vector style consists of several components, in this case, we are defining the style to use for fill (polygons), stroke (lines), and image (points). The color for each is defined using the rgba() syntax, which stands for red, green, blue, and alpha (opacity). In this case, we are using a simple black color and 20 percent opacity. We'll cover styles in much more detail in the next chapter.
Step 4 is really the heart of this example. First, we defined a vectorLoader function. This function is used by ol.source.ServerVector to fetch features from a remote server. The vectorLoader function declares a URL that points to a WFS server. You might think the URL looks a bit complicated, and you are right. For now, just trust that it does the right thing, which is to ask the server for all the vector features contained within the current extent. The jQuery ajax function is used to actually trigger loading the URL. The jsonp data type tells jQuery to request the data by inserting it as a <script> tag, and the callback option in the URL identifies the function that will be executed when the <script> tag is loaded; in this case, the loadFeatures function.
The loadFeatures function takes the features provided by the server, reads them using the vector source (which has a GeoJSON format for parsing the data), and adds them to the layer.
In step 5, we combined all the previous pieces to create the source and layer objects. To define the source, we used ol.source.ServerVector and provided it with a format (GeoJSON in this case), the loader function we defined in the previous step, a loading strategy, and a projection. We'll discuss the loading strategy a bit later. Finally, we created the actual layer object using ol.layer.vector and provide it with our source and style.
After we added this to the map's layers in step 5, we can see it in action. Every time the map is panned or zoomed, the vector layer checks its source for features. The ServerVector source requests data from a remote server using a function that we provide. This gives you a lot of flexibility, but also means that you have to understand how to load data from a remote server. Fortunately, libraries such as jQuery have very good convenience methods for doing just this. The ServerVector source uses its loading strategy to decide how to divide up the requests to the server and passes the appropriate parameters to your loader function. We'll talk a bit more about loading strategies in some time. Once the features are loaded, you can parse them and add them to the source directly. The vector layer then draws the features using the provided style.
To see what happens when features are requested from the server, open Web Inspector, switch to the Network tab, and make sure All is selected, then reload the page.
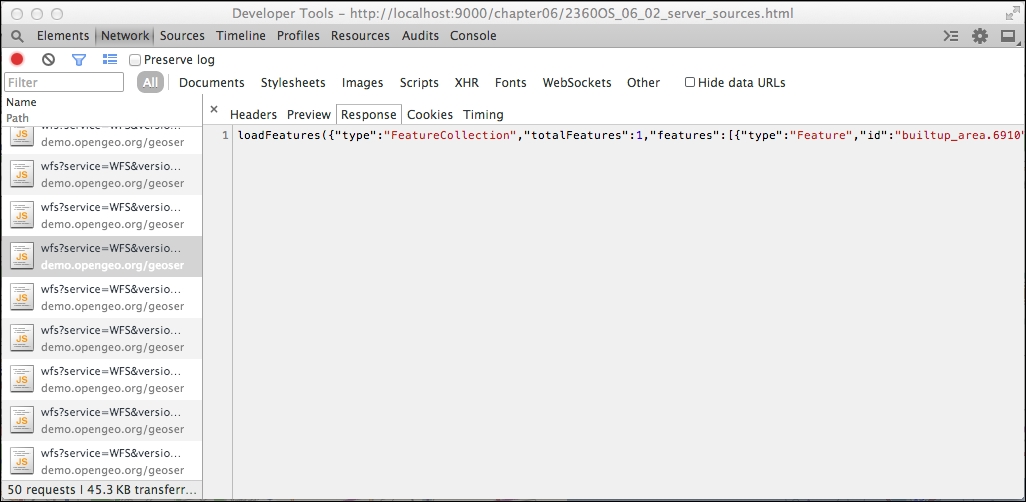
You can identify the feature requests because they start with wfs?service=WFS. Click on a request to view its response. Notice how some requests have no features, and some have features. Notice how the response is formatted—it looks like a JavaScript function call to loadFeatures() with an object literal as the argument. The loadFeatures() function is the one we specified and that we implemented. This is an example of how jsonp works.
Now that we've seen it in action, let's review the constructor options for a ServerVector source:
The final vector source is TileVector. This source loads features by requesting them in batches based on a tile grid exactly the same way that the raster sources work. The job of a tile grid is to divide the world up into rows and columns and convert geographic coordinates for the current view into row and column references.
If you were following closely in the previous section, you might wonder how TileVector is different from a ServerVector configured with a loading strategy based on ol.loadingstrategy.createTile. The main differences are as follows:
TileVector source has its own loading functionality—you do not need to provide one.TileVector source uses the row, column, and zoom level rather than geographic coordinates to request features from the server.TileVector source provides convenient options for working with tile-based servers.There are several ways of producing and serving vector tiles. One way is to use a program that splits vector data up into tiles based on a particular tile grid and save the tiles to disk in a directory structure based on the zoom level, column,and row. Another way is to use a server that can split up vector data on the fly. The OpenStreetMap wiki has a page dedicated to vector tiles and related resources at http://wiki.openstreetmap.org/wiki/vector_tiles.
The use of a tile grid removes the need to implement a loader function; so, there is less work involved in setting it up. Let's see how easy it is to use the TileVector source:
serverVector layer is defined:var tiledSource = new ol.source.TileVector({
format: new ol.format.TopoJSON({
defaultProjection: 'EPSG:4326'
}),
projection: 'EPSG:3857',
tileGrid: new ol.tilegrid.XYZ({
maxZoom: 19
}),
url: 'http://{a-c}.tile.openstreetmap.us/vectiles-water-areas/{z}/{x}/{y}.topojson'
});var tiledVector = new ol.layer.vector({
source: tiledSource,
style: vectorStyle
});tiledVector layer instead of the serverVector layer:var map = new ol.Map({
renderer: 'canvas',
target: 'map',
layers: [tiledRaster, tiledVector],
view: view
});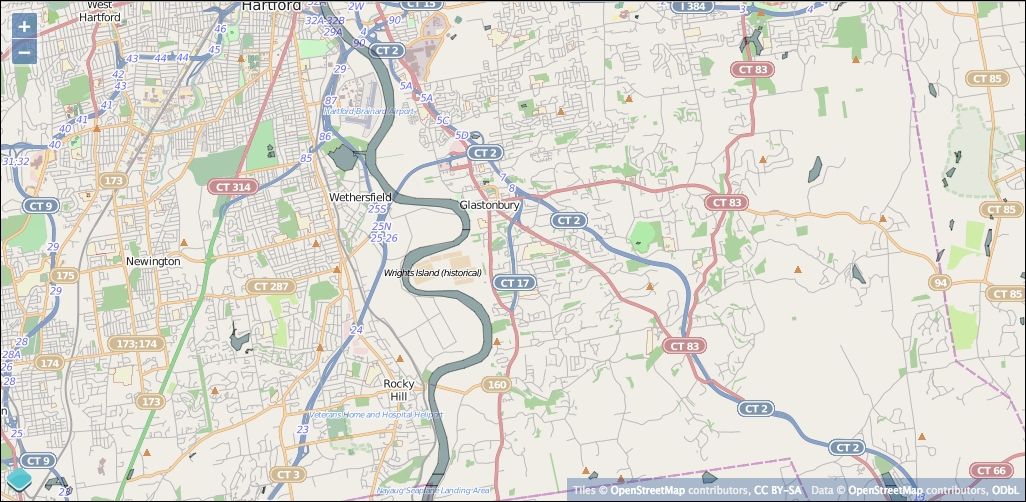
As you can see, the TileVector source is quite a bit simpler than the ServerVector source. For the TileVector, we provided a format, a projection to convert vector features into (typically, the projection used with the map's view), a tileGrid, and a url. The format specifies what format the features will be in, which tells OpenLayers how to read features from the tiles sent by the server. It also can specify the projection used for the features. In this example, the server provides files in the TopoJSON format, a variant of GeoJSON that encodes topology, in a projection of EPSG:4326 (latitude and longitude). The tileGrid tells OpenLayers how to convert geographic coordinates into rows and columns that the server will understand. You can't just use any tileGrid with any server—it's very important that the tileGrid matches what the server expects. The XYZ tile grid, however, is a very common grid used by most tile servers, both raster and vector. The url property tells OpenLayers where to request each tile from. There are some special placeholders that you can put into a url that OpenLayers will replace on the fly when requesting a specific tile:
{z}: This will be replaced by the current zoom level.{y} or {-y}: This will be replaced by the row of the tile. The {-y} option inverts the y axis, this is needed for some servers.{x}: This will be replaced by the column of the tile.After defining the source, it can be used with the vector layer in the same way the ServerVector source was used, and the layer is added to the map in the same way too.
The result is that when you load the browser, OpenLayers will request vector tiles from the server and render them using the style we defined.
To see what happens when vector tiles are requested, open Web Inspector, switch to the Network tab, and make sure All is selected, then reload the page. You will see the requests that fetch the vector tiles end with the .topojson extension:
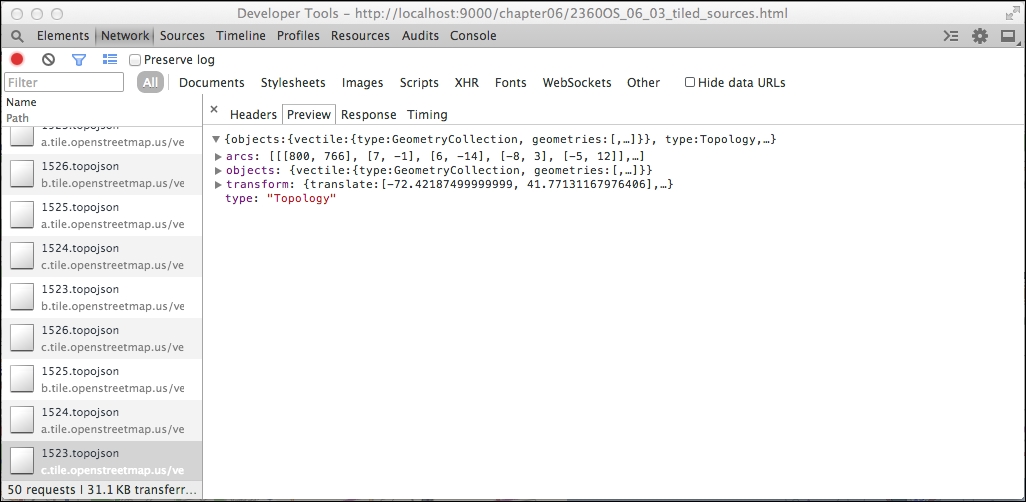
Click on some requests and view the responses. Do you see the difference between this and the ServerVector responses? Here, the features are returned directly as a JavaScript object while in the previous example, they were wrapped in a JavaScript function call.
Look through the requests for the raster tiles they are the ones that end with .png. You should be able to find a raster tile for each vector tile because they are using the same tileGrid.
One of the side effects of using vector tiles is that vector features such as lines and polygons may cross more than one tile and will be split up into different features. If you are rendering polygons with a stroke, or lines with dashed styles, you will see some interesting effects at the edges of the tile boundaries. We can see an example of this when first loading the TileVector, in this particular case. The river that runs vertically through the center of the map has several horizontal lines in it that coincide with the tile boundaries. Line features are typically less affected and point features shouldn't be affected at all. You can use polygon features, but you will probably want to render a fill style only to avoid artifacts at the tile boundaries.
Now, we've seen it in action, let's review all the options available when using a TileVector source:
Loading static sources programmatically is very useful, but let's say you want to look at a new GeoJSON file you just found. Opening up your text editor and coding up a quick viewer is pretty easy, but it takes some time, and perhaps, you'll need to check the API documentation (or this chapter!) to recall the exact details. Wouldn't it be nice if you could just drag your new GeoJSON file onto a map and view it without writing any code? Guess what, you can!
vector_template.html file and add a DragAndDrop interaction after the vectorStyle is defined:var dragAndDrop = new ol.interaction.DragAndDrop({
formatConstructors: [
ol.format.GPX,
ol.format.GeoJSON,
ol.format.IGC,
ol.format.KML,
ol.format.TopoJSON
]
});DragAndDrop interaction will fire an event that can be used to actually add the features to the map:dragAndDrop.on('addfeatures', function(event) {
var vectorSource = new ol.source.vector({
features: event.features,
projection: event.projection
});
map.getLayers().push(new ol.layer.vector({
source: vectorSource,
style: vectorStyle
}));
view.fitExtent(vectorSource.getExtent(), map.getSize());
});<script> tag.map.addInteraction(dragAndDrop);
assets | data in your file browser and try dragging one of the vector files onto the map.With a few lines of code, we've created a pretty cool vector file viewer. Let's look at how we accomplished this.
In step 1, we created an instance of ol.interaction.DragAndDrop. This class turns the map into a drop target. When you drag a file from the operating system onto a drop target, the browser emits an ondrop event. The DragAndDrop interaction listens for this browser event and attempts to read features from the file using one of the formats. The DragAndDrop interaction allows you to customize the list of formats to be tried through the formatConstructors option. In this case, we've added all the formats.
In step 2, we add a listener for the DragAndDrop interaction's addfeatures event. This event is triggered when the interaction parses features from a file dropped on the map. The event passed to our handler gives us an array of features and the projection of the features. We take the array of features passed to the event handler and create a new vector source with the features and the projection of the features, then create a new vector layer with this source and our style and add it to the map.
The last thing to do is make sure that the map knows about our interaction, which we did in step 3.
We've been using feature objects throughout the chapter so far without really talking about the Feature class itself. We also hinted at the Geometry class, but we haven't gone into any detail so far. This section will cover both classes in a bit more detail so that you can gain a bit more confidence working with them. Don't worry—it's easy, you've already been exposed to both classes.
Before we get into the Feature class, we should go over the Geometry class, as it's used to create the actual geometry objects that make up a feature object.
Although it is perfectly valid to create features without geometries, they can't be represented on a map. Therefore, the Geometry class is, from the map's point of view, the foundation of the feature object. The Feature class uses the Geometry class to store geometry information about the feature.
However, what exactly is the Geometry class? In a nutshell, it stores geographic information in the form of one or more coordinate pairs. Remember the examples from The feature formats section of this chapter where we added features using the Format subclasses? We briefly saw geometries while reprojecting the features into the map view's projection:
for (var i = 0, ii = features.length; i < ii; ++i) {
var feature = features[i];
var geometry = feature.getGeometry();
geometry.applyTransform(transform);
}In this example, we will transform the feature's geometry from its original projection into the map view's projection so that the loaded feature will align with the raster base map correctly. This is just one part of what we can do with geometries.
When working with the Geometry class, we always use one of its subclass. What do we mean? Think about the Format classes we've used earlier in this chapter—we've talked about format but actually used subclasses of the base Format class the entire time (ol.format.GeoJSON, ol.format.KML, and so on are all subclasses of the ol.format.Format class).
We mentioned before that a geometry object stores geographic information as coordinate pairs. A coordinate pair is simply an array of two, three, or four numbers (we'll get to this in a moment) representing a single location on the earth in a given projection. You're already familiar with coordinates, it's the value that we use to set the center of a view in all of the examples. In the OpenLayers documentation, you'll see coordinates represented with the type ol.Coordinate. This looks like a classname, but really it's a type definition specifying an array of numbers representing a location. There are four different ways, called layouts, of representing a coordinate:
To get maximum performance, OpenLayers' Geometry classes store coordinates in so-called flat arrays, meaning all the values of all the coordinates are stored in a single array of numbers. Because the individual coordinates can have two, three, or four values, all the Geometry classes need to know the layout of the coordinates they are storing.
Before we cover the subclasses, let's quickly go over some of the methods available to all of the subclasses via the base Geometry class. All these methods are available to any Geometry subclass, as all the subclasses inherit from the Geometry class:
There are two direct subclasses of ol.geom.Geometry—ol.geom.SimpleGeometry and ol.geom.GeometryCollection. The GeometryCollection class, as the name suggests, treats several geometries as a single geometry object. The SimpleGeometry class is the base class for geometries we can actually use to represent specific shapes—points, lines, polygons, and so on. Let's look at the SimpleGeometry class and its subclasses first.
We don't use the SimpleGeometry class directly, but it is the base class for all the basic geometry types that OpenLayers understands. We'll look first at the methods provided by SimpleGeometry to all the subclasses, then look at the subclasses themselves:
|
Method |
Parameters |
Description |
|---|---|---|
|
|
| |
|
|
| |
|
|
|
This returns the layout (XY, XYZ, XYM, or XYZM) of the geometry. |
The Point class represents a single point, and MultiPoint is a collection of points. A Circle class is a special case of the Point class that includes a radius property. All take coordinates as the first argument to the constructor. Both Point and Circle expect a single coordinate, while MultiPoint expects an array of coordinates. A Circle takes a second argument, the radius. All take an optional final argument, the layout, which defaults to XY. Here are some examples of creating each type:
var point = new ol.geom.Point([1, 2]); var multipoint = new ol.geom.MultiPoint( [ [1,2], [2,3] ]); var circle = new ol.geom.Circle([1,2], 2);
The LineString class represents a sequence of two or more coordinates that are connected to form a line. As with MultiPoint, MultiLineString is a collection of lines. A LineString is constructed with an array of coordinates, while MultiLineString is created with an array of arrays of coordinates. Both take the layout as an optional final argument, the layout, which defaults to XY. Here are some examples of each:
var line = new ol.geom.Line([ [1, 2],[2,3],[3,4] ]); var multipoint = new ol.geom.MultiPoint([ [ [1,2],[2,3],[3,4], [ [4,5],[5,6] ] ]);
The Polygon class is composed of one or more LinearRing classes. A linear ring is a sequence of three or more coordinates that forms a closed ring, that is, the last coordinate is the same as the first coordinate. When a polygon contains multiple linear rings, the first is called the outer ring and the rest are interior rings. Interior rings define holes in the polygon. And as you might expect, a MultiPolygon is a collection of polygons. Let's see how to make a linear ring and polygon. As with the other geometry types, the layout can be specified as an optional last argument:
var linearRing = new ol.geom.LinearRing([ [1,2],[2,3],[3,4],[1,2]); var polygon = new ol.geom.Polygon([ [ [-20,-20],[-20,20],[20,20],[20,-20],[-20,-20] ] ]);
The last example only used one linear ring for the polygon. Let's use the Web Inspector's console to create a polygon and then add a linear ring to see what happens. Open the vector_template.html file in your browser and then open the Web Inspector's Console. We'll be typing the commands into the console directly and observing the result on the map.
var polygon = new ol.geom.Polygon([ [ [-20,-20],[-20,20],[20,20],[20,-20],[-20,-20] ] ]);
polygon.transform('EPSG:4326', 'EPSG:3857');var source = new ol.source.vector({
features: [new ol.Feature(polygon)],
projection: 'EPSG:4326'
});
var layer = new ol.layer.vector({
source: source,
style: vectorStyle
});map.addLayer(layer);

var linearRing = new ol.geom.LinearRing([ [-10,-10],[10,-10],[10,10],[-10,10],[-10,-10] ]);
linearRing.transform('EPSG:4326','EPSG:3857');
polygon.appendLinearRing(linearRing);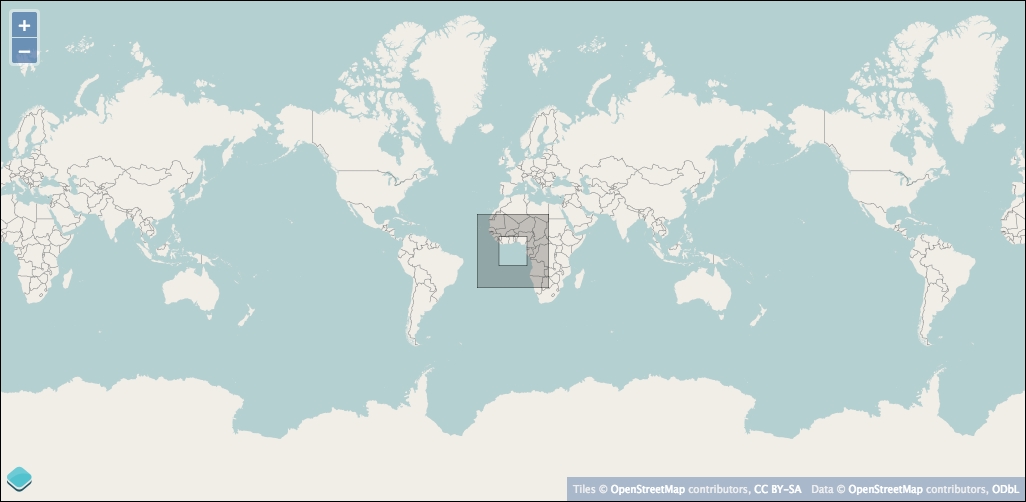
We've just seen linear rings in action. When you create a polygon, the first linear ring is the outer boundary of the polygon and any other linear rings you create define holes in the outer ring.
Try the last example again, only this time add two or more linear rings to the polygon and observe what happens.
The GeometryCollection class, as the name suggests, is a collection of geometry objects. Unlike the MultiPoint, MultiLine, and MultiPolygon classes, a GeometryCollection can contain any type of geometry. You can create an instance of ol.geom.GeometryCollection by passing an array of geometries to it, for example:
var geomCollection = new ol.geom.GeometryCollection([geom1, geom2, geom3]);
Although you can use a GeometryCollection as an ol.geom.Geometry class anywhere, you can't use any of the SimpleGeometry methods on a GeometryCollection. Instead there is a separate API for accessing the geometries managed by the collection.
To complete our discussion of vector layers, we'll finish with the Feature class. We've already seen features in action—in fact, you can't display vector data without them—but we haven't really talked about what they are and what they do.
In the previous section, we explored the various OpenLayers Geometry classes. They contain the geospatial coordinates that represent a particular shape. However, to display a shape on the map, we need to work with features. When we model things in the real world and build data structures to represent their position, we also want to capture other information about them. A polygon representing the outline of a building is an interesting thing to display on a map, but when we click on it, it's pretty reasonable to expect to get some information about the building such as its address, its height, and building type (that is, commercial, industrial, or residential). These nonspatial properties of a feature can also be used to change the style of a shape on the map.
A feature combines these two concepts—the spatial location of a thing, and nonspatial properties of the thing that we are interested in.
Creating a new feature is pretty straightforward; you just need to provide a geometry object (to create a feature with no extra properties) or an object literal containing the geometry and other properties of the feature. For instance, given a point geometry, we can construct a simple feature like this:
var point = new ol.geom.Point([x, y]); var feature = new ol.Feature(point);
To create a feature with information associated with the point, we do it this way:
var feature = new ol.Feature({
geometry: point,
name: 'My Cottage'
});By convention, the geometry key is used to specify the geometry associated with the feature. It's possible, though, to use a different key and the setGeometryName() method to change this. For our purposes, we'll be doing it the default way.
We refer to this extra, nonspatial information associated with a feature as properties. The properties associated with a feature are almost completely free-form and contain any value. The geometry property is really the only exception.
You might wonder why we care about the nonspatial properties of a feature since we can create a feature without them and things work just fine. There are essentially two reasons:
We'll look at the first case—interactive information—in the last example for this chapter. We'll explore the second case in the next chapter when we look more closely at styling vector layers.
Before we jump into our last example, let's look at the methods available on a feature object. Note that Feature class is a subclass of ol.Object and inherits all the Event class and KVO properties, methods, and events. We won't include them here, but if you need a refresher jump back to Chapter 2, Key Concepts in OpenLayers for a moment.
While we are not including the ol.Object methods in this list, it is relevant and important to note that feature properties are treated as object properties. This means that you can:
feature.set(key, value)feature.get(key)feature.on('change:<key>', observerFunction), where <key> is the name of a propertyfeature.setProperties(values)One last thing before our final example—feature objects can have their own styles. Normally, styles are assigned to the vector layer and all features that are rendered as part of that layer use the layer's style. It is possible, however, to assign styles to individual features and that style will be used instead of the layer's style. Because a feature comes from a source, and a source can be used for more than one vector layer, this means that a feature without a style can be rendered differently depending on the layer's style while a feature with a style will be rendered the same way regardless of the different styles on different layers.
To wrap up our chapter on vector layers, let's combine our knowledge of layers, sources, and features and create a small application that displays the name of a country when we hover over it with the mouse:
var source = new ol.source.GeoJSON({
projection: 'EPSG:3857',
url: '../assets/data/countries.geojson'
});
var countries = new ol.layer.vector({
source: source
});
var center = ol.proj.transform([0, 0], 'EPSG:4326', 'EPSG:3857');
var view = new ol.View({
center: center,
zoom: 1,
});
var map = new ol.Map({
target: 'map',
layers: [countries],
view: view
});pointermove event provided by the map object. If you don't remember anything about map events, review Chapter 3, Charting the Map Class:map.on('pointermove', onMouseMove);onMouseMove function:function onMouseMove(browserEvent) {
var coordinate = browserEvent.coordinate;
var pixel = map.getPixelFromCoordinate(coordinate);
var el = document.getElementById('name');
el.innerHTML = '';
map.forEachFeatureAtPixel(pixel, function(feature) {
el.innerHTML += feature.get('name') + '<br>';
});
}<div> element to display the country name, just after the <div> that holds the map:<div id="name"></div>
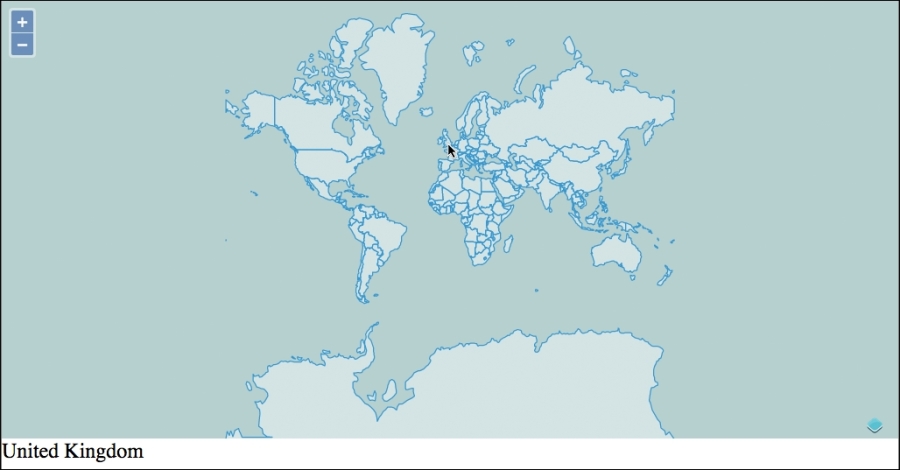
We've just saw how easy it is to interact in real time with vector data sources.
Step 1 just created a vector layer using a static GeoJSON source and added it to the map.
In step 2, we registered for the pointermove event. Recall from Chapter 3, Charting the Map Class that the pointermove event is fired by the map whenever the mouse moves over the map, and it passes a BrowserEvent object that contains, among other things, the map coordinate of the mouse position. Next, we implemented our event handler function. It gets the coordinate from the browser event and finds all features at that coordinate in our country layer's source. If there are any features, we get the name property from the first one and display this in the <div> added in step 4. You may wonder exactly how interactions with your map work behind the scene. Don't worry! We will see them more thoroughly in Chapter 8, Interacting with Your Map.
Vector layers are extremely useful for developing interactive web mapping applications. In this chapter, we've discussed what a vector layer is and its potential limitations. We've explored the various vector data sources that OpenLayers provides, and looked in detail at features and geometries. Through a series of examples, we learned how to load dynamic data from a remote server such as a WFS server, load tiled vector data, load vector data stored in static files, even by dragging them to the map from our file browser, work with geometries and features, and dynamically interact with vector data.
We covered a lot about vector layers, but we're not done yet. It's time to take control of the presentation of our vector data; so, keep reading to learn all about how to use styles with vector layers to really make your maps pop!
By now you should be getting pretty comfortable creating simple OpenLayers maps with a combination of raster and vector data. With raster data, there is no control over presentation, as the saying goes–what you see is what you get. Vector data, on the other hand, gives you direct control over presentation details. We've already alluded to vector styles, and used them in the previous chapter. Now, it is time to take full control of how we present our vector data!
In the last chapter, you saw how powerful the vector layer can be. In this chapter, we'll go a bit deeper and talk about how to customize the appearance of the features within a vector layer. We'll explore the following:
So, what is a vector style? Quite simply, it is a set of instructions about how to draw graphic primitives—the points, lines, polygons, and text that make up our vector features. OpenLayers provides a basic default style that renders features in various shades of blue. While this is quite nice, it's probably not what you'll want to use all the time.
You've already seen an example of a basic vector style in the previous chapter. Let's review it here:
var fill = new ol.style.Fill({
color: 'rgba(0,0,0,0.2)'
});
var stroke = new ol.style.Stroke({
color: 'rgba(0,0,0,0.4)'
});
var circle = new ol.style.Circle({
radius: 6,
fill: fill,
stroke: stroke
});
var vectorStyle = new ol.style.Style({
fill: fill,
stroke: stroke,
image: circle
});This code defines specific rules for the fill, stroke, and image properties of a new ol.style.Style object. The fill and stroke rules specify a color and opacity using the RGBA (Red, Green, Blue, and Alpha) format. The circle style is a special style that draws points as circles of a specific radius with a fill and stroke property. Together, these form a style object that OpenLayers uses to determine how to draw a feature. The fill property is used for filling polygons and circles. The stroke property is used to draw the outline of polygons, lines, and circles. The image property is used for drawing points. There is also a text property that we haven't seen yet.
The vector layer's style property accepts three different ways of specifying styles:
ol.style.Styleol.style.Style instancesWe'll look at style functions in more detail in the second half of this chapter, but briefly, a style function is one that returns an array of style objects to be used for a specific feature and resolution. In combination with feature properties, a style function allows for the implementation of advanced custom styling. Before we can run, we'd better learn how to walk.
We'll start with an example that shows off most of the basic style properties. We'll start with a new HTML page setup the same way we usually start off.
sandbox template and add the standard setup for a map to the main <script> tag:var center = ol.proj.transform([0, 0], 'EPSG:4326', 'EPSG:3857');
var view = new ol.View({
center: center,
zoom: 1
});
var map = new ol.Map({
target: 'map',
view: view
});var countries = new ol.layer.Vector({
source: new ol.source.GeoJSON({
projection: 'EPSG:3857',
url: '../assets/data/countries.geojson'
})
});
var map = new ol.Map({
target: 'map',
layers: [countries],
view: view
});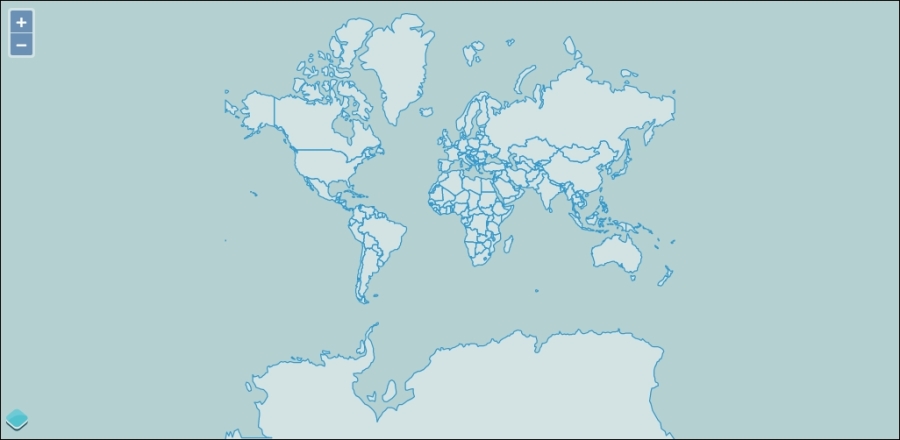
var timezones = new ol.layer.Vector({
source: new ol.source.KML({
projection: 'EPSG:3857',
url: '../assets/data/timezones.kml'
})
});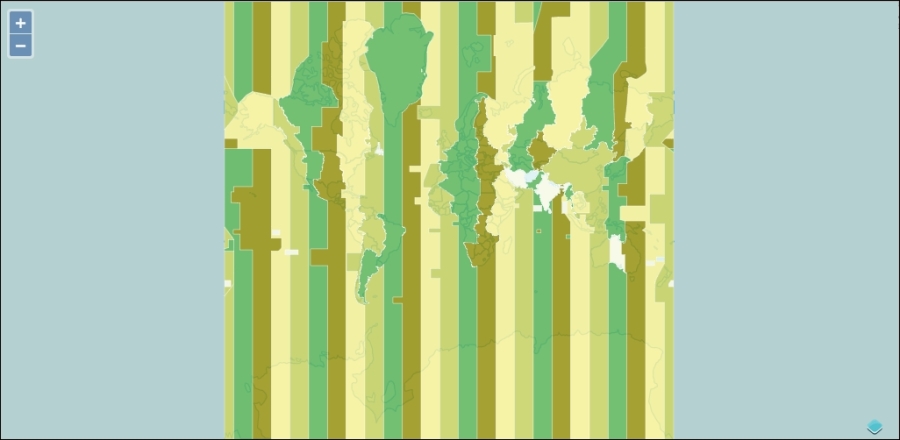
var countryStyle = new ol.style.Style({
fill: new ol.style.Fill({
color: [203, 194, 185, 1]
}),
stroke: new ol.style.Stroke({
color: [177, 163, 148, 0.5],
width: 2
})
});
var timezoneStyle = new ol.style.Style({
stroke: new ol.style.Stroke({
color: [64, 200, 200, 0.5],
}),
text: new ol.style.Text({
font: '20px Verdana',
text: 'TZ',
fill: new ol.style.Fill({
color: [64, 64, 64, 0.75]
})
})
});style property to each of the vector layers so they know which style to use. Also, we'll need to tell the KML source not to extract the default feature styles stored in the KML document:var countries = new ol.layer.Vector({
source: new ol.source.GeoJSON({
projection: 'EPSG:3857',
url: '../assets/data/countries.geojson'
}),
style: countryStyle
});
var timezones = new ol.layer.Vector({
source: new ol.source.KML({
projection: 'EPSG:3857',
url: '../assets/data/timezones.kml',
extractStyles: false
}),
style: timezoneStyle
});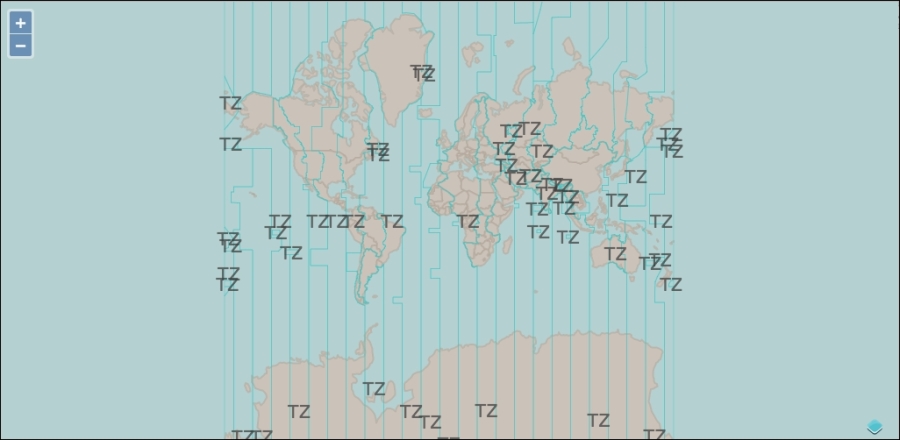
With this example, we are illustrating some of the basic styling capabilities of OpenLayers. We combined two static vector sources—countries and time zones—and some simple styles to create our map.
Step 1 set up the same structure we've been using for all our examples. In step 2, we added the country data using a static GeoJSON source and added it to the map with the default styling. Next, we added the time zone data in step 4 and developed some basic styles for the two layers in step 6. The country data is composed of polygons, so we created a fill style and a stroke style for styling the country layer. The time zone data also contains polygons, but we want to see the countries underneath so we created a separate style with just the stroke and text properties for it.
The text property in this example is somewhat contrived to keep things simple. Showing the same text string for each time zone is not what we'd really want to do. Ideally, we'd display information specific to each time zone—perhaps, the name or number of hours from Greenwich Mean Time. We'll cover how to do this a bit later in the chapter though. The last thing is to assign our custom styles to the appropriate vector layer and turn off the automatic extraction of styles from the KML layer, which happened in step 7.
Now that we've reviewed how basic styles work, let's take a closer look at the style object and the properties we can assign to it. Along the way, we'll illustrate each with a specific example.
The style class, ol.style.Style, contains the drawing instructions to be used when rendering a feature. There are five properties we can use when creating a style property:
As you can see, a style is really a composite of several specific types. Including a property turns on drawing of the relevant type and excluding it turns it off. When you specify the style property for a vector layer, this replaces all the default styles; so, you don't need to override all the properties all the time—just specify the ones that are needed and the rest will not be drawn at all. For example, creating a style with just a stroke property will draw polygons with an outline and no fill:
var style = new ol.style.Style({
stroke: new ol.style.Stroke({
color: [127,127,127,1]
})
});Now, let's look at each specific property type with some examples.
The fill style—ol.style.Fill—is used to fill shapes with a solid color. The fill style is used by ol.style.Style as well as a couple of other objects we'll see shortly. It has a single property, color, of the type ol.Color that is used when drawing filled shapes.
Colors may be specified in three ways:
[0,0,0,1], white is represented as [255,255,255,1], and a semitransparent blue green is [0,255,0,0.5]."rgba(red,green,blue,alpha)", where red, green, blue, and alpha are the same as the preceding array form; for example, our semitransparent green color will be "rgba(0,255,0,0.5)".#RRGGBB, where RR is the red value, GG is the green value, and BB is the blue value. The values are a hexadecimal equivalent of the numeric values between 0 and 255, written as 00 to FF. The alpha value is assumed to be 1 in this case.These different representations are equivalent (except for the missing alpha control in hex colors) and you can use whichever is more convenient.
The stroke style— ol.style.Stroke—is used to draw lines. The line style is used by ol.style.Style as well as a couple of other objects we'll see shortly. A stroke style has the following options.
The following diagram illustrates the effect of the various values for lineJoin (top) and lineCap (bottom).
Modify the last example and try out some fill and stroke style properties. In particular, try changing the lineJoin and lineCap properties. Use a wider stroke width to see the effect it produces. Note that the lineCap style won't be apparent when drawing polygons—to see it in action, you'll need a line layer, perhaps, using the fells_loop.gpx file we saw in the previous chapter.
Here are a couple of examples:
var countryStyle = new ol.style.Style({
fill: new ol.style.Fill({
color: [0, 255, 255, 1]
}),
stroke: new ol.style.Stroke({
color: [127,127,127,1.0],
width: 10,
lineJoin: 'bevel',
})
});
var timezoneStyle = new ol.style.Style({
stroke: new ol.style.Stroke({
color: [64, 200, 200, 0.5],
lineJoin: 'round',
width: 10
})
});The image style—ol.style.Image—is used to style point data. You won't be using it directly though. Instead, there are two subclasses that you'll be using: ol.style.Icon and ol.style.Circle. Let's look at the icon style first.
The icon style displays an image at the location of a point. There are quite a few properties associated with the icon style that allow you to align the placement of the image relative to the precise geographic location being represented.
The following diagram illustrates the meaning of the origin, size, and anchor options:
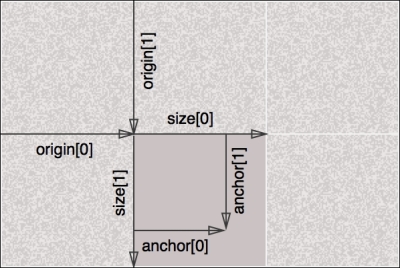
As we haven't seen the Icon style before, let's build an example. As we'll need some point data for this example, the earthquake.kml file should be perfect! We'll use the following image sprite and pick the middle dot. This file is included with the code samples that come with the book; you can find it at assets/img/dots.png.

var earthquakeStyle = new ol.style.Style({
image: new ol.style.Icon({
anchor: [0.5, 0.5],
size: [52, 52],
offset: [52, 0],
opacity: 1,
scale: 0.25,
src: '../assets/img/dots.png'
})
});var earthquakes = new ol.layer.Vector({
source: new ol.source.KML({
projection: 'EPSG:3857',
url: '../assets/data/earthquakes.kml',
extractStyles: false
}),
style: earthquakeStyle
});var map = new ol.Map({
target: 'map',
layers: [countries, timezones, earthquakes],
view: view
});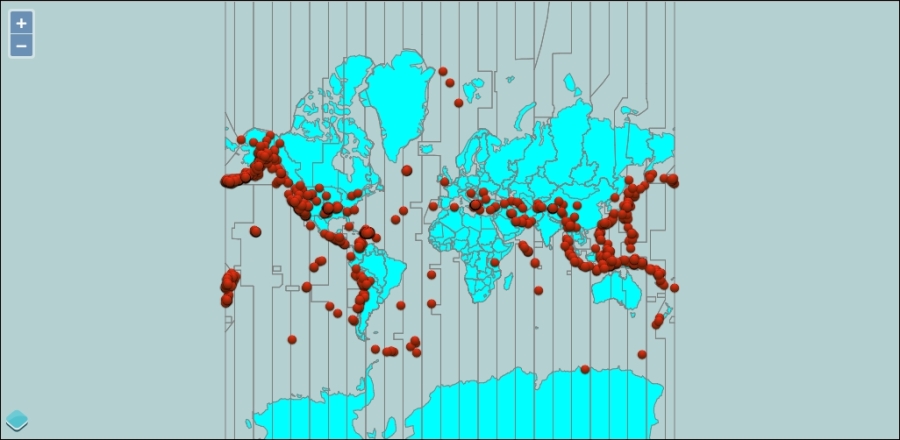
Using the icon style properties, we displayed an image at the location of each of the points in the earthquakes.kml file.
First, we created an icon style pointing at our sprite image and supplied values for offset, anchor, size, and scale to ensure our red dot is used. The sprite is 156 pixels wide and 52 pixels high, and each image in the sprite is 52 by 52 pixels, so we provided a size of [52,52]. An offset value of [52, 0] moved the frame of reference 52 pixels in from the left edge. The anchor position of [0.5,0.5] specified the middle of the image since the default anchor units is fraction. We can also have specified pixels for anchor units and changed our anchor position to [26, 26]. Given the density of the earthquakes, using a 52 by 52 pixel image will overwhelm the map; so, we provided a scale value of 0.25, which effectively shrunk the resulting image to 25 percent of its size, or 13 by 13 pixels.
After creating a new vector layer that used our icon style, we added it to the map.
Like the icon style, the circle style is used for point geometries. It's a much simpler object, though with only four configurable properties:
To round out our understanding of the image styles, redo the previous example using ol.style.Circle instead of ol.style.Icon as the image property of the earthquake style. Your result should look something like this (depending on what values you choose):
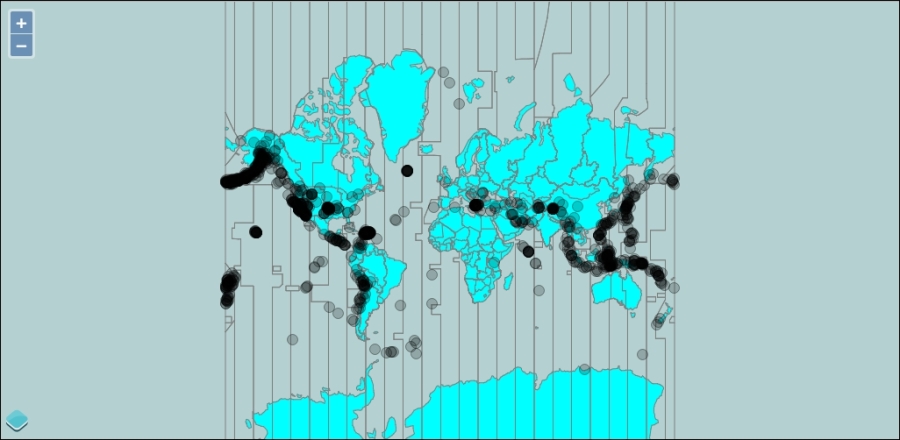
We saw the text style in action in the first example, and we also saw that it wasn't very useful to include a static text style—at least in that example. In general, text styles will be much more useful when the text that is displayed is derived from some property of the feature being displayed. We'll look at how to do that at the end of the chapter, so for now, let's finish up the basic style section with the properties available to text styles:
Remember, from the beginning of the chapter, that we said there were three different ways of specifying styles:
ol.style.Styleol.style.Style instancesWe've looked at the first, using ol.style.Style, in detail. The second, an array of styles, is really not much different from the first, that is, you are still dealing with the basic styles. The difference is that when you provide an array of styles, features are rendered once for each style. This means each feature is rendered more than once, which can provide some interesting effects. An example is probably the best way of illustrating this.
In this example, we'll use the country data again and draw each polygon with two styles to create a shadow effect around the continents.
countryStyle to provide a somewhat darker stroke:var countryStyle = new ol.style.Style({
fill: new ol.style.Fill({
color: [203, 194, 185, 1]
}),
stroke: new ol.style.Stroke({
color: [101, 95, 90, 1],
width: 1
}),
zIndex: 2
});var shadowStyle = new ol.style.Style({
stroke: new ol.style.Stroke({
color: [0, 0, 127, 0.15],
width: 8
}),
zIndex: 1
});var countries = new ol.layer.Vector({
source: new ol.source.GeoJSON({
projection: 'EPSG:3857',
url: '../assets/data/countries.geojson'
}),
style: [shadowStyle, countryStyle]
});
By combining two styles, we achieved the desired effect. In the first step, we modified our starting style slightly to sharpen the country outline—this makes them easier to see over the shadows. In the second step, we added another style for the country layer with a wide, mostly transparent stroke and no fill. Lastly, we provided an array as the style property for our countries layer.
There is one thing you really need to be aware of when using arrays of styles—each feature is drawn once for each style. This can have dramatic performance implications when dealing with a lot of features. If you create a style array with two styles, you are effectively doubling the number of features being rendered. This will have no visible effect on a small number of simple features, but will start to have a noticeable effect when rendering lots (say hundreds of thousands) of features, or a smaller number of highly complex features.
In practice, it doesn't really double the rendering time as their efficiencies are built into OpenLayers that try to avoid expensive operations as much as possible. For example, the same effect can be achieved using two vector layers. This will be more inefficient as OpenLayers has to process the geometries twice, while they only have to be processed once when using an array of styles.
If you have been paying attention, you will have noticed that we added a zIndex property to each style in the previous example. Try removing the zIndex from both the styles and observe the result. This should give you an appreciation of what the zIndex property does. Without it, OpenLayers renders the features one at a time with their complete style, which would mean that the shadow from one country will overlap an adjacent country rather than just forming a shadow around each continent.
Now that we've seen all the basic style properties and how to combine them as arrays of styles, it's time to learn how to use them in conjunction with feature properties to achieve dynamic styles. This is actually the last of our three ways of specifying the style property—the style function.
We said at the beginning of the chapter that a style function is one that returns an array of style objects to be used for a specific feature and zoom level.
What does this mean? It's really quite straightforward, but extremely powerful. A style function is nothing more than a JavaScript function that receives two parameters—the feature being styled, and the resolution of the map's view. It is required to return an array of ol.style.Style objects when it is called. For instance, we could have written our country style example using a style function like this:
var countryStyleFunction = function(feature, resolution) {
return [countryStyle]; // the basic style we already defined
};
var countries = new ol.layer.Vector({
source: countrySource,
style: countryStyleFunction
});This example doesn't use the feature or the resolution arguments, but does illustrate how simple the concept of a style function is. In fact, when you provide a style or an array of styles as the style property of a vector layer, OpenLayers creates a style function internally that looks exactly like this.
You might be wondering if it's this simple, then how can we claim that it's extremely powerful? The power really comes when you use the feature and the resolution to dynamically create styles.
At the end of the previous chapter, we introduced the concept of feature properties and the methods used to retrieve them. Now, we can make practical use of this knowledge by using properties to create styles on the fly.
For this example, we will render the country layer by styling each country based on income level by associating its country code to income level data provided by the world bank. There are quite a few brackets; so, we've simplified it to four levels: high, medium, low, and poor. We'll draw each country in a color associated with its income level based on these brackets. Let's start from the previous example.
<script> tag, before anything else, we will define colors for the four brackets. Use any colours you like:var high = [64,196,64,1]; var mid = [108,152,64,1]; var low = [152,108,64,1]; var poor = [196,32,32,1];
var incomeLevels = {
'HIC': high, // high income
'OEC': high, // high income OECD
'NOC': high, // high income, non-OECD
'UMC': mid, // upper middle income
'MIC': mid, // middle income
'LMC': mid, // lower middle income
'LIC': low, // low income
'LMY': low, // low and middle income
'HPC': poor // heavily indebted poor country
};var defaultStyle = new ol.style.Style({
fill: new ol.style.Fill({
color: [250,250,250,1]
}),
stroke: new ol.style.Stroke({
color: [220,220,220,1],
width: 1
})
});var styleCache = {};
function styleFunction(feature, resolution) {
var level = feature.get('incomeLevel');
if (!level || !incomeLevels[level]) {
return [defaultStyle];
}
if (!styleCache[level]) {
styleCache[level] = new ol.style.Style({
fill: new ol.style.Fill({
color: incomeLevels[level]
}),
stroke: defaultStyle.stroke
});
}
return [styleCache[level]];
}var source = new ol.source.GeoJSON({
projection: 'EPSG:3857',
url: '../assets/data/countries.geojson'
});
var countries = new ol.layer.Vector({
source: source,
style: styleFunction
});var key = source.on('change', function(event) {
if (event.target.getState() == 'ready') {
source.unByKey(key);
$.ajax('../assets/data/income_levels.json').done(function(data) {
source.forEachFeature(function(feature) {
var code = feature.get('iso_a2');
if (data[code]) {
feature.set('incomeLevel', data[code]);
}
});
});
}
});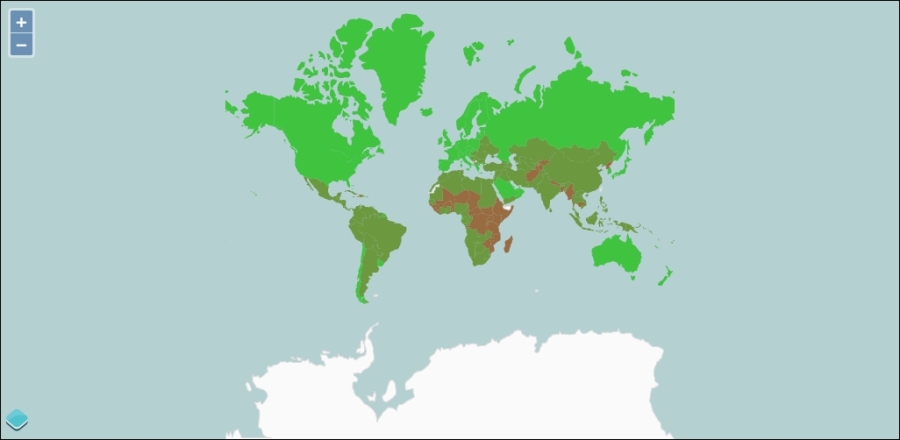
Let's review what is happening in this example. We are using a standard setup for vector layers, and combining some extra data into our features dynamically. The data is used to style, or classify, the country polygons by the income level as recorded by the world bank. Some interesting things are happening in this example; so we'll look at each step and highlight what's going on.
In step 1, we created some colors to be used to fill countries that fall into one of the four income categories. The number of categories is arbitrary—you can create colors for each of the income levels, or decide to group them differently.
In step 2, we created an object that we can use to look up a color based on an income level, and in step 3, we defined a default style. It's usually good practice when dealing with data that can change to have some kind of fallback so that your code doesn't break. We'll use the default style if we can't find a income level in our lookup object.
In step 4, we created our style function. Another best practice is to reuse style objects as much as possible. Since several countries might be drawn in the same style, we created an empty object (the styleCache) to store previously created styles. The actual function comes next. When the style function is called, it gets a reference to the feature being styled and the current resolution of the view on which it is being rendered. We aren't using the resolution in this example. We are using the feature, however. The feature should have a property called incomeLevel that matches the values in our lookup tables, so we grab that value and assign it to a variable. If the income level wasn't set or if it doesn't exist in the lookup table, we'll return the default style. Otherwise, we can check to see whether the styleCache object already has a style for this income level. If it doesn't, we need to create a new style using the color from our lookup table. In this case, we are using the default style's stroke for everything, but you could easily change the stroke for each feature too. Because we've assigned the new style to the correct slot in the cache, we can then return it directly.
Note that in both cases, we return an array containing the style. This is required for a very important reason: performance! The Style functions are executed a lot of times when rendering vector features and if OpenLayers had to check the return type of each call to see if it was a style object or an array of style objects, this would add significant overhead to the rendering pipeline. For individual features, the difference is so tiny that it's probably not measurable even with the best of tools. For many features, this tiny difference adds up to a lot and it is measurable. The OpenLayers developers have put a lot of effort into this kind of detail and it shows!
In step 5, we modified the layer to use the style function we just created and defined a separate variable for the source. This was to make the next step a little easier.
In step 6, we loaded the income level data. The goal of the code in this step is to load the income data and associate it with the appropriate country feature. To do this, we need to make sure that the country features have been loaded. Once the countries are loaded, then, we need to load the income data. Then we can create a new property on each country feature with the appropriate income level. There are a few important things happening in this step, so we'll review each line:
ol.Observable and so they provide the on() method for this. Recall from Chapter 2, Key Concepts in OpenLayers, that the on() method returns a key that can be used later to deregister an event handler (using the unByKey() method)—we'll need it in just a moment. The change event on a vector source is triggered when the source changes state.unByKey() method so that the handler doesn't get called again. This is very important. A source triggers the change event when its state changes, but also when any of its features change. This means that our event handler will get called again when we add properties to the feature. Since the state of the source will already be ready, our code will try to load the income data again and will create an infinite loop.ajax() method. The data loaded from this file is passed to the function we register using done().forEachFeature() and providing a function that will be called with each feature.iso_a2 property of the feature, which is a two letter code associated with each country. The income data in our file is organized by this code so we can use this code to get the income level for each country.These eight lines of code accomplish quite a bit and combine concepts from other chapters of this book, including Chapter 2, Key Concepts in OpenLayers (event registration and deregistration) and Chapter 5, Using Vector Layers (vector layers, vector sources, and feature properties).
To round off our chapter on vector styles, let's explore combining vector styles with user interaction. In the previous chapter, we responded to the mouse moving over a country by displaying the country's name in an HTML element outside the map. We'll build on this example and take it one step further. As the mouse moves, we'll highlight the country under the mouse and draw its flag and name in the center of the country using a feature overlay. The feature overlays are something new; so, we'll need to learn something about them before we go ahead with our example though.
The FeatureOverlay class, ol.FeatureOverlay, is a special type of vector layer designed to render a small number of temporary features in a specific style. It isn't a full-fledged vector layer, but it is highly optimized for the specific case of highlighting features in a temporary way. This sounds ideal for our use case!
Creating a new feature overlay is just like creating any other class in OpenLayers, just pass some options to configure it. Here are the options that can be passed to the ol.FeatureOverlay constructor:
The FeatureOverlay class has several methods to manage its features, map, and styles as follows:
Feature overlays are pretty simple and most of what you will want to do with a feature overlay once it is configured with a style and map is manage features. Let's see how that's done!
Now we have the knowledge we need to build our final example. We will add some interactivity to our countries layer by highlighting the country under the mouse with a different style—specifically, we will:
var countries = new ol.layer.Vector({
source: new ol.source.GeoJSON({
projection: 'EPSG:3857',
url: '../assets/data/countries.geojson'
})
});
var center = ol.proj.transform([0, 0], 'EPSG:4326', 'EPSG:3857');
var view = new ol.View({
center: center,
zoom: 1,
});
var map = new ol.Map({
target: 'map',
layers: [countries],
view: view
});var baseTextStyle = {
font: '12px Calibri,sans-serif',
textAlign: 'center',
offsetY: -15,
fill: new ol.style.Fill({
color: [0,0,0,1]
}),
stroke: new ol.style.Stroke({
color: [255,255,255,0.5]
width: 4
})
};
var highlightStyle = new ol.style.Style({
stroke: new ol.style.Stroke({
color: [255,0,0,0.6],
width: 2
}),
fill: new ol.style.Fill({
color: [255,0,0,0.2]
}),
zIndex: 1
});function styleFunction(feature, resolution) {
var style;
var geom = feature.getGeometry();
if (geom.getType() == 'Point') {
var text = feature.get('text');
baseTextStyle.text = text;
var isoCode = feature.get('isoCode').toLowerCase();
style = new ol.style.Style({
text: new ol.style.Text(baseTextStyle),
image: new ol.style.Icon({
src: '../assets/img/flags/'+isoCode+'.png'
}),
zIndex: 2
});
} else {
style = highlightStyle;
}
return [style];
}var featureOverlay = new ol.FeatureOverlay({
map: map,
style: styleFunction
});pointermove event and manage the features in our feature overlay based on where the mouse is. This is a pretty big function that exercises our knowledge of geometries from the previous chapter:map.on('pointermove', function(browserEvent) {
featureOverlay.getFeatures().clear();
var coordinate = browserEvent.coordinate;
var pixel = browserEvent.pixel;
map.forEachFeatureAtPixel(pixel, function(feature, layer) {
if (!layer) {
return; // ignore features on the overlay
}
var geometry = feature.getGeometry();
var point;
switch (geometry.getType()) {
case 'MultiPolygon':
var poly = geometry.getPolygons().reduce(function(left, right) {
return left.getArea() > right.getArea() ? left : right;
});
point = poly.getInteriorPoint().getCoordinates();
break;
case 'Polygon':
point = geometry.getInteriorPoint().getCoordinates();
break;
default:
point = geometry.getClosestPoint(coordinate);
}
textFeature = new ol.Feature({
geometry: new ol.geom.Point(point),
text: feature.get('name'),
isoCode: feature.get('iso_a2').toLowerCase()
});
featureOverlay.addFeature(textFeature);
featureOverlay.addFeature(feature);
});
}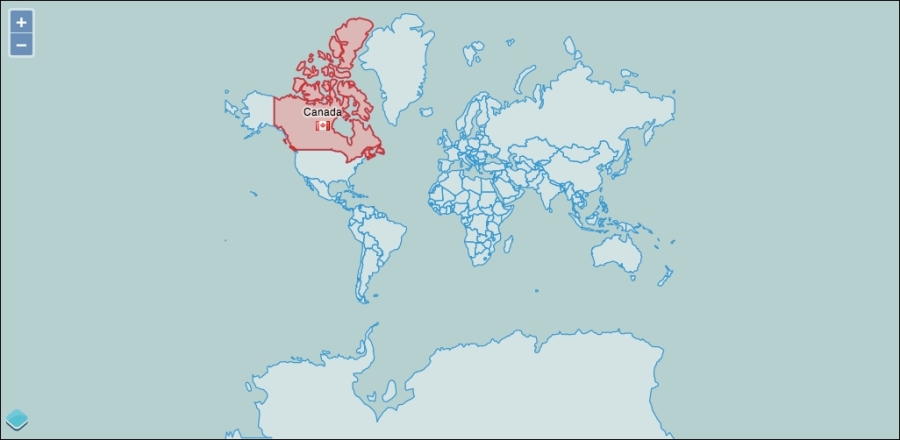
As you can see, feature overlays make it very simple to create an interactive experience with vector layers. There are a few new concepts in this example, as well as some old ones, so let's review the code step by step.
Step 1 should be pretty familiar to you now—we are creating a vector layer with a GeoJSON source, and adding it to a map with a view centered on 0,0.
In step 2, we set up some styles for our feature overlay to use. There are two styles—one for text and one for polygon highlighting. Notice that the baseTextStyle is an object literal, not a new instance of ol.style.Text. When you create an instance of ol.style.Text, the text to be drawn needs to be passed to that object and you can't change the text after it has been created. The style function allows us to create text styles with the text of the current feature, but we'll need to specify the other options. Since all labels will share the other text options, we can set them up once and just refer to them later in the style function. The options we've specified here are to center align the text, offset it up by 15 pixels (recall that a positive offsetY moves the text down), and provide a fill and stroke color. For the text, the stroke is rendered around the outside of each character so we set a wide, semitransparent stroke to make the text stand out from the map beneath it.
The highlightStyle is straightforward— a fill and stroke style for the highlighted polygon.
The style function needs to be defined before we can use it to create the feature overlay, so in step 3, we defined it. Recall that the style function receives the feature being rendered as the first argument. We drew two types of features, points, and polygons, with two different styles. So, the first thing we did was get the feature's geometry and check to see whether it was a point. If it is a point, we create a new text style and a new icon style specific to the current feature. We got the feature's text property and combined it with the baseTextStyle object to create the text style. Next, we got the isoCode property and used it to create a URL to the flag for the country (the flag icons are conveniently named using the two-letter ISO country code) for a new icon style. Then, we created a new style object for the current feature. If the feature is a polygon, it's much simpler—all we need to do is return the highlightStyle object. Finally, we returned an array containing the style (recall that style functions are required to return arrays for performance reasons).
Step 4, by comparison, was very short! We created a new feature overlay and configured it with the map object and style function. It's really the style function, and step 5, that do all the work.
Step 5 added a handler for the map's pointermove event; so, we could find the feature closest to the mouse and add it to the feature overlay. We actually wanted to highlight two features— the polygon itself and a point at the center of the polygon. It turns out that getting this center point is a bit tricky. Let's review the code carefully.
Line 1 of code in the handler clears any existing features in the feature overlay. It is much easier to retrieve the collection and clear it than to remove individual features in our case.
The browserEvent object provides us with the map coordinate and pixel that the event happened at. We used the pixel location with ol.Map classes forEachFeatureAtPixel function on the next line to retrieve all features at that location from our vector layer. This function invokes a callback function for every feature at the pixel location, providing both the feature and the layer that the feature was found on. The layer parameter may be null if the feature was found on a FeatureOverlay.
Inside our callback function, we tested first to see if the feature was actually on a layer before proceeding. Then we needed to find both the geometry and the center point of the geometry. If all the country features were polygons, we could simply call getInteriorPoint() to retrieve the center and we would be done. Unfortunately, we didn't know what type of features we were dealing with—some of the features in the country data were actually MultiPolygons, and we needed to handle them differently. The switch statement chooses a path based on the type of the feature. Let's look at each case separately.
The first case was for MultiPolygon. As the name suggests, a MultiPolygon class contains multiple polygons (a country and some islands perhaps) and there isn't a convenient way to determine the center of a group of polygons. Instead, a MultiPolygon class has several centers, one for each of its constituent polygons. The getInteriorPoints() method returns the center points for us. We only really wanted a single label though. One way is to get all the interior points and use the first one. The problem with this approach is that there is no particular order to the polygons, and it looks odd to label some random island off the coast rather than the major landmass of a given country. To get around this, we wanted our label to appear at the center of the largest polygon. To get the largest polygon, we first got the array of polygons and then reduced that array to a single value with a function that compared two polygons based on their area. The reduce method is a standard method of JavaScript arrays. Once we've found the largest polygon, we can ask for its interior point.
The second case is for polygon, and was much simpler— we just needed the interior point of the polygon and we were done!
The final case was the default case. While it isn't strictly needed, it is good practice to include a default case in switch statements. The getClosestPoint() method is available on all geometry types and is a safe fallback for our default case.
Now that we had a point coordinate at the best location we could determine for the feature under the mouse, we created a new Feature and provided the point geometry for its location. We also added two properties—text (that we displayed at the point) and isoCode (that we will use to find the flag icon for the country).
Finally, we added both features to the feature overlay so that when the map is next rendered, the country under the mouse will be highlighted in red and display the flag and country name at the center.
This concludes our chapter on styling vector layers. OpenLayers' styling capabilities are quite simple to implement, but can be incredibly powerful. The basic styles are easy to set up and give you a lot of flexibility in styling your vector features. More complex styling is readily implemented through the use of a style function by allowing you to create basic styles tailored to a specific feature and current zoom level of the map. The building blocks—basic styles and the style function—are simple, but the combination of them allows you to create highly custom cartographic representations for your vector data.
In the next chapter, we will dig into projections and discover how to use them to display both vector and raster layers in different projections.
When you look at a map, you are looking at a two-dimensional representation of a 3D object (the Earth). Because we are, essentially, 'losing' a dimension when we create a map, no map is a perfect representation of the Earth. All maps have some distortion.
The distortion depends on what projection (a method of representing the earth's surface on a two dimensional plane) you use. In this chapter, we'll talk more about what projections are, why they're important, and how we can use them in OpenLayers. We'll also cover some other fundamental geographic principles that will help make it easier to better understand OpenLayers.
In this chapter, we will cover the following topics:
Let's get started!
No maps of the earth are truly perfect representations; all maps have some distortion. The reason for this, is because they are attempting to represent a 3D object (an ellipsoid: the Earth) in two dimensions (a plane: the map itself).
A projection is a representation of the entire, or parts of a surface of a 3D sphere (or more precisely, an ellipsoid) on a 2D plane (or other types of geometry).
Every map has some sort of projection—it is an inherent attribute of maps. Imagine unpeeling an orange and then flattening the peel out. Some kind of distortion will occur, and if you try to fully fit the peel into a square or rectangle (like a flat, two-dimensional map), you'd have a very hard time.
To get the peel to fit perfectly onto a flat square or rectangle, you can try to stretch out certain parts of the peel or cut some pieces of the peel off and rearrange them. The same sort of idea applies while trying to create a map.
There are literally an infinite amount of possible map projections; an unlimited number of ways to represent a three-dimensional surface in two dimensions, but none of them are totally distortion free.
So, if there are so many different map projections, how do we decide on which one to use? Is there a best one? The answer is no. The 'best' projection to use depends on the context in which you use your map, what you're looking at, and what characteristics you wish to preserve.
As a two-dimensional representation is not without distortion, each projection makes a trade off between some characteristics. As we lose a dimension when projecting the earth onto a map, we must make some sort of trade off between the characteristics we want to preserve. There are numerous characteristics, but for now, let's focus on three of them.
Area refers to the size of features on the map. Projections that preserve area are known as equal-area projections (also known as equiareal, equivalent, or homolographic). A projection preserves area if, for example, a meter measured at different places on the map covers the same area. Because area remains the same, angles, scales, and shapes are distorted. This is what an equal area projected map may look like:
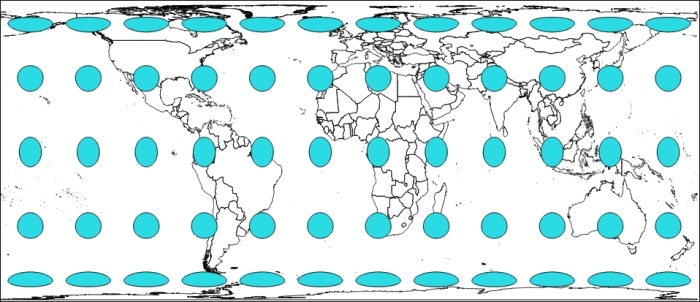
Here, we use Tissot indicatrix with EPSG:3410 NSIDC EASE-Grid Global, where the EPSG code helps define all existing projections. We will cover EPSG in detail, later in this chapter.
Without going into technical details, Tissot indicatrix is a way to display map projections deformation visually. In a perfect projection, we will keep area, distance, and shape, with circles with equal area and equal distance.
As you see, with this equal-area projection, we have circle and ellipse shapes but areas remain the same.
Scale is the ratio of the map's distance to the actual distance (for example, one centimeter on the map may be equal to one hundred actual meters). All map projections show scale incorrectly at some areas throughout the map; no map can show the same scale throughout the map. There are parts of the map, however, where scale remains correct—the placement of these locations mitigates scale errors elsewhere. The deformation of scale also depends on the area being mapped. Projections are referred to as equidistant if they contain true scale between a point and every other point on the map.
An example to illustrate can be the EPSG:32662 projection known as Plate Carree.
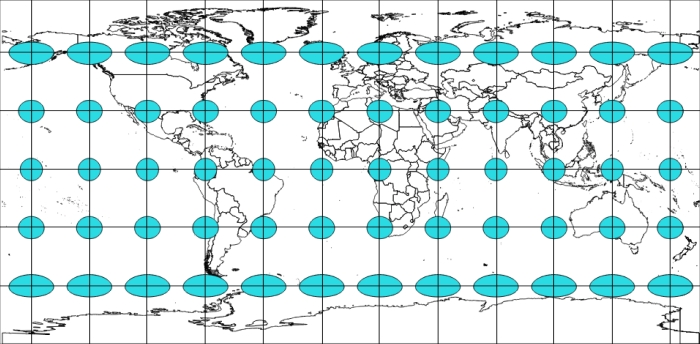
Here, we keep the distance between the center of the ellipse/circle. We overlay on top of the image of a grid so that you can better evaluate distance.
Maps that preserve shape are known as conformal or orthomorphic. Shape means that relative angles to all points on a map are correct. Most maps that show the entire earth are conformal, such as the Mercator projection (used by Google Earth and other common web maps). Depending on the specific projection, areas throughout the map are generally distorted but may be correct in certain places. Also, a map that is conformal cannot be equal-area.
To illustrate shape preservations, let's see the following example using EPSG code 3395 (WGS 84 - World Mercator), where all circles stay circles wherever they are:
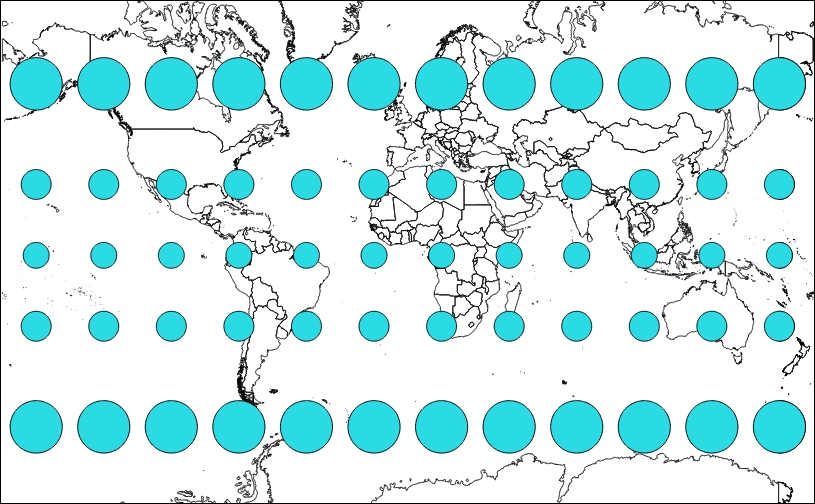
Projections have numerous other characteristics, such as bearing, distance, and direction. The key concept to take away here is that all projections preserve some characteristics at the expense of others. For instance, a map that preserves shape cannot completely preserve area.
There is no perfect map projection. The usefulness of a projection depends on the context the map is being used in. A particular projection may excel at a certain task, for example, navigation, but can be a poor choice for other purposes. For example, when we do thematic mapping and respect representations rules, colors are related to areas of countries. When we look at a world thematic map with a wrong projection, our eyes see a country bigger than the others, whereas because of projections, this country can, in reality, have a calculated area identical to countries represented with a smaller size.
The following figure overlays an area preserving projection (Robinson) on top of a Spherical Mercator to show the difference and why it matters:
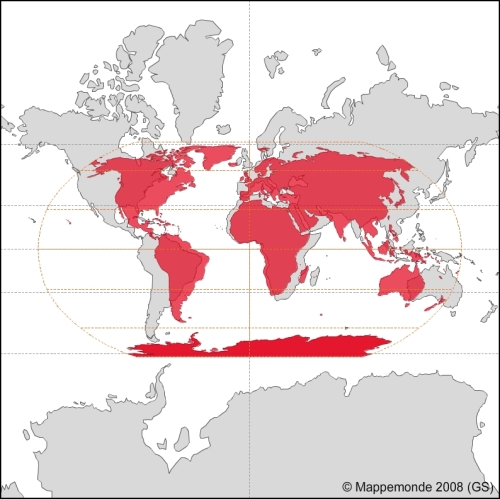
One of the simple ways to convince you that each projection has a reason to exist is to visit the OpenLayers 3 website examples.
We will compare the scale line example, http://openlayers.org/en/v3.0.0/examples/scale-, with the tiled WMS with the custom projection example, http://openlayers.org/en/v3.0.0/examples/wms-custom-proj.html.
Your instructions until now are:
Projections are projected onto a geometric surface, three of the most common ones being a plane, cone, or cylinder.
Imagine a cylinder being wrapped around the earth, with the center of the cylinder's circumference touching the equator. Now, the earth is projected onto the surface of this cylinder, and if you cut the cylinder from top to bottom vertically and unwrap it and lay it flat, you'd have a regular cylindrical projection:
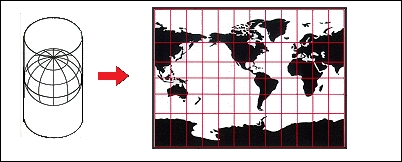
The Mercator projection is just one of these types of projections. If you've never worked with projections before, there is a good chance that most of the maps you've seen were in this projection.
Because of its nature, there is heavy distortion near the ends of the poles. Looking at the previous screenshot, you can see that the cells get progressively larger, the closer you get to the North and South poles. For example, Greenland looks larger than South America, but in reality, it is about the size of Mexico. For illustrating this problem visually, you can compare countries overlapping with http://overlapmaps.com. If area distortion is important in your map, you might consider using an equal area projection, as we mentioned earlier.
More information about projections can be found at the USGS (US Geological Survey) website at http://pubs.er.usgs.gov/publication/pp1395, where you can download the reference book Map Projections: A Working Manual (U.S. Geological Survey Professional Paper 1395), John P. Snyder, 1987, 397 pages.
As we mentioned, there are literally an infinite number of possible projections. So, it makes sense that there should be some universally agreed upon classification system that keeps track of projection information. There are many different classification systems, but OpenLayers uses EPSG codes. EPSG refers to the European Petroleum Survey Group, a scientific organization involved in oil exploration, which in 2005 was taken over by the OGP (International Association of Oil and Gas Producers).
For the purpose of OpenLayers, EPSG codes are referred to as EPSG:4326.
The numbers (4326, in this case) after EPSG: refer to the projection identification number. It uses the familiar longitude/latitude coordinate system, with coordinates that range from -180° to 180° (longitude) and -90° to 90° (latitude).
Let's create a basic map using a different projection. Using the usual code from Chapter 1, Getting Started with OpenLayers, recreate your map object the following way. We'll be specifying the projection property, along with the center and zoom properties. The projection we will use is EPSG:4326, a projection used for world data. Usually, when you don't specify a projection, the default projection in OpenLayers is EPSG:3857 (historically, called EPSG:900913), used by Google Maps and other third-party APIs such as Bing Maps or OpenStreetMap.
var blueMarbleLayer = new ol.layer.Tile({
source: new ol.source.TileWMS({
url: 'http://maps.boundlessgeo.com/geowebcache/service/wms',
params: {
'TILED' : true,
'VERSION': '1.1.1',
'LAYERS': 'bluemarble',
'FORMAT': 'image/jpeg'
}
})
});var view = new ol.view({
projection: 'EPSG:4326',
center: [-1.81185, 52.44314],
zoom: 6
});var map = new ol.Map({
target: 'map'
});map.addLayer(blueMarbleLayer); map.setView(view);
chapter7_ex1.html. You should see something like the following: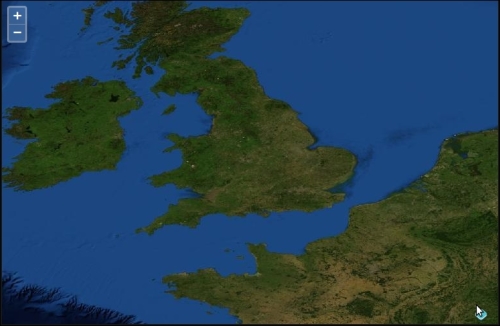
We just created a map with the EPSG:4326 projection. The process to use another projection is really similar to all previous examples in the book.
One of the main differences is the backend server. It can provide a layer projected in another projection from the default one in OpenLayers 3 library. In our case, it's the source URL, http://maps.boundlessgeo.com/geowebcache/service/wms, from the blueMarbleLayer layer object that permits this.
The other difference is at the view level. In the constructor, we set a new property: projection that refers to wanted EPSG code and we also directly use coordinates from the projection to set the center on our map.
Apart from the code, you'll notice that the example looks quite different from the maps we've made so far. This is because of its projection.
OpenLayers supports any projection, but if you want to use a projection other than EPSG:3857, you must specify this option in the view projection. The default value is EPSG:3857.
If you do not specify this option, the default value is used (most of the other maps so far, have been using the default values).
You can pass to the projection a string with EPSG:yourcode, but you can also give it an ol.proj.Projection object. You can define it manually but most of the time, you will retrieve it from a preconfigured projection setting. We will only cover how to define it when you are using Proj4js, a JavaScript library dedicated to manage projections. As a beginner will not need to work with use cases without EPSG codes. Be careful, as OpenLayers only supports EPSG:4326 and EPSG:3857 (both with a few aliases) out-of-the-box.
Longitude and latitude are two terms most people are familiar with, though they have limited geographic knowledge or get confused by the two. Let's take a look at the following screenshot and then go over these two terms:
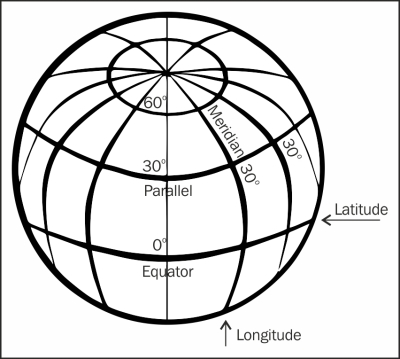
Latitude lines are imaginary lines parallel to the equator, aptly known also as parallels of latitude. Latitude is divided into 90 degrees, or 90 spaces (or cells), above and below the equator. -90° is the South Pole, 0° would be the Equator, and 90° is the North Pole.
Each space, or cell, (from 42° to 43°, for example) is further divided into 60 minutes and each minute is further divided into 60 seconds. The minutes and seconds terminology has little to do with time. In the context of mapping, they are just terms used for precision. The size of a degree of latitude is constant (if calculation bot is based on projected distance). Because they measure 'north to south', OpenLayers considers the y coordinate to be the latitude.
Longitude lines are perpendicular to the lines of latitude. All lines of longitude, also known as meridians of longitude, intersect at the North Pole and South Pole, and unlike latitude, the length of each longitude line is the same. Longitude is divided into 360 degrees, or spaces. Similar to latitude, each space is also divided into 60 minutes, and each minute is divided into 60 seconds. For EPSG:4326, -180 to 0 measures west of the Greenwich meridian, whereas 0 to 180 measures east of Greenwich.
As the space between longitude lines gets smaller, the closer you get to the poles, the size of a degree of longitude changes (when not relying on projected distance). The closer you are to the poles, the lesser time it will take you to walk around the Earth.
With latitude, it makes sense to use the equator as 0°, but with longitude, there is no spot better than to start the 0° mark at. So, while this spot is really arbitrary, the Observatory of Greenwich, England, is today universally considered to be 0° longitude. Because longitude measures east and west, OpenLayers considers the x coordinate to be longitude.
Let's take a look at a couple of examples on coordinates from our previous maps:
map.getView().getCenter();
Depending on where you have panned, your output should read something like the following:
[9397474.0038099,3595597.9798909]
map.getView().getCenter();
You should see something like the following:
[-72.8125, 19.6875]
ol.coordinate.toStringHDMS([-72.8125, 19.6875]);
We just took a look at the longitude and latitude values for the center of the map in two different maps with different projections. When we call map.getView().getCenter(), we get back an ol.Coordinate object, in fact, an array of x, y values.
In the first map, the max extent of the map was between -20037508.342789244 meters and 20037508.342789244 meters for x, and between -20037508.342789244 meters and 20037508.342789244 meters for y.
These are the values used by the EPSG:3857, and it is an x and y type of Cartesian coordinate system. The values for x and y change in the second map because they are not in the same projection (they are in EPSG:4326). So, x are between -180° and 180° and y between -90° and 90°.
The x and y means longitude and latitude, respectively in EPSG:4326 and easting and northing in EPSG:3857. To understand definition of easting and northing, go to the Wikipedia dedicated page, https://en.wikipedia.org/wiki/Easting_and_northing.
So far, we've been talking about the abstract idea of a projection. Let's dive into OpenLayer's ol.proj namespace functions and the associated class ol.proj.Projection class, which is what we use to actually handle projections. The ol.proj.Projection class relies on internal code, managing the most used projection in the web mapping world: the EPSG:4326 projection (also named WGS 84) and the EPSG:3857 projection, also known as EPSG:900913 (using leetspeak, it means Google, the first company relying on this exact projection), and also, alternatively named WGS 84 Spherical Mercator. For reference, you can have the full history of the second projection at http://wiki.openstreetmap.org/wiki/EPSG:3857
For other use case such as custom projections, OpenLayers, for convenience, supports an external library called Proj4js, which can be found at http://proj4js.org. First, we'll talk about what we can do without the Proj4js library, and then talk about what we can do with it.
In truth, whenever you load your web mapping application, you have already instantiated the default projections, EPSG:4326 and EPSG:3857.
You only need to access ol.proj.Projection by typing the following line of code:
ol.proj.get('EPSG:3857')In ol.proj.get, you can use a projectionCode, a string for identifying the WKID (Well Known Identifier) for the projection, such as an EPSG code in the form of EPSG:4326.
When creating a map and loading a particular projection, you will only require to declare Proj4js-specific definition and use OpenLayers built-in functions to use them. This string, such as EPSG:4326, is also known as an SRS (Spatial Reference System) code. When passing in a code, like we've done with all our examples so far, ol.proj.get() will automatically create a projection object, as long as the projection definition is known to Proj4js.
The projection class (the list is available at http://openlayers.org/en/v3.0.0/apidoc/ol.proj.Projection.html) has a number of methods, including the following:
Transforming a point means you take a coordinate in one projection and turn it into a coordinate of another projection. This operation is also called reprojection. The term reprojection is also applied when deforming a raster image from one projection to another. Apart from transforming EPSG:4326 to EPSG:3857 and vice versa, OpenLayers does not provide support for transforming other projections out-of-the-box. To do transforms with other projections, you can include Proj4js (which can be found at http://proj4js.org) or provide your own transforms and register them with OpenLayers. You may be wondering why. The main reason is to not maintain projections in the core library when we can keep it outside, in a well-maintained library. The other goal, is to avoid increasing the overall library size. There are thousands of projections, whereas most projects only require some of them. The gain is not worth the drawback.
In most scenarios, it is the job of the backend map server to handle projection transformations. Often, it's useful or faster to do it on the client-side (such as in the case of vector layer coordinate transformations) because we don't need to call server-side again for transformation or because we don't control the server-side like for external web services. Let's take a look at how to transform EPSG:4326 to EPSG:3857 with OpenLayers.
Proj4js is not necessary for this example, as transforming between these two projections is possible without proj4js. Try the following steps:
var proj_4326 = ol.proj.get('EPSG:4326');
var proj_3857 = ol.proj.get('EPSG:3857');var point_to_transform = [-79, 42];
EPSG:4326 (our source proj_4326 projection object) to EPSG:3857 (our destination proj_3857 projection object):var myTransformedPoint = ol.proj.transform(point_to_transform, proj_4326, proj_3857);
console.log(myTransformedPoint); console.log(myTransformedPoint[0], myTransformedPoint[1]);
[-8794239.7714444, 5160979.4433314] -8794239.7714444 5160979.443 3314
We just transformed a point in the EPSG:4326 projection to a point in the EPSG:3857 projection. Let's take a closer look at the transform method we called on the point_to_transform object:
ol.proj.transform(point_to_transform, 'EPSG:4326', 'EPSG:3857');
This will transform the original point from the EPSG:4326 projection to the EPSG:3857 projection. Notice, we are calling the function directly from an ol.Coordinate array. The ol.proj.transform() function's definition is as follows:
In this case, our source projection is in EPSG:4326, and our destination projection is in EPSG:3857. Keep in mind however, that EPSG:4326 and EPSG:3857 are the only two projections you can do transforms on with OpenLayers out-of-the-box.
When creating a map, all the raster layers (image-based layers; nearly every layer except the vector and image layer) must be in the same projection as the map. It's possible to do projection transformations with coordinates and the vector layer, but once OpenLayers gets back an image from a map server, it cannot reproject the image itself (that's something the map server has to do).
The Proj4js library allows you to transform the coordinates from one coordinate system into another coordinate system. The Proj4js website is http://proj4js.org. By just including the Proj4js library on your page (like you do with OpenLayers), you can do more transforms within OpenLayers. Note that Proj4js also only ships with only a few codes. Definitions need to be added for all others.
The site http://epsg.io contains Proj4js definitions for most of the EPSG codes. When you are using data from foreign countries, you need to know the most common used projections. For this, go to the ProjFinder website, http://projfinder.com, and guess projections for unknown places.
Ideally, you should be using the same projection throughout your map, but there are times when you may want to display the coordinates in a different projection—such as with a vector layer. Let's take a look at how to set up the Proj4js library.
This step is similar to the way we set up the now usual template for OpenLayers 3.
proj4.js file into a new assets/proj4js directory at the root code directory.<head> section of your code before the OpenLayers 3 library inclusion code:<script src="../assets/proj4js/proj4.js"> </script>
var test_proj = proj4('EPSG:4326');
console.log(test_proj);
Object {forward: function, inverse: function, oProj: Projection}
We just included the Proj4js library and tested to see if it worked. If you received an error when you attempted to call proj4('EPSG:4326'), it means that the location of the proj4.js file was wrong. Ensure that the path in the <script> tag correctly references the JavaScript file.
Proj4js custom projections are required, particularly when you are using data at the local level and you want to use your country official projection(s) or you depend on external data sources such as web services.
Now that the Proj4js library is included, you can do transforms with more projections, the same way we did in the previous example. Except EPSG:3857, EPSG:4326, and EPSG:4269, there are no projections defined; however, you are able to define them yourself. For example, for France, the main official EPSG code is as follows:
proj4.defs("EPSG:2154","+proj=lcc +lat_1=49 +lat_2=44 +lat_0=46.5 +lon_0=3 +x_0=700000 +y_0=6600000 +ellps=GRS80 +towgs84=0,0,0,0,0,0,0 +units=m +no_defs");After this, you'd be able to use EPSG:2154 for projection transformations just like you were able to use EPSG:4326 and EPSG:3857 from the earlier examples.
A more complete list of projections (containing Proj4js definitions for nearly any EPSG code) can be found at http://epsg.io.
To get projection definitions, you can copy them from http://epsg.io or also load them from the URL. For example, adding the proj4.js script after the <script src="http://epsg.io/2154.js"></script>. The URL pattern to retrieve the definition is http://epsg.io/xxx.js where xxx is the EPSG code you want to use.
When you are using custom projections in OpenLayers 3, you need to declare the projection, as described earlier. Use ol.proj.get to retrieve its definition and define the projection extent. For this, reuse the http://epsg.io site.
When you want to declare a custom projection, you must create an object, such as the preceding one, when you start your JavaScript code:
var projection = ol.proj.get('EPSG:2154');
projection.setExtent([-378305.81, 6093283.21, 1212610.74, 7186901.68]);You will then be able to use the usual ol.proj.transform function with this new projection.
Sometimes, in another context for example, to provide parameters to web services it can be necessary to convert extent between projections. Let's inspect how to do this operation.
Until now, we only see how to do reprojection using points coordinates but how can we do it for extent?
console.log(extent);
ol.proj.transformExtent(extent, 'EPSG:21781', 'EPSG:4326');
We reused the function behind the ol.proj.transform function without knowledge.
The ol.proj.transformExtent method expects an extent as a first parameter, as a second parameter, it needs the origin projection, and as a third parameter, it's the destination projection. We declared that we use as input the extent; as origin, EPSG:2181; and as destination, EPSG:4326. At the internal OpenLayers 3 library level, the function loops on the extent and transforms each coordinate.
With this function, if we need to get a bounding box in EPSG:4326 from local projections, it will really help.
If you remember Chapter 4, Interacting with Raster Data Source, we introduced you to the tiled and untiled raster. Most tiled rasters do not serve in a foreign projection, for example, a non-Spherical Mercator projection, but contrary to most cases, WMS sources can be served and consume using custom projections.
In this part, we will see how to display the WMS image coming from the authority responsible for geology maps in France, the BRGM (equivalent to USGS to simplify):
ol3.js file.<script> tag and declare the additional projection for local projection, in this case, Lambert 93, an official projection for France:proj4.defs("EPSG:2154","+proj=lcc +lat_1=49 +lat_2=44 +lat_0=46.5 +lon_0=3 +x_0=700000 +y_0=6600000 +ellps=GRS80 +towgs84=0,0,0,0,0,0,0 +units=m +no_defs");var extent = [-378305.81, 6093283.21, 1212610.74, 7186901.68];var projection = ol.proj.get('EPSG:2154');projection.setExtent(extent);
EPSG:2154, the EPSG code for Lambert 93:var layers = [new ol.layer.Image({
source: new ol.source.ImageWMS({
url: 'http://geoservices.brgm.fr/geologie',
attributions: [new ol.Attribution({
html: '© ' +
'BRGM (French USGS equivalent)'
})
params: {
'LAYERS': 'SCAN_F_GEOL1M',
'VERSION': '1.1.1'
},
extent: extent
})
})var map = new ol.Map({
layers: layers,
target: 'map',
view: new ol.view({
projection: projection,
center: [495520.187986, 6587896.855407],
zoom: 2
})
});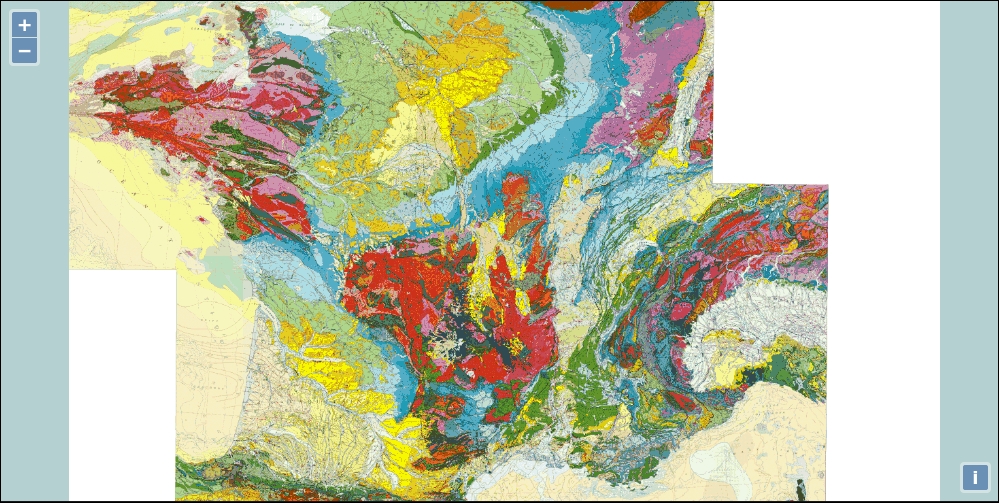
We reused the custom projection by first declaring the Proj4js projection declaration and its extent. We recommend that you visit the website http://epsg.io to better understand how to get the extent and the meaning of the second parameter in from the proj4.defs function.
Then, we used our raster WMS knowledge to create the layer. Analyzing the network can be useful to remind you about the relationship between the WMS source layer declaration and the backend web server delivering the image. You can look in particular at getCapabilities, to inspect the available projections and the layers name you may change, if you want to play with the sample. The most important part to understand is to set the projection in the map view projection parameter. How can we deduce this? We understood that because in all the code, we never set any projection at the layer or source level. We should mention that Proj4js is not needed for maps, as long as they do not need any client-side transforms.
Using our example, a minimal case can be achieved replacing previous projection declarations by only declaring a projection, with units and code parameters like below:
var projection = new ol.proj.Projection({
code: 'EPSG:2154',
units: 'm'
});When someone reviews someone else job, it seems to be quite easy but reusing the same method for your own case is not the same, and will help you to really understand it.
So, we will ask you to complete a simple job:
getCapabilities operation to get a layer's name or projections available for the data. If you don't find public web services using local projections for your country, to complete the assessment, explore other countries local projections web services.Never forget to inspect the Network panel to help you if you encounter web services issues. You may also need to use the DOM renderer within the map; it helps you to inspect the url call. With the default canvas renderer, images are assembled in the background and you can't get the WMS URL that can help you.
To find the open data portals, the main entry for America is https://www.data.gov. For Europe, you should visit http://publicdata.eu. For a worldwide overview, go at http://datacatalogs.org, a website for A Comprehensive List of Open Data Catalogs from Around the World. To grasp the state of OpenData in your country, you can visit Global Open Data Index at http://global.census.okfn.org. It's a website maintained by the community to make surveys about each country's open data initiative. The focus is mainly on the type of open data datasets available.
After inspecting how to work with custom projection using raster layers, it's time to see vector reprojection. We already reviewed how to manipulate vector but not explaining further how to manage vector projections. Let's see a bit about them.
When you draw in OpenLayers, you draw in local projections' features. Then, if you need, for example, to exchange data source with a third party, sometimes you need to make reprojections. It's useful to know how to consume data and reproject them or on the contrary, export them. It's what we will see here:
sandbox directory.var projection declaration, add a new GeoJSON source, a vector source:var countriesSource = new ol.source.GeoJSON({
projection: 'EPSG:2154',
url: '../assets/data/nutsv9_lea.geojson'
});console.log statements:countriesSource.once('change', function(evt) {
if (this.getState() == 'ready') {
console.log(this.getFeatures()[0].getGeometry().getCoordinates());
console.log(this.getFeatures()[0].getGeometry().clone().transform('EPSG:2154','EPSG:4326').getCoordinates());
}
});countriesSource as the source. You will normally write something like the following:var layers = [
new ol.layer.Image({
}),
new ol.layer.Vector({
source: countriesSource
})
];var bbox = new ol.layer.Vector({
source: new ol.source.GeoJSON()
})
map.addLayer(bbox);featureCollection inline. It's recommended by the GeoJSON specifications to have coordinates using EPSG:4326:var geojson = {
"type": "FeatureCollection",
"features": [
{
"type": "Feature",
"properties": {},
"geometry": {
"type": "Polygon",
"coordinates": [
[[-0.944824, 46.134170], [-0.944824, 48.312428],
[4.438477, 48.312428], [4.438477, 46.134170],
[-0.944824, 46.134170]
]
]
}
}
]
}ol.format.GeoJSON with defaultDataProjection:var format = new ol.format.GeoJSON({
defaultDataProjection: 'EPSG:4326'
})bbox layer:var features = format.readFeatures(geojson, {
dataProjection : 'EPSG:4326',
featureProjection: 'EPSG:2154'
});
bbox.getSource().addFeatures(features);console.log statements to help inspect the result, but also see how you can use writeFeatures and reproject.console.log(features);
console.log(
format.writeFeatures(features, {
dataProjection : 'EPSG:4326',
featureProjection: 'EPSG:2154'
})
);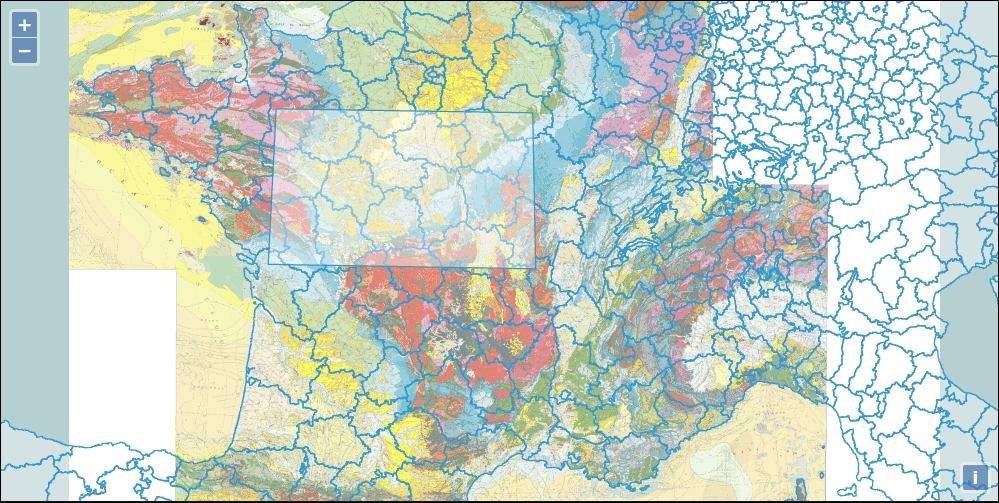
We first set a source by defining its target projection. You might not remember but when you consume GeoJSON, the data default projection is supposed to be EPSG:4326, but our previous map example relies on EPSG:2154, a local projection. By setting this parameter, we are able to tell our application to make a reprojection from EPSG:4326 to EPSG:2154.
How can we be sure it works? You just need to inspect your GeoJSON file and see the coordinates. For EPSG:4326, the approximate values are mostly less than a hundred degrees, whereas with EPSG, the units are meters and expressed with thousands of meters.
For this purpose, we already set a listener with countriesSource.once('change', function(evt) { to inspect the features values. We checked before firing the console.log statements that the GeoJSON was ready to use getState. Then, we tried to inspect the coordinates that the layer vector source contained. As you can see, we chained methods to write a shorter code. We requested all the features with the getFeatures method; the 0 index is to select only the first feature in the array. By reusing this feature, we got geometry with getGeometry, and on this geometry, we retrieved the coordinates.
With a second console.log, we started like the previous statement, but we cloned the geometry. It's because we wanted to keep the values in the original feature intact. The API documentation mentions about the ol.geom.Geometry transform method that it transforms a geometry from one coordinate reference system to another, modifies the geometry in place. If you do not want the geometry modified in place, first clone() it and then use this function on the clone.
If you extend both returned arrays in the console, you will see that the transformation to EPSG:2154 was already stored in the features, and by transforming again, we were able to get the EPSG:4326 original values.
For the rectangle box in the new layer, we choose another way to manipulate projections with vector. We choose to use an empty source within a new vector layer.
The goal was to show you that when you need to add features using the addFeatures method from the ol.source.GeoJSON vector source, you need to reproject features using an object ol.format. Here, we used ol.format.GeoJSON, but it could have been ol.format.WKT. As long as the type of format accepts dataProjection and featureProjection as options in the readFeatures, you can make reprojections.
The important part to keep in mind is the role of the ol.format.GeoJSON methods, readFeatures and writeFeatures and their options.
When you use readFeatures, you reproject from EPSG:4326 to EPSG:2154, and when you use writeFeatures, you reproject from EPSG:2154 to EPSG:4326.
At the code level, when you use readFeatures, you need to provide a string or a GeoJSON object with options and when you write them, it must be Array.<ol.Feature> with options. An excerpt from the document will help to understand those options (common to readFeatures and writeFeatures), as follows:
We also need to mention that for simplicity, we used readFeatures and writeFeatures, but for only one feature (when outside a GeoJSON FeatureCollection), you have to use the readFeature and writeFeature methods (note the singular in the methods' names). Refer to the complete API documentation for more at http://openlayers.org/en/v3.0.0/apidoc/ol.format.GeoJSON.html.
After this review, it's up to you to imagine how you can play with features from the source and also how to manage projections in other formats in various use cases, as we mainly focus for demonstration on GeoJSON.
Q1. Give some reasons why you might want to use a projection other than EPSG:3857?
Q2. Which areas will not be best suited for displaying the EPSG:3857 projection?
Q3. You need to get your local country EPSG code, where do you need to go to be efficient?
In this chapter, we talked about projections. We covered what they are and the various different types of projections. Longitude, latitude, and other geographic concepts were also discussed. While we just scratched the surface of these pretty complex topics, you should have enough fundamental information to understand how to use projections.
We also talked about the ol.proj.Projection
class and the namespace ol.proj associated for coordinates' manipulation, along with how to transform coordinates and use the Proj4js library. You'll often work with data in coordinate systems other than EPSG:4326, and knowing how to work with and transform data in other projections is important. Because Proj4js alone is not useful without OpenLayers 3, we also reviewed the different use cases for managing projections in a layer context, depending on the main layer type, for example, vector or raster. It can be useful to know reprojection in vector when you want to manage projections in the various ol.format classes we already discovered in Chapter 5, Using Vector Layers.
Now, after reviewing how projections work, it's time to review how interactions components work. Without even being aware, we already use them but never really highlighted them until now. When you pan the map for instance, you are already using interactions. Let's dive into the next chapter, Interacting With Your Map.
This chapter's goal is to review main interactions in OpenLayers 3. Interactions are components that manage relations between mouse or keyboard actions and the map. They do not rely on HTML elements like buttons.
What are the main interactions? It's the most asked function for end users, such as interactions with events on the map to retrieve map or layers information or to create new information with a drawing. You can, for example, click on a polygon representing a property and find out who owns the place and since when. All such information is called attributes. Along this chapter, we will see how to use main interaction-related components, in particular for querying, drawing, and modifying geographical features. Then, we will see the default interactions at both the functional and code levels. We will end by reviewing the remaining interactions.
In this chapter, we will cover:
Let's get started by reviewing the part related to conversion and selection of vector formats.
Selection is mainly achieved through vector layers. So, a small introduction to data conversion can be useful.
In this section, we want to introduce you to the creation of static data in a particular vector, which is required in most cases where there is a need to click on your map to get information.
Let's see how you can provide vector data to our OpenLayers 3 library. We will not explain again how to work with vectors here—just how to provide them.
If you remember, we told you in Chapter 1, Getting Started with OpenLayers, in the section Anatomy of a web-mapping application, that the OpenLayers 3 library can consume dynamic vector data or static. The main difference resides in the fact that data is dynamically provided on demand. At the end of it all, OpenLayers consumes the same formats.
As a reminder for vector layers, the main following formats are supported:
You can go further by reviewing the content from Chapter 5, Using Vector Layers, and inspecting all ol.format.* available following the API documentation at http://openlayers.org/en/v3.0.0/apidoc/ol.format.html. You should not forget some formats can be abstract classes for other formats.
We have chosen to focus only on GeoJSON and KML: they are the most used formats for static files. As long as your applications do not use large amount of data, it's one of the most practical solutions. But most of the time, we don't have data directly available in those formats: a large percentage of geographic data production and manipulation is done using desktop mapping software that does not use those formats as a primary storage solution.
To understand why, let's see a context where you start to make your own examples. In this case, you have three main choices to have data:
From a programmer's point of view, GIS (Geographical Information System) is software to manage geographical datasets and make maps. We really chose to restrict the definition to keep it simple. That's why we encourage you to learn further by starting with the GIS Wikipedia page http://en.wikipedia.org/wiki/Geographic_information_system and also try out searches through search engines on the topic.
GIS was first used for desktop applications. With the growth of the Web, the GIS world extended to the Internet. The main problems to fill the gap between desktop-oriented geographic data and web geographic data were:
The second is also partly broken with open data, but lots of open data datasets always use GIS Desktop formats like the shapefile. We will not explain this format but demonstrate by an example of how you can do some data conversion.
To find open data portals, the main entry for America is https://www.data.gov.
For Europe, you should visit http://publicdata.eu.
For a worldwide overview, go at http://datacatalogs.org, a website for A Comprehensive List of Open Data Catalogs from Around the World.
To grasp the state of OpenData in your country, you can visit the Global Open Data Index at http://global.census.okfn.org. It's a website maintained by the community to make surveys about each country's open data initiative. The focus is mainly about the type of open data datasets available.
For illustration purposes, we will use data coming from the Geographical Information System at the Commission (GISCO), a Eurostat (an European commission organism) service which promotes and stimulates the use of GIS within the European Statistical System and the Commission. We chose to use the Nomenclature of Units for Territorial Statistics (NUTS), the main administrative units within Europe. Perform these steps to achieve the objective outlined in this paragraph:
ZIP file. After that, click on the Submit button. The following screenshot is the result of these two steps:
shp file name NUTSV9_LEAC.shp. You will also see in the page center an Overview Map.ZIP file mygeodata.json. Here's how the screen will look upon performing these steps: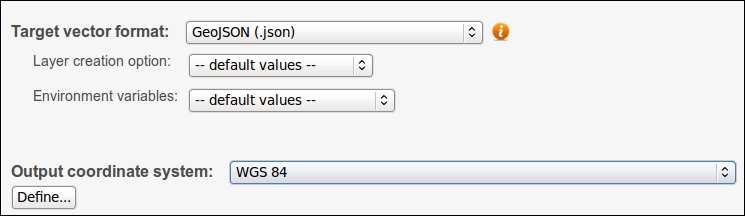
NUTSV9_LEAC.json. Rename it now to nutsv9_lea.geojson. Our application will use it later.We saw how we can use an external online website to have a first approach of geographical data conversion without installing specific software on your machine. You also saw that you only review a small part of the possibilities of the online tool to make conversion.
After this small conclusion, let's work more on the topic of data.
Remember that we introduced open data portals during the chapter and GIS files formats in particular in Chapter 5, Using Vector Layers. To revise and go a bit further, perform the following tasks:
Data conversion tips
We chose to introduce you to an on-line application to make GIS data conversion. Imagine that you need to filter a large dataset and the upload size is big; you may need to use a local application for this. We advise you to do it with QGIS at http://qgis.org, an open source desktop software where you can view the geographical dataset itself in a GUI. If you prefer the command line, you'd better use GDAL (Geospatial Data Abstraction Library), a tool to make GIS data conversion, available at http://gdal.org.
You should also visit the website http://www.mapshaper.org. Contrary to the reviewed use case, the goal of MapShaper is to simplify the data in order to get a lighter dataset, in particular to gain time when loading. Do not hesitate because most of the time, you don't need a high level of precision!
With this example, you will also be able to learn some useful things that you will learn more deeply in Chapter 6, Styling Vector Layers. Perform the following steps to do just that:
2360_08_01_simple_select.html and put it in the sandbox directory.assets folder, and put the file nutsv9_lea.geojson there, or download it also from the support site. python -m SimpleHTTPServer because of Ajax's same-origin policy requirements.http://localhost:8000/2360_08_01_simple_select.html if you use the Python server) to click on the blue features. Use the Shift key, and select more than one feature to get a result that might look like the following screensot: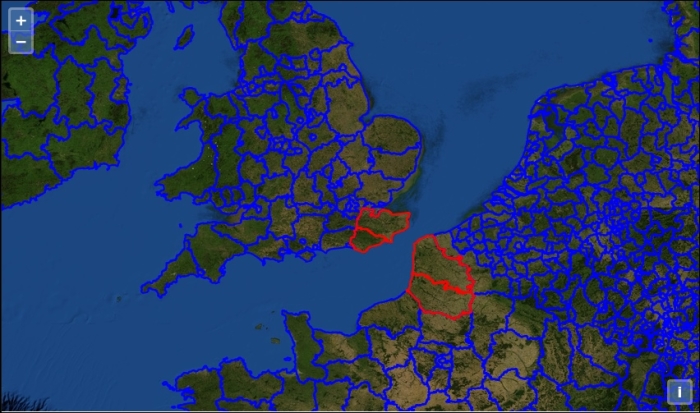
Let's have a look at the code used in this task.
First, we declared the usual raster layer as the background with the following code:
var raster = new ol.layer.Tile({
source: new ol.source.MapQuest({layer: 'sat'})
});Then, we started to declare the style that is applied when we select one or more features. It's exactly like the usual styling.
Later, when selecting with the ol.interaction.Select, we will reuse this style. Here's how we declare the style:
var selectEuropa = new ol.style.Style({
stroke: new ol.style.Stroke({
color: '#ff0000',
width: 2
})
});This part is dedicated to preparing styling for the vector layer when there is no selection; it's the blue stroke you see in the preceding screenshot:
var defaultEuropa = new ol.style.Style({
stroke: new ol.style.Stroke({
color: '#0000ff',
width: 2
})
});Next, we started to declare the vector layer and its source ol.source.GeoJSON, where we mentioned the projection of the map and the GeoJSON file we produced in the previous part of the chapter. We lowered the GeoJSON file and renamed the extension nutsv9_lea.geojson. We added into the style property in ol.layer.Vector an ol.style.Style class that uses your previous defaultEuropa, as follows:
var vectorEuropa = new ol.layer.Vector({
id: 'europa',
source: new ol.source.GeoJSON({
projection: 'EPSG:3857',
url: '../assets/data/nutsv9_lea.geojson'
}),
style: defaultEuropa
});We also needed to declare the interaction constructor to make the selection, or our style for selection will never work.
The way to do it is to instantiate it with:
var selectInteraction = new ol.interaction.Select({
condition: ol.events.condition.singleClick,
toggleCondition: ol.interaction.condition.shiftKeyOnly,
layers: function (layer) {
return layer.get('id') == 'europa';
}
});When you are in a complex map, you have more than one layer. Using the option layers is the way to say the click will only query information from layers that match the condition. You use a function to do this filtering. You can also use an array of layers, but it's less powerful. So, if you click in a place where a feature with layer id is 'europa', it will apply the right style. The condition variable is a static variable you can choose when you want to change behavior for select. By default, it's the single click that triggers the selection, but it can also be, for example, the Alt + click that can do it if you wish. It's also the same for toggleCondition. The purpose of this property is to set the condition when you want to toggle selection. In this case, we just use the default condition for learning purposes.
Then, we do the usual operations: declare the center, the view, and the map, then add to the map the layers, and set the view for the map, as follows:
var london = ol.proj.transform([-0.12755, 51.507222], 'EPSG:4326', 'EPSG:3857');
var view = new ol.View({
center: london,
zoom: 6
});
var map = new ol.Map({
target: 'map'
});
map.addLayer(raster);
map.addLayer(vectorEuropa);
map.setView(view);At the end of it all, we finished by adding the ol.interaction.Select object, as follows:
map.getInteractions().extend([selectInteraction]);
An alternative syntax to get the same result can be done by adding it in the interactions property of the ol.Map constructor, as follows:
var map = new ol.Map({
interactions: ol.interaction.defaults().extend([selectInteraction]),
target: 'map'
});After this first introduction, let's do another useful example to learn how to manage multi-selection or make a selection with points instead of polygons.
Now, let's reuse the previous example and discover more.
2360_08_01_simple_select.html in a new file called 2360_08_02_select_options.html.vectorEuropa declaration, add the following JavaScript code to create the vector layer for points. A new dataset, a GeoJSON file france_4326.geojson, is available on the book's webpage:var defaultFrancePoints = new ol.style.Style({
image: new ol.style.Circle({
fill: new ol.style.Fill({
color: 'blue'
}),
stroke: new ol.style.Stroke({
color: '#ffcc00'
}),
radius: 8
})
});
var selectFrancePoints = new ol.style.Style({
image: new ol.style.Circle({
fill: new ol.style.Fill({
color: '#ff0000'
}),
stroke: new ol.style.Stroke({
color: '#ffccff'
}),
radius: 16
})
});
var vectorFrancePoints = new ol.layer.Vector({
id: 'france',
source: new ol.source.GeoJSON({
projection: 'EPSG:3857',
url: '../assets/data/france_4326.geojson'
}),
style: defaultFrancePoints
});selectInteraction declaration, as follows:var selectInteraction = new ol.interaction.Select({
layers: function(layer) {
return layer.get('selectable') == true;
}
});vectorEuropa, add the new vector layer, as follows:map.addLayer(vectorFrancePoints);
selectable to be more meaningful, as follows:vectorEuropa.set('selectable', true);
vectorFrancePoints.set('selectable', true);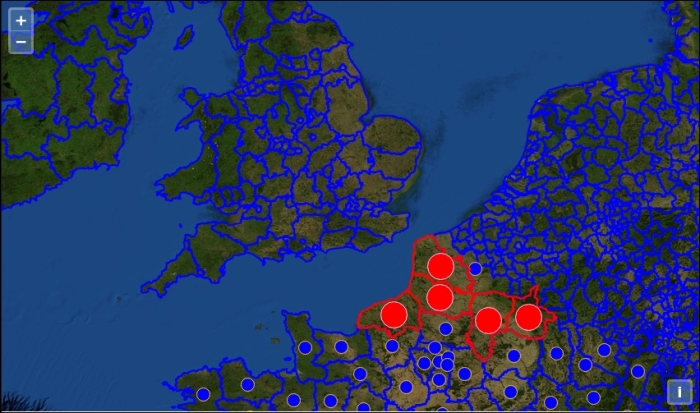
We will not review all the code, but focus only on important points.
In the new block that declares the vectorFrancePoints layer, we just reviewed the vector point styling. Using the ol.style.Circle component, we set in style with the key image.
We kept the logic of the styles in order to keep the behavior for the selection: rules as reminders are applied if conditions they contain are met, whereas the style in ol.layer.Vector is the default style for the vector layers.
In the selectInteraction declaration, we changed the property that helps match our layers. Previously, we were matching using id with the value europa, and now, we are matching if a property selectable is true. But, as we do not declare initially in the layers some properties, we set them by adding a selectable property to both layers.
After you've seen everything you have to know about the ol.interaction.Select component, it's time to try to go further to really acquire knowledge by yourself about this part of the library.
For this, reuse the previous example and improve it using the following instructions:
linestrings. It can be SHP, KML, or GeoJSON. If required, transform the format to be able to consume it with the OpenLayers 3 library.styles you have to use to style the linestrings layer.ol.dom.Input to be able to play on selectability.Until now, we have only focused on the ol.interaction.Select component. Its main goals are to be able to highlight information by making a symbolization change and get information from the geographic features, for example.
But how can you also return information from the layers on your map and show them? That what we will see in the next part.
If you remember the description of layers, two main layers types are vector and raster. Some layers with specific ol.source accept methods to access geographic features in your map. The map queries each of the specified layers for this information, but not all layers support this. Only layers that support querying for geographic features will return results.
Without going deep into explanation, think that for the vector, you are querying the features near the point where you've done the click. Whereas for raster, you ask a remote resource to get a position on the image and extrapolate from this position the features of the image.
We will first review how to work with a vector source and then with raster sources. Do not worry if you don't already understand everything: we will review some concepts in the chapters dedicated to layers in particular.
So, we will see first how to get features from vectors, then explore how to do it from the method associated with raster, and try to discover where they differ.
Let's try with another example to discover more about the forEachFeatureAtPixel method. It should remind you about the last sample from Chapter 5, Using Vector Layers. To complete the task, check the following steps:
2360_08_01_simple_select.html in a new HTML file 2360_08_03_foreachfeatureatpixel.html.ol.js JavaScript file reference with ol-debug.js.map.on('click' , function(evt) {
var pixel = evt.pixel;
console.log(evt);
console.log(pixel);});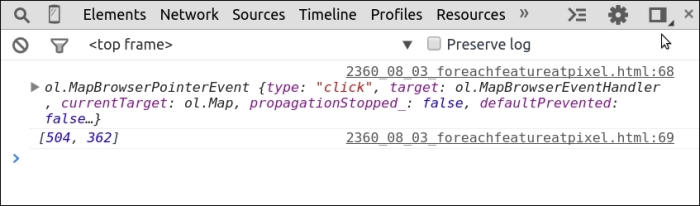
console.log statements, and add the following code just after the line var pixel = evt.pixel;displayFeatureInfo(pixel);.displayFeatureInfo before the map.on( code:var displayFeatureInfo = function(pixel) {
var features = [];
map.forEachFeatureAtPixel(pixel, function(feature, layer) {
features.push(feature);
});
console.log(features);};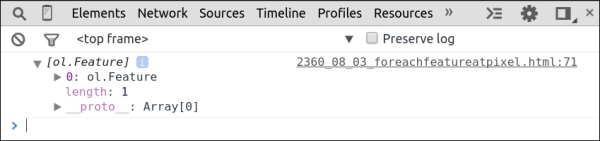
console.log with this code:var container = document.getElementById('information');
if (features.length > 0) {
var info = [];
for (var i = 0, ii = features.length; i < ii; ++i) {
info.push(features[i].get('N3NM'));
}
container.innerHTML = info.join(', ') || '(unknown)';
} else {
container.innerHTML = ' ';
}<div id="information"></div>
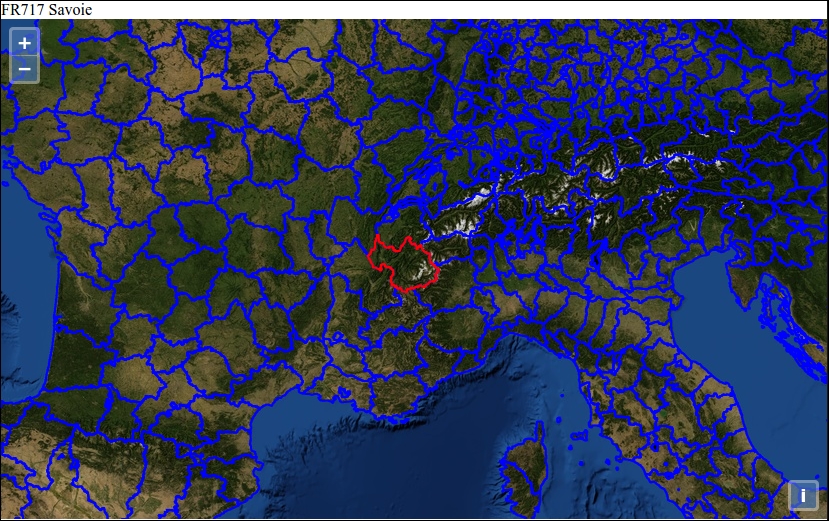
First, with console.log, we tried to see the event content and also get the pixel position with an array of x, y, where we click. Next, we made a call to the function that relies on a map.forEachFeatureAtPixel function. Its purpose is to get back every feature under the click using the pixel position from the event where we want to see the return you get from the callback in success property and also restrict the action on the vectorEuropa layer.
We also saw that the return contained the ol.Feature object, and because of this, we chose to play to try if the return was empty or not. As a click can send back more than one feature, we used a loop to push the features property N3NM information in an array. Depending on this, we have the choice to display or not the name of the NUTS region with the attribute N3NM in a DOM element in the screenshot FR717 Savoie.
After this review, we know how to retrieve and manipulate information from vector layers. You understand that the method map.forEachFeatureAtPixel within displayFeatureInfo sends back ol.Feature. You can manipulate to retrieve geometry or attributes from the layers you click on.
There is another way to retrieve information when clicking, and it's with the WMS getGetFeatureInfoUrl method. In which circumstances should we use it, and why does it exist?
The title can be unclear if you don't already have some basics.
For this, we will start by reviewing the Open Geospatial Consortium (OGC) Web Map Services (WMS) standard.
Let's begin with the basics of WMS, and later, we will come back to the main topic.
For this, we will reuse two excerpts from the Geoserver documentation (a server-side component that can work with the OpenLayers 3 library).
The first one summarizes what WMS is:
"The OGC Web Map Service (WMS) specification defines an HTTP interface for requesting georeferenced map images from a server."
The second one, a table, gives you the type of requests the WMS standard can perform:
In this list of possible operations, the most common operation is GetMap, an operation that send back an image to display in a client, JavaScript or desktop.
But you also see GetFeatureInfo, an optional operation for WMS.
Here, when you read, the point is that it's not the client side that manages returned features, but the server side. The purpose here is to have less load on the client side: managing a lot of features in the client side is mainly a pain, in particular if you use DOM.
The idea is to send the information to a server and retrieve the minimum and really light result. The result can be an HTML, a GML, raw text or depending on your server, also a GeoJSON. To illustrate, type into your browser the following URL:
You will see an HTML table with information from the point where we clicked on: INFO_FORMAT= text/html. It is the way to say we want an HTML format return.
As a conclusion, just retain at the moment that when you choose to use the OpenLayers getGetFeatureInfoUrl method, you are supposed to use it with WMS layers.
Now, you have enough knowledge, let's go back to the main topic.
Let's start with a new example:
2360_08_01_simple_select.html to reuse it as a model in 2360_08_04_getgetfeatureinfourl.html.ol.js file the HTML content that follows:<script src="http://code.jquery.com/jquery-1.11.0.min.js"></script>
<script> </script>. Next, add the following code into the same block:var wms_layer = new ol.layer.Tile({
source: new ol.source.TileWMS({
url: 'http://demo.opengeo.org/geoserver/wms',
params: {'LAYERS': 'ne:ne'}
})
});
var view = new ol.View({
center: [0, 0],
zoom: 1
});
var map = new ol.Map({
layers: [wms_layer],
target: 'map',
view: view
});
var viewProjection = view.getProjection();
var viewResolution = view.getResolution();
map.on('click', function(evt) {
var container = document.getElementById('information');
var url = wms_layer.getSource().getGetFeatureInfoUrl(
evt.coordinate, viewResolution, viewProjection,
{'INFO_FORMAT': 'text/javascript',
'propertyName': 'formal_en'});
if (url) {
var parser = new ol.format.GeoJSON();
$.ajax({
url: url,
dataType: 'jsonp',
jsonpCallback: 'parseResponse'
}).then(function(response) {
var result = parser.readFeatures(response);
if (result.length) {
var info =[];
for (var i = 0, ii = result.length; i < ii; ++i) {
info.push(result[i].get('formal_en'));
}
container.innerHTML = info.join(', ');
} else {
container.innerHTML = ' ';
}
});
}
});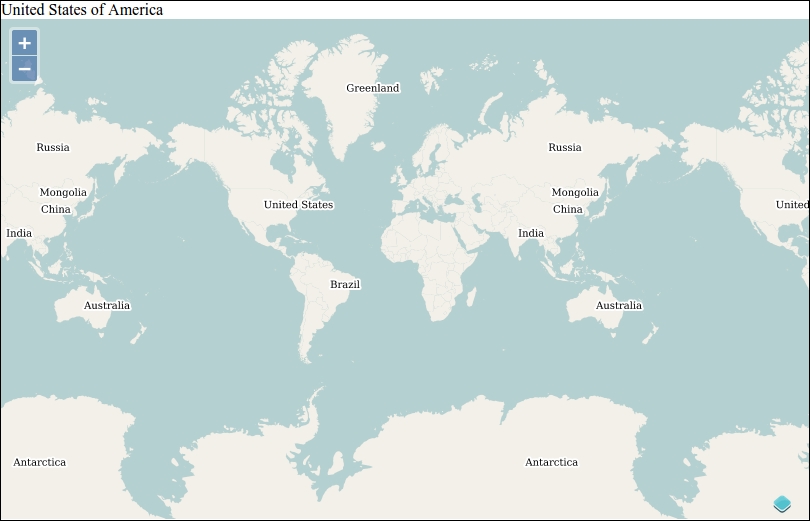
We started by creating a tiled WMS layer, a raster type layer. Next, we created the view and the map. Then we got parameters from the view required later in the code—the resolution and the projection—and we got the DOM element information reference where we will display our click result. The most important part happens in the declaration map.on('click', function(evt) {, means wherever you click in the map, the code within the block is executed.
In this block, we declared an url variable to call the WMS web service. Its result was provided by a function generated from a WMS source using also the coordinates of the click, the resolution, the projection, and the query parameters.
The coordinates were provided by the click. The query parameters defined the returned type expected from the web service. In this case, we wanted the JSONP return encapsulating GeoJSON (JSONP) using 'INFO_FORMAT': 'text/javascript'. They also help to select only the properties we want from the web service ('propertyName': 'formal_en').
You can discover more by setting a breakpoint, and when clicking on the map, copying the URL string, and then, opening it in a new browser window to inspect.
Then, we declared an ol.format.GeoJSON object called parser, a component designed to understand the returned GeoJSON content from the Ajax call just after.
The Ajax call was done using a jQuery function $.ajax({...}).then(function(response) {, hence the jQuery script addition previously. The url parameter is not enough to manage JSONP. We need to custom the Ajax call to manage JSONP. JSONP allows remote calls to resources external to your website without encountering any issues with Ajax same origin policy (see the Wikipedia web page about the subject https://en.wikipedia.org/wiki/Same-origin_policy).
The code in the block reuses the received content and adds it as a JavaScript object in the result variable. This new object, an array, is manipulated to retrieve the text data United States of America and displays it in the container DOM element.
It's recommended also that you see in the network panel what happens every time you click on the map. The following screenshot is a depiction of the network panel:
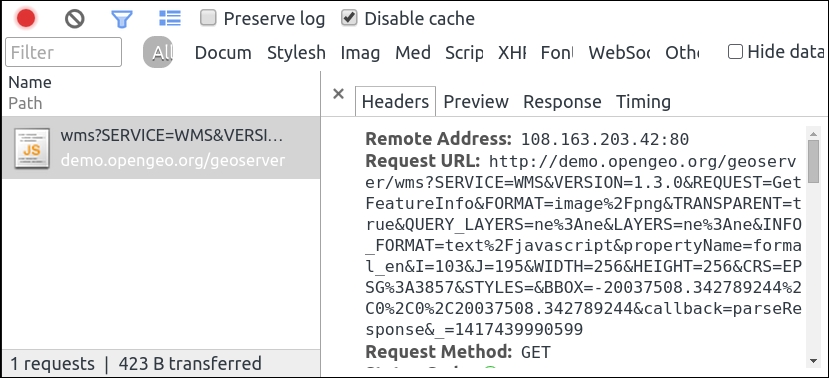
The important thing here is you rely on a web service able to provide a raster map based on a standard, and you are also able to get remotely the features below the place where you click. The main advantage here is to have less coupling between your server code and your JavaScript code. However, on the other side, you can suffer from latency (time to receive the response from the URL call). Up until now, every piece of information returned was always displayed in a DOM element outside of the map. How can we display it on the top of the map as a pop-up?
That's what we will see in the next part mainly based on ol.Overlay, a component we already use in the Chapter 2, Key Concepts in OpenLayers.
To add a pop-up, you can rely exclusively on HTML and CSS, but the OpenLayers 3 library bundles a component to help you to display information in a pop-up.
You will find below the reference for this component called ol.Overlay. Only a light review will be done here because some examples will follow to illustrate.
The object is instantiated with a constructor such as:
var yourOverlay = new ol.Overlay({
element:document.getElementById('yourOverlayElement')
})Because ol.Overlay inherits from ol.Object, we only describe here the methods related to the object itself.
You can check out the complete ol.Overlay API documentation at http://openlayers.org/en/v3.0.0/apidoc/ol.Overlay.html.
After this small component review, we will first see the simplest case for using ol.Overlay with a static example where the information is not coming from any query but only from a DOM element.
To illustrate the simplest use case for ol.Overlay, let's perform the following steps:
2360_08_01_simple_select.html, we always used in the chapter, in a new file 2360_08_05_simple_overlay.html. You can also check the code at the Packt code book URL.assets/css/samples.css this code:#popup {
background: red;
}<div id="map" class="map"></div> with <div id="map" class="map">, as follows:<div id="popup"><b>OpenLayers 3 Code Sprint</b> <i>Humanities A3</i></div> </div>
var popup = new ol.Overlay({
element: document.getElementById('popup')
});
var osmLayer = new ol.layer.Tile({
source: new ol.source.OSM()
});
var ol3_sprint_location = ol.proj.transform([-1.20472, 52.93646], 'EPSG:4326', 'EPSG:3857');
var view = new ol.View({
center: ol3_sprint_location,
zoom: 16
});
var map = new ol.Map({
target: 'map'
});
map.addLayer(osmLayer);
map.setView(view);
map.addOverlay(popup);
popup.setPosition(ol3_sprint_location);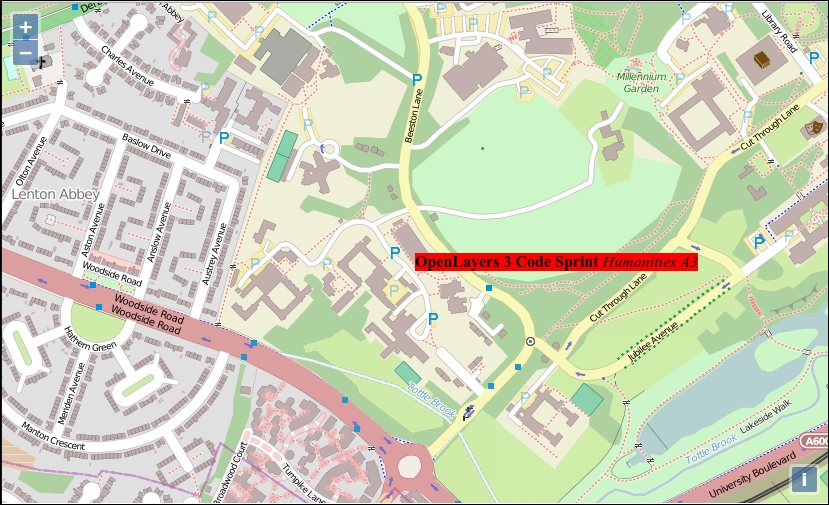
Let's review the code to understand the way ol.Overlay works.
First, we defined a new ol.Overlay with the following:
var popup = new ol.Overlay({
element: document.getElementById('popup')
});The element property in the object literal option of the constructor has to reference an HTML element.
Here, we reference the HTML text <b>OpenLayers 3 Code Sprint</b> <i>Humanities A3</i> located in a <div> tag with an id value of popup.
Next, we performed the usual steps, such as creating layers, creating map, adding the layers, and setting the view, as follows:
var osmLayer = new ol.layer.Tile({
...
...
map.setView(view);Just after this block, we added the ol.Overlay object to the map in order to declare that we are using an overlay:
map.addOverlay(popup);
Instead of adding overlays after the preceding map, you can also use the option in the ol.Map constructor, as shown in the following sample:
var map = new ol.Map({
target: 'map',
overlays: [popup]
});The following line was to set the position of the DOM element by matching coordinates and image position:
popup.setPosition(ol3_sprint_location);
The name overlay implies also that there is something at the top of something else. To understand, just see the screenshot of the Chrome Developers Tools Elements panel, as follows:
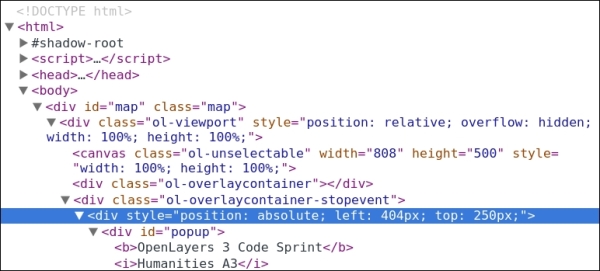
As you see, the pop-up is included in a div tag, also contained in a div tag with class ol-overlaycontainer situated after the canvas element (where the map is drawn).
Now, let's assemble our knowledge with overlay and map feature methods.
In this case, we will reuse just the previous example as a model.
2360_08_06_layer_overlay.html.<b>OpenLayers 3 Code Sprint</b> <i>Humanities A3</i> from the HTML.osmLayer declaration, add the following code, where we are reusing again the vectorEuropa layer with the styles:var selectEuropa = new ol.style.Style({
stroke: new ol.style.Stroke({
color: '#ff0000',
width: 2
})
});
var defaultEuropa = new ol.style.Style({
stroke: new ol.style.Stroke({
color: '#0000ff',
width: 2
})
});
var vectorEuropa = new ol.layer.Vector({
id: 'europa',
source: new ol.source.GeoJSON({
projection: 'EPSG:3857',
url: '../assets/data/nutsv9_lea.geojson'
}),
style: defaultEuropa
});ol.interaction.Select component, as shown in the following code.var selectInteraction = new ol.interaction.Select({
layers: function (layer) {
return layer.get('id') == 'europa';
}
});map.addLayer(osmLayer);, add to the map the following new layer:map.addLayer(vectorEuropa);
map.addOverlay(popup);, add the code that follows:function pickRandomProperty() {
var prefix = ['bottom', 'center', 'top'];
var randPrefix = prefix[Math.floor(Math.random() * prefix.length)];
var suffix = ['left', 'center', 'right'];
var randSuffix = suffix[Math.floor(Math.random() * suffix.length)];
return randPrefix + '-' + randSuffix;
}
var container = document.getElementById('popup');
var displayFeatureInfo = function(pixel, coordinate) {
var features = [];
map.forEachFeatureAtPixel(pixel, function(feature, layer) {
features.push(feature);
});
if (features.length > 0) {
var info = [];
for (var i = 0, ii = features.length; i < ii; ++i) {
info.push(features[i].get('N3NM'));
}
container.innerHTML = info.join(', ') || '(unknown)';
var randomPositioning = pickRandomProperty();
popup.setPositioning(randomPositioning);
popup.setPosition(coordinate);
} else {
container.innerHTML = ' ';
}
};
map.on('click', function(evt) {
var coordinate = evt.coordinate;
displayFeatureInfo(evt.pixel, coordinate);
});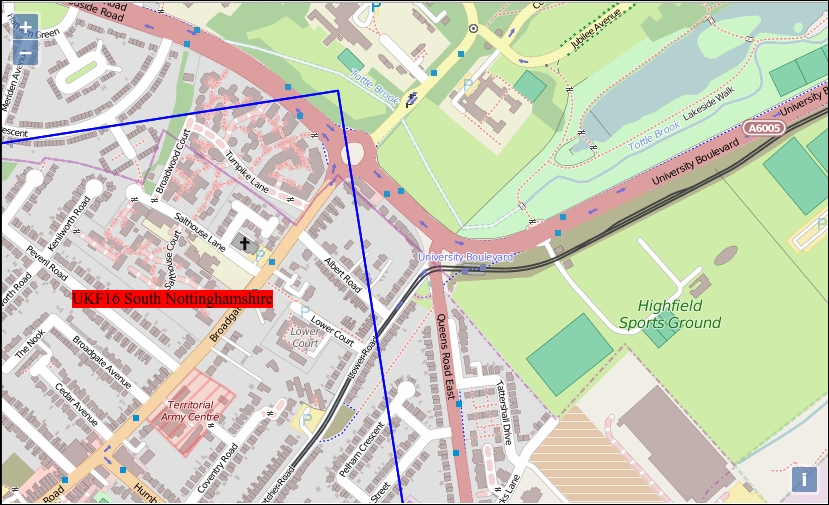
First, we added to the previous example the vector EuropaLayer in order to have areas easier to click on. It's because areas cover the entire map contrary to points where you need accurate clicking.
Next, we declared a function pickRandomProperty in order to generate a random string, fitting positioning parameters expected by the ol.Overlay component for a small demonstration purpose.
Then, we declared a modified displayFeatureInfo function reusing most of the code from 2360_08_03_foreachfeatureatpixel.html, where we set the positioning and the position. The position requires coordinates, so we added a second argument to displayFeatureInfo.
For positioning, we chose to display the content by changing the pop-up position randomly. This position is relative to the click event; to get this result, we reused the function pickRandomProperty, as follows:
var randomPositioning = pickRandomProperty(); popup.setPositioning(randomPositioning);
We also used the setter on the pop-up element in order to change its position according to the retrieved click coordinates, as follows:
popup.setPosition(coordinate);
We finished with the now quite usual block to add a click event to the map map.on('click', function(evt), but we retrieved the coordinates also and not only the pixel position to reuse the function displayFeatureInfo.
Now, you will learn to make dynamic use of ol.Overlay. You are also able to put a pop-up on your map using your geographic features.
You can try by yourself some experiments by following instructions given in the next section.
In order to go further, we advise you to do some exercises with ol.Overlay.
Your new assignment can be the following:
setTimeout() function to stop displaying the pop-up after some time. You can see a reference about setTimeout at https://developer.mozilla.org/en-US/docs/Web/API/WindowTimers.setTimeout. A short article at http://davidwalsh.name/javascript-debounce-function will also help you to understand why it can be useful.Interactions can happen not only with selecting and displaying information from your map. It's also possible, for example, to create new features by drawing points, lines, or polygons. You can also update features. We will mainly focus on geometric representations because the built-in functionalities in OpenLayers 3 are mainly dedicated for this.
To be able to do a basic save, we have developed a server-side script based on Node.js, a software platform for scalable server-side and networking applications. For the client side, the code will be more classical.
index.js and package.json files from the code from upcoming_url and put them in the ol3_samples directory.ol3_samples folder path, as follows:npm install
features.geojson into ol3_samples/assets/data/.index.js and opening http://localhost:3000/features.geojson. You should see something like the following:{type: "FeatureCollection", features: [ ]}2360_08_07_create_new_content.html in the usual sandbox folder by copying 2360_08_01_simple_select.html.<div> tag for the map and a form to enable you to choose future drawing types (point, line string, and polygon) with the following code:<div id="map" class="map">
</div>
<form class="form-inline">
<label>Geometry type </label>
<select id="type">
<option value="Point">Point</option>
<option value="LineString">LineString</option>
<option value="Polygon">Polygon</option>
</select>
</form>
<script src="../assets/ol3/ol.js"></script>
<script src="http://code.jquery.com/jquery-1.11.0.min.js"></script><script> without forgetting to close it at the end, and copy the following code into it:var raster = new ol.layer.Tile({
source: new ol.source.MapQuest({layer: 'sat'})
});
var source = new ol.source.GeoJSON({
url: '/features.geojson'
});
var vector = new ol.layer.Vector({
id: 'vector',
source: source,
style: new ol.style.Style({
fill: new ol.style.Fill({
color: 'rgba(255, 255, 255, 0.2)'
}),
stroke: new ol.style.Stroke({
color: '#ffcc33',
width: 2
}),
image: new ol.style.Circle({
radius: 7,
fill: new ol.style.Fill({
color: '#ffcc33'
})
})
})
});
var map = new ol.Map({
layers: [raster, vector],
target: 'map',
view: new ol.View({
center: [-11000000, 4600000],
zoom: 4
})
});http://localhost:3000/sandbox/2360_08_07_create_new_content.html to see the definitive sample look.var typeSelect = document.getElementById('type');
function addInteraction() {
draw = new ol.interaction.Draw({
source: source,
type: typeSelect.value
});
map.addInteraction(draw);
}
typeSelect.onchange = function(e) {
map.removeInteraction(draw);
addInteraction();
};
addInteraction();componentReload on the page to see that you can draw but there is no persistency.addInteraction function, copy the following code:draw.on('drawend',
function(evt) {
console.log(evt.feature);
var parser = new ol.format.GeoJSON();
var features = source.getFeatures();
var featuresGeoJSON = parser.writeFeatures(features);
$.ajax({
url: '/features.geojson',
type: 'POST',
data: featuresGeoJSON
}).then(function(response) {
console.log(response);
});
},
this);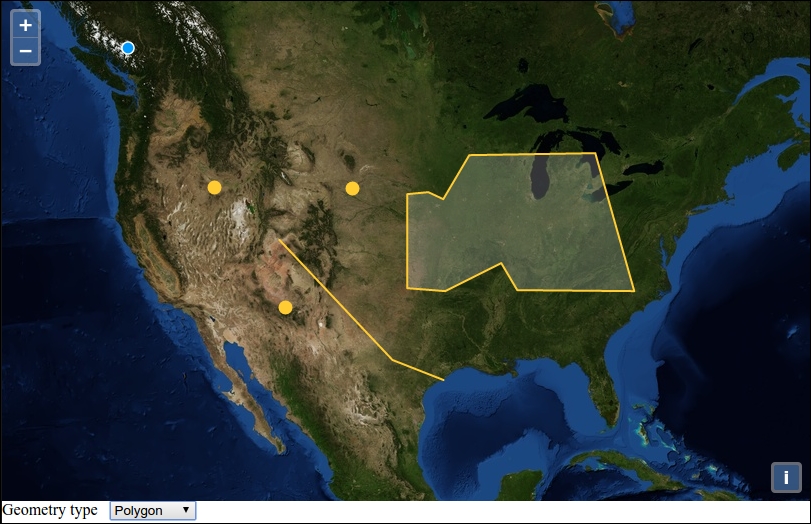
We created a map that uses a drawing component.
Each time you choose a Geometry type, it removes the ol.interaction.Draw component and adds again a new one using the code in typeSelect.onchange.
In the called function, the key feature is the drawend event bound to the draw component. Each time the user finishes drawing, it fires an event that send a feature.
In our case, we chose to get features from the source as GeoJSON using ol.format.GeoJSON and send them via an Ajax post call.
Depending on your backend, or for client storage, you can change what you want to send. The sample sends all features using a GeoJSON format, but you can customize the URL call, change the format to let's say GML, or only send the added feature and not all the features.
For this last case, you can see the log returned from console.log(evt.feature);.
The assignment will be quite simple because the component at the time of writing needs some refining. It's possible to edit content but there are no events to catch at the end of modification: we will be unable to save the modified features. We will cover the client as is.
2360_08_01_simple_select.html as 2360_08_08_modify.html.var london, add the following code:var modify = new ol.interaction.Modify({
features: selectInteraction.getFeatures()
});map.getInteractions().extend([selectInteraction]); with the following code:map.getInteractions().extend([selectInteraction, modify]);
var selected_features = selectInteraction.getFeatures();
selected_features.on('add', function(event) {
var feature = event.element;
feature.on('change', function(event){
event.target.getGeometry().getCoordinates());
});
});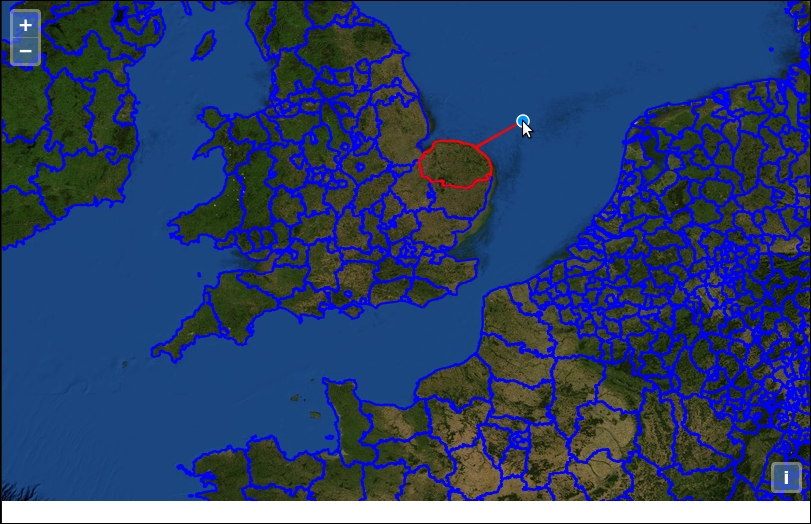
We saw in this sample how to use ol.interaction.Modify here using the modify component. We also saw that it requires ol.interaction.Select. To be able to listen to change, there is no available method on ol.interaction.Modify to directly know the modification to the features. You have to listen to changes on features with selected_features.on('add', function(event) {.
To make this behavior really more obvious, we also used a console.log statement, so when using the browser console debugger, you are able to follow the call when a feature is modified.
After reviewing, drawing, and modifying features, it's time to deepen our interactions knowledge: preferring a practical approach, we only scratched the surface (their definitions) until now.
Until now, we never inspected relations between interactions. So, it's time to examine ol.interaction.* classes. All the classes inherit from ol.interaction.Interaction, but compared to controls, it's less simple; you also have subclasses.
See the following diagram to grasp the relationships between the different interaction classes:
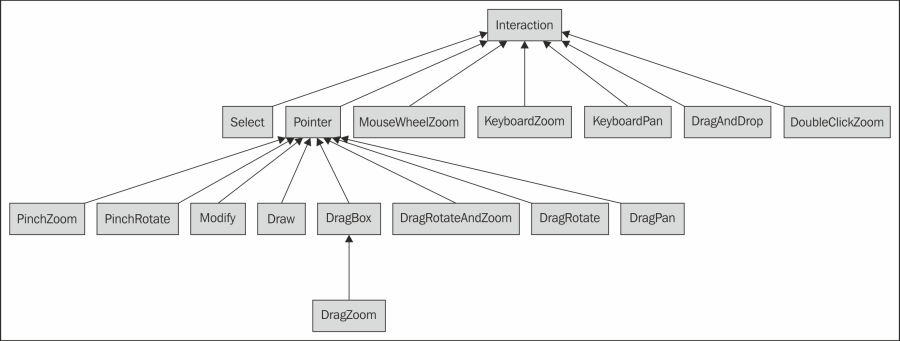
An inspection of the above schema shows that every ol.interaction component inherits from ol.interaction.Interaction. In some cases, when an interaction uses a mouse, pen, or touchscreen, it will need to inherit from ol.interaction.Pointer, which deals with this use case.
You can also note with the schema that interactions are tied to touch events for mobile, mouse events like click or drag, mouse events with the mouse wheel, and the keyboard. You can combine them depending on the expected behaviors. Luckily, by default, you can deal with them with ease. Let's see how. After this, we will explore different ways to make more customizations.
Most of the time, you don't really need to deal with interaction behaviors, but sometimes knowing how to manage them is a requirement.
You have two choices for simple cases:
var map = new ol.Map({
...
controls:[],
interactions:[],
...
});Consider that you need most default behaviors, but you don't need all of them. In this case, you will have to use the ol.interaction.defaults function.
As mentioned previously, the best and simplest way to handle interactions is by reusing the ol.interaction.defaults function, as follows.
Let's review the properties you can set in the options:
Let's deactivate zoom and pan with the keyboard and also the rotate when doing Alt + Shift + mouse drag.
For this, do the following:
<div id="map" class="map"></div> the attribute tabIndex with a value 0 to make it focusable.keyboard option to false in the interactions property of the ol.Map object.altShiftDragRotate option. Try different actions with the left, right, up, and down arrows or with the plus and minus keys.Here you just saw an example to deactivate some default behaviors.
By changing keyboard options to false, we make the application unable to respond to keyboard interaction with pan and zoom.
After reviewing the ol.interaction.defaults function itself, you also learn that each map already embedded nine ol.interaction by default, and for keyboard, the switch works for all keyboard interactions.
Let's see exactly what each of those interactions does at the functional level more than at the code level. We already introduced them in Chapter 2, Key Concepts in OpenLayers, so you should not be lost.
ol.interaction.DoubleClickZoom: This interaction allows users to zoom by double-clicking. You can set the duration to change animation time and delta when you want to change the zoom delta.ol.interaction.DragPan: It allows to you to pan by dragging the map. You can set panning behavior by setting the kinetic property.ol.interaction.DragRotate: This interaction makes the map rotate when you combine both the Alt and Shift keys together to rotate the map image. You can change it by changing the condition property.ol.interaction.DragZoom: It enables you to draw a temporary rectangle when pressing the Shift key with the keyboard. Then, this rectangle is used to zoom on the selected region of the rectangle. You can change the condition for the behavior with a condition, but you can also choose a style when drawing. The most interesting part in this component, other than its behavior, is that it inherits from ol.interaction.DragBox. It means that we will be able to reuse the drawing rectangle behavior for other purposes and not only for zooming like here. Later in the chapter, we shall see how.ol.interaction.PinchRotate: On mobile devices, one of the main interactions is the pinch. In the OpenLayers 3 library's case, it is supported by default. The name itself is enough to understand that this component has a behavior similar to DragZoom, but when pinching. You can set the threshold property if your application requires to change sensitivity for rotating the map.ol.interaction.PinchZoom: As the previous component, it relies on the pinch but in order to zoom. It's like when you are browsing on mobile, but instead of getting only a lens effect, you really make a zoom in your map. You change the animation duration, setting the same duration property in the component.ol.interaction.KeyboardPan: Its role is to manage map browsing using only the keyboard. It needs to make the map focusable by adding a tabIndex attribute at your map div level. To get the focus for the map, you need to use the tab key. Then, panning can be controlled using the up, down, left, and right keys. The option pixelDelta enables you to set the translation in pixels when pushing on the keys. By default, it value is 128 pixels. It is also possible to set the now usual condition property.ol.interaction.KeyboardZoom: Its goal is similar to the previous component except that it applies when you use the keys plus and minus instead. This interaction can be set just as for DoubleClickZoom with the delta property and also the condition too.ol.interaction.MouseWheelZoom: As its name implies, this interaction is related to the use of the mouse wheel to zoom in or zoom out. The only custom behavior you can set for this interaction is the duration of the animation by default to 250 milliseconds.After this more verbose part, it's time to see the missing interactions.
We will first look at ol.interaction.DragRotateAndZoom, and then we will move on to the others.
These other interactions were sometimes used along the book chapters, but we did not always explain them completely; it was impossible with all the other concepts that required explanation at the time.
Let's follow the component's self-explaining name to try out it behaviour :
ol.interaction.defaults sample.interactions block in the ol.Map object as follows:var map = new ol.Map({
...
interactions: ol.interaction.defaults({
shiftDragZoom: false
}).extend([new ol.interaction.DragRotateAndZoom()]),
...
});First, as it can conflict with ol.interaction.DragRotateAndZoom, we deactivated the shiftDragZoom interaction by setting it to false. We chose this option, but it was also possible to change the key to activate the function using the condition property.
You also saw the now-common pattern to add interactions to existing default interaction using an array within the extend block. Practically, you also learned how to use the behavior.
Now, let's jump to the next interaction.
This interaction, according to the official documentation API, is for handling input of vector data by drag and drop. We already saw an example of using this in Chapter 5, Using Vector Layers.
The only additional thing that you can add is that when you drop the file after dragging it, when the event is triggered, you can get not only the features or their projection (experimental), but you can also get the filename. It can be useful, for example, to give a name to the layer, imagining we use the component together with a layer tree.
How did we deduce that it was also possible to retrieve this information? We did this simply by inspecting the API at http://openlayers.org/en/v3.0.0/apidoc/ol.interaction.DragAndDrop.html. It mentions the function signature when an event is fired, as follows:
addfeatures(ol.interaction.DragAndDropEvent).You can see that ol.interaction.DragAndDropEvent is involved. If you inspect its API definition, you will see and not be really surprised to discover members are features, files, and projections.
Just as a quick reminder, here are the DragAndDrop options (experimental):
|
Name |
Type |
Description |
|---|---|---|
|
|
|
These are the format constructors. |
|
|
|
This is the target projection. By default, the map's view's projection is used. |
Now, let's continue with another interaction implying always a drag-related event.
The official documentation describes this interaction as:
"Allowing the user to zoom the map by clicking and dragging on the map, normally combined with an ol.events.condition that limits it to when the Shift key is held down."
When reviewing ol.interaction.DragBox and seeing that it's the base class for ol.interaction.DragZoom, we already give you some hints for other use cases based on the same logic. It can be to select features based on a rectangular selection, to draw a rectangle, or to use it as a bounding box to generate and draw other shapes, such as ellipsoids and circles.
Let's look at how you can, for example, get the drawn rectangle as a GeoJSON string, where you've done a selection. Here, we suppose you are working on your desktop as mouse interaction is not available with mobile devices.
After introducing the goal, we should do the following:
osm_default and map variables.ol.interaction.DragBox, as follows:var dragBoxInteraction = new ol.interaction.DragBox({
condition: ol.events.condition.shiftKeyOnly,
style: new ol.style.Style({
stroke: new ol.style.Stroke({
color: 'red',
width: 2
})
})
});DragRotateAndZoom, deactivate DragZoom, and add the new interaction in the interactions parameter within ol.Map, as follows:interactions: ol.interaction.defaults({
shiftDragZoom: false
}).extend([dragBoxInteraction]),dragBoxInteraction and map declarations:dragBoxInteraction.on('boxend', function(e) {
var format = new ol.format.GeoJSON();
var geom = e.target.getGeometry();
geom.transform('EPSG:3857', 'EPSG:4326');
var feature = new ol.Feature({
geometry: geom
});
var obj = format.writeFeatures([feature]);
console.log(JSON.stringify(obj));
});In the first part, you should be able to draw the rectangle, but no events fired then like with the DragZoom for example. We chose to play with all the available options.
We set the condition to be able to activate the behavior only with the Shift key using ol.events.condition.shiftKeyOnly and changed the style to make a red border with 1 pixel's width.
We added the new interaction but disabled the other, which also uses ol.events.condition.shiftKeyOnly.
Finally, we reused the event listener to catch when the rectangle drawing ends with boxend.
Within this event, we manipulated the returned geometry ol.geometry.Polygon to change it projection and reuse it into ol.Feature. By providing this feature with the writeFeatures method of a new ol.format.GeoJSON, we were able to make the GeoJSON object and converted it into a string.
As a reminder, in the following table, you will find the expected optional parameters (and experimental) for the interaction:
|
Name |
Type |
Description |
|---|---|---|
|
|
|
This is a function that takes |
|
|
|
This is a style for the box. |
After this last assignment for the book, it's time for revision.
Let's look at a few questions to see what we understood during the chapter:
Q1. In a context where we want to query a WMS, what components and methods would be required for this?
ol.Map.ol.layer.Tile.ol.source.ImageWMS.ol.layer.Vector.ol.source.TileWMS.Q2. What will happen if we use the addCondition property value ol.interaction.condition.onlyAltKey to build ol.interaction.Select?
Q3. We want to make a style change. When selecting, what type is required in the option style of ol.layer.Vector?
ol.style.Style.ol.style.Stroke.ol.style.Fill.ol.style.Style.Q4. What is(are) the condition(s) not present by default in the available conditions when using interactions :
ol.events.condition.neverShift.ol.events.condition.never.ol.events.condition.shiftAlways.ol.events.condition.noModifierKey.ol.events.condition.shiftKeyOnly.In this chapter, we discovered more about the way to query information from your map. Compared to a paper map, interactive feedback from a map is one of the most powerful features you can expect. We hope following our guidance was not too tough.
Starting with data manipulation, you learned more about the complex world of GIS. Next, we discovered about the dedicated components to select and query maps. Afterwards, with a pop-up, we inspected how to nearly reproduce the Push Pins map (you can always reproduce it as an additional task).
We created and modified our own geographical data instead of consuming existing data.
Inspecting the default interactions, we helped to explain some hidden interactions, requiring key and mouse combinations. We didn't restrict our inspection to default interactions: we saw all interactions except the one concerning mobile devices like PinchZoom or PinchRotate as we will review them in Chapter 10, OpenLayers Goes Mobile.
Now, we will dive into controls. Controls are quite similar to interactions, but they depend on the DOM element. We will look at all the available controls in the coming chapter. This chapter will also help you to understand not only the purpose, but also the ways of creating custom controls.
So far, we've taken for granted that we will zoom in/out when clicking on plus or minus buttons. We haven't discussed much about what actually is behind the map interaction when you use buttons. The ol.control namespace contains numerous classes that make our maps interactive, in particular to configure behavior on your map. There are many built-in controls, each with their own unique functions. You can easily customize them with a CSS style or other parameters. Contrary to interactions, controls depend on DOM elements and not keyboard and mouse input only.
In this chapter, we'll cover the following topics:
ol.control classes and their organizationControls allow us to interact with our map. They also allow us to display extra information, such as displaying a scale bar with the ol.control.ScaleLine control. Before, in the previous generation of OpenLayers, version 2.x, some controls did not have a visual appearance. Nowadays, those elements, which do not rely on a DOM element, are called interactions like for example, touch interactions on mobiles. You can have as many controls on your map as you'd like. There are even some cases where you may not want any controls—such as embedding an unmovable map in a page, or showing a static map for printing.
There are two methods for adding controls to a map:
ol.control.* objects when you instantiate the map object.addControl(), method passing in a single control object. If you need to pass more than one control, just loop using an array of control objects, using the same addControl().When you create your map, three control objects are added automatically. These three controls are as follows:
ol.control.Attribution: This is responsible for displaying credits for producers of map data sources or tiles providers like for OpenStreetMap. By default, the control is located in the bottom-right corner.ol.control.Zoom: This is responsible for showing the plus and minus buttons in the top-left corner. Those buttons when clicking help to do a zoom in for plus and a zoom out for minus.ol.control.Rotate: This is responsible for resetting the map rotation to 0.Since these controls are added without us explicitly adding them, how do we choose to not include them? The simplest way is to pass an empty array or null to the control's property when instantiating the map. Another way to change default controls is to explicitly set the options for each of them to true or false when you call the ol.controls.defaults function in the controls property of the ol.Map object.
Let's review this use case before going further.
Follow these steps to start manipulating the default controls:
<!doctype html>
<html>
<head>
<title>Default controls</title>
<link rel="stylesheet" href="../assets/ol3/css/ol.css" type="text/css">
<link rel="stylesheet" href="../assets/css/samples.css" type="text/css" />
</head>
<body>
<div id="map" class="map"></div>
<script src="../assets/ol3/ol.js"></script>
<script>
</script>
</body>
</html><script> </script> add the declaration to the map:var osm_default = new ol.layer.Tile({
source: new ol.source.OSM()
});
var map = new ol.Map({
layers: [osm_default],
target: 'map',
view: new ol.View({
center: ol.proj.transform([-1.81185, 52.443141], 'EPSG:4326', 'EPSG:3857'),
zoom: 6 })
});python -m SimpleHTTPServer or node index.js (if you are using the code from the book samples) because some sources are sensitive to the URL context (or you will get a blank map).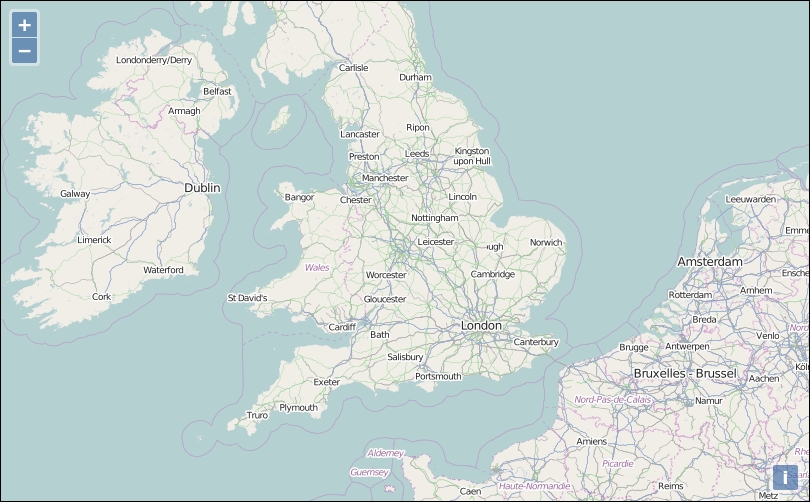
ol.control.defaults to cancel all default controls parameters in the map constructor. See the following code to understand this:var map = new ol.Map({ layers: [osm_default],
controls: ol.control.defaults({
zoom: false,
attribution: false,
rotate: false
}),
});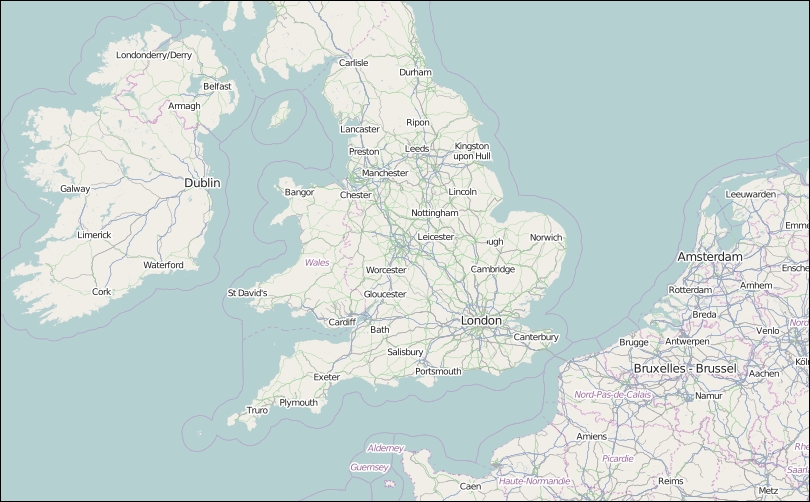
Let's examine the interesting part of the code:
controls: ol.control.defaults({
zoom: false,
attribution: false,
rotate: false
})To manage default controls, we must use a parameter in the ol.control.defaults function. This first parameter is an object that contains a key referring to the default controls. You can set their value to false to disable the corresponding control.
This object also supports other keys to set options for each default controls. These keys are attributionOptions, rotateOptions, and zoomControlOptions. We mentioned them here but we will see them later when reviewing each control individually.
The following table, an excerpt from the API documentation of ol.control.defaults, summarizes these properties:
After this long introduction to manipulation of controls, let's review all of them step by step. You can refer to the following diagram for a quick overview of the class hierarchy:
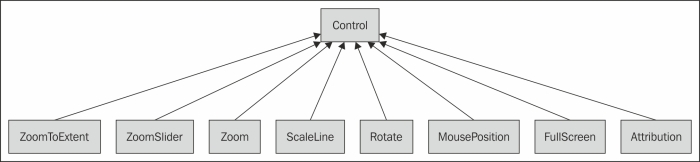
As you can see, all ol.control.* classes inherit from ol.control.Control.
So, first let's see this ol.control.Control.
The ol.control.Control is the parent class of all the available controls. It inherits from ol.Object, an abstract class that also inherits from ol.Observable, a convenient class to provide and manage listeners.
This object is responsible for the common options that all controls contain. All controls inherit from ol.control.Control, and it's exactly the same for the options. To understand its properties, just review how a control can be described.
"A control is a DOM element related to the map and that can be attached to an existing DOM element."
If you refer to the following table. The DOM element is the element property, the place that contains the look for the control. The target property is the place where you add the element into the DOM.
Never forget that it is useful to know ol.control.Control to understand its subclasses, but you never directly use it. You reuse this class only if you need to create your own control but it's not the time for this. First, we need to study controls provided by the Openlayers 3 library, which will be explained in the following sections.
The ol.control.Attribution control is not very new. We are already using it implicitly since we used the ol.layer.OSM class in Chapter 1, Getting Started with OpenLayers.
These are the options concerning the ol.control.Attribution control.
You can see all properties you can set for the control. You should be aware that those properties are considered as experimental in the OpenLayers 3 release.
We will discover the way to customize it in the following section.
Attributions, as a reminder, are the way to mention credits for layers sources that reference source of the tiles and/or data. The ol.control.Attribution control is dedicated for this.
ol.control.defaults options in the controls property of the map, and also set logo options to false at the ol.Map level:logo: false
controls: ol.control.defaults({
attributionOptions: {
},
}),attributionOptions to the following content and reload the page:attributionOptions: {
className: 'myCustomClass'
},myCustomClass to try to understand the effect of the className option in attributionOptions.attributionOptions:attributionOptions: {
className: 'myCustomClass',
target: document.getElementById('myattribution'),
},<div id="map" class="map"> </div>the following content:<br/> <div id="myattribution"></div>
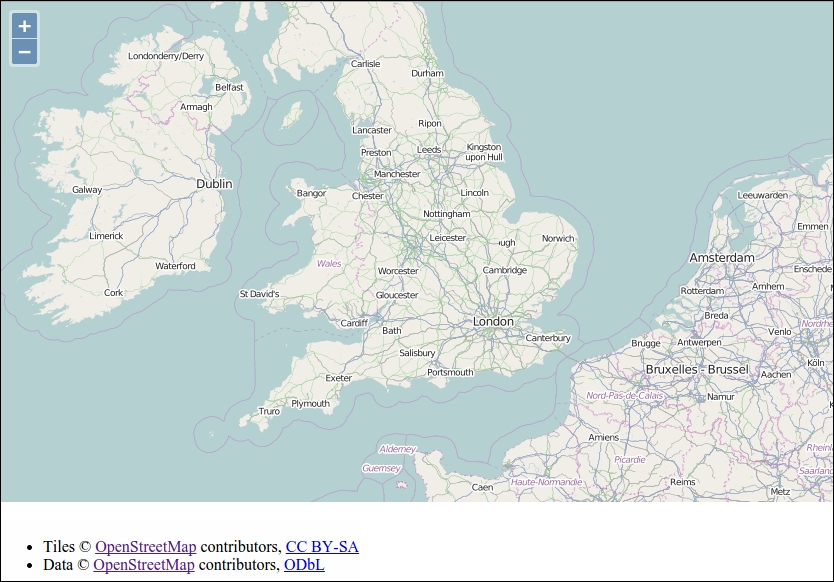
We first introduced you to the className property. This enables you to change the default class name for the control. Then, you can customize your control with CSS according to this new class name. You may have noticed that, in the first case, you were unable to see the content in the browser, but only in the debugger because the element was always attached to the map element with its child, the <div class="ol-viewport" ...> tag.
With the second case, we showed you the purpose of the target property: you can tell the control where you want to attach the control. So, you need to use a DOM selector such as document.getElementById('myattribution').
With this action, you might have seen that the control is now well separated from the <div id="map" class="map"></div> HTML.
It is now easy to customize as per your wish and you can display credits outside of the map: it can be useful when you use a lot of layers and don't want to display too much information.
The ol.control.Zoom control displays a plus and minus element to zoom in and zoom out. It is one of the default controls.
The zoom options are similar to both previous controls but we also have some other properties such as a delta property. The other specific properties are only to change text for the control or when the mouse hovers them.
We will not cover those options as they are quite straightforward to understand but advise you to play with it within the context of OpenStreetMap. If you remember, OpenStreetMap behavior for tiles in Chapter 1, Getting Started with OpenLayers (each zoom multiply zoom by 2), you will also remember how to play with the delta property. For each click on the control, your delta is 1. Change this property to a value, either 2 or 4, and try to click on the plus (+) and minus (-) buttons and see the change.
You can find the properties list for the control as follows:
The ol.control.Rotate control is not really obvious to understand. As OpenLayers 3 targets mobile browsers or applications, it can be useful to reset the rotation when you choose to make an interactive map that relies on the compass from your device. Sometimes, you want to reset the north direction for readability for end users. In fact, this control is a default one.
You can make it appear by reopening the previous example, then click and drag while pressing down both Shift and Alt keys. You will see a result like the following:
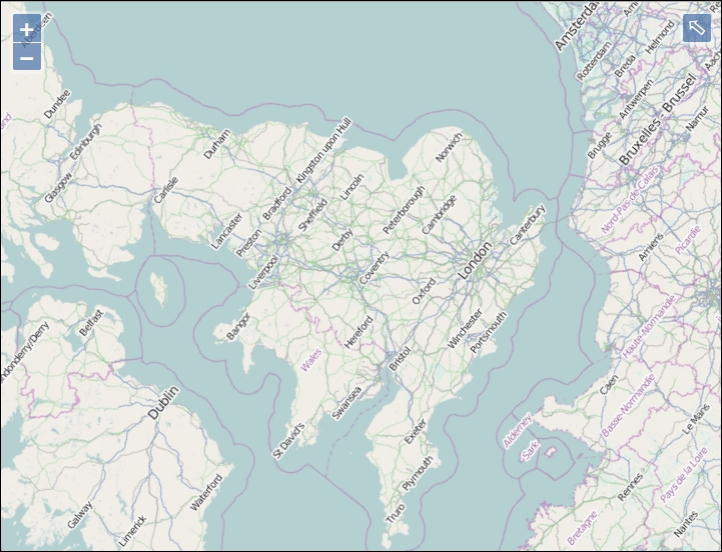
Let me remind you that you will find the options available to customize the Rotate control:
You can play around with these options; for example, you can always display North with an arrow like for paper maps with autoHide. It's also possible, if your application is not targeting English-speaking users, to change the tipLabel.
With this control, you can easily switch to the fullscreen mode that relies on HTML5. Also, for this reason, it will work better with a modern browser that supports this feature, such as Google Chrome, Firefox, and so on. Typing Esc will take you out from this mode.
This is the first control we've reviewed that is a not a default one. If you need it, you can use the ol.Collection returned by the ol.control.defaults method and with it the ol.Collection extend method, add the control using an array to the collection, when instantiating ol.Map with the bare minimum (no options):
controls: ol.control.defaults().extend([new ol.control.FullScreen()]),
As a reminder, supposing map is the ol.Map object name, you can also add the control with the following line:
map.addControl(new ol.control.FullScreen());
These FullScreen are options for the FullScreen control. Except for the keys property that depends on latest support in browsers and tipLabel to set the tip text on the button, the properties are the usual ones, the ones inherited from ol.control.Control. All are considered as experimental.
The ol.control.MousePosition control helps you to determine the coordinates where your mouse is pointing on the map.
One way to do this is by instantiating the element with the syntax that follows:
controls: ol.control.defaults().extend( [
new ol.control.MousePosition({
key: value,
...
})
]),The object into the control constructor is optional.
The MousePosition options are the available properties you pass to the control ol.control.MousePosition. They help customize the behavior of the control such as coordinates formatting or units.
We will review these options with an example.
Follow these steps to get started with the mouse position behavior:
myposition such as <div id="myposition"></div>.var mousePosition = new ol.control.MousePosition({
coordinateFormat: ol.coordinate.createStringXY(2),
projection: 'EPSG:4326',
target: document.getElementById('myposition'),
undefinedHTML: ' '
});map.addControl(mousePosition);
assets/css/samples.css:#myposition > .ol-mouse-position {
position: relative;
margin-left: 20px;
font-size: 30px;
}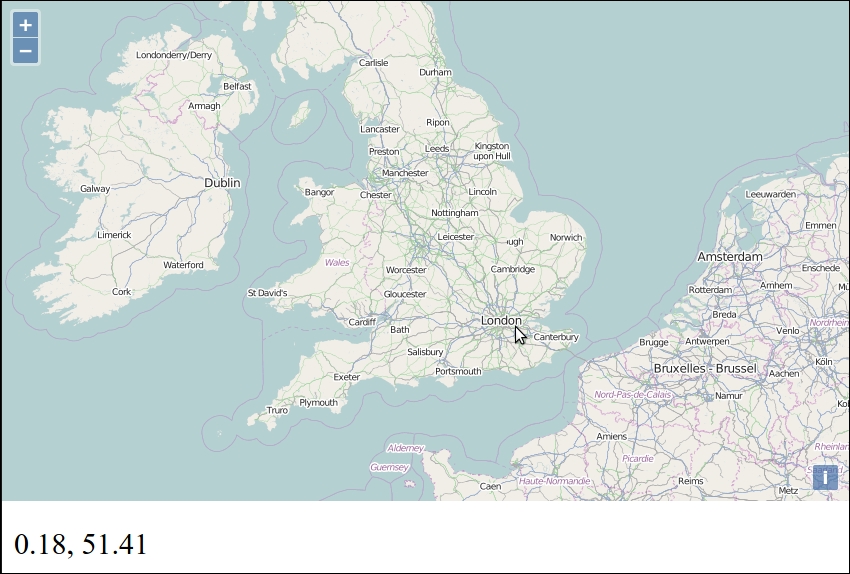
Here, we choose to use most of the options of the controls.
The first one, coordinateFormat, accepts an ol.CoordinateFormatType. It simply means that when you retrieve the coordinates, you may want to change them to Degrees Minutes Seconds notation or you may want to change the precision you display in the HTML file.
The two relevant options to set here are:
Be careful to not set ol.coordinate.toStringHDMS() instead; it's a bit surprising, but you need to use the class itself.
The projection option helps you choose the coordinates you want. You may have forgotten but each projection has a defined unit system (and subunits). For example, the EPSG:4326 projection returns units in a decimal degree. It's what you see in the bottom of the previous image. The undefinedHTML option just sets what you want to display when you are not hovering over the map. You can confirm availability by searching in the Chrome debugger Elements panel, the string in precedent example.
The target option and the CSS part were only to remind you of previous use cases.
We've never really insist until now, but you can also set the parameters after controls creation. In fact, for each property, you always have a setter and a getter.
Just open your browser with the example, type in the console the following line, and hover over the map to understand:
mousePosition.setProjection(ol.proj.get('EPSG:3857'))As you see, you can really explore the methods available in the ol.control.MousePosition control. We really encourage you to play in the console using auto completion: you will see that you can really find useful things that may remind you of other examples. You should also focus on the Fires: part of the API documentation at http://openlayers.org/en/v3.0.0/apidoc/ol.control.MousePosition.html because it will help you to apply your events knowledge in the context of controls and here, the mousePosition control.
If you remember, we already introduced you to this control in the Chapter 7, Wrapping Our Heads Around Projections at a functional level.
The purpose of ol.control.ScaleLine is to show a scale line bar to give people an overview of scale and distance. Be aware that it is only useful for projection that keeps distances.
You just need to add it to the map with something such as map.addControl(new ol.control.ScaleLine()) if you don't use the options.
The following is the options list you can set for the scale line control:
Although this book is about introducing the OpenLayers 3 library, we suppose that if you are reading this, it also means you want to understand what you are doing. So, let's give you some tasks to do by yourself:
minWidth property to a value you want in pixels.ol.control.ScaleLineUnits description is available in the following content). When you want to display your map legend using others units, you need to know the available units. You can find them using the table that follows, extracted from the ol.control.ScaleLineUnits type definitions in the OpenLayers 3 API:|
Name |
Type |
Default |
|---|---|---|
|
degrees |
|
This property returns the the string degrees required for internal library units changes. Check out Wikipedia to learn more on this unit (decimal degree) at http://en.wikipedia.org/wiki/Decimal_degrees. |
|
imperial |
|
This property is similar to previous property but returns the string imperial. Check out Wikipedia to learn more about the unit at http://en.wikipedia.org/wiki/Imperial_units. |
|
nautical |
|
This property is similar to the previous property but returns the string nautical. It refers to nautical miles. Check out Wikipedia for more information at http://en.wikipedia.org/wiki/Nautical_mile. |
|
metric |
|
This property is similar to the previous property, but returns the string metric that refers to metre or meter. Check out Wikipedia for an history at http://en.wikipedia.org/wiki/Metre. |
|
us |
|
This property is similar to the previous property but returns the string US. It refers to US units. Check out Wikipedia for more information at http://en.wikipedia.org/wiki/United_States_customary_units. |
target property or both of themThe ol.control.ZoomSlider control helps you to see your zoom levels using a slider. We advise you to go to the official example at http://openlayers.org/en/v3.0.0/examples/zoomslider.html because it's well illustrated for CSS styling. You can display the slider horizontally or vertically for the example illustrated in the following screenshot:
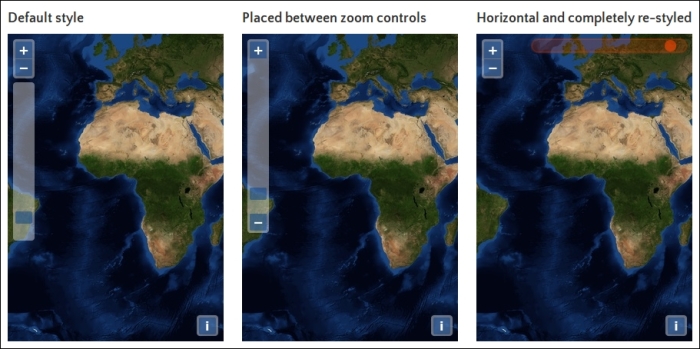
The following content presents the available options/properties in ol.control.ZoomSlider.
|
Name |
Type |
Description |
|---|---|---|
|
|
| |
|
|
| |
|
|
|
You can manage and try to better understand resolutions by using the getResolution() function at the view level (with map.getView()).
The ol.control.ZoomToExtent control permits you to create a button to go to a particular extent.
In a real context, it may help you to get a map with a zoom on a country, and using this control, you will be able to zoom directly on a particular city. In another case, you may want to go back to the initial extent of your map, and this control is also a way to address this requirement.
In order to learn better, let's try another example:
map.getView().getZoom() and map.getView().getCenter().zoomToExtentControl:var zoomToExtentControl = new ol.control.ZoomToExtent({
extent: [-11243808.051695308, 4406397.202710291, -4561377.290892059, 6852382.107835932]
});map instantiation:addControl(zoomToExtentControl);
var controls = map.getControls();
var attributionControl;
controls.forEach(function (el){
if (el instanceof ol.control.Attribution) {
attributionControl = el;
}
})ol.control.Attribution control using the reference you retrieve and supposing map reference the ol.Map instance.map.removeControl(attributionControl);
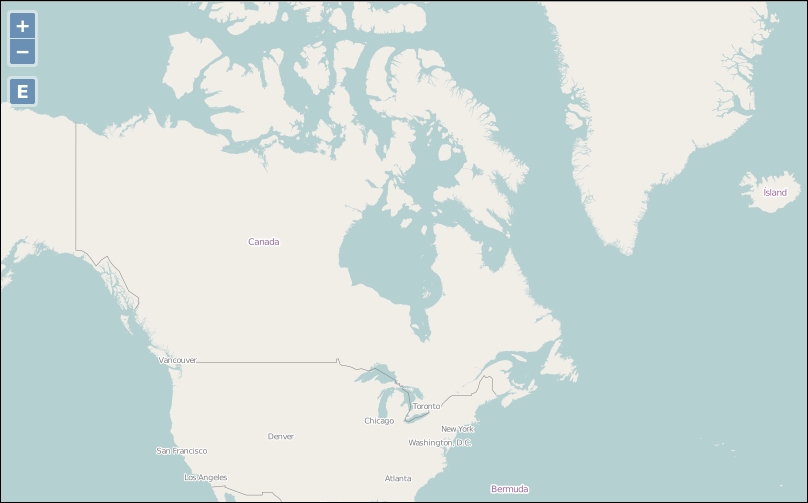
Here, we've just seen an example to learn how to manage the ol.control.ZoomToExtent control. The most interesting part is related to the code that enables you to find your control reference without having an object control reference. For this, we use the instanceof JavaScript function.
Now, we also know how to list controls for a map using the map.getControls() function, and also loop through it using the forEach method from ol.Collection.
Finally, we discovered how to remove a control when for any reason, we needed to delete it afterward with the map.removeControl() function. You also have to understand that for learning purposes we don't check everything. For example, imagine there were more than one ol.control.Attribution control. A good exercise can be to change code to manage this case.
These properties set the options for the ol.control.ZoomToExtent control.
Now, we got an overview of controls, let's see how to make our own ones, for specific purposes.
You may wonder "why do we need to learn that?"
Some points to explain this requirement are:
Let's see how we can do it.
Let's get started. Contrary to most examples, it will need more code than usual. So, to keep things simple, we will explain how to build the sample by retrieving the various code files instead of inlining it. After these operations, we will focus on the important parts of the code to understand them:
css class with the export-geojson string from assets/css/samples.css and copy paste them in your own samples.css file. Next, retrieve a new JavaScript file from https://github.com/eligrey/FileSaver.js/blob/master/FileSaver.js into a new subdirectory, assets/js.features.geojson file from assets/data/features.geojson, within the book samples.chapter09/2360OS_09_06_custom_control.html.index.js, open your browser, and draw something. Push on the new button named G just below the minus plus buttons and you can download a file.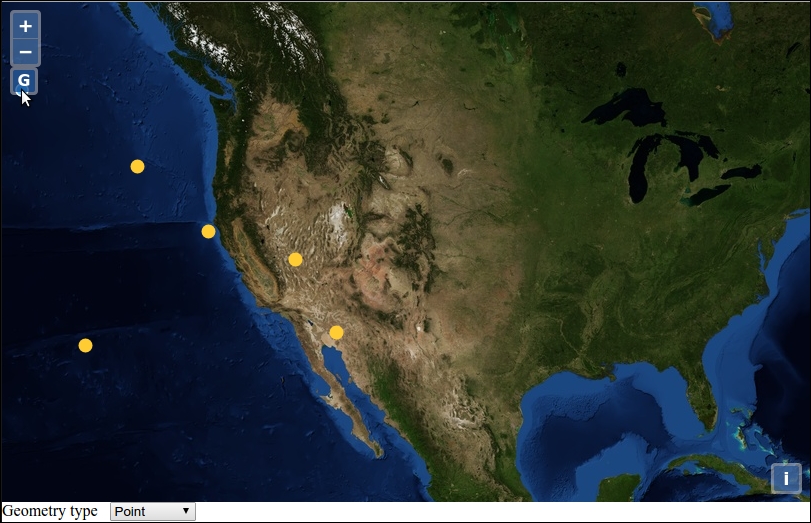
We will just highlight the most important parts.
At a functional level, we reused ol.interaction.Draw with the possibility to switch between drawing points, lines, and polygons. We removed the server-side dependency for saving the efforts for the same.
Instead we introduced a new component, app.generateGeoJSONControl, with the following snippet:
controls: ol.control.defaults().extend(new app.generateGeoJSONControl({source: source})
]),This component reuses the declared ol.source.GeoJSON vector source used to get a GeoJSON content with the source: source option.
This new control is created by declaring a namespace with:
window.app = {};
var app = window.app;Then, we declared the function with app.generateGeoJSONControl = function(opt_options) { and directly prepared to get opt_options with the following line of code:
var options = opt_options || {};
We made an anchor DOM element, then a temporary variable with var this_ = this; to be able to keep the scope for the getGeoJSON function.
Within this named function, we stopped a default behavior to not get the URL changed and started to manipulate the features from the source to transform them to a GeoJSON string. With a new download function, we made it possible to save the text content in a file.
This declaration is not the call; so, we needed to bind the function to event click and touchstart for desktop and mobiles experiences on the anchor DOM element with:
anchor.addEventListener('click', getGeoJSON, false);
anchor.addEventListener('touchstart', getGeoJSON, false);Near the end, we added a new <div> tag and appended anchor as a child.
We made an interesting statement by using a call function from ol.control.Control:
ol.control.Control.call(this, {
element: element,
target: options.target
});It enables us to reuse the option from the parent control and to set them, for example, target and element, the newly created <div> tag.
Making a call was just to call the function of the parent class; so, after the end of the app.generateGeoJSONControl function, we explicitly used a special declaration ol.inherits to apply the ol.control.Control parent methods and properties to our custom class:
ol.inherits(app.generateGeoJSONControl, ol.control.Control);
Q1. You need to stop the zoom in / zoom out behavior on the map. In the ol.Map object, what do you need to change in the options and why?
Q2. If you want to use panning on your map, what do you need to change in ol.Map?
Q3. Assuming I have made my own control named mycustomControl and I declare the following within ol.Map:
controls: ol.control.defaults().extend([
mycustomControl({source: source})
])What will happen and why?
In this chapter, we discovered more about the controls. Up untill now, we've used it without really understanding their purpose—what can they do for us?
Firstly, we organized our thoughts using inheritance schema. In fact, it's more complicated, but for a beginner book, it was quite enough. We didn't go too deep; we used and reviewed existing components but didn't focus a lot on creating new ones. You don't really need to use augmented controls in most cases. When you need to make a new control, don't hesitate to review the behavior from the various interaction: it's simple to combine them with buttons.
After this review of how to use controls with your map using the available components from API, it's time to dive into OpenLayers support for mobile. You will learn how OpenLayers touch events work but also how to reuse device geolocation and orientation. Using the mobile context, we will review some HTML 5 features that can help with improving application experiences. This overview will cover web mapping sites such as native applications for mobiles.
The rise in popularity of mobile devices—smart phones and tablets—has changed the landscape of web development. Now, users expect our websites and applications to work on their mobile devices' smaller screens, respond to touchscreen interfaces and know where they are via integrated GPS. OpenLayers 3 provides some great features targeting mobile platforms, and we will highlight those in this chapter. But, developing mobile-friendly web applications has its challenges too, so we'll look at how to debug web applications on mobile devices and at some strategies to use when mobile devices lose their network connections.
In this chapter, we will cover the following topics:
One of the biggest differences between desktop and mobile web applications is how we interact with an application. On a desktop or laptop computer, we have a keyboard and a mouse or trackpad, and we point and click or click and drag things. On mobile devices though, there is no keyboard and no mouse pointer. Instead, we use our fingers, and we do things like touch, drag, and tap. We can also do more complicated things, such as pinching two fingers together or rotating two fingers, and we usually expect this to do something in an application. In mapping applications on touch devices, for instance, we might expect that dragging a finger will pan the map and pinching two fingers will zoom in or out.
OpenLayers provides touch support for us in the form of interactions—recall that we talked about interactions in Chapter 8, Interacting with Your Map. The touch-specific interactions are as follows:
ol.interaction.DragPan: This pans the map in response to one or more fingers being dragged across the screenol.interaction.PinchRotate: This rotates the map in response to two fingers twisting in a circular motion on the screenol.interaction.PinchZoom: This zooms the map in or out in response to two fingers pinching in or out on the screenThese interactions are created by default and enabled on devices that support touch events. Let's see them in action!
Because we'll view the examples in this chapter on a mobile device with a browser that does not have direct access to your development machine, we'll need to serve them through a web server and access them using the HTTP protocol. Your computer also needs to be connected to the same Local Area Network (LAN) as your mobile device.
We've already been using a web server with the samples using the URL http://localhost/. This URL uses the name localhost, a special name that tells the web browser to connect to the local machine. This is great for your desktop browser, but it isn't going to work for our mobile device. You'll need to find the IP address of your computer on the LAN.
On Windows, open a command prompt (cmd.exe) and type ipconfig.
You should see something like the following screenshot:
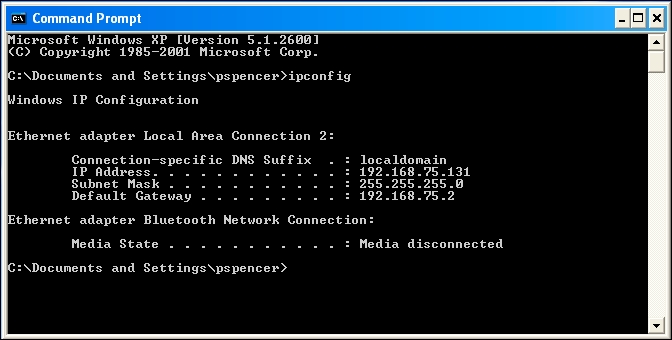
The ipconfig command will output some information about your network connections; the actual output will be different depending on your setup and how you are connected to the network, but you are looking for the marked line in the following screenshot:
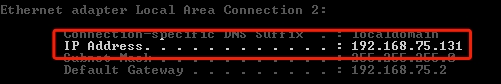
Write down the IP address for future reference.
On OSX, you can find your IP address from System Preferences. Perform the following steps to find your IP address:
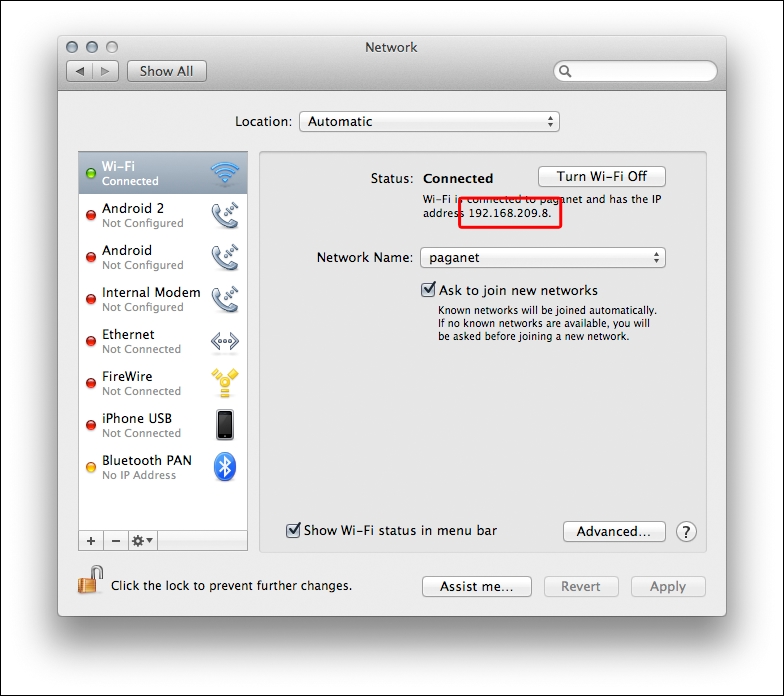
On Linux, open a terminal window and use the ifconfig command to get your IP address. If you are connecting using WIFI, type:
ifconfig wlanO
If you are connecting using Ethernet (cable), type:
ifconfig ethO
You will see output like the following screenshot:
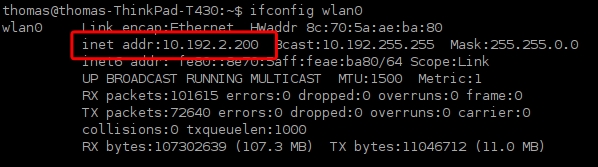
You should see the IP address between inet addr and Bcast.
Before we continue, let's make sure that the IP address is correct. Replace localhost in your browser address bar with your IP address, and make sure that the page loads the same way. For instance, if you determined that your IP address is 192.168.0.1, then the URL would start with http://192.168.0.1/. Next, open the web browser on your mobile device and enter the same test URL. You should see that page opens in your mobile device's web browser.
If you are having problems with this step, make sure that WIFI is enabled on your mobile device and that it is connecting to the same network as your development machine.
Now, we are ready to test our new setup with a fully mobile-capable OpenLayers application. As you'll see in the following steps, there's nothing special you need to do with OpenLayers itself to work in a mobile environment:
mobile.html:<!doctype html>
<html>
<head>
<title>Mobile Example</title>
<meta name="viewport" content="width=device-width, initial-scale=1.0, maximum-scale=1.0, user-scalable=no">
<link rel="stylesheet" href="../assets/ol3/ol.css" type="text/css" />
<link rel="stylesheet" href="../assets/css/samples.css" type="text/css" />
</head>
<body>
<div id="map" class="full-map"></div>
<script src="../assets/ol3/ol.js"></script>
<script>
var layer = new ol.layer.Tile({
source: new ol.source.OSM()
});
var london = ol.proj.transform([-0.12755, 51.507222], 'EPSG:4326', 'EPSG:3857');
var view = new ol.View({
center: london,
zoom: 6,
});
var map = new ol.Map({
target: 'map',
layers: [layer],
view: view
});
</script>
</body>
</html>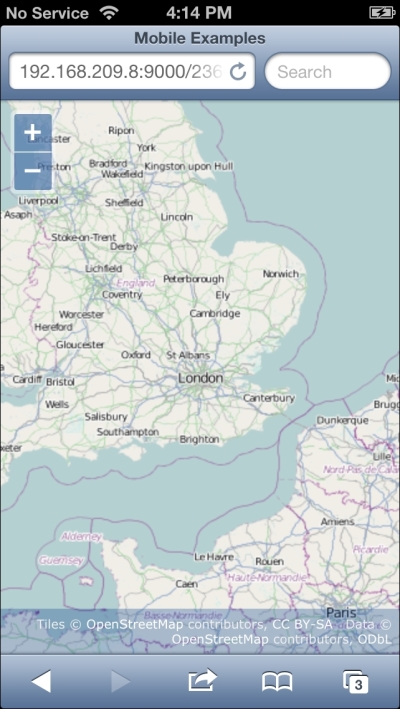
We created an example very similar to the ones we've been using in previous chapters and, just by loading it on a mobile device, we get new capabilities from OpenLayers' default touch interactions. We can now pinch to zoom in and out, move two fingers in a circular motion to rotate the map, and touch drag the map to pan around.
We made a couple of small changes to the example we used in previous chapters though, so let's highlight the differences. In the <head> section, we've added a <meta> tag. The <meta> tag provides information to the web browser rendering the page, its name indicates the type of information it is providing, and its content is the information or data we want to inform the browser about. In this case, we've used the viewport <meta> tag to provide some information that mobile web browsers can use to modify how a user interacts with the web page in a mobile browser. Let's break down the content and explain what it's doing, as follows:
<meta name="viewport" content="width=device-width, initial-scale=1.0, maximum-scale=1.0, user-scalable=no">
The content is a series of comma-separated key-value pairs formatted as key=value. The width key indicates how wide the browser's viewport should be. It can be set to a specific number of pixels or to a predefined value device-width, which indicates that the viewport should be 100 percent wide. The initial-scale and maximum-scale keys constrain the mobile browser viewport scale factor, which would allow rendering a page more zoomed-in than its default. Setting the user-scalable key to no disables zooming the web page in response to the user performing a pinch gesture. We want the pinch gesture to zoom the map, not the whole page. We've also changed the class name used on the HTML element that contains the map from map to full-map. This changes the map element to take up 100 percent of the width and the height of the browser viewport.
The remainder of the example is exactly the same as in previous chapters. In fact, you can load this example in your normal web browser, and it should function in exactly the same way as many of the other examples, the only difference being that the map will fill your browser window.
So, we get touch support in our web mapping application without really having to do anything at all. But just supporting touch events isn't that exciting. Let's explore what else OpenLayers has to offer on mobile devices, starting with finding our location.
OpenLayers provides us with the ol.Geolocation class, which can be used to find the current location of the user and to track changes in location over time. This class accesses information provided by web browsers through the HTML 5 Geolocation API.
Before we go any further, it's important to discuss the technology behind the Geolocation API a little bit to understand its limitations. The location of a device can be determined by several methods. Typically, we think of the location as being determined by a Global Positioning System (GPS), but in practice, the location of a device can be determined by several means, including the following:
A mobile device can use any of these techniques to determine its location, and the owner of the device can choose to turn any or all of these methods off, perhaps for privacy reasons or to conserve battery power.
Let's add another resource to our page, so that we can access some nice icons. In the past, we might have done this by creating images for each of the icons we wanted and then adding <img> tags. We are going to try a different approach this time using an iconic font called Font Awesome. We'll discuss why after the example; for now, just follow these steps:
<link> tag to the <head> tag of your HTML document, just after the link to ol.css:<link href="//netdna.bootstrapcdn.com/font-awesome/3.2.1/css/font-awesome.css" rel="stylesheet">
<style> section inside the <head> tag:<style>
.marker {
position: absolute;
width: 24px;
height: 24px;
font-size: 24px;
}
</style><div> tag just after the map <div> tag:<div class="map"></div> <div id="location" class="marker icon-flag"></div>
<script> tag, after all the other code:var marker = new ol.Overlay({
element: document.getElementById('location')
});
map.addOverlay(marker);
var geolocation = new ol.Geolocation({
tracking: true
});
geolocation.bindTo('projection', view);
geolocation.bindTo('position', marker);Step 1 adds a link to a stylesheet that defines an iconic font, which we'll discuss in more detail in just a moment. In step 2, we created a new CSS class called marker that we can add to the HTML elements we want to be displayed as markers on the map. This class sets the width and height of the element to be 24 pixels and also the font size, as we are using an iconic font for our marker images. In step 3, we added the HTML element we want to use as our marker. We gave it an ID of location, so that we could refer to it later and added both marker and icon-flag to the class. The marker class makes the element a specific size, and the icon-flag class indicates which icon to use from our iconic font. In step 4, the new code we added creates a new ol.Overlay attached to our marker element and adds it to the map. Then, we create an instance of ol.Geolocation and tell it we want to track location updates. Then, we bind the projection property of the geolocation object to the view's projection and position properties to the marker. The geolocation object will now automatically convert location updates into the correct projection for our view and move our marker overlay to our current location.
Iconic fonts are just like any other font, except that the characters in the font are designed as pictures instead of letters. Like text in a web page, the icons in a font are easily resizable and adapt to different resolution displays automatically. Mobile devices such as the iPhone 4 and later sport retina displays have a high pixel density. Normal images on retina devices end up looking blocky. Icon fonts are automatically rendered at a higher resolution on retina devices and are crisp and clear.
FontAwesome (http://fortawesome.github.io/Font-Awesome/) is a popular iconic font (at the time of writing this) and is easy to use in any web application, just by including a single <link> tag and then using icon-specific class names. We'll use a couple more Font Awesome icons in later examples, but if you are interested in what icons are available, visit their site and take a look around.
Font Awesome isn't the only choice for an icon font, and there are many tools on the Web to help you make your own icon fonts from existing vector art.
Now that we've seen ol.Geolocation in action, let's take a look at its full capabilities.
When creating an instance of ol.Geolocation, you can provide the following optional properties to control its initial behavior:
The Geolocation class inherits from ol.Object and has the following key-value observing (KVO) properties (recall that we discussed KVO in Chapter 2, Key Concepts in OpenLayers):
Many new computers, and especially mobile phones and tablets, provide hardware support to track their orientation. The HTML 5 specification defines the DeviceOrientation API to expose this information. Just as with the Geolocation API, OpenLayers provides the ol.DeviceOrientation class to make it easier to work with this API in a stable, cross-browser compatible way.
Device orientation refers to the orientation of the mobile device relative to a common starting point. A device's orientation is then reported as angles of rotation from this common reference orientation. For mobile devices, the reference orientation is defined as the phone lying face up on a table with the top of the phone pointing north. For computers, it is the same, except the screen is open at 90 degrees. This represents the zero state, and all angles are reported relative to this state.
Device orientation is reported as three angles—alpha, beta, and gamma—relative to the starting orientation along the three planar axes X, Y, and Z. The X axis runs from the left edge to the right edge through the middle of the device. Similarly, the Y axis runs from the bottom to the top of the device through the middle. The Z axis runs from the back to the front through the middle. In the starting position, the X axis points to the right, the Y axis points away from you, and the Z axis points straight up from the device lying flat, as shown in the following screenshot:
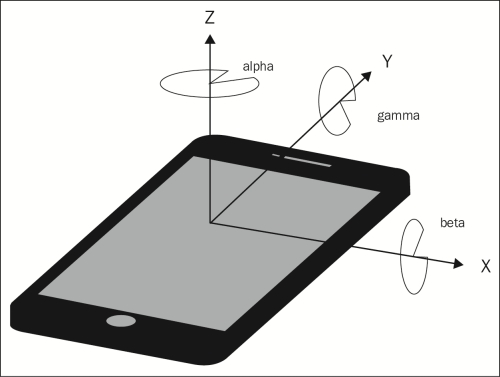
In practice, this allows us to respond to the user turning and tilting the device. The most useful property is the value of alpha, which lets us figure out where the compass heading the device is pointing at. Let's see this in action!
In this example, we'll display an icon at the user's location, use values from the DeviceOrientation API to create a simple compass, and by rotating it, show which way is north. Perform the following steps to achieve what's been set out in this paragraph:
<div id="location" class="marker icon-arrow-up"></div>
var deviceOrientation = new ol.DeviceOrientation({
tracking: true
});
deviceOrientation.on('change:heading', onChangeHeading);
function onChangeHeading(event) {
var heading = event.target.getHeading();
var el = document.getElementById('location');
el.style['-webkit-transform'] = 'rotate('+heading+'rad)';
el.style['transform'] = 'rotate('+heading+'rad)';
});Let's walk through the code and see what it does. First, we create a new instance of OpenLayers' helper class ol.DeviceOrientation and indicate we would like to receive orientation updates, as follows.
var deviceOrientation = new ol.DeviceOrientation({
tracking: true
});Next, we register a function to receive updates to the heading property, and it will be passed an event object that has the information we need, as follows.
deviceOrientation.on('change:heading', onChangeHeading);The function that receives the orientation update event does several things. First, we get the value of the heading property (in radians) from the event target.
var heading = event.target.getHeading();
We mentioned before that the value of alpha is used to figure out the compass heading. Not all devices support reporting of the device orientation in the same way. In particular, WebKit on iOS reports an alpha value that is computed from where the device is pointing when tracking is turned on instead of from north. OpenLayers provides a special property, heading, which reports the true angle from north and standardizes this across different devices behind the scenes.
Next, we obtain a reference to the HTML element that contains our arrow. We gave it an ID to make this easier, as follows.
var el = document.getElementById('location');Finally, we use CSS to rotate the arrow relative to north so that it's pointing in the direction our phone is pointing. The CSS3 transform property can apply a number of transformation functions to an element (see https://developer.mozilla.org/en-US/docs/Web/CSS/transform); in this case, we've selected the rotate function. We set the angle we want to rotate and specify that the value is in radians, since that is the unit that OpenLayers reports angles in. The following is the code to accomplish this:
el.style['-webkit-transform'] = 'rotate('+heading+'rad)';
el.style['transform'] = 'rotate('+heading+'rad)';We set this property twice to accommodate Safari and Chrome, which still only support the vendor-specific prefixed version of the property name.
Here is the complete API for the DeviceOrientation class.
When creating an instance of ol.DeviceOrientation, there is only one option currently available, which is as follows:
The DeviceOrientation class inherits from ol.Object and has the following KVO properties.
Mobile web browsers offer some exciting capabilities for our web applications, especially for map applications! But they offer some challenges too. We've seen in Chapter 2, Key Concepts in OpenLayers, that web developers have powerful tools like Chrome Developer Tools at their disposal for debugging web applications. But it's not that easy on mobile devices, where these tools don't exist. Fortunately, there is an answer! In this section, we'll cover techniques for debugging web applications on each of iOS and Android, as well as another tool that isn't device-specific.
The simplest way to debug web applications on iOS is to enable remote debugging with Safari on your Mac. If you don't have a Mac, skip ahead to the Debugging on Anything section.
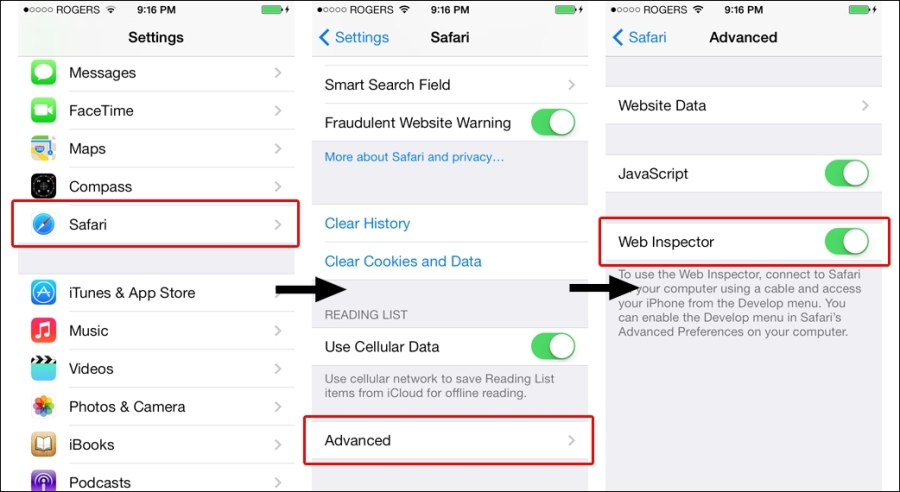
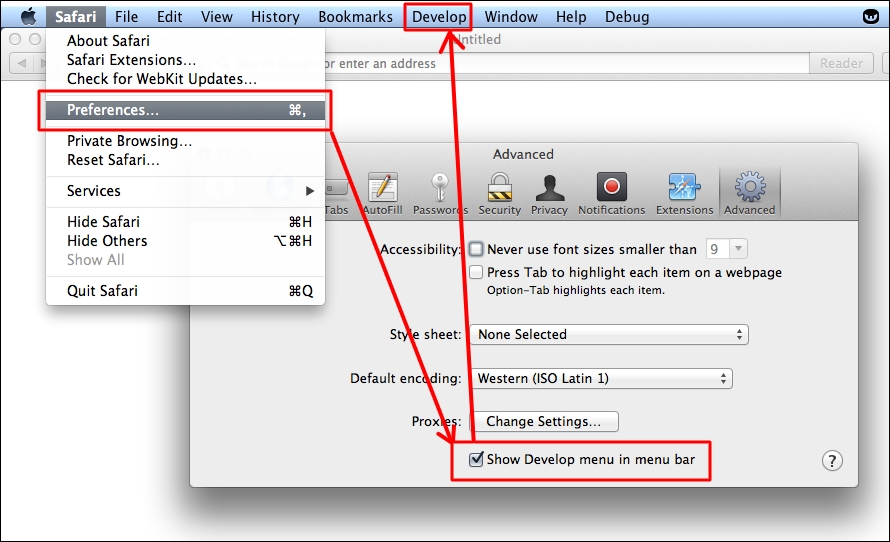
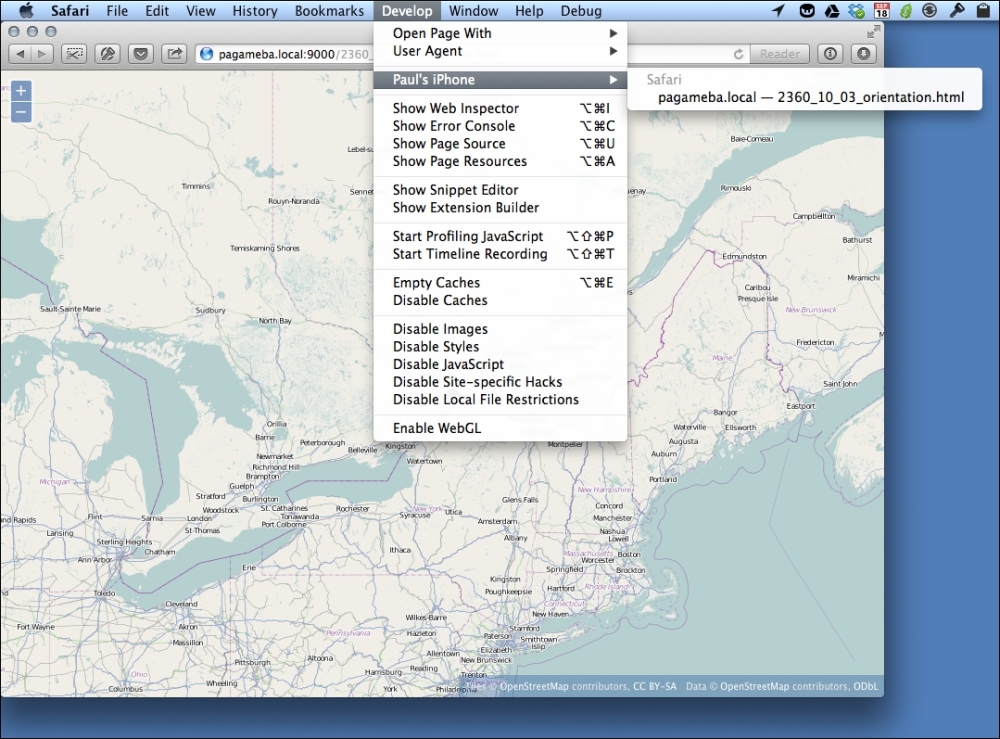
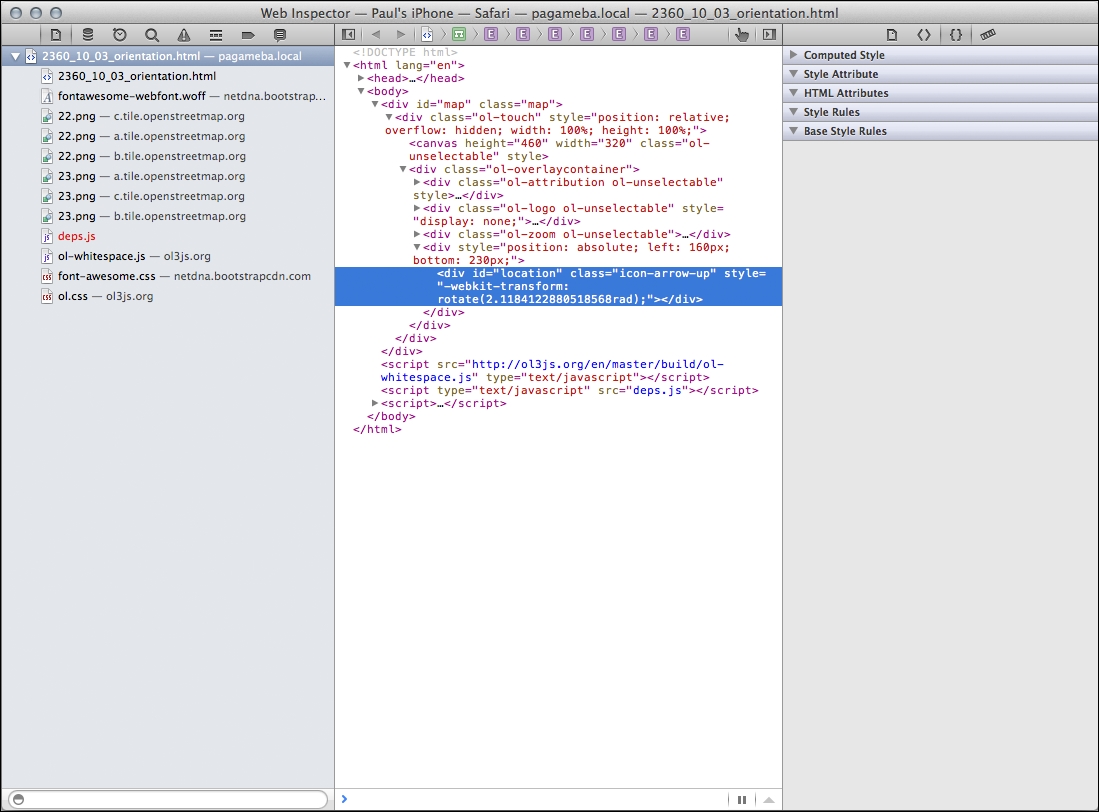
We just enabled some pretty powerful debugging capabilities for our mobile application development. In the first step, we turned on the Web Inspector option that lets us access debug information for the current web browser process in Safari. In the second step, we enabled the Developer menu for Safari on a Mac computer. Finally, when we connect an iOS device to a Mac computer with a USB cable, we can use Safari's web debugging capabilities with the mobile Safari browser.
Depending on your version of Safari, Web Inspector might appear differently. In any case, Web Inspector has basically the same capabilities as those of Chrome Developer Tools, which were introduced in Chapter 2, Key Concepts in OpenLayers, and you have full access to inspect the HTML created for your application, change CSS styles dynamically, run JavaScript code, and view logfiles.
If you have an Android device, you can debug your web applications using the ADB Chrome extension and the Chrome DevTools introduced in Chapter 2, Key Concepts in OpenLayers. There are quite a few steps to get it all working, but it's worth it when you need it! So, here goes:

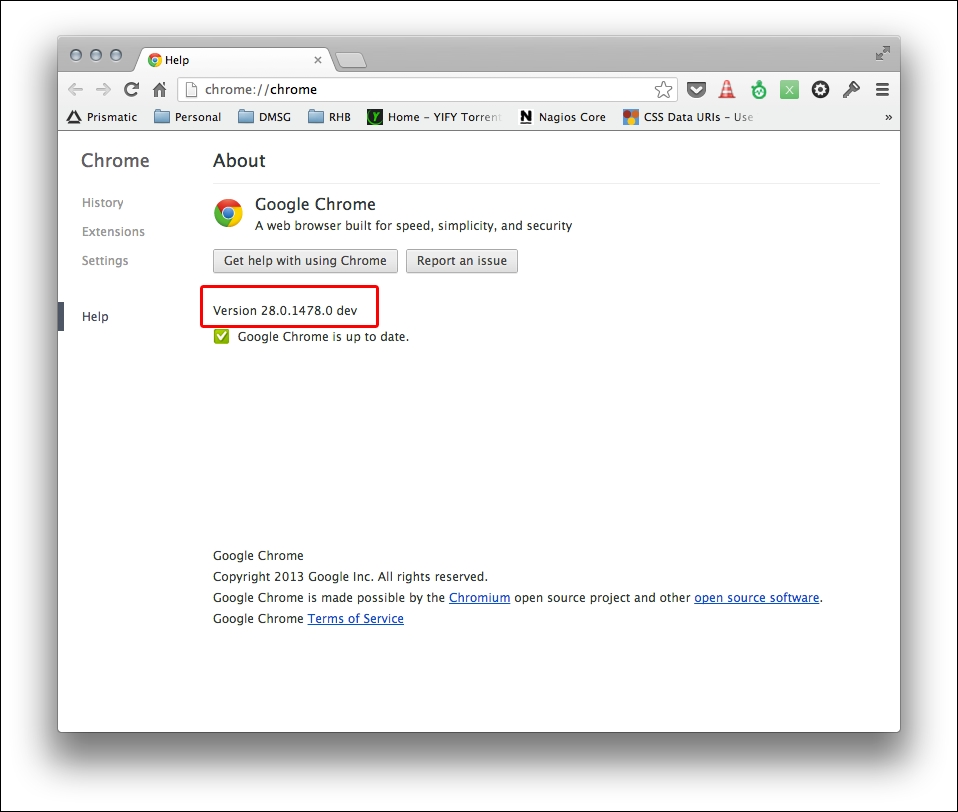
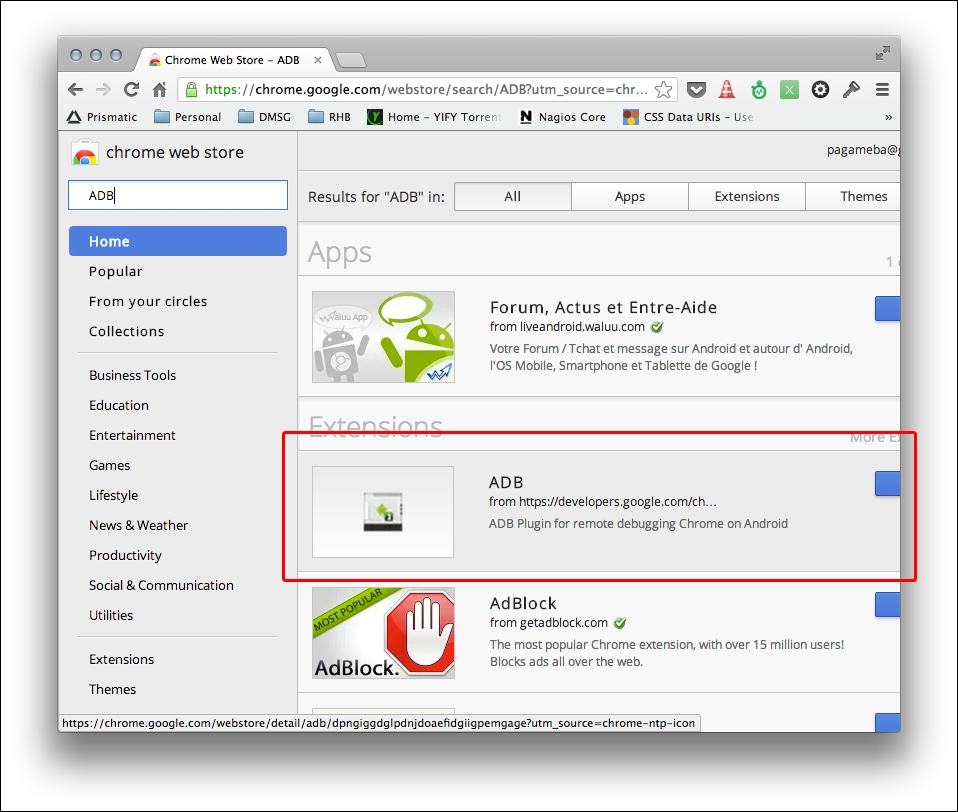
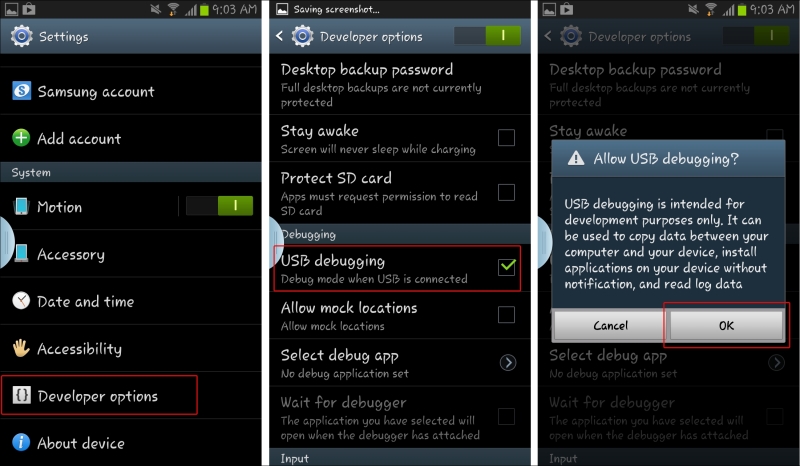
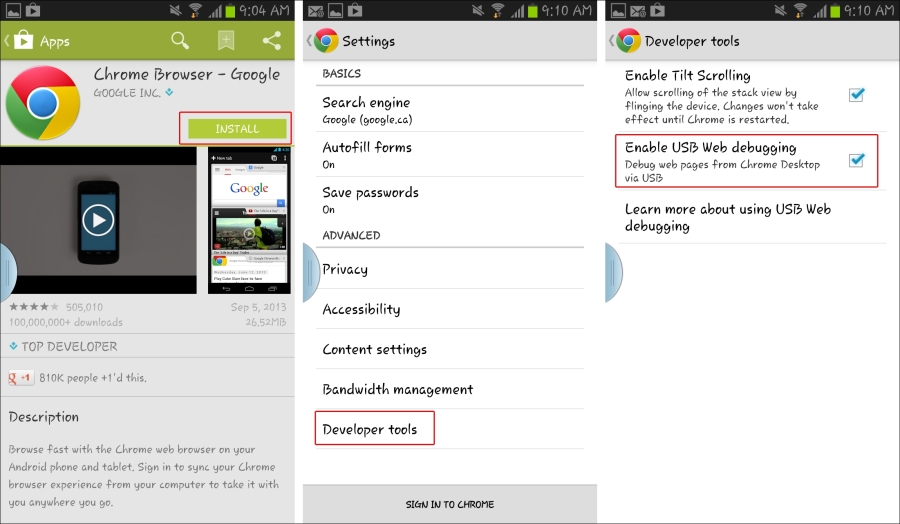
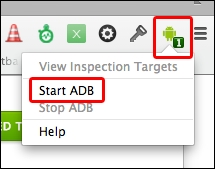
Phew! First, we made sure that we installed Chrome for Android on the device and the latest version of Chrome on our computer. Next, we installed ADB Chrome Extension for Chrome. Then, we allowed USB debugging on the device. Finally, we launched ADB Chrome Extension to see it in action. You can now debug your mobile web application running on your device with the Chrome Developer Tools.
It is also possible to debug using Firefox on Android; see https://developer.mozilla.org/en-US/docs/Tools/Remote_Debugging/Firefox_for_Android for more information.
Native debugging on mobile is great once you get it working, but what do you do when you don't have a USB cable with you, you have an iPhone but not a Mac, or you want to debug on some other device? There's a solution, of course, and the solution is to use WEINRE (WEb INspector REmote), an open source package that gives you an almost native debugging capability for mobile devices.
WEINRE is part of the Apache Cordova project (http://cordova.apache.org/) and was pioneered by Patrick Mueller. We will talk about Apache Cordova in the next section.
Using WEINRE involves combining three separate components, as follows:
The debug client and the debug server run on our development computer and the debug target runs on the mobile device.
To activate the debug target, we will need to add some JavaScript code, provided by the debug server, into the web page.
WEINRE is a Node.js application and is published as an NPM package. We've already talked about using Node.js and NPM to run a small server for editing features in Chapter 8, Interacting with Your Map. To install WEINRE then, all we need to do is open a command prompt and run the following command:
npm install –g weinre
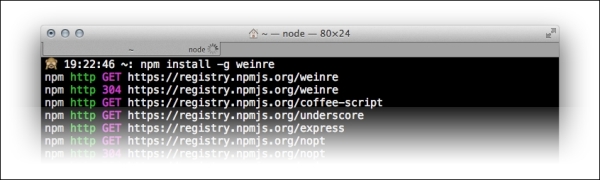
This is how the command prompt would look when we run the preceding command. This command instructs NPM to install the WEINRE package globally, which will make the weinre command available to you.
To start WEINRE, we need to use the IP address of the development machine—see the beginning of this chapter if you don't remember it. Open a command prompt and run the following command:
weinre –boundHost <your ip address>
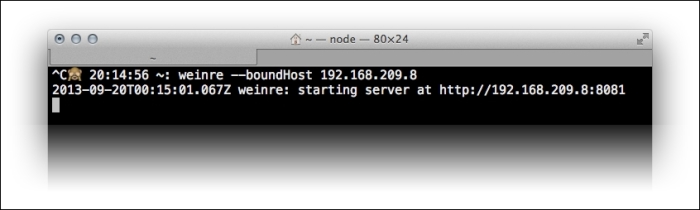
This is how the command prompt would look when we run the preceding command. The boundHost option allows the debug target's JavaScript to be loaded in a page on another machine, such as our mobile device. There are several other command-line options that you can supply to the weinre command; for the most part, you don't need them, but you can read about them in the WEINRE documentation at http://people.apache.org/~pmuellr/weinre/docs/latest/Running.html.
WEINRE starts a debug server and reports the URL at which the debug server page can be accessed. Copy this URL and open it in a web browser. The following is how the page will look when these actions have been performed:
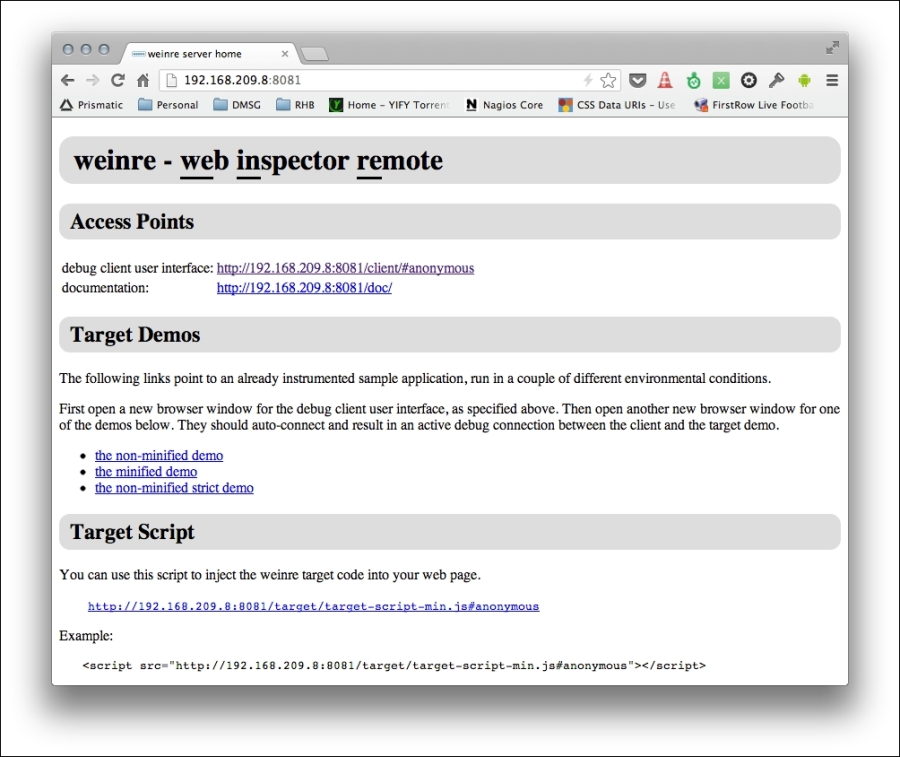
This page has the information and links we need to get started with debugging our mobile web application. The first section, Access Points, contains links to the debug client user interface and documentation. The second section, Target Demos, gives you some quick links to try out WEINRE debugging right away. Try them if you like. The third section contains the link to the JavaScript we will need to add to our mobile web page to activate the debug target code. Let's go ahead with this now.
Open the mobile example page in a code editor. Copy the <script> tag from the following example in the target script section, and paste it into the example page just after the <title> tag, as follows:
<title>Mobile Examples</title> <script src="http://192.168.209.8:8081/target/target-script-min.js#anonymous"></script>
Now, for the big finale—load the mobile example on your mobile device, and then click on the link to open the debug client on your desktop machine. After that, this is how your screen will look:
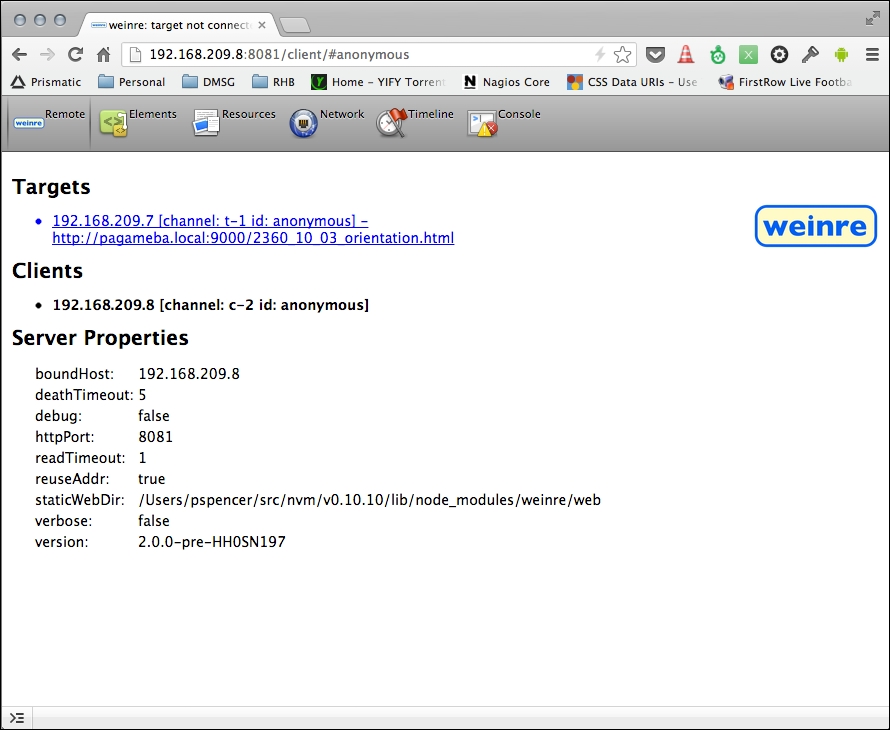
The Remote tab shows the debug target connected and some other information. You can now click on the Elements, Resources, Network, Timeline, and Console tab. Click on the Elements tab to show the Elements panel. This is how your screen will look after performing these actions:
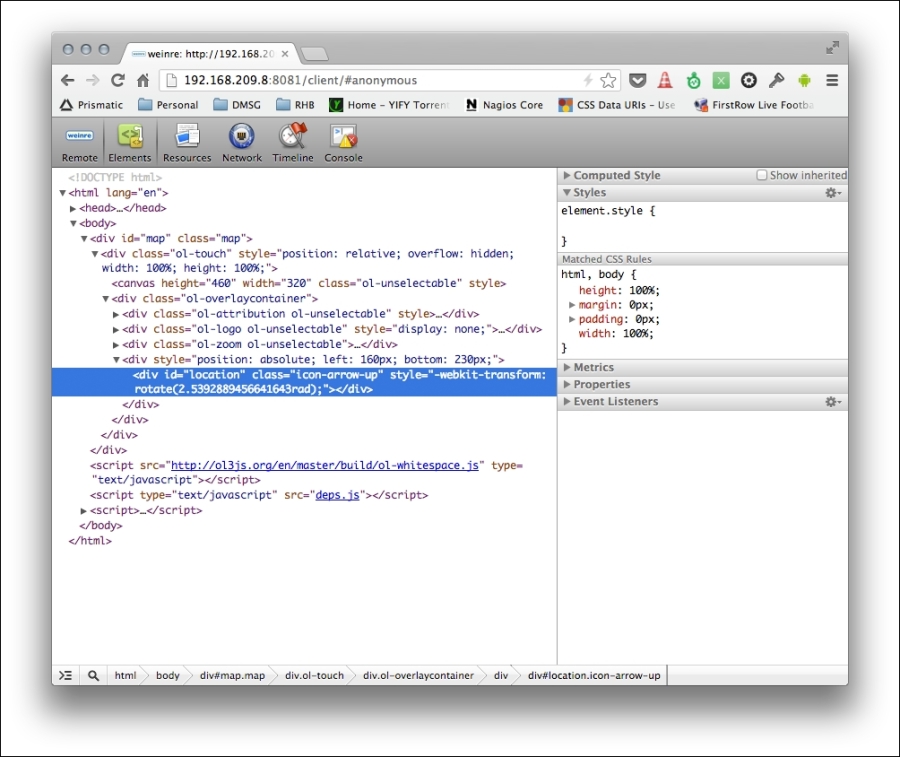
You can use the Elements panel just like Chrome Developer Tools and explore the DOM. Note that it can take a few moments for WEINRE to respond with information, so be patient and wait for it to appear.
The Resources panel shows WebSQL databases and data stored in the local storage and session storage. The Network panel shows XML HTTP requests issued after the page has loaded. Unlike Chrome Developer Tools, it can't capture the assets loaded by the page itself.
The Timeline panel can be used to display timing information about events and to track user-triggered events. Using this panel is beyond the scope of this book, but if you are interested, then check out the WEINRE documentation.
The last tab, Console, displays the JavaScript log and provides a command line for executing arbitrary JavaScript in your web page. Try typing the following command into the console and hit Enter:
alert('test');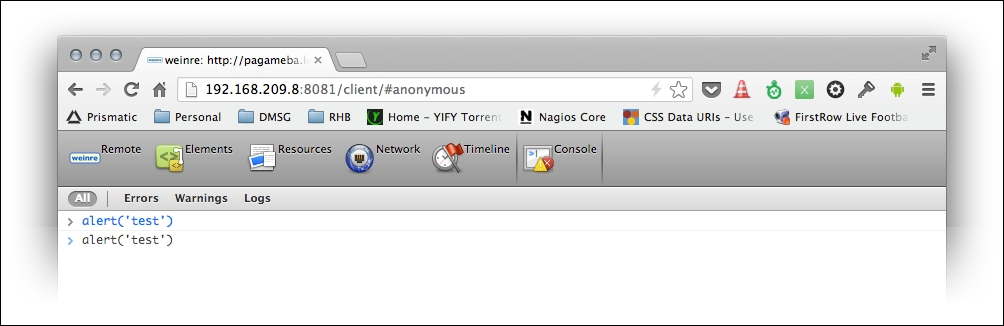
Your screen will look like this when the preceding command has been entered.
You should see an alert pop up on your mobile device, as shown in the following screenshot:
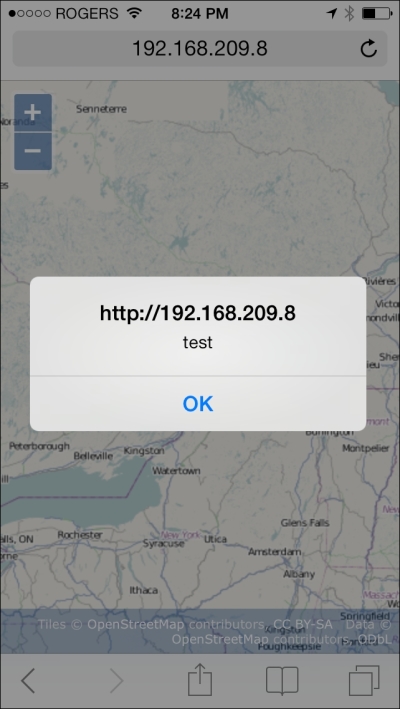
The Console tab also shows log messages, and we can filter by message types (Errors, Warnings, and Logs). Some log messages are generated by the browser itself, typically when an error happens, and we can use WEINRE to see if errors are happening. We can also programmatically send messages to log in our code using methods of the global console object that are available in all web browsers.
WEINRE isn't as complete as native debugging with iOS and Android, but it can certainly help out at a pinch.
One of the great challenges in delivering content to the mobile web is that mobile devices can easily be disconnected from the Internet. As users move around, they go in and out of range of WIFI and cellular networks, and the state of their network connection can change frequently. Native applications on mobile devices solve this problem by being installed on the device. Many native applications also cache content for offline use and are designed to handle the transient nature of mobile network connections. Web browsers, including mobile web browsers, typically cache web page content to help pages load faster. While this can help mobile web applications quite a bit, the cache managed by the web browser is unreliable, can be cleared by user settings, and might not keep critical content for your application. The cache also doesn't provide a mechanism to store generated data and stores only assets required to load a web page.
In this section, we will introduce three technologies that can help you with taking a web application offline:
The HTML 5 ApplicationCache interface is designed to help address the unreliable nature of web browser caches by allowing a developer to control how content is cached for offline use. The ApplicationCache interface provides us with the following benefits:
ApplicationCache is not displaced by new content in the normal browser cache, so it is much more reliableIf you are thinking Sounds great, lets get me some of that, read on!
Taking advantage of the ApplicationCache interface is actually very simple, and there are three steps we need to take:
A MANIFEST file is a plain text file that you can create in any text editor. The easiest way to describe its content is by example, so let's take a look at a MANIFEST file and then describe it in detail:
CACHE MANIFEST # version 2 CACHE:index.htmlscripts/app.jscss/styles.cssimages/logo.png NETWORK:login.php FALLBACK:images/large/ images/offline.jpg*.html /offline.html SETTINGS:prefer-online
The first line is mandatory; it must contain the specific text CACHE MANIFEST.
The second line is a comment. Comments are any line starting with a # character. One important characteristic of ApplicationCache is that the browser will usually not replace cached content with an updated version from the server unless the MANIFEST file changes or the prefer-online setting is specified. It is a common convention to include a comment near the top of the MANIFEST file, indicating a date or version number. When content is updated, the date or version in the MANIFEST file can also be updated, which will trigger the browser to download changed content. The third line declares the CACHE section. The CACHE section explicitly declares URLs that will be stored in the ApplicationCache. This line can be optional. If it is omitted, any files after the first line will be considered part of the CACHE section up to the start of any other section. The following lines up to the NETWORK line define files, by URL, that are to be cached. Wildcards are not allowed in the CACHE section. Do not include the MANIFEST file in the list of files to be cached, or it will be very difficult for users to get updates. URLs can be relative or absolute and might point to resources on domains other than that of the page being loaded. Check the following line, for example:
CACHE: http://another.server.com/logo.png
Next, comes the NETWORK section. This section contains a whitelist of resources that the browser will not cache (unless explicitly declared in the cache section), and which it is permitted to access when online. In this example, the browser can access login.php when online, and the results of loading that page will not be cached. This section is typically used to identify URLs that are part of a server API or content that cannot be used if it is out of date. URLs cannot contain wildcards, but a single wildcard character is allowed on a line by itself to indicate that any URL can be loaded. Check the following line for example:
NETWORK: *
The FALLBACK section defines alternate resources to be used if a particular resource is not available. Wildcards and path matching are allowed in this section. The first line of the FALLBACK section shows how you would display the image from images/offline.jpg for any image in the images/large path that is unavailable. In the next line, we specify that any HTML page that cannot be accessed should use offline.html instead. URL prefixes are allowed (a path to a folder for instance), but the wildcard character * is not permitted. Also, only URLs in the same domain as the web page can be listed in this section. As of writing this book, only one value is permitted in the final SETTINGS section, the prefer-online setting. If this is present in the SETTINGS section, then the browser will attempt to access the server version of resources before using the cached version.
Note the following rules for a MANIFEST file:
CACHE MANIFEST.# character is considered a comment.# character is a valid component of a URL.CACHE section up to the start of one of the other sections. Thus the CACHE: line is not strictly needed.CACHE, NETWORK, FALLBACK, and SETTINGS. A section is started by putting the section name followed by the : character.In order to trigger the use of an ApplicationCache MANIFEST file, you must include a reference to the MANIFEST file in your web page. This is done as an attribute of the <html> tag, as follows:
<html manifest="/myapp.appcache">
The value of the attribute is the URL to your MANIFEST file. Although the MANIFEST file can have any extension, it is standard practice to use .appcache as the file extension, and we recommend you follow this practice. The MANIFEST file must be delivered by a web server with mime-type of text/cache-manifest. The instructions for configuring a web server to serve particular files with a particular mime-type vary depending on the particular web server in use. Please consult the documentation for your web server to determine the best way to accomplish this.
Let's take the MANIFEST file out for a spin with our mobile example. The first thing we need to do is decide which resources we want to be included in our application cache and which we want to be excluded. Our application is pretty simple, so we won't need to exclude anything. So, here's what we will do:
myapp.appcache next to your example's HTML file.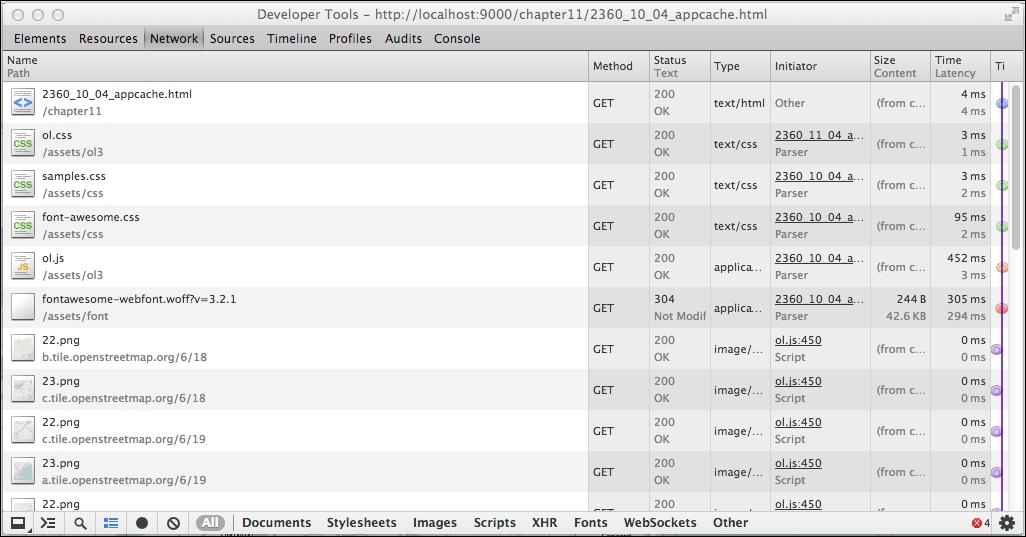
The first six lines are files requested directly by our application, and the remainder are map tiles loaded from the OpenStreetMap server. We'll explicitly cache the first six in our example.
CACHE MANIFEST # version 1 CACHE: 2360OS_10_04_appcache.html ../assets/ol3/ol.css ../assets/css/samples.css ../assets/css/font-awesome.css ../assets/ol3/ol.js ../assets/font/fontawesome-webfont.woff?v=3.2.1 NETWORK: *
<html> tag, as follows:<html lang="en" manifest="myapp.appcache">
We created an application cache MANIFEST file for our application, so it can load our application even when it has no network connection. The CACHE section contains the files we are explicitly using in our application. The NETWORK section contains the wildcard character to allow our application to access any URLs when we are online so that we can get map tiles. Now, when the mobile device is offline (it has no network connection), the application can still be loaded correctly.
Unfortunately, if you pan or zoom, you will start to see some blank spots. These are map tiles that are not cached by our browser. On the first load, you should see any map tiles that were loaded while we were online (in step 5). Any tiles you accessed prior to going offline might be available in the normal browser cache until it is cleared or they are displaced by newer content.
In summary, the ApplicationCache interface provides an easy and convenient mechanism to ensure content is available offline and to speed up loading of any web application by explicitly caching content in the browser for online and offline use. Unfortunately, for mapping applications, it doesn't solve the problem of accessing remote servers, including map tile sources, while offline. The next section, on HTML5 Storage, discusses part of the solution, and the final section, on Apache Cordova, provides another alternative.
Mobile web applications are a fast-growing market. Users with mobile devices expect access to all content on their mobile devices. While mobile web applications provide a great user experience in most cases, they often fall short of so-called native applications because they do not have access to convenient offline storage, capabilities of the physical device such as the camera, and data available to other applications, such as the user's contact list. Short of building a native application, there doesn't seem to be a way to access the full capabilities of mobile devices. But, do we really want to recode our great web application into native code for iOS, Android, Blackberry, Windows Mobile, and whatever other devices our users might have?
It turns out that we don't have to. On every major mobile platform, the web browser is also available as a component that can be embedded into a native application. This one fact means that it is possible to create native applications whose entire user interface is a web page and still have access to all the native functionality of the device. Doing this on every platform that you might want to support probably seems like a daunting task even if you know anything about coding native applications—or perhaps especially if you do!
Open source to the rescue again! Apache Cordova, a fantastic project of the Apache Foundation, provides the framework to create native applications from mobile web applications with almost no need to know anything about native development—and it works on all major mobile platforms. Not only will Cordova provide you with the tools to wrap your web application up into a native application, it also exposes the most common native capabilities to your web application, including:
Unfortunately, we can't cover using Apache Cordova in any detail in this book—there simply isn't enough room; it's enough material for an entire book by itself! If you need access to more than the web browser can provide on mobile devices though, we highly recommend that you check out the Apache Cordova website at http://cordova.apache.org/, where you will find lots of great information and starter projects to get you going on each platform.
Let's bring together what we've learned by expanding our application to track our movement over time and display it on the map. Recall that we covered vector features in Chapters 6, Styling Vector Layers, and Chapter 5, Using Vector Layers. So, here's what we will do:
<script> tag:var trackStyle = new ol.style.Style({
stroke: new ol.style.Stroke({
color: 'rgba(0,0,255,1.0)',
width: 3,
lineCap: 'round'
})
});
var trackFeature = new ol.Feature({
geometry: new ol.geom.LineString([])
});
var trackLayer = new ol.layer.Vector({
source: new ol.source.Vector({
features: [trackFeature]
}),
style: trackStyle
});trackLayer to the map, so add it to the array of layers where we create the map, as follows:var map = new ol.Map({
target: 'map',
layers: [layer, trackLayer],
view: view
});trackFeature as we move by modifying what happens when the geolocation object's position changes, as follows:geolocation.on('change:position', function() {
var coordinate = geolocation.getPosition();
view.setCenter(coordinate);
trackFeature.getGeometry().appendCoordinate(coordinate);
});We just created a very simple tracking application that follows our location and renders a line on the map to show where we've been. In step 1, we created a few new objects based on our knowledge of vector layers and features from Chapters 6, Styling Vector Layers, and Chapter 5, Using Vector Layers. First, we created a style object that draws our line in blue. Next, we created a feature object containing a LineString geometry to record our movements in. Lastly, we created a vector layer with a source that references our track feature using our style for blue lines. In step 2, we added the layer to the map. In step 3, we updated the geometry of the track feature by appending the latest position update coordinate to its LineString geometry.
Q1. Which OpenLayers class provides access to a mobile device's location?
ol.GeoLocation.ol.View.ol.DeviceOrientation.Q2. Which OpenLayers class tells you which direction your mobile device is pointing in?
ol.GeoLocation.ol.View.ol.DeviceOrientation.Q3. Which OpenLayers class would you use to center the map on your current location?
ol.GeoLocation.ol.View.ol.DeviceOrientation.This brings us to the end of this chapter. We've seen that OpenLayers is basically mobile-ready out-of-the-box, and there's really not much we need to do to make it work in a mobile web browser. The GeoLocation and DeviceOrientation classes provide access to some useful information in a mobile environment, including our position, speed, altitude, and direction of travel, and we saw these in action. We can even tell which direction our device is pointing in. We've learned how to debug mobile applications and how to prepare them for working offline. We wrapped up with an example that records our movement over time using vector layers and features.
In the next and final chapter, we will be building a complete application from scratch using everything we've learned so far. We'll also be introducing the OpenLayers build tools and learning how to create a production-ready application.
By now, we've covered all the parts of OpenLayers that are essential for making our own web map application. So far, we've been focusing on how to use the various different parts of OpenLayers. In this chapter, we'll put together those pieces that we've learned and demonstrate how to create an actual web map application with OpenLayers.
While we won't be introducing many new things in this chapter, we will put them together in ways we haven't before. Throughout this chapter, we'll:
In this chapter, we'll be developing a web map application that loads in data from a third-party source (Flickr). The examples have been structured with iterative development in mind. What this means is that you start small and make many changes, gradually building up your web map from nothing into something useful. Iterative development is an important, popular, and effective way to develop applications. The core idea is that you create something simple, get it working, and then improve it. You can figure out more quickly what does and doesn't work by improving on, and learning from, the previous iterations.
Another strategy we'll make use of is modular programming. What this means, essentially, is that we try to keep things as discrete (or modular) as possible. By doing so, once we know a component works, we don't have to worry about it later.
Because OpenLayers is so flexible, it's easy to make third-party software and data work with our maps. Sharing geospatial data is becoming more popular, with services such as Flickr and Twitter freely offering geospatially embedded data. Being able to visualize data often helps us to understand it. Using OpenLayers, we can place geospatial data (say, Twitter posts or Flickr images) on a map and get a clearer picture about the data.
Many popular sites provide an API (Application Programmer Interface) that allows programmers to interact with their data. For instance, both Flickr and Twitter provide APIs that enable developers to view recent updates (photo uploads and tweets). These APIs (but not all APIs) let us get geospatial data that we can use with OpenLayers. Flickr provides some very easy-to-use methods to retrieve data with associated geographic information; so, we'll focus this chapter on building a web-mapping application around Flickr.
You can find out more about APIs and what they support at various websites, a good one is http://www.programmableweb.com.
While Flickr provides a very robust developer API, we'll only interface with Flickr via URL calls that provide access to feeds. Feeds provide information about data, and we can get different kinds of feeds (for example, a specific user's feed or the feed for all users combined). It's really quite easy to do; we just make a call to a URL and specify certain parameters. The base URL we'll call is http://api.flickr.com/services/feeds/geo/?format=kml. The format parameter can be a number of values—KML, JSON, RSS, SQL, and so on. We'll be using KML and JSON in this chapter. When calling this URL, a file in the format you ask for will be returned that contains information about the latest photos uploaded that have geographic information associated with them (that's what geo in the URL is for).
Flickr's API documentation can be found at http://www.flickr.com/services/api/. More information about the Flickr feeds can be found at http://www.flickr.com/services/feeds/.
We can refine the data that is returned by adding additional parameters to the URL. You can specify a user's ID via the ID key, a group via the g key, and tags via the tags key. You can also specify other things, such as a certain coordinate and radius—for now, we'll just be focusing on the tags key.
Let's create a web map application that will pull in data from Flickr and display it on a map. This will allow us to see, geographically, from where photos were submitted. We can, for example, search for bird photos and get an idea where some particular bird species might be common (or at least, commonly photographed and uploaded to Flickr).
The application will provide a search box to enter tags and refresh the map based on them, and allow you to click on points on the map to view the photo and details about it.
We'll break down the development of this application into small steps:
Okay, we've got a goal in mind and broken it down into some manageable steps—we'll start simple and improve in increments until we reach our goal. Let's get started.
The first step in our application will require us to get data from Flickr. We'll request some data and save it locally.
bird as a tag. Open up this URL in your web browser, and you should be able to download it as a KML file from http://api.flickr.com/services/feeds/geo/?format=kml&tags=bird.flickr_data.kml and place it in your map directory.style tags—if we want, we can directly apply the styles from the file to our map (as we'll see soon).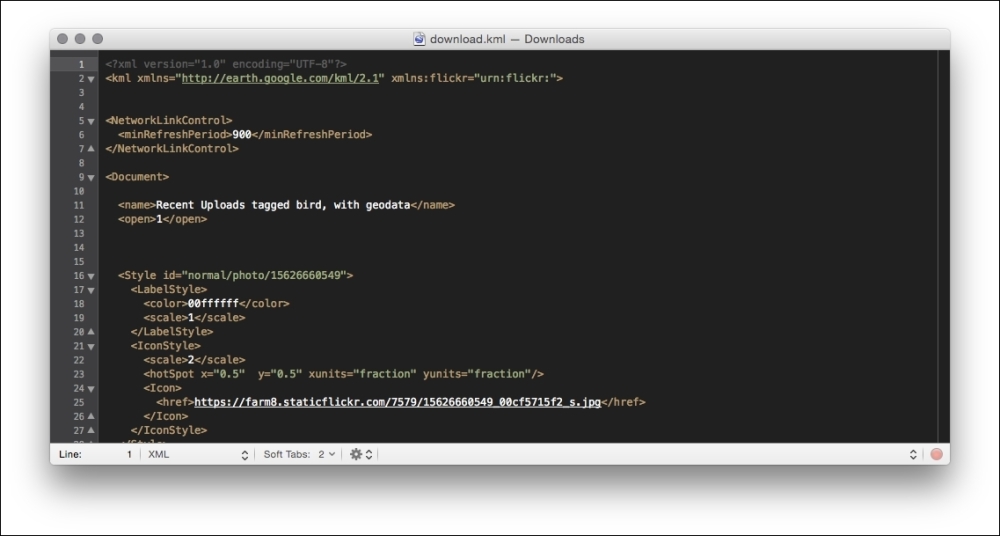
We just downloaded the latest images in the KML format that contained a tag called bird. When you call the URL and pass in a tag, Flickr will return to you the latest images uploaded that have some geographic information associated with them. You may be wondering why we downloaded the KML file. If you remember from Chapter 5, Using Vector Layers, we can just create a vector layer and point to the Flickr URL, instead of a local file. Doing this adds complexity, however, because Flickr does not support Cross Origin Resource Sharing. When we download the KML file, we can access it directly. When we're in the development mode, we want to keep things as easy as possible to debug and fix. Once we get the code working to load the KML file we downloaded (in the next example), we don't need to worry about it anymore. When we develop our application and find bugs or errors with it, we don't have to spend much time tracking them down. We get the static file working, and we move on to the next task. We don't have to worry about the Flickr API going down, our requests not completing, or other things—we can focus on other parts. Once we get more parts of our application working, then we'll switch to using the dynamic URL. For now, let's use the static file.
With the data from Flickr from the previous example, we have enough to get started. We'll create our simple application with an OSM base layer and a vector layer filled with the Flickr data on top of it:
flickr.html. We'll use the familiar structure. Also, we'll start with ol-debug.js and optimize it later:<!doctype html>
<html>
<head>
<title>Flickr App</title>
<link rel="stylesheet" href="../assets/ol3/css/ol.css" type="text/css">
<link rel="stylesheet" href="../assets/css/samples.css" type="text/css">
</head>
<body>
<div id="map" class="map"></div>
<script src="../assets/ol3/js/ol-debug.js></script>
<script>
</script>
</body>
</html><script> tag. Adjust the URL property to point to where you saved your file:var flickrSource = new ol.source.KML({
url: '../assets/data/flickr_data.kml',
projection: 'EPSG:3857'
});
var flickrLayer = new ol.layer.Vector({
source: flickrSource
});var layer = new ol.layer.Tile({
source: new ol.source.OSM()
});var center = ol.proj.transform([0,0], 'EPSG:4326', 'EPSG:3857');
var view = new ol.View({
center: center,
zoom: 1
});
var map = new ol.Map({
target: 'map',
layers: [layer, flickrLayer],
view: view
});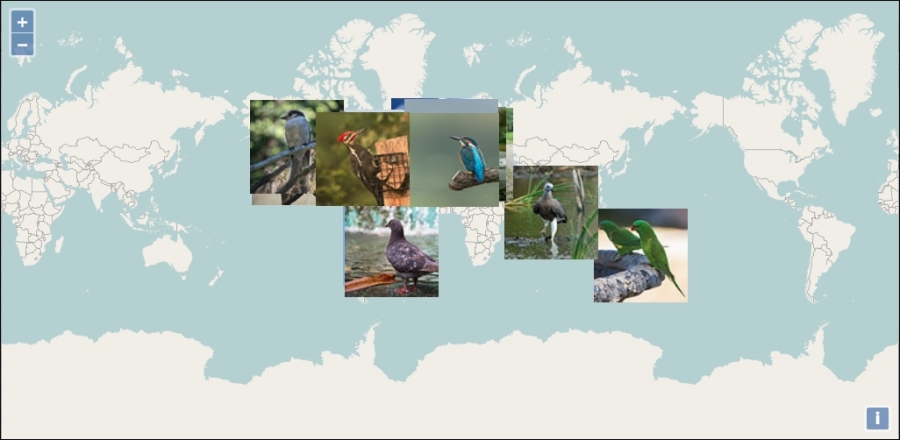
The automatic styles provided in the KML file make it a little difficult to see the photos, especially when we are zoomed out—the thumbnails of the photos are just too large. It'll be nice to make the thumbnails of the photos smaller, but we don't have any control over the default style provided with the KML file. However, we should be able to replace the default styles with our own and achieve the effect we want.
We'll accomplish this in two steps. First, we'll replace the default style with a simple one, and then, we'll develop a new style to display smaller thumbnails:
extractStyles: false to its options:var flickrSource = new ol.source.KML({
url: '../assets/data/flickr_data.kml',
projection: 'EPSG:3857',
extractStyles: false
});function flickrStyle(feature) {
var style = new ol.style.Style({
image: new ol.style.Circle({
radius: 6,
stroke: new ol.style.Stroke({
color: 'white',
width: 2
}),
fill: new ol.style.Fill({
color: 'green'
})
})
});
return [style];
}assets folder, yours will look different if you downloaded new data: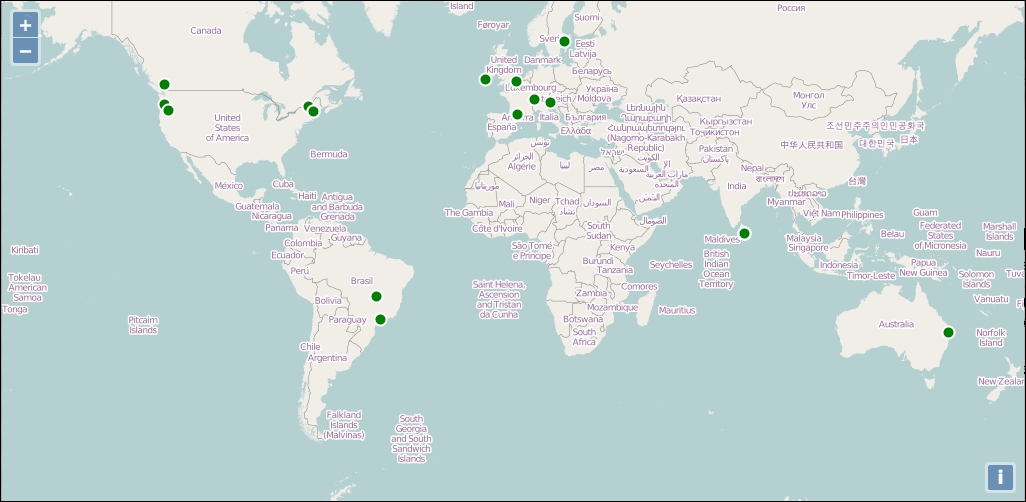
Great, we've replaced the automatic style extracted from the KML file with a simple one driven by a style function. Our style function returns an array containing our simple circle style. If you have been paying attention, you should have noticed that our style function is not at all efficient—we are creating a new copy of exactly the same style for every single feature! Don't worry though, this is a temporary state that we'll fix shortly by generating a unique style for each feature, based on its photo and we'll add caching when we do.
We can use OpenLayer's icon style to display an image, we just need the URL to the photo. We can use the JavaScript console to take a quick look at what data is associated with each feature, so that we can figure out where the URL is stored. With the previous example running in your browser, open the JavaScript console and type the following commands:
var feature = flickrSource.getFeatures()[0]; feature.getProperties();
This gets the first feature from the vector source and displays its properties, which should show you something like the following screenshot:
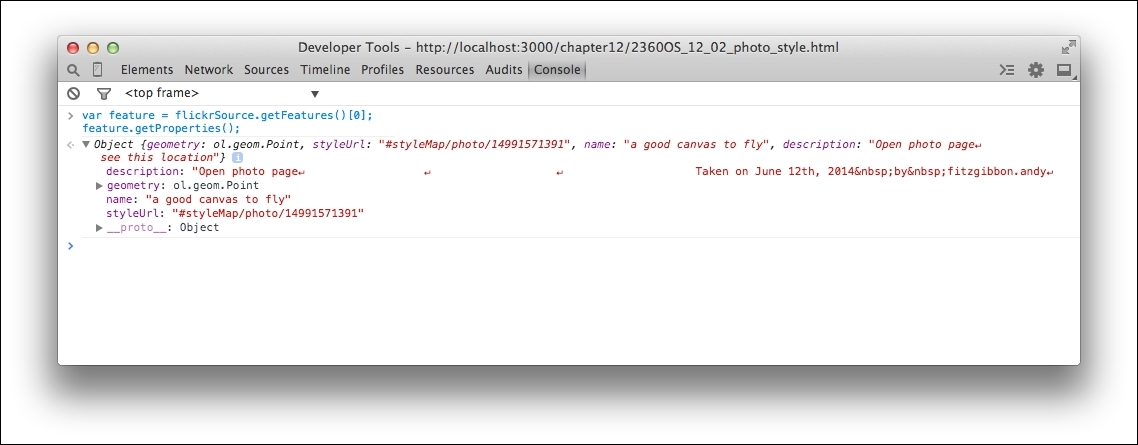
Well, that wasn't as useful as we'd hoped. The URL to the photo is not there, so what's happening? It turns out that the KML format includes style information and OpenLayers is smart enough to extract that information and automatically generate style functions for the features. Unfortunately, OpenLayers is also hiding all the extra information about the feature that we need. We need a different solution.
We mentioned earlier that the Flickr feed API supports more than just the KML format. It also supports a variety of RSS versions and JSON. That sounds promising; let's see if we can do better with the JSON version. Refer to the following steps:
flickrSource, with a generic vector source. Reload the page and make sure that everything still works. You should see the base map but no features (we'll add them shortly):var flickrSource = new ol.source.Vector();
json. Load the following URL in your browser and save the result to a new file called flickr_data.json:jsonFlickrFeed (on the first line, this means that it is intended to be loaded as JSONP).JSONP, or JSON with Padding, is a technique for loading JSON data from a remote server that avoids the restrictions of the same-origin policy. See http://en.wikipedia.org/wiki/JSONP for a good description of why and how JSONP works. For now, it is sufficient to know that JSONP will invoke a callback function and pass the data to it.
The next few lines appear to be metadata about the response—a title, description, date, and so on. What comes next seems to be what we want—an array of objects that represent photos, complete with links to photos and geographic locations. Perfect!
ajax method to do this:$.ajax({
url: '../assets/data/flickr_data.json',
dataType: 'jsonp',
jsonpCallback: 'jsonFlickrFeed',
success: successHandler
});successHandler function to process the data into features and add them to the map:function successHandler(data) {
var transform = ol.proj.getTransform('EPSG:4326', 'EPSG:3857');
data.items.forEach(function(item) {
var feature = new ol.Feature(item);
feature.set('url', item.media.m);
var coordinate = transform([parseFloat(item.longitude), parseFloat(item.latitude)]);
var geometry = new ol.geom.Point(coordinate);
feature.setGeometry(geometry);
flickrSource.addFeature(feature);
});
}var feature = flickrSource.getFeatures()[0]; feature.getProperties();
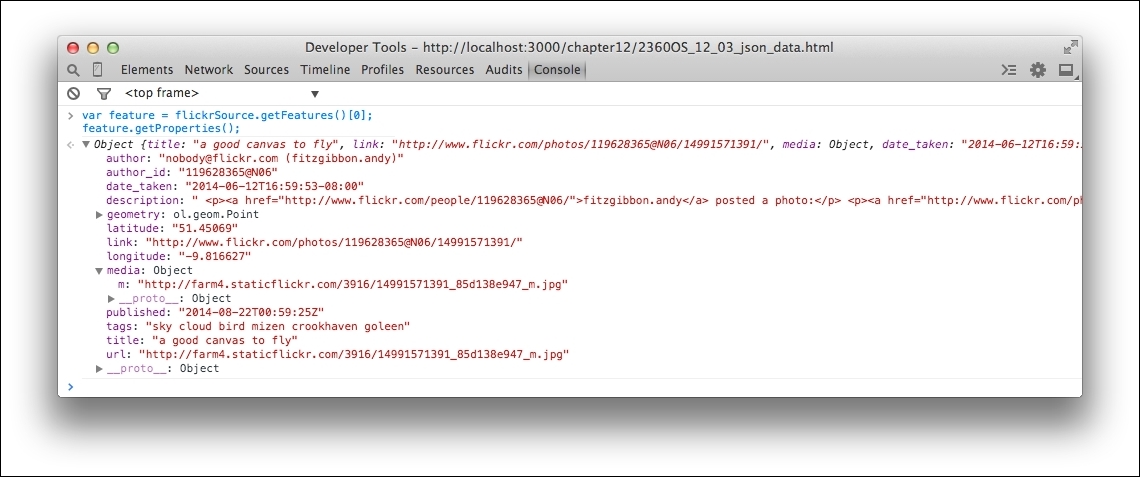
Allowing for different features in the new data file, the application should look exactly the same as before. The only difference is, we are now using JSON data instead of KML. Let's review how we changed from KML to JSON.
The JSON data is not in a format that is directly usable by OpenLayers; so, we need to do most of the work that a format-specific source would do for us. The first step was to remove the KML source and replace it with a generic vector source, into which we can insert the features as we get them. The next step is to load the data. We've chosen to use jQuery's ajax function to do this. The ajax function needs a URL to load from, a function to call when the data is loaded (successHandler) and a configuration to help it understand that the data is in the JSONP format:
dataType: 'jsonp'
And, that it uses a specific callback function name:
jsonpCallback: 'jsonFlickrFeed'
The final step is to interpret the data once it is loaded and create the features we need. We do this inside successHandler by first creating transform that will convert coordinates from latitude and longitude into the projection we are using for the map's view:
var transform = ol.proj.getTransform('EPSG:4326', 'EPSG:3857');Then, we loop over all the items and turn each one into a feature. Each item is an object literal containing all the information we need for positioning and styling the photo. We create a new feature object and pass it this information, so that we can access it later for styling purposes:
var feature = new ol.Feature(item);
From looking at the properties of each photo, we see that the URL to the photo is stored in the media attribute under a key called m. This will be inconvenient to work with later; so, we create a new property called url with the value we want:
feature.set('url', item.media.m);We need to create a new geometry object to represent the feature's location using the latitude and longitude of the photo (remembering to also transform the coordinates into the view's projection) and set it as the geometry of the feature:
var coordinate = transform([parseFloat(item.longitude), parseFloat(item.latitude)]); var geometry = new ol.geom.Point(coordinate); feature.setGeometry(geometry);
Finally, we added the feature to our vector source:
flickrSource.addFeature(feature);
Now that we've got that sorted out, we should be able to create a thumbnail style for our photos reasonably easily:
var cache = {};flickrStyle function and replace it with the following:function flickrStyle(feature) {
var url = feature.get('url');
if (!cache[url]) {
cache[url] = new ol.style.Style({
image: new ol.style.Icon({
scale: 0.10,
src: url
})
});
}
return [cache[url]];
}We just updated our style function to return a more suitable style. In the first step, we created an object to act as a cache for our styles, so that we don't create them multiple times (that's inefficient!), and in the second, we updated our style function to create a new icon style for the feature, if one isn't in the cache already. Our icon style takes care of scaling the image to 10 percent of its original size so that it's not too big for the map area.
So far, we've accessed data from Flickr, saved it to a file, added it to our map and created a simple photo thumbnail style. This is pretty cool, but we really haven't done much other than just load in the data, from an OpenLayers's point of view. It's useful, but we really haven't created a full-featured web application just yet. So, let's focus on how to build a more useful web-mapping application. To do this, we'll basically need to do two general things:
Let's focus on the first part, and then change the data source after we develop some interactivity.
We need to decide what interactivity we'd like to provide to make our application interactive for our users. We'd like our users to be able to click on a photo and see relevant information. For this, we can use the select interaction. What should happen when we select a feature? We'll want to show information about the feature we clicked on, and that information is the Flickr photo itself and any associated attributes. So, let's keep things for now and show the photo's information below the map when a feature is selected.
So, let's go ahead and add a select interaction to our application:
select interaction. We'll add events soon, but for now, let's just create the control and add it to the map and then activate it. Add this at the end of the main <script> tag after all the other code:var select = new ol.interaction.Select({
layers: [flickrLayer]
});
map.addInteraction(select);style option that allows us to do this. We'll create a new function to return a selected style by making a copy of our flickrStyle function and cache object, using a larger scale value, and using the new style function with the select interaction:var selectedCache = {};
function selectedStyle(feature) {
var url = feature.get('url');
if (!selectedCache[url]) {
selectedCache[url] = new ol.style.Style({
image: new ol.style.Icon({
scale: 0.50,
src: url
})
});
}
return [selectedCache[url]];
});
var select = new ol.interaction.Select({
layers: [vectorLayer],
style: selectedStyle
});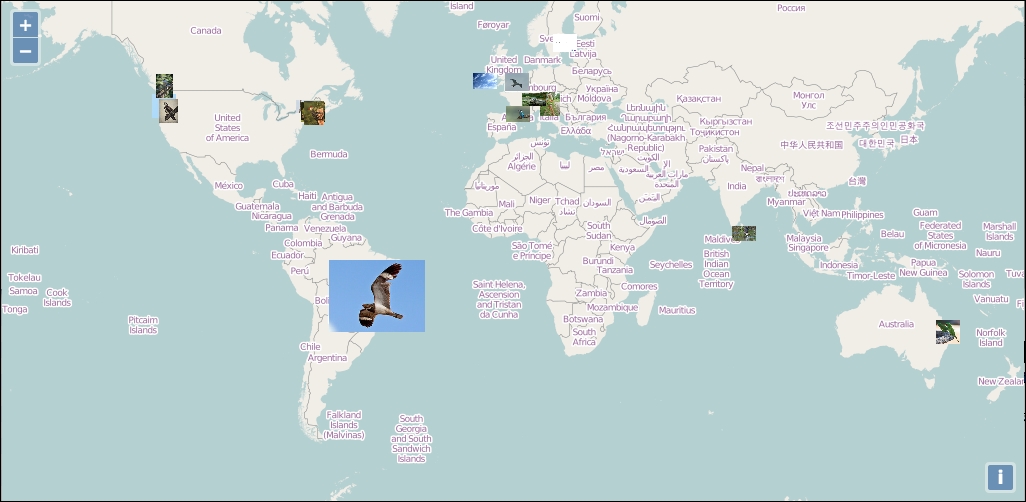
We just added some interactivity to our map. Let's recap how we did this.
The first step, was to add a select interaction to the map, configured to select features from our vector layer:
var select = new ol.interaction.Select({
layers: [flickrLayer]
});
map.addInteraction(select);The default selection style wasn't appropriate; so, we added a new function for styling selected features. We created a new cache object for selected styles, so that we could use the URL as the value for caching, and the style we used was the same thumbnail style but with a larger photo.
We've duplicated the style code, which was easy to do and doesn't really introduce any problems in the runtime efficiency of our code. However, duplicated code can cause maintenance problems in real applications and some effort should be made to avoid obviously duplicate code. Try refactoring the style-related code to eliminate duplication as much as possible. You'll still need separate functions for the select interaction and the vector layer, but the code inside each layer looks like a candidate for moving into a new consolidated function that takes scale as a parameter.
The next step is to display some information about photos when they are selected. To do this, we'll need to listen for an event on the select interaction's collection of selected features and retrieve the features that were selected. Our plan is to have some photo information display when we select features:
<div> tag that will appear below the map. In your HTML code, add the following line after the map's <div> tag:<div id='photo_info ></div>
var selectedFeatures = select.getFeatures();
add event. For now, let's put the URL of the selected photo into our photo_info <div> tag:selectedFeatures.on('add', function(event) {
var feature = event.target.item(0);
var url = feature.get('url');
$('#photo-info').html(url);
});photo_info <div> tag:selectedFeatures.on('remove', function(event) {
$('#photo-info').empty();
});We used the select interaction to respond to the user selecting photos. While there is no direct way to do this, we can use the add and remove events of the collection returned by getFeatures to update our photo_info div with some information about the selected photo.
Earlier, we revealed what information is available for each feature by running the following code in the JavaScript console:
var feature = flickrSource.getFeatures()[0]; feature.getProperties();
And, we saw the following in the console:
We can see that each feature has some interesting information we might want to display:
author and author_id: These are useful for identifying the Flickr user that took the photo.date_taken and published: These contain the date that the photo was taken and the date it was published to Flickr.description: This is a pregenerated HTML string that contains useful information about the photo including the user's description, if available.link: This takes you to the actual Flickr page for the photo.tags: This is a space-separated list of tags associated with the photo.title: This was provided by the user that uploaded the photo.The description property seems like a great thing to display. It's nicely formatted and includes some interesting information for some photos. Unfortunately, all that nice formatting only shows up if we insert the description as HTML into our page. Injecting untrusted HTML into a page, without first sanitizing it, makes your application prone to XSS (Cross-site scripting) attacks, a technique for injecting and executing unauthorized JavaScript into web pages. You should never inject HTML from an untrusted source into a web page. Even though it might seem safe to trust Flickr, we'll be prudent and avoid the description property by creating our own description from other information available.
We need a programmatic way to display the information about our photos in the web page. This means taking data about the selected features and creating HTML elements for them. For the purpose of this chapter, we'll create an HTML template and populate it with data from the feature. While there are many different approaches and libraries for implementing HTML templates, our needs are simple; so, we'll do it without depending on another library.
We'll need several HTML elements to display each piece of information, and a way to specify where in the elements we want to put what information. We could write the template as a JavaScript string, but then we couldn't put line breaks into the HTML and it will be difficult to read in the code. Instead, we'll use the same technique that most templating libraries use—a <script> tag with the id and type attributes set to something other than text/javascript. We'll explain how it works later. We'll use brace brackets { and } around key words to indicate where we want to place specific information.
<body> tag, by convention, they are usually added after everything else and just before the </body> tag at the end:<script type="text/html" id="photo-template">
<a href="{link}" target="_blank" title="Click to open photo in new tab" style="float:left; "><img src="{url}"></a><br>
<p>Ta ken by <a href="http://www.flickr.com/people/{author_id}" target="_blank" title="Click to view author details in new tab">{author}</a> on {date_taken} at lat: {latitude} lon: {longitude}</p><br>
<p>Tagged in <b>{tags}</b></p>
</script>function photoContent(feature) {
var content = $('#photo-template').html();
var keys = ['author','author_id','date_taken','latitude','longitude','link',
'url','tags','title'];
for (var i=0; i<keys.length; i++) {
var key = keys[i];
var value = feature.get(key);
content = content.replace('{'+key+'}',value);
}
return content;
}selectedFeatures.on('add', function(event) {
var feature = event.target.item(0);
var content = photoContent(feature);
$('#photo-info').append(content);
});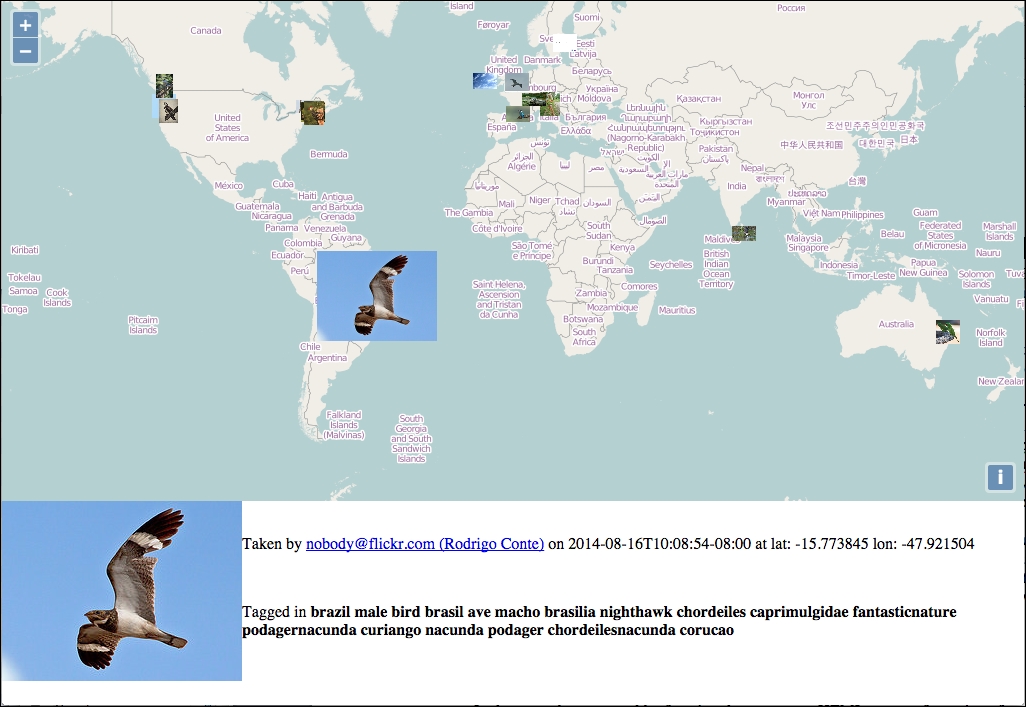
We just built a simple templating system that lets us put feature properties into an HTML template and injected the results into the page to show information about each feature in the selected cluster. Let's review each step in detail.
In the first step, we created our HTML template by putting the HTML code we want to display for each photograph into a <script> tag. This probably sounds strange, but it is a technique used by many template libraries. The <script> tag has a type attribute that tells the browser how to interpret its content. When we are writing JavaScript, the value of the type attribute is text/javascript. If the type attribute is not specified, all browsers will assume that the type is just this—text/javascript. However, if the type is set to something else that the browser does not recognize, such as text/html, then the browser will ignore both the tag and its contents. It is still in the DOM, however, and we can retrieve its content using jQuery's html() method, just as we will with any other HTML element. This allows us to write readable HTML that can be accessed programmatically, without having to worry about it showing up in the web page.
The template content is self-explanatory. We used an anchor tag around the image and some <p> tags for extra information about the author and keywords that the photo was tagged with. We placed brace brackets around a keyword in each place we wanted to insert some information dynamically from a feature property. To keep it simple, the keywords will match the feature property names. Thus, the following line in the template will get replacements for {link} and {url} from the current feature:
<a href="{link}" target="_blank" title="Click to open photo in new tab"><img src="{url}"></a><br>In the second step, we added a function that generates HTML content for a given feature by replacing placeholders in the template with actual values. The first step is to get the content of the template as a string, for which we use jQuery's html() method:
var content = $('#photo-template').html();Next, we have an array of the property names we want to process replacements for.
var keys = ['author','author_id','date_taken','latitude','longitude','link','url','tags','title'];
For each of these, we get the value of the previous property from the feature:
for (var i=0; i<keys.length; i++) {
var key = keys[i];
var value = feature.get(key);Finally, we replaced the placeholder (the key wrapped in brace brackets) with the value and when all replacements were done, we returned the resulting string:
content = content.replace('{'+key+'}',value);
}
return content;In the last step, we made use of our function to get HTML for the selected feature and added it to the page:
$('$photo_info').append(content);The data we've loaded (flickr_data.json) is from a third-party source, but it's only fresh up to the point that we download it. Our application will load the data in real time when the page is loaded. Now that everything is functional with static data, its time to get dynamic and load data in real time.
In this exercise, we'll change our code to fetch the data from Flickr when the page loads, rather than using a previously downloaded file. As you'll see, this is quite straightforward.
$.ajax function and load data directly from the live feed rather than our static file. Go ahead and modify the URL:$.ajax({
url: 'http://api.flickr.com/services/feeds/geo/?format=json&tags=bird',
dataType: 'jsonp',
jsonpCallback: 'jsonFlickrFeed',
success: successHandler
});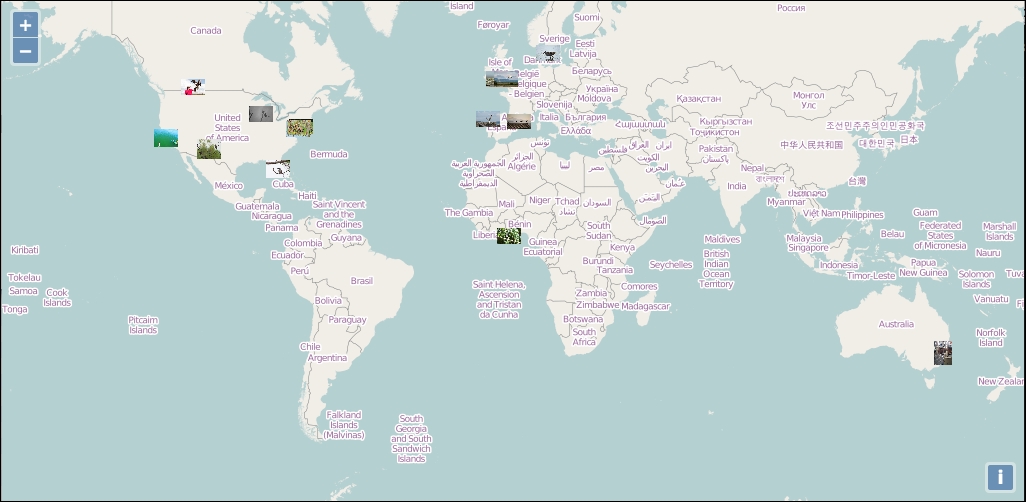
Showing bird pictures from around the world is nice—but what about giving users the ability to show a photo with any tag they want? That's what we'll do next. So far, we've created a map that lets users interact with Flickr data. As far as we're concerned, we're more or less done with the interaction part. Now, we'll focus on changing the data source part. Currently, we're only asking for photos with the bird tag, but we want to allow that to be any tag.
An important concept in application development is to keep things modular. This basically means that we try to write out applications in such a way that we can take out, and put in, different parts without drastically changing the rest of our code. In this case, we will leave the interaction part of our code alone (what we've done so far at least) and focus mainly on the code that retrieves data.
What needs to happen? Well, let's think this through. We want the user to be able to specify any tag they want. We want to allow multiple tags. This means we'll need to change the URL that the $.ajax function is loading, but only after the user specifies some tags. We'll want to create a function to wrap the $.ajax call and come up with a way to change the URL based on the selected tags. We'll also need to deal with removing existing features when the tags change.
So, we know we need to allow a variable that specifies the tags parameter in the URL to be based on user input. We'll need to create an input box that will allow the user to specify tags. We'll also have a submit button that will, when clicked, call a function that updates the $.ajax method's URL with the specified parameters.
Let's add some more interaction to our map now. We'll add an input box that will change the requested Flickr data based on the user's input:
<div id="search" style="position: absolute; top: 10px; right: 10px; padding: 5px; background-color: rgba(255,255,255,0.5);"> <input type="text" placeholder="Search photos by tag(s)" style="width: 200px"> <button type="button">Search</button> </div>
$.ajax call with a function that will get called when the button is clicked. This function will do three things. First, it will clear the existing features from the map. Next, it will clear any selected photo info. Finally, it will request new data from Flickr with the appropriate tags:function loadFlickrFeed(tags) {
selectedFeatures.clear();
flickrSource.clear();
$('#photo-info').empty();
$.ajax({
url: 'http://api.flickr.com/services/feeds/geo',
data: {
format: 'json',
tags: tags
},
dataType: 'jsonp',
jsonpCallback: 'jsonFlickrFeed',
success: successHandler
});
}loadFlickrFeed function:$(document).on('click', '#search button', function() {
var value = $('#search input').val();
var tags = value.split(' ').join(',');
loadFlickrFeed(tags);
});loadFlickrFeed function will get called and refresh the vector layer. Try typing in various tags (or multiple tags separated by a comma) and hitting the button: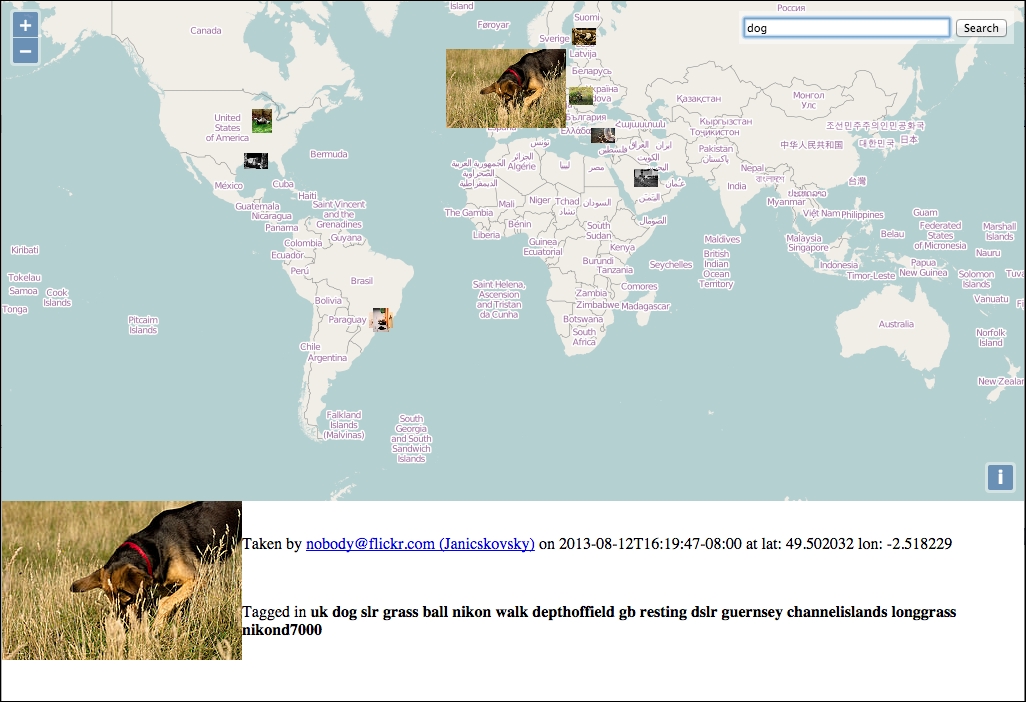
We just updated our Flickr application to allow user input that affects what data is shown. We did this in a sort of modular way—we didn't have to change any of the previous code we wrote. Instead, we just created a function that clears the existing features and loads new ones based on the selected tags. Now that we've written an application, let's talk a little bit about how to deploy it.
What does it mean to deploy an OpenLayers (or any other) application? Basically, deploying something means that we're switching from a development mode to a production mode; we're releasing something for the rest of the world to see.
The production application should be as fast and bug free as possible. As we want the production version to be accessed as quickly as possible, this will often include removing things we used in the development environment and tweaking the production environment to better handle a lot of users. This also means using files that are as small in size as possible. While fully optimizing a web application is beyond the scope of this book, there are a couple of things we can do with OpenLayers to help optimize our JavaScript file size: create a custom build of OpenLayers and compile our code with the OpenLayers code.
There are many other things we should do to better prepare our production environment, such as using caching, as well as combining and minimizing our website's assets. These, and other practices, are outside the scope of this book, but further information can be found at http://en.wikipedia.org/wiki/Web_performance_optimization#Best_practices.
OpenLayers provides an easy way to create a custom build of the library to include in your page that contains only the things you need. Throughout this book, we've been including a file called ol.js (or ol-debug.js), a file that contains all the functionality (classes, functions, and so on) that OpenLayers provides. So far, this has been great—we've been developing up to this point, so we want to be sure that we have access to all the classes that we may use.
Well, the ol.js file we've been using is around 391 KB, and the debug version is 3.5 MB! Both are quite large files to load, especially since they contain only JavaScript code. Even though large file sizes aren't as much of an issue as they were years ago, when everyone was on slower connections, a large JavaScript file in a production environment is something we want to avoid if at all possible. This is especially true for mobile environments, where users pay for data plans and data speeds can be highly variable.
We want all our files in a production environment to be as small as they can absolutely be. This will allow users to download the files faster (since there is less to download), which decreases the page's loading time (saves on bandwidth expenses). Faster page loads (even if the speed is only perceived) will greatly enhance the user's experience. Fortunately, we can greatly reduce the size of the OpenLayers library file with a build tool provided by OpenLayers.
To optimize your application code for production, there are two approaches you can take:
The following table shows the advantages and disadvantages of each approach:
|
Approach |
Advantages |
Disadvantages |
|---|---|---|
|
Combined compilation | ||
|
OpenLayers and application code separate |
|
Before going further, you will need to follow the installation process for Python, Java, and Node following the guide in Appendix B, More details on Closure Tools and Code Optimization Techniques. These tools are required to create custom builds of OpenLayers.
The standard release archive for OpenLayers does not contain the build tools we require. Additionally, the build tools provided with OpenLayers work only with code cloned from a Git repository. The instructions for this book are designed for version 3.0.0 of OpenLayers. To make sure that you are using the correct version, you can check out the v3.0.0 branch of the repository using the following command:
git checkout -b v3.0.0
If you have already run the OpenLayers build tools on a version other than v3.0.0, it is recommended to remove the build and node_modules folders and start again.
We'll briefly cover how the closure compiler works to optimize your code, as we will need to understand it a little bit to use it properly. More detailed information can be found in Appendix B, More details on Closure Tools and Code Optimization Techniques.
The closure compiler optimizes code by applying a series of transformations to your code. Covering all of these is the topic for a whole book in itself, but for our purposes it does three basic things:
When the compiler rewrites your code, it will attempt to use language features that reduce the overall size of your code and execute more efficiently. This can include the following:
Generally, these changes are safe and do not change the logic or functionality of your code. They simply take advantage of language features to fit your code into less space.
The compiler will also attempt to remove the so-called dead code. Dead code is any function that the compiler determines will not be called by the application. It is sometimes difficult for the compiler to automatically determine what code your application will use, especially if you are creating a separate build. In these cases, we need to tell the compiler what things we need to keep even though they might be considered dead code. This is generally done in two ways depending on our strategy. If we are creating a combined build, the compiler can generally determine what functions we will need automatically, but it doesn't know what files to include in the first place. To help the compiler, we add code to register these dependencies. If we are creating a separate build, the compiler doesn't have our code to analyze; so, we have to use a different technique. In this case, we will provide an explicit list of functions to keep in the compiled library.
We will cover both techniques shortly.
The final compiler technique we need to discuss is the renaming strategy. Generally, when we are writing code, we use descriptive names for functions and variables. This makes code much more readable to ourselves and others, and it's much easier to remember names that mean something when writing our code. However, these long names take up space—1 byte per character—and when they are used repeatedly, it can really add up. The JavaScript engine in a browser doesn't really care about our descriptive names though. A name like X1 is just as good as GeoJSONParser, and as long as it is used in the right places, we can save 11 bytes for every use of GeoJSONParser by replacing it with X1. Using short names is not practical for application developers, but it is something that can be done really well by a compiler.
Unfortunately, this is one of the biggest gotchas of using the Closure Compiler. It renames objects, functions, and properties very aggressively and makes them effectively unusable by external code. There are two main problems we need to be aware of concerning this renaming.
When creating a standalone build of OpenLayers, we need to make sure that the objects, functions, and parameters we need are not renamed. This is done using exports, which will be covered later in this chapter.
When creating a combined build of OpenLayers with our application code, we no longer have to worry about exports because our use of the OpenLayers objects, functions, and properties will be taken into consideration by the compiler and renamed appropriately. However, if we use other third-party libraries (for instance, jQuery), the closure compiler does not know about them and will rename our use of their objects, functions, and properties. There are two things we can do to tackle the second problem. First, we can provide special JavaScript files, called externs, which define the objects, functions, and properties of external libraries. The compiler can then correctly avoid renaming parts of our code that we need to preserve. The second, is to use string values in key places, because the compiler will never rename a string value. This technique relies on the ability for JavaScript code to reference object properties using array-like syntax. For instance, if we have a property name on an object foo, normally, we would reference it like the following:
foo.name = 'test';
The compiler might rewrite this code like the following:
XB.XC='test';
If foo is an object coming from some external library that relies on name, our code may break in unusual ways. To prevent this, we can use the array-like notation with a string value to avoid renaming:
foo['name'] = 'test';
We'll see an example of this in our next example.
Exports and externs are quite similar. The first is for choosing the library code you want to expose the third-party code, whereas the second, is to stop the default renaming behavior for the third-party code. To fully grasp the difference, you should refer to the official topic on Do Not Use Externs Instead of Exports! at https://developers.google.com/closure/compiler/docs/api-tutorial3#no.
There are a few steps we need to take to create a combined build. These are as follows:
<script> tag that contains all the JavaScript code into a file and save it as flickr_combined.js. You can, of course, call it something different but the remainder of this example will refer to it by this name. If you choose a different name, make sure to change all the references appropriately.<script> tag to load flickr_combined.js and everything should work as before. If you want to try this, go ahead but remember to remove the script tag afterwards. We won't be using flickr_combined.js directly.goog.require statements to our JavaScript file. Let's go ahead and do that now. Add the following at the top of your flickr_combined.js file:goog.require('ol.Feature');
goog.require('ol.geom.Point');
goog.require('ol.interaction.Select');
goog.require('ol.layer.Tile');
goog.require('ol.layer.Vector');
goog.require('ol.Map');
goog.require('ol.proj');
goog.require('ol.source.OSM');
goog.require('ol.source.Vector');
goog.require('ol.style.Icon');
goog.require('ol.View');If you are using the ol-debug.js build of OpenLayers, then this change will continue to work. If you are using ol.js, however, it will not work as the goog namespace is not exported in the optimized build of OpenLayers.
The OpenLayers build tool runs inside the OpenLayers directory. The easiest way for OpenLayers to find your code is to copy it into the ol3 directory. Go ahead and copy flickr_combined.js into the ol3/build directory now.
flickr_combined.json file within the ol3/build directory and give it the following content. We'll go over the parts of this file afterwards:{
"exports": [],
"src": ["src/**/*.js", "build/flickr_combined.js "],
"compile": {
"externs": [
"externs/closure-compiler.js",
"externs/geojson.js",
"externs/jquery-1.7.js",
"externs/oli.js",
"externs/olx.js",
"externs/proj4js.js",
"externs/vbarray.js"
],
"define": [
"goog.dom.ASSUME_STANDARDS_MODE=true",
"goog.DEBUG=false"
],
"jscomp_error": [
"accessControls",
"ambiguousFunctionDecl",
"checkEventfulObjectDisposal",
"checkRegExp",
"checkStructDictInheritance",
"checkTypes",
"checkVars",
"const",
"constantProperty",
"deprecated",
"duplicateMessage",
"es3",
"es5Strict",
"externsValidation",
"fileoverviewTags",
"globalThis",
"internetExplorerChecks",
"invalidCasts",
"misplacedTypeAnnotation",
"missingGetCssName",
"missingProperties",
"missingProvide",
"missingRequire",
"missingReturn",
"newCheckTypes",
"nonStandardJsDocs",
"suspiciousCode",
"strictModuleDepCheck",
"typeInvalidation",
"undefinedNames",
"undefinedVars",
"unknownDefines",
"uselessCode",
"visibility"
],
"extra_annotation_name": [
"api", "observable"
],
"compilation_level": "ADVANCED",
"output_wrapper": "// OpenLayers 3. See http://ol3.js.org/\n(function(){%output%})();",
"use_types_for_optimization": true,
"manage_closure_dependencies": true
}
}ol3 directory. Execute the following command:node tasks/build.js build/flickr_combined.json build/flickr_combined.built.jsgit status
flickr_combined.built.js back into the working directory of your application code.<script> tag that loads the ol-debug.js script to point to the new JavaScript file, for instance:<script src="flickr_combined.built.js"></script>
We created a custom build of OpenLayers combined with our application code using the provided build tools. We'll review the steps but first, let's take a look at the resulting file sizes:
|
Files Used |
Net Size | |
|---|---|---|
|
Before (debug build) |
|
3.3 MB |
|
Before (optimized build) |
|
385.7 KB |
|
After |
|
153 KB |
As you can see, our final built file is less than half the size of the full OpenLayers build. Okay, now let's review how we did it.
For the OpenLayers build tools to work, they need our application's JavaScript and a configuration file. We first extracted the JavaScript from our HTML into a separate file, then added some extra lines of code to help the Closure compiler understand what parts of OpenLayers we use by adding goog.require statements. Figuring out what you are using from OpenLayers can be a bit tricky in larger applications, but using searching for ol. (that's ol followed by a period) will identify the correct things.
The next step, was to create a configuration file for the build tool. This configuration file is written in the JSON format, which looks a lot like JavaScript. The configuration file has several parts to it:
exports: This identifies specific objects and methods in the OpenLayers library that should not be renamed when creating an optimized build. We'll see how this works in the next example, but for this example, we left it empty because we are combining our application code with OpenLayers.src: This identifies all the source JavaScript files that the compiler should consider when creating the optimized build. We say consider because not all the code will be included in the output. In our configuration file, we can specify the path to the OpenLayers source files (src/**/*.js) and our application file (build/flickr_combined.js).compile: This contains directives specific to the Closure compiler. Modifying this section requires advanced knowledge of the Closure compiler and we won't be covering it in this book. It is normally sufficient just to copy this section to each new configuration file that you create. The one exception is the externs array. The externs array identifies files that contain type hints for the closure compiler. If you are using a third-party library in your application code, you will need to provide an externs file for that library to prevent the compiler from renaming function and property names in your code. For instance, we are using jQuery with our application and have included the jQuery-1.7.js externs file provided with OpenLayers. Externs for other libraries can be found at https://github.com/google/closure-compiler/tree/master/contrib/externs.With our application code prepared and a configuration file, we then run the command-line build tool providing it the name of the configuration file and the name of the JavaScript file to create:
node tasks/build.js build/flicker_combined.json build/flickr_combined.built.js
We then copied the resulting file, flickr_combined.built.js, back into our application folder and updated the script tag to load this file instead of ol-debug.js. The net result is an impressive drop in file size and the elimination of one JavaScript file to load.
In large applications, it is not uncommon to have your JavaScript code separated out into different files based on some logical breakdown of the code. OpenLayers, for instance, has 330 separate JavaScript files. When you have a lot of different files, the net effect of combining them all into a single file is much more apparent to the user.
While the combined build creates a single JavaScript file that contains both OpenLayers library code and your application code, a separate build creates a single JavaScript file that contains just the OpenLayers code required by your application. The main difference with this approach is that we will not use goog.require to tell the compiler what parts of OpenLayers we want to use. Instead, we will use the exports property of the configuration file. The other difference, is that we will not include our application source file in the src configuration.
Unlike before, we don't need to move our application code into a separate file. Unless you kept a copy of the application from before the previous example, however, we'll need to fix up our HTML file a little bit for this example. This example assumes you are starting with the previous example:
flickr_combined.js and call it flickr_separate.js. As always, you may use a different name but make sure it is consistent! You might also want to make a copy of your HTML file and use it for the rest of this example.flickr_separate.js and remove all the goog.require statements from the beginning of the file.<script> tag to load flickr_separate.js after the <script> tag that loads the combined build file:<script src="flickr_separate.js"></script>
flickr_separate.json in the OpenLayers build directory. Give it the following content:{
"exports": ["ol.Map",
"ol.Map#*",
"ol.View",
"ol.animation.*",
"ol.control.*",
"ol.layer.Tile",
"ol.proj.*",
"ol.source.OSM",
"ol.source.Vector",
"ol.source.Vector#getFeatures",
"ol.source.Vector#addFeature",
"ol.source.Vector#removeFeature",
"ol.layer.Vector",
"ol.interaction.Select",
"ol.interaction.Select#getFeatures",
"ol.interaction.Select#on",
"ol.Observable#on",
"ol.Feature",
"ol.Feature#get",
"ol.Feature#set",
"ol.geom.Point",
"ol.style.Style",
"ol.style.Fill",
"ol.style.Stroke",
"ol.style.Circle",
"ol.style.Text",
"ol.style.Icon"
],
"src": ["src/**/*.js"],
"compile": {
"externs": [
"externs/bingmaps.js",
"externs/bootstrap.js",
"externs/closure-compiler.js",
"externs/example.js",
"externs/geojson.js",
"externs/jquery-1.7.js",
"externs/oli.js",
"externs/olx.js",
"externs/proj4js.js",
"externs/tilejson.js",
"externs/topojson.js",
"externs/vbarray.js"
],
"define": [
"goog.dom.ASSUME_STANDARDS_MODE=true",
"goog.DEBUG=false"
],
"jscomp_error": [
"accessControls",
"ambiguousFunctionDecl",
"checkEventfulObjectDisposal",
"checkRegExp",
"checkStructDictInheritance",
"checkTypes",
"checkVars",
"const",
"constantProperty",
"deprecated",
"duplicateMessage",
"es3",
"externsValidation",
"fileoverviewTags",
"globalThis",
"internetExplorerChecks",
"invalidCasts",
"misplacedTypeAnnotation",
"missingGetCssName",
"missingProperties",
"missingProvide",
"missingRequire",
"missingReturn",
"newCheckTypes",
"nonStandardJsDocs",
"suspiciousCode",
"strictModuleDepCheck",
"typeInvalidation",
"undefinedNames",
"undefinedVars",
"unknownDefines",
"uselessCode",
"visibility"
],
"extra_annotation_name": [
"api", "observable"
],
"jscomp_off": [
"es5Strict"
],
"compilation_level": "ADVANCED",
"output_wrapper": "// OpenLayers 3. See http://ol3.js.org/\n(function(){%output%})();",
"use_types_for_optimization": true,
"manage_closure_dependencies": true
}
}ol3 directory, as we did before:node tasks/build.js build/flickr_separate.json build/flickr_separate.ol.js
flickr_separate.ol.js back to your application folder next to flickr_separate.js.flickr_combined.js to point to this new file:<script src="flickr_separate.ol.js"></script>
We just created a custom build of the OpenLayers library that contains only the code we need, and which exports only the things we actually use. The resulting library is a little bit larger—177.5 KB vs 156.5 KB—because the compiler is preserving the names of the objects, functions, and properties that we have exported. Let's review these steps.
First, we adapted our previous example and modified a copy of our application code to remove the goog.require statements. Those won't be needed for the compiler, and in fact, won't work with our custom build because the goog namespace is not exported.
Next, we created a new configuration file for the compiler. You probably noticed that it's nearly identical to the one from the previous example. In fact, there are two differences and they are very important. First, we removed our application source from the build by removing it from the src property. Second, we explicitly listed the names of objects and functions we want exported in the exports section.
Populating exports is really the trickiest part of creating a separate build. As with the combined build, a search of your code for ol. will identify all the main classes that you are referencing and these can be included directly in the exports array. However, exporting a class does not automatically export any of its properties or methods. We also need to know what methods we call on all objects that are exported. In some cases, we don't actually call any methods on the objects we created, but in other cases, we do. Finding these methods is a bit more time consuming as it requires manually reading the code.
When adding a method name to the exports list, we write it with the object name first, a # symbol, and then the method name, for instance see the following:
ol.Map#getSize
It is also possible to export all methods of an object by using * instead of a method name after the # symbol. While this is quick and easy, it will produce much larger builds than necessary in most cases.
You've reached the end of the book! In this chapter, we built a simple web map application that grabs Flickr data based on user input. We covered some development concepts throughout the chapter, such as attempting to keep our code modular. We learned how to interact with other third-party APIs, and built an application from the ground up. Lastly, we talked about deployment and learned how to use the OpenLayers build script. Now that you've finished reading this book (I hope you've enjoyed it), you should be able to go out and make your own impressive web maps!
When you need to make a custom map using the OpenLayers 3 library, you need to grasp the common programming sentences and vocabularies.
Why? It's because OpenLayers relies on JavaScript, a programming language based on object-oriented programming (OOP). Knowledge about OOP is shared amongst programmers. Without this knowledge, it will be difficult to talk about programming issues, for example, on a forum.
We will see that behind complex words lie simple concepts. In fact, everyone uses OOP concepts on a daily basis but without being aware of it.
In this appendix, we will cover:
Let's talk about how object-oriented programming works from a theoretical and technical level.
Object-oriented programming is a programming paradigm. It added a new way to manage code by using the concept of object as opposed to procedural programming where code follow the reading order. By using OOP, you gain reusability of code. The main gain is related to encapsulation or separation of concern. Each object has his own life.
To understand object orientation, let's take a simple example—animals. Your cat is a class. If you have four cats, you have four objects of type cat. Each of them has different properties name, age and sex values. A cat can move. In OOP terms, move is a method of the class cat.
Let's review some questions that can help you understand keywords and concepts we will implicitly use.
An object can be considered a thing that can perform actions and has properties. The action defines the object's behavior. For instance, the cat can jump. Your cat's age is eight so the property value is 8.
In pure OOP terms, an object is an instance of a class.
In an OpenLayers context, imagine you want a side-by-side map where you prepared a div with id attribute equal to map1 and another one for the id attribute with the value map2. You will use the JavaScript new operator to declare two instances of the ol.Map class like following:
var map1 = new ol.Map({ target: 'map1'});
var map2 = new ol.Map({ target: 'map2'});An instance means that each object based on the class has it own properties values.
In our example, the target property is different for the map1 and map2 objects.
A class can be considered as an extensible program-code-template.
When you already know OOP, you use the word class to declare it but in JavaScript, the class is known as a function. Also, functions are used as constructors.
The following excerpt from OpenLayers illustrates how a class looks:
ol.Map = function(options) {
}We also recommend you inspect the full ol.Map class at http://openlayers.org/en/v3.0.0/apidoc/map.js.html after reviewing the following information box to discover on your own the class methods and properties.
We will abusively use classes to describe object-oriented programming but the truth is that JavaScript is based on prototypes and not classes. We chose to simplify the explanation as more people understand OOP based on classes. The main goal is to explain inheritance in particular. To learn the difference. we recommend going to https://developer.mozilla.org/en-US/docs/Web/JavaScript/Guide/Details_of_the_Object_Model for more.
To instantiate an object, you need to use the new keyword on a JavaScript function.
For example, when using new ol.Map(), the function ol.Map is called the constructor. It's the function you use with the new keyword to create an object. You can give options to the constructor.
There are other ways to create an object but to keep thing simple, we chose to restrict our explanation to the most common way when using the OpenLayers library. If you want to go further, go to https://developer.mozilla.org/en-US/docs/Web/JavaScript/Guide/Working_with_Objects.
Inheritance is the ability of a new class to be created, from an existing class by extending it. With this, you use the DRY (Don't repeat Yourself) principle. For example, you can reuse method or properties from a parent class. Don't sweat, it's time to explain!
Imagine after describing your cat, you also want to describe your dog in OOP.
Cats and dogs are not the same but they share some characteristics like their name, their sex or their age or they ability to move. However, a cat can jump from windows whereas a dog can't. We don't want to maintain two classes because they have common properties. You can achieve this by using a new class called animal. It can be represented like the following diagram:
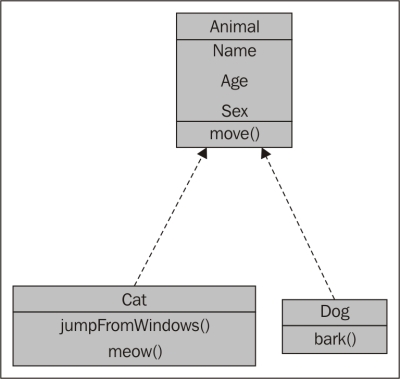
In your code, instead of declaring every common property and method twice, you declare that your Cat class inherits from the Animal class, so you can reuse properties and methods from the parent class. Cat and Dog are subclasses of the Animal class. You can also says that the Cat class extends the Animal class.
Why do you think it's useful to review this abstract concept?
It's because you need to figure out the relations between OpenLayers 3 library components. The library heavily uses inheritance and for creating your own components, it's a requirement.
It's a class you use to define properties for other class that need to inherit it properties and / or methods but you never directly instantiate this class. The animal can be considered as an abstract class. However, in OpenLayers, the ol.source.XYZ isn't an abstract class, although ol.source.OSM is its child class.
Namespace helps you to organize your code by grouping it logically, and also by separating variables from the global.
You can declare a namespace with something like below:
var app = {
main: ""
}or
var app = {};
app.main = {};The ol.* classes in the API documentation illustrate the namespace purpose http://openlayers.org/en/v3.0.0/apidoc/.
Methods are actions you can use within the object. Getters and setters are special types of methods. A setter's purpose is to set property within the object, whereas a getter is to get property from the object.
In OpenLayers, most classes inherit from the ol.Object class. This class is fundamental for using setters and getters within the library. The excerpt from the official documentation is quite clear about them:
"Classes that inherit from this have predefined properties, to which you can add your own. The pre-defined properties are listed in this documentation as Observable Properties, and have their own accessors; for example,
ol.Maphas atargetproperty, accessed withgetTarget()and changed withsetTarget(). However, not all properties are settable. There are also general-purpose accessors,get()andset(). For example,get('target')is equivalent togetTarget()."
Let's have a look at the API and understand how it uses the OOP concepts.
After reviewing the most important principles, let's inspect the API to sort out how to analyze it with OOP concepts.
For this, we will reuse the ol.source.XYZ API documentation, http://openlayers.org/en/v3.0.0/apidoc/ol.source.XYZ.html. First, let's start with the content on top of the page.
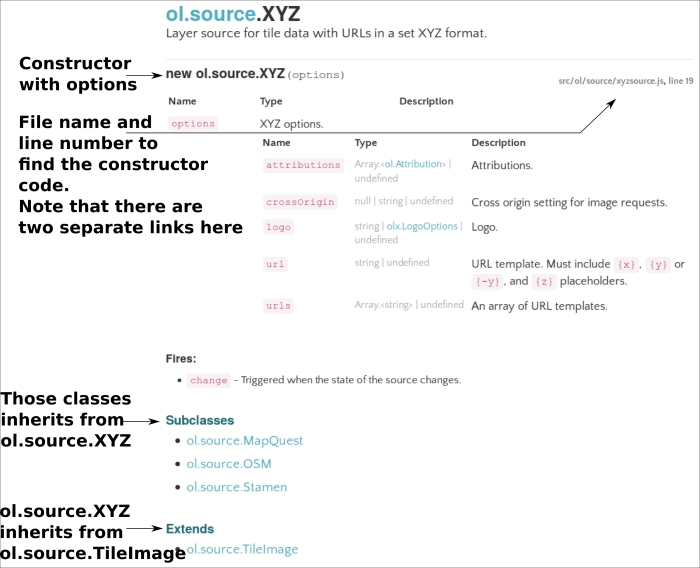
The illustration above is self-explanatory. You should follow the link for the constructor function, the subclasses to inspect properties, and methods subclasses inherits and discover provided properties and methods from ol.source.TileImage.
Using the following screenshot, you will be able understand inheritance:
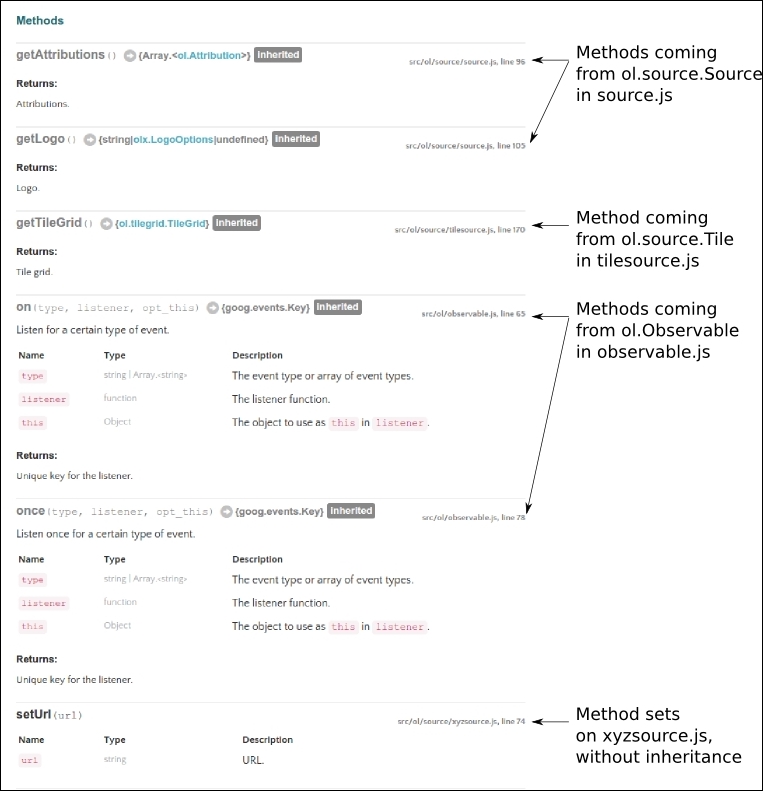
Looking at the screenshot, we are able to figure out most of the inheritance. We deduced the exact class inheritance by hovering over the inherited keyword with the mouse to see the URL that gives us a hint about it.
Within the previous screenshot, for readability, we had to remove the full ol.source.XYZ class description. If we include and follow all the available methods, the relationships between ol.source.XYZ class methods and properties and their parent and child classes, the result will be as follows:
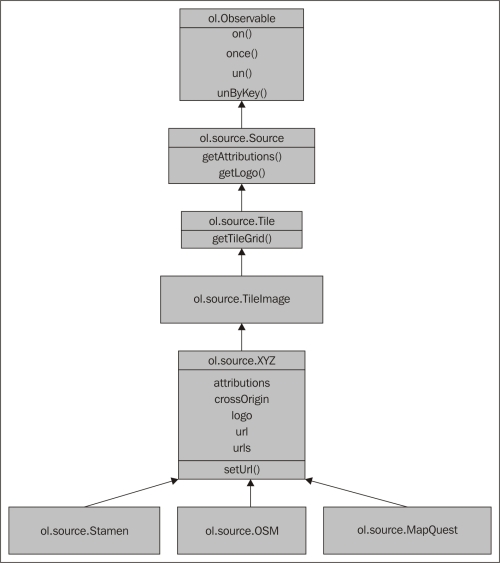
For a more complete abstract about object-oriented programming, check out https://en.wikipedia.org/wiki/Object-oriented_programming.
For a review concerning JavaScript object-oriented programming, head on to https://developer.mozilla.org/en-US/docs/Web/JavaScript/Introduction_to_Object-Oriented_JavaScript.
Closure Tools are a set of utilities used for web development. It is mainly supported by Google, but is open source under the Apache License Version 2.0, a well-established permissive license. The name Closure Tools hides under it a lot of subtools, which will make your life as an apprentice developer easier. It includes a JavaScript optimizer, a JavaScript library, a templating library, a style checker and style fixer, and at last, a stylesheet language. Just to illustrate how powerful this set can be, think that most Google JavaScript applications, such as Gmail or Google Maps, use these components.
Why are we introducing you to these tools?
The OpenLayers 3 library itself depends on the Closure Library, the JavaScript library attached to Closure Tools. Its main goal is to leverage cross-browser support. You also know you can write your application in pure JavaScript.
However, you can also consider Closure for advanced uses like creating your own component such as controls and buttons with special behavior inherited from an existing OpenLayers component. You will also get some useful UI components. It is also a good toolset to achieve better file compression when you want an efficient web mapping application, using the Closure Compiler, another utility from the Closure Tools bundle.
We will not review all Closure Tools but only the most useful. Specifically, we will cover the following topics:
If you have ever done a bit of web development, and in particular, JavaScript, you must have heard about jQuery, the most popular JavaScript library with more than 50 percent of the worldwide websites using it. To not reinvent the wheel, the OpenLayers development team chose Closure Library rather than jQuery. Why was this decision made? For a better understanding, you need a bit of history of the Web.
In the olden days, there wasn't a lot of JavaScript. All applications were created using simple HTML and CSS. There was dynamic content when reloading a full page using a server-side such as PHP or Java. However, people wanted a smoother web navigation experience. With the way AJAX works it was possible, as illustrated in the following figure, and people began to focus more and more on the client-side:
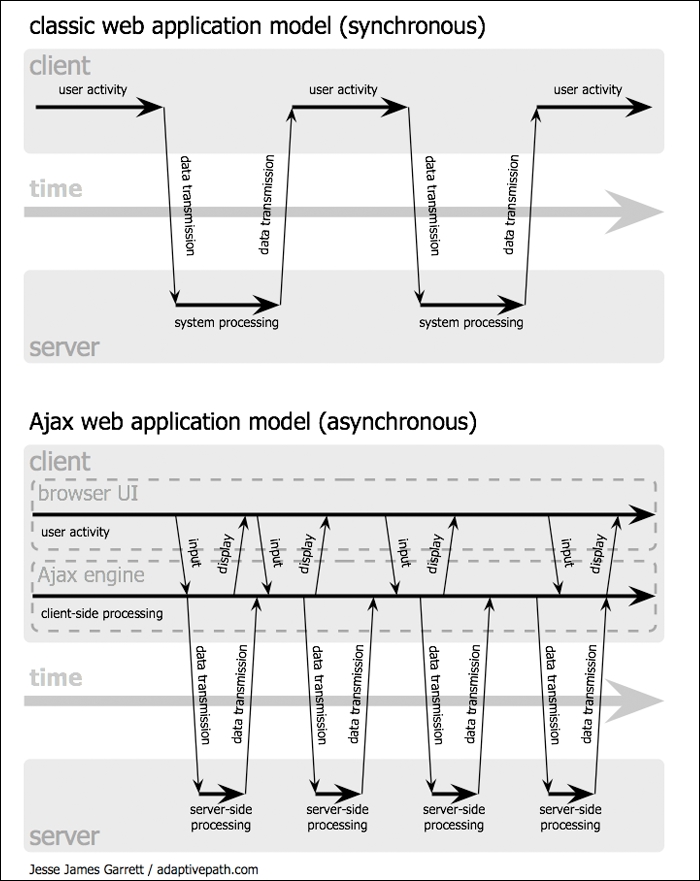
The main two problems associated with this evolution are:
When you are at home, you don't really suffer from bandwidth restriction, but in other cases, you will always suffer from high latency. If you are planning to work on mobile support with limited bandwidth, high latency, and a browser with limited memory, it can be a pain.
A good part of the solution lies in compression.
You have three levels of compression available for JavaScript, depending on technology:
For performance, the last method will work the best, and the Closure Library is the only JavaScript library able to work this way, when combined with Closure Compiler.
Closure Tools, in particular, Closure Library and Closure Compiler are among the best tools to deal with this case.
Although both tools are tightly related, we will review the most useful functions related to Google Closure Library and later explain how to use Closure Compiler to optimize code.
Although we can download the library on our computer, to remain simple, we will use a remote JavaScript library version.
<!DOCTYPE html>
<html>
<head>
<title>Dom manipulation</title>
<script src='https://rawgit.com/google/closure-library/master/closure/goog/base.js'></script>
<script>
goog.require('goog.dom');
</script>
</head>
<body>
<ul id="my_layers_list">
<li>My first layer</li>
<li>My second layer</li>
<li>My third layer</li>
<li>My background or base layer</li>
</ul>
<script>
var my_layers_list = goog.dom.getElement('my_layers_list');
var myTitle = goog.dom.createDom('h1');
var myText = goog.dom.createTextNode("My simple layers list");
goog.dom.append(myTitle, myText);
goog.dom.insertSiblingBefore(myTitle, my_layers_list);
</script>
</body>
</html>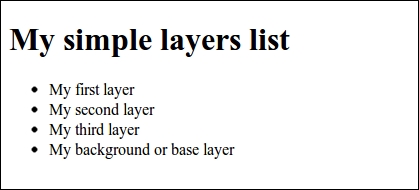
In order to understand the code, let's review the lines related to the Google Library:
<script src='https://rawgit.com/google/closure-library/master/closure/goog/base.js'> </script>
Load the library base from a remote file. The code hosted on Github, needs to use a third-party website https://rawgit.com to be able to serve the .js files:
goog.require('goog.dom'); This line is the way to say make available the function from goog.dom namespace of the library. If you forget this call, every function call starting with goog.dom will fail. This call adds a call to <script src='https://rawgit.com/google/closure-library/master/closure/goog/base.js'> and must be separated in a dedicated <script> tag.
The goal here is to load only required functions and to keep your JavaScript clean with namespacing. Namespace enables separation of functions based on a common name. The chosen namespace for the Google Library is goog, so every function based on the library will start with goog. In this case, the goog.dom namespace is created. To discover the available functions in the namespace, you can use your JavaScript debugger and type goog.dom var my_layers_list = goog.dom.getElement('my_layers_list');. This line selects from DOM the element with an attribute ID, 'my_layer_lists'.
var myTitle = goog.dom.createDom('h1'); creates an <h1> tag in an HTML fragment, an element separated from the DOM, which you plan to add later to the web page DOM:
var myText = goog.dom.createTextNode("My simple layers list");The following code line adds a text node, the visible element in HTML you will see in a web page.
goog.dom.append(myTitle, myText);
Add the text node to the <h1> tag. That is, the two previous floating elements <h1> </h1> and My simple layers list became: <h1>My simple layers list</h1>
goog.dom.insertSiblingBefore(myTitle, my_layers_list);
Add the combined fragment to the DOM: it will be visible in your browser. We choose to use the insertSiblingBefore method. Its purpose is to add a fragment in the DOM before a reference DOM element. So, the text with <h1> tags will appear before the list.
With this example, we have reviewed a small subset of the goog.dom functions.
You will need them, for example, for interactivity like displaying an element with a color change, or for having an application that reacts to a click of a button.
Google library is an ever evolving JavaScript library
In a real context, outside experimentations such as the first Closure Library code example, you will need to retrieve it using an SCM (Source Code Management) software. Its goal is to follow every change in the code. It is one of the most useful tools for developers. The one you need is called Git. Don't worry about it at the moment, we will need it in the Installing the OpenLayers development environment section. For now, just remember the URL to get the code from https://github.com/google/closure-library
To give you an overview of the most useful functions, we have mentioned below some statistics on the most used namespaces and sub-namespaces' functions in the OpenLayers 3 library. We also chose to keep the functions at the first level such as goog.require(. You can make the distinction between functions and namespaces with the open parenthesis. We also ordered the list in the following table:
|
Namespace and sub-namespaces |
Numbers of occurrences |
|---|---|
|
|
1436 |
|
|
812 |
|
|
765 |
|
|
349 |
|
|
295 |
|
|
289 |
|
|
196 |
|
|
168 |
|
|
136 |
|
|
113 |
|
|
100 |
|
|
81 |
|
|
72 |
|
|
68 |
|
|
39 |
|
|
35 |
|
|
22 |
|
|
21 |
|
|
14 |
|
|
13 |
|
|
12 |
|
|
11 |
|
|
9 |
|
|
5 |
|
|
4 |
|
|
3 |
|
|
2 |
|
|
1 |
Let's talk about goog.require and goog.provide. The Google Library, and hence the OpenLayers internal code, manages dependencies using these two declarations. In a file, goog.require helps declaring required functions needed in the application code, whereas the goog.provide is the opposite: it permits declaring that some functions are within a file. These declarations combined with Closure Compiler usage help solve dependencies between the various library files and also with the application code. Reusing these dependencies will enable combining code for production.
Other important functions are goog.inherits and goog.base: you will find them to apply inheritance concepts already evoked in Appendix A, Object-oriented Programming – Introduction and Concepts.
With previous functions, you might think that some functions not at the top of the list are not useful, but you shouldn't. In fact, we invite you to review them because the code for the core of a JavaScript library differs from the code application to use it. In particular, look at goog.userAgent functions or goog.style.
To have an overview of the available functions, the recommended way is to visit the official website, https://developers.google.com/closure/library/, to review the API, http://docs.closure-library.googlecode.com/git/index.html. For samples, look at the available demos you have to use at https://github.com/google/closure-library/tree/master/closure/goog/demos/. It's a great complementary help to the API, in particular to get an overview of the goog.ui components.
Next, let's head to an example to make your own component using Closure Library.
When a component is not available, you will have to write some application code or for reuse purpose, make your own. In this section, we will first review some of the concepts of JavaScript applied with Google Closure Library. After this, we will see one of the official sample code to understand how to use the library to create your own customized component.
Let's start with the inheritance. It should ring a bell; otherwise, you should review Appendix A, Object-oriented Programming – Introduction and Concepts. This example will be enough to introduce you to other key concepts of the library:
<!DOCTYPE html>
<html>
<head>
<title>Inheritance</title>
<script src='https://rawgit.com/google/closure-library/master/closure/goog/base.js'></script>
</head>
<body>
<script>
//Parent Class
goog.provide('myNamespace.layer.Layer');
/**
* @constructor
*/
myNamespace.layer.Layer = function (options) {
this.color_ = options.color || 'grey';
}
myNamespace.layer.Layer.prototype.getColor = function () {
return this.color_;
}
//Sub Class
goog.provide('myNamespace.layer.Vector');
/**
* @constructor
* @extends {myNamespace.layer.Layer}
*/
myNamespace.layer.Vector = function (options) {
goog.base(this, options);
if (options.style) {
this.style_ = options.style;
}
}
goog.inherits(myNamespace.layer.Vector, myNamespace.layer.Layer);
//Create a new instance of Vector layer and call to method from parent class.
var myVector = new myNamespace.layer.Vector({
color: 'white',
style: 'myStyle'
});
console.log(myVector.getColor());
</script>
</body>
</html>Launch it in your browser with the debugger, like Google Developer Tools, opened.
Let's review the code for the main lines:
<script src='http://closure-library.googlecode.com/svn/trunk/closure/goog/base.js'> </script>
This inserts the call to Closure Library:
goog.provide('myNamespace.layer.Layer');This declares the parent namespace (and class) with goog.provide:
/**
* @constructor
*/
myNamespace.layer.Layer = function (options) {
this.color_ = options.color || 'grey';
}This declares the parent constructor:
myNamespace.layer.Layer.prototype.getColor = function () {
return this.color_;
}This adds a method to the prototype of the object:
goog.provide('myNamespace.layer.Vector');This declares the children's namespace (and class) with goog.provide:
/**
* @constructor
* @extends {myNamespace.layer.Layer}
*/
myNamespace.layer.Vector = function (options) {
goog.base(this, options);
if (options.style) {
this.style_ = options.style;
}
}This declares the children's constructor and specifies who the parent is, in comments with @extends.
In the function, goog.base(this, options); can be replaced with myNamespace.layer.Layer.call(this, options); for a pure JavaScript alternative. It says to call the options from the current constructor:
goog.inherits(myNamespace.layer.Vector, myNamespace.layer.Layer);
This makes myNamespace.layer.Vector inherit from its parent myNamespace.layer.Layer.
var myVector = new myNamespace.layer.Vector({
color: 'white',
style: 'myStyle'
});
console.log(myVector.getColor());This instantiates myNamespace.layer.Vector with options and makes a console call to get the method call to the parent class in order to retrieve the color.
Until now, we mainly covered Closure Library, but this knowledge can be reused in OpenLayers. You will see that OpenLayers application code can really look like Closure Library.
To see the similarity between Closure Library and OpenLayers application code, we will review inheritance in a real OpenLayers context. So, we will ask you to review an official example available at http://openlayers.org/en/v3.0.0/examples/custom-controls.html.
It will also be a good opportunity to review inheritance knowledge from Chapter 2, Key Concepts in OpenLayers; Chapter 9, Taking Control of Controls and Appendix A, Object-oriented Programming – Introduction and Concepts.
This example contains the following JavaScript content:
/**
* Define a namespace for the application.
*/
window.app = {};
var app = window.app;
//
// Define rotate to north control.
//
/**
* @constructor
* @extends {ol.control.Control}
* @param {Object=} opt_options Control options.
*/
app.RotateNorthControl = function(opt_options) {
var options = opt_options || {};
var anchor = document.createElement('a');
anchor.href = '#rotate-north';
anchor.innerHTML = 'N';
var this_ = this;
var handleRotateNorth = function(e) {
// prevent #rotate-north anchor from getting appended to the url
e.preventDefault();
this_.getMap().getView().setRotation(0);
};
anchor.addEventListener('click', handleRotateNorth, false);
anchor.addEventListener('touchstart', handleRotateNorth, false);
var element = document.createElement('div');
element.className = 'rotate-north ol-unselectable';
element.appendChild(anchor);
ol.control.Control.call(this, {
element: element,
target: options.target
});
};
ol.inherits(app.RotateNorthControl, ol.control.Control);
//
// Create map, giving it a rotate to north control.
//
var map = new ol.Map({
controls: ol.control.defaults({
attributionOptions: /** @type {olx.control.AttributionOptions} */ ({
collapsible: false
})
}).extend([
new app.RotateNorthControl()
]),
layers: [
new ol.layer.Tile({
source: new ol.source.OSM()
})
],
renderer: exampleNS.getRendererFromQueryString(),
target: 'map',
view: new ol.View({
center: [0, 0],
zoom: 2,
rotation: 1
})
});These questions are for improvement:
RotateNorthControl component?ol.inherits is an alias to goog.inherits)?Until now, we focused on Closure Library. However, as we mentioned at the start of this chapter, for performance, we need to use Closure Compiler as well. It is time to do it!
The more we can learn without installing tools the better it is to lower the learning entry. So, we will use the Closure Compiler online tool. Go to the official URL, http://closure-compiler.appspot.com and you will get the following screenshot:
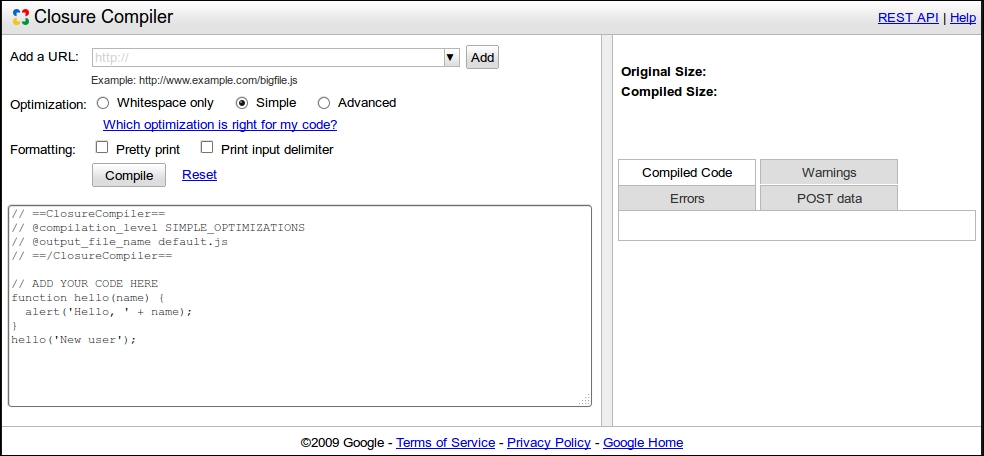
To display the ability of the Closure Compiler to compress files, we will ask you to try it online. Perform the following actions:
// ADD YOUR CODE HERE section in the left-hand text area.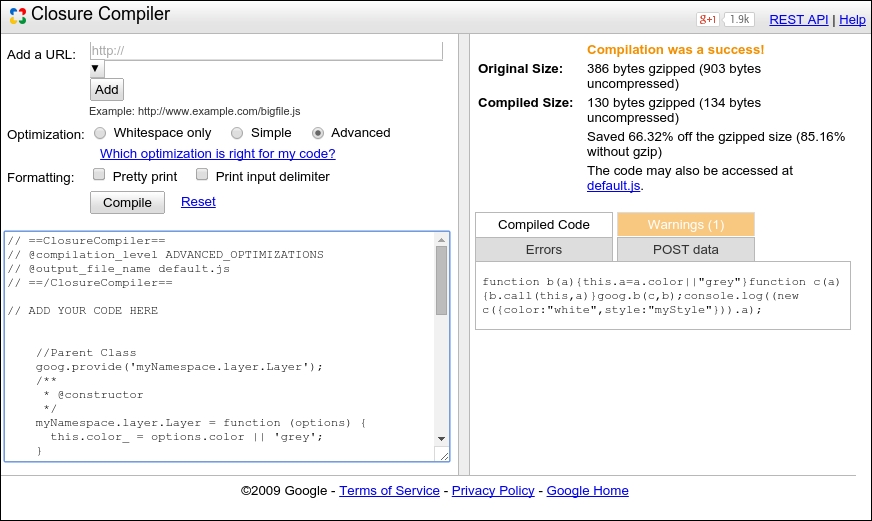
The results you get from your experiment are as follows:
|
Compression level |
Original size |
Original gzipped size |
Save percentage |
Compiled size |
Compiled gzipped size |
Save gzipped percentage |
|---|---|---|---|---|---|---|
|
WHITESPACE |
940 bytes |
391 bytes |
45.21% |
515 bytes |
238 bytes |
39.13% |
|
SIMPLE |
940 bytes |
391 bytes |
52.77% |
444 bytes |
224 bytes |
42.71% |
|
ADVANCED |
940 bytes |
391 bytes |
85.74% |
160 bytes |
141 bytes |
66.75% |
Let's take a look at the results of the different optimizations mode to compare:
goog.provide("myNamespace.layer.Layer");myNamespace.layer.Layer=function(options){this.color_=options.color||"grey"};myNamespace.layer.Layer.prototype.getColor=function(){return this.color_};goog.provide("myNamespace.layer.Vector");myNamespace.layer.Vector=function(options){goog.base(this,options);if(options.style)this.style_=options.style};goog.inherits(myNamespace.layer.Vector,myNamespace.layer.Layer);var myVector=new myNamespace.layer.Vector({color:"white",style:"myStyle"});console.log(myVector.getColor());As you can see, everything is preserved. You only made the code compact by removing white space.
var myNamespace={layer:{}};myNamespace.layer.Layer=function(a){this.color_=a.color||"grey"};myNamespace.layer.Layer.prototype.getColor=function(){return this.color_};myNamespace.layer.Vector=function(a){myNamespace.layer.Layer.call(this,a);a.style&&(this.style_=a.style)};goog.inherits(myNamespace.layer.Vector,myNamespace.layer.Layer);var myVector=new myNamespace.layer.Vector({color:"white",style:"myStyle"});console.log(myVector.getColor());As you can see the compiler has done a substituting job by replacing all the goog functions. The only remaining namespaced function is goog.inherits. The function arguments are also renamed. It remains quite readable. If you replace the JavaScript from the example with this one, you can always call in your console the function with their original names.
function b(a){this.a=a.color||"grey"}function c(a){b.call(this,a);a.style&&(this.c=a.style)}goog.b(c,b);console.log((new c({color:"white",style:"myStyle"})).a);As you can see in this case, most of the code is renamed. The code in itself will have the same behavior but you can't call it with the original functions you wrote.
The ADVANCED way of doing it is the more efficient way to compress, but it requires extra work as compared to the SIMPLE mode. In particular, you need to add extra comments to be able to run the compiler. We gave you a working example, but removed the text @constructor on the sample code and run again the ADVANCED mode and observe. Because of this mode when you are using foreign code such as an external library, you have to mention preserve this code from renaming. For this, you have to declare what we call externs. If you don't have available externs with the library you are using, your code will fail to execute correctly.
Do not worry at the moment! The OpenLayers tools we will review already support jQuery externs, for example. We recommend that you go to the dedicated web pages from Google because it's an advanced feature (https://developers.google.com/closure/compiler/docs/api-tutorial3) and because we will review later how to solve it in the OpenLayers 3 context. You can also solve the problem using only the SIMPLE mode but you will lose a part of the gain of Closure Tools.
We will now see the application of what we learned so far in OpenLayers.
When you choose to release your application online and you need performance for your web mapping applications, you need to perform certain steps.
Closure Compiler enables you to do so at the JavaScript level. In the OpenLayers project, some tools facilitate the use of Closure Compiler.
These tools, such as Closure Compiler, depend on three languages: Python, Java, and Node. We will quickly review the install process to run it.
We will review how to install the environment on the different operating systems. We will start with Python. Then, we will install NodeJS. Next, we will do a Java installation and we will end with other tools such as Git installing.
Closure Compiler requires 2.x series of Python. You can install it using the following instructions for Microsoft Windows and Linux. For Mac OSX, Python is already bundled.
Go to http://www.python.org/downloads/ and follow these steps:
Click on the link referring to the latest Python 2.x series (2.7.9 at writing time). Next, click Download on the Windows x86 MSI Installer or Windows X86-64 MSI Installer, depending of your Microsoft Windows architecture.
;C:\Python27;C:\Python27\Scripts.You need to open a command line as superuser:
On a RedHat-based OS:
yum install python python-setuptools
On Ubuntu/Debian OS:
apt-get install python python-setuptools
On every OS, open a command line (for MS-DOS, go to open Command Prompt or Bash for Linux/Mac OSX) and type:
python –-version
It will echo something such as Python 2.7.5.
For all OS, you must install pip, a packet manager for Python.
Download it at https://bootstrap.pypa.io/get-pip.py and then execute the following code line:
python get-pip.py
It's quite easy. We will not rely on external packages but only official binaries. Check out the official website at http://nodejs.org/download/.
Just download the binary, and then execute the installer. Nowadays, except if you have an old Windows XP, you should download the 64 bit Windows Installer (.msi).
Instructions are for both RedHat-based OS and Ubuntu/Debian OS.
su or by adding sudo:
mkdir /opt/node && chmod -R 777 /opt/node/
/opt/node directory.~/.profile file the following:
export PATH=$PATH:/opt/node/bin
We have assumed you started from scratch. You may already have Java installed. Mostly, it will be the JRE (Java Runtime Environment). JRE is enough to execute Java, but we can also use the developer-oriented JDK (Java Development Kit).
Before downloading a new JRE, try to see if you already have Java installed. For this, open a command prompt and type the following:
java -version
If the feedback is not something like java version "1.7.0_xx", you should consider installing the JRE. The returned version must be 1.7.0_xx (xx is the exact version) and it should not be 1.6.0_xx or 1.8.0.xx. At the writing time, the version was 1.7.0_72.
Independent of the OS, head to http://www.oracle.com/technetwork/java/javase/downloads for downloading the file you require to have Java JRE (Java Runtime Environment).
As there are many links, you will find the following screenshot with the mouse indicating the link to follow:
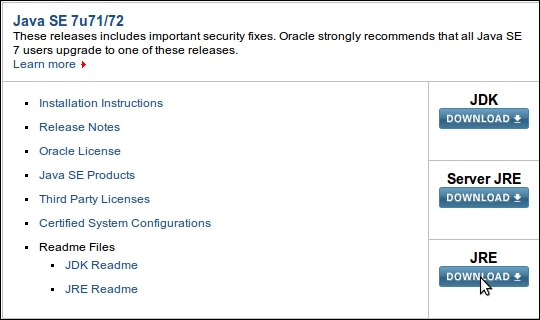
After download, run the installer and set the PATH, as for Python.
Here, you will need to add a new system environment variable called JAVA_HOME with the value C:\Program Files\Java\jrexxx or C:\Program Files(x86)\Java\jrexxx, depending on your architecture (32 or 64 bit). You will follow the same recipe described to change PATH in Python but instead of editing an existing variable, you will add it.
After, add at the end of the PATH environment ;%JAVA_HOME%\bin.
On a RedHat-based OS:
Retrieve the RPM from the URL retrieved by following the screenshot JRE Download button and perform the following command as superuser (depending on your java version):
rpm -ivh jre-7u72-linux-x64.rpm
On an Ubuntu/Debian OS, get the tar.gz Linux file instead of the RPM file:
tar xvzf jre-7u72-linux-x64.tar.gz mv jre1.7.0_72 /opt/ && chmod -R 777 /opt/jre1.7.0_72
In ~/.profile, add the following content at the end of the file:
export JAVA_HOME=/opt/jre1.7.0_72 export PATH=$PATH:$JAVA_HOME/bin
In the information box about Closure Library, we mentioned an SCM called Git. Now, it's time for installation. Let's see how it works on a different OS.
Head to the msysGit project, https://msysgit.github.io, download the installer by clicking on the Download link and execute it.
After installation, add to the PATH, as for Python, the string; C:\msysgit\bin\;C:\msysgit\bin\mingw\bin
yum install git-core
On an Ubuntu/Debian OS:
apt-get install gitMac OSX
Go to the Mac installer website, http://code.google.com/p/git-osx-installer, and install it.
Now that you have Git, you can install other tools.
Now, everything is ready! So, let's start to use the Closure Compiler to better understand how to optimize your code to display faster maps. We will review how to use the OpenLayers development workflow to make your custom application.
We will inspect reusing the workflow for developing the OpenLayers core library to run the official examples. For this purpose, start with the following step:
git clone https://github.com/openlayers/ol3.git cd ol3 git checkout v3.0.0
npm install sudo pip install -r requirements.txt
build.cmd checkdeps or ./build.py checkdeps on Linux / Mac OSX. It will return if dependencies are solved to proceed to the next step.build.cmd build.cmd host-examples build.cmd serve
./build.py ./build.py host-examples ./build.py serve
You may need an offline API, if for example, you're working in public transportation or without a network connection. To generate it, execute the ./build.py apidoc or build.cmd apidoc. Then, open it with http://localhost:3000/build/hosted/HEAD/apidoc/. You can also get it directly from the v3.0.0.zip file, downloaded from Chapter 1, Getting Started with OpenLayers.
http://localhost:3000/examples/ and open Google Chrome Developers Tools. You will see the examples like the one you get on the official website that follows: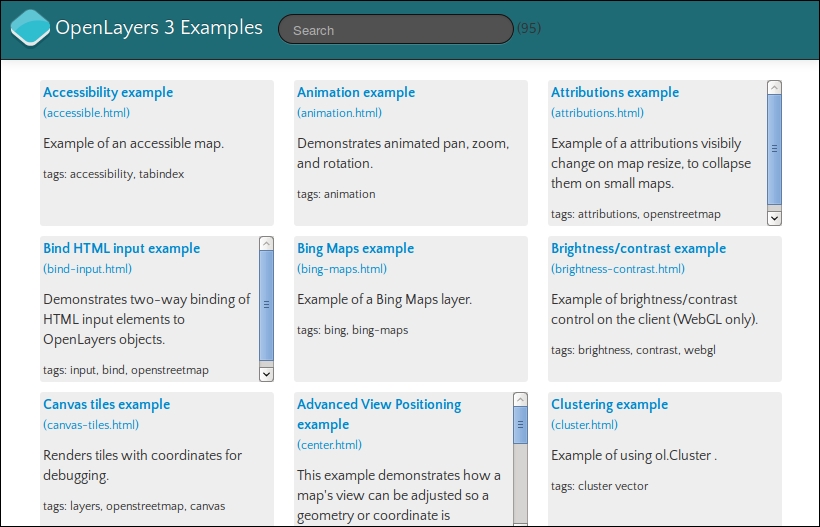
http://localhost:3000/build/hosted/HEAD/examples/attributions.html.?mode=whitespace or ?mode=simple, or ?mode=raw.We serve files on a small web server. In the first case, the loader.js file retrieves the dependencies and adds for each required files the script tag with the src attribute. In the second case, we chose to open the hosted files, the ones you get when you browse the official website, http://openlayers.org.
In the second case, depending on the provided values for the mode parameter, we will load different files for the OpenLayers 3 library:
<script> tag. This does not run the Compiler, so no checks are performed.SIMPLE_OPTIMIZATIONS enabled. Without an option in the URL, this loads the JavaScript as compiled with ADVANCED_OPTIMIZATIONS enabled.Hey! These options look familiar, where did we see them?
Remember that we had mentioned to you that OpenLayers tools are using Closure Compiler. Let's see how OpenLayers takes benefits from it.
When you changed examples with the raw mode, you may have noticed (in particular by filtering the script in the Network panel) that the loaded files number greatly differs from the URL without it. What can make this difference? Let's see some practical uses to understand.
We waited until now to review the removal of the unused code feature related to Google Closure Compiler.
As we already said, when you switch between examples, you load different files. How does it work?
Open your browser Network panel. Open the URL for one of the official examples and add ?mode=raw.
Then, in the console, type console.log(paths.length);.
Just compare the length between the examples. If your example in the URL is animation.html, inspect also the animation-require.js files, you will see that there are some lines beginning with goog.require('...'). The loader gets the name from the file via loader?id=examplename, and with the goog.require indications from examplename-require.js, Closure Compiler generates the list of files to load for the example.
When Compiler does not find the required goog.require statements, it excludes the files and the resulting build file is smaller. On mobile applications, it is invaluable. Just be careful to not break your application, for example, if you forget to add a statement.
When you run ./build.py or build.cmd, you have something such as 2014-12-10 18:41:23,358 build/ol.js: node tasks/build.js config/ol.json build/ol.js. We will reuse the beginning command to compile the ol.js file again and play with the Closure Compiler builder included in the OpenLayers 3 toolkit. The ol.json file is used to provide parameters to Closure Compiler to make the build and ol.js is the output result.
To build, you have two choices:
.js lightened buildAt the moment, you have a shared JSON file for all examples in config/examples-all.json. We will reuse it.
We will reuse the animation sample, from the local OpenLayers installation, to try out both ways of building code:
animation.html and animation.js files from the examples folder into animation-exports.html and animation-exports.js.config/ol-animation-exports.json inspired by the config/examples-all.json with the following content:{
"exports": ["ol.Map",
"ol.Map#*",
"ol.View",
"ol.animation.*",
"ol.control.*",
"ol.layer.Tile",
"ol.proj.*",
"ol.source.OSM"
],
"src": ["src/**/*.js"],
"compile": {
"externs": [
"externs/bingmaps.js",
"externs/bootstrap.js",
"externs/closure-compiler.js",
"externs/example.js",
"externs/geojson.js",
"externs/jquery-1.7.js",
"externs/oli.js",
"externs/olx.js",
"externs/proj4js.js",
"externs/tilejson.js",
"externs/topojson.js",
"externs/vbarray.js"
],
"define": [
"goog.dom.ASSUME_STANDARDS_MODE=true",
"goog.DEBUG=false"
],
"jscomp_error": [
"accessControls",
"ambiguousFunctionDecl",
"checkEventfulObjectDisposal",
"checkRegExp",
"checkStructDictInheritance",
"checkTypes",
"checkVars",
"const",
"constantProperty",
"deprecated",
"duplicateMessage",
"es3",
"externsValidation",
"fileoverviewTags",
"globalThis",
"internetExplorerChecks",
"invalidCasts",
"misplacedTypeAnnotation",
"missingGetCssName",
"missingProperties",
"missingProvide",
"missingRequire",
"missingReturn",
"newCheckTypes",
"nonStandardJsDocs",
"suspiciousCode",
"strictModuleDepCheck",
"typeInvalidation",
"undefinedNames",
"undefinedVars",
"unknownDefines",
"uselessCode",
"visibility"
],
"extra_annotation_name": [
"api", "observable"
],
"jscomp_off": [
"es5Strict"
],
"compilation_level": "ADVANCED",
"output_wrapper": "// OpenLayers 3. See http://ol3.js.org/\n(function(){%output%})();",
"use_types_for_optimization": true
}
}animation-exports.js file, remove the goog.require statements.animation-exports.html, change the script src attribute from loader.js?id=animation to ../build/ol-animation-exports.js and add a new script reference with <script src="animation-exports.js"></script>.ol-animation-exports.js file from the root ol3 folder using the following command:
node tasks/build.js config/ol-animation-exports.json build/ol-animation-exports.js
./build.py serve or build.cmd serve and open your browser at http://localhost:3000/examples/animation-exports.html.animation.html and animation.js from the examples folder into animation-combined.html and animation-combined.js.<script src="jquery.min.js"></script>
<script src="../build/ol-animation-combined.js"></script>config/ol-animation-exports.json into config/ol-animation-combined.json.[] and add at the end of the array, contained in the src value, the .js files declaration to get a result like the following:"src": [
"src/**/*.js",
"examples/animation-combined.js"
]examples/animation-combined.js file the code from resources/example-behaviour.js.externs/example.js, from the config/ol-animation-combined.json file.
node tasks/build.js config/ol-animation-combined.json build/ol-animation-combined.js
http://localhost:3000/examples/animation-exports.htmlUntil now, to facilitate learning, we used code for samples within the HTML. For compressing code, firstly, you need to have all your JavaScript code in a separate .js file.
In the first case, we used exports in the ADVANCED mode. At the functional level, exporting means that you want to stop obfuscating variables, for example, renaming variables and properties to shorter ones. The advantage of this, is that you can use code from outside the library, in a third-party JavaScript file. It can help you, for example, in designing a subset of the OpenLayers 3 library for specific use cases or making your own library based on the OpenLayers 3 and a custom code augmenting the default.
At the code level, to know what we want to export, we reuse the content from goog.require statements in the example. These statements are deduced from the code namespaces and constructors . If you limit yourself to these statements to declare exports, when compiling and executing code, you will get some errors stating undefined in the browser debugger console. Mostly, it means you protect the constructor but you didn't choose some functions to protect. To protect from variable renaming, you will need to use the * character. It's what we have done with ol.Map#* or ol.proj.*.
In the ol.Map#* case, we said that we wanted to protect all functions from ol.Map.prototype to be renamed by using the # character. In the ol.proj.* use case, we just protected the all ol.transform namespace.
For externs, we will not go in to the details of how they work, but you just have to understand that it's a way to protect code from other libraries to be renamed by Closure Compiler by declaring their variables' and functions' signatures.
If we review the other parameters in the first JSON file, the most important ones are:
src: This helps define where your compiler has to search for code when managing dependencies. Those dependencies are declared by declarations in code.compilation_level: This can be set to ADVANCED, WHITESPACE_ONLY, or SIMPLE. We chose to look at the ADVANCED case, because once we have understood how to work with the advanced option, the others can be worked on easily.use_types_for_optimization. In fact, it highlights the importance of comments also known as annotations. We will start by quoting the official Closure Compiler documentation:"The Closure Compiler can use data type information about JavaScript variables to provide enhanced optimization and warnings. JavaScript, however, has no way to declare types. Because JavaScript has no syntax for declaring the type of a variable, you must use comments in the code to specify the data type."
From this, we can deduce that you can use Closure Compiler without always using comments but comments can help you catch errors using variables type checking based on comments (based on a standard called JSDoc).
It's also useful, because when Closure compiler uses the ADVANCED mode, the compiler renames variables to decrease the build size and annotations act as hints for the tool. Moreover, the commenting code is anyways a good practice to maintain code: do not hesitate to use them. Navigate to the official Closure Compiler documentation (https://developers.google.com/closure/compiler/docs/js-for-compiler) to see the exact grammar.
Another good tip related to annotations is the fact that adding an annotation @api (specific to OpenLayers) is the way to export a function when you use OpenLayers 3 default build system.
For instance, you can add @api to ol.Ellipsoid and ol.Ellipsoid.prototype.vincentyDistance in the file src/ol/ellipsoid/ellipsoid.js (for reference, see src/ol/map.js line 160). Then, launch node tasks/build.js config/ol.json build/ol.js and reuse the generated ol.js instead of the usual one. You will see that you can use, in your application code, the following code:
var ellipsoid_wgs84 = new ol.Ellipsoid(6378137, 1/298.257223563); var distance_ol3_vincenty = ellipsoid_wgs84.vincentyDistance([5, 34], [12, 56])
We will not inspect all the other parameters, because it's mostly not required to understand their meanings. If you would like to read further about them, we recommend that you go to the API and to the readme file about tasks that document most parameters at https://github.com/openlayers/ol3/blob/v3.0.0/tasks/readme.md.
If we dive into the case where we build everything together, the essential part is the inclusion of the build/ol-animation-combined.js file in the src array parameter.
As we removed the script tag calling resources/example-behaviour.js from animation-combined.html, we had to combine resources/example-behaviour.js with examples/animation-combined.js files. It's because adding a file into src array is not enough. You need goog.require into the file to be combined with the main OpenLayers 3 library code.
With the inclusion of resources/example-behaviour.js, the other important part was to remove the externs/example.js line, in order to unprotect the exampleNS namespace, so that we can rename it.
You should also note that in both reviewed case, compression can be achieved because of already mentioned goog.require and goog.provide. At the code level, they allow you to create a dependencies tree to gather each required function and variable within OpenLayers core library code source files.
If you inspect the size of the resulting files, you will see that although we have more content in the ol-animation-combined.js file than ol-animation-exports.js, the first one weighs 190Ko (65Ko manually gzip compressed), whereas the second size is 212Ko (71Ko manually gzip compressed).
The conclusion is that compiling everything together is the best solution to gain size in your code.
Now, try to reuse this knowledge in your own OpenLayers samples build.
Now that you have all the basic knowledge about OpenLayers toolkit to compress code, try and apply it your own project.
To improve your skills, you can perform the same task we did in the previous Time for action section, but using a different example. You can use the JSON files from the build/examples because they may help you to solve building dependencies. Be careful, if you rely only on those files, it will not work the expected way if you use the export method or you change JavaScript calls in samples HTML files.
To try it out.
You have to change the paths in samples, and then test them by interacting with your samples; it may work when they are loading, but they will fail later when clicking and panning.
Remember we told you that without externs, you can't use external libraries in the ADVANCED mode? We recommend you comment out or remove externs, to see what will happen if we don't use them. In particular, try to remove jQuery externs, and try to build the examples from Time for action.
What do you see? If you don't have any ideas, you can see that externs' keywords refers to some JavaScript files. If you need, for example, to use a library such as Underscore (another JavaScript Library to use more functional programming), just copy the externs, add your path to the JSON file, say, "../externs/underscore.js", and after this, you are ready to use your library in the Closure Compiler ADVANCED mode.
To find out about externs, go to this Closure Compiler web page: https://github.com/google/closure-compiler/wiki/Externs-For-Common-Libraries
If you require another less common library, find it using a search engine or by generating it with this tool: http://blog.dotnetwise.com/2009/11/closure-compiler-externs-extractor.html
In the worst case, you will be stuck and will only be able to use the SIMPLE mode or to use the exports method, building a minimum Openlayers core library.
Q1. When using the OpenLayers 3 toolkit, your code is not working in the ADVANCED compilation mode, although it's perfectly fine in the SIMPLE mode, what can be the cause (multiple choices accepted)?
goog.requiregoog.inheritsgoog functions in your custom codeNow, we have seen mainly an underlying way to compress the JavaScript code; we will introduce you to syntax and styles in JavaScript code. When you start to write more than ten lines of code, it starts to become an obligation!
Syntax and styles are the way to keep your code clean and to share it. You can always do dirty work, but for maintainability of long term, it is a must to enforce some rules.
For this, we rely on Closure Linter, one of the Closure tools. It also requires Python to run. We already installed it with pip install -r requirements; so, let's see how to use it. Later, we will see some alternatives.
We will retrieve one file from the previous OpenLayers library Version 2.12.
For this, download the file Map.js from https://raw.github.com/openlayers/openlayers/release-2.12/lib/OpenLayers/Map.js.
Type the following command:
gjslint Map.js
You will get 605 errors with messages like below:
----- FILE : /home/thomas/Map.js ----- Line 1, E:0001: Extra space at end of line Line 7, E:0200: Invalid JsDoc tag: requires Line 266, E:0131: Single-quoted string preferred over double-quoted string. Line 982, E:0120: Binary operator should go on previous line "+" Line 1106, E:0002: Missing space before "(" Line 1131, E:0002: Missing space after "function" Line 1089, E:0110: Line too long (83 characters). Found 605 errors, including 0 new errors, in 1 files (0 files OK).
Some of the errors reported by GJsLint may be auto-fixable using the fixjsstyle script. Please double-check any changes it makes and report any bugs. The script can be run by executing:
fixjsstyle Map.js
So now, make a copy of the Map.js file to save it in an eventual case where the fixer would suffer from a bug. Then, execute the following recommended line:
fixjsstyle Map.js
You will see:
fixjsstyle Map.js Fixed 582 errors in /home/thomas/Map.js WARNING: Line 1089 of /home/thomas/Map.js is now longer than 80 characters.
Relaunch the gjslint again:
gjslint Map.js
You now have only 23 errors. Really good compared to the previous 605 errors. You can ignore, in this case, errors like:
Be aware, that you can use options to comply more or less to the language but can't customize everything. You are also encouraged to play with the options. To discover them, execute the following command:
gjslint -–help
For example, try the --strict options that check also your file indentation and you get 1867 errors or use the recursive option -r to apply check on a every JavaScript files in a directory.
We use a practical approach, but to understand the adopted code style, we invite you to go to the Google JavaScript Guide at http://google-styleguide.googlecode.com/svn/trunk/javascriptguide.xml, in particular, if you don't want to fix all your code at the end of your project.
We gave you some information about the raw use of the Linter, but like for other cases, you already can check your code in the default OpenLayers development environment. Just launch ./build.py lint or build.cmd lint, depending on your OS.
Although syntax and styles are considered as good practices. Good practices are not rules; you choose to respect them more or less. Never forget that consistency is important, particularly when you need to share your code with other people. We reviewed how to do it with Closure Linter but this is not the only way. Let's broaden your vision.
It is always easier to use the same tools for all your JavaScript, but we advise that you be curious about other JavaScript coding styles for improving your knowledge and choose the coding style that fits you.
We recommend that you not only look at https://github.com/rwldrn/idiomatic.js but also at big library projects.
For example, check out the following links:
To enforce your own coding style and share it, the most valuables tools are as follows:
Although those tools are interesting, the errors you receive when using them on your files are not always clear. So, we advise that you look at http://jslinterrors.com.
In this appendix, we learned a lot about the Closure Tools. It is always important to understand how things work to be able to track why your code is not working. Without this review, when using, for example, the ADVANCED mode, you will stay stuck and end up keeping the default file for production. If you do so, you are losing partly the OpenLayers 3 philosophy: this version is a rewrite to have a better API and to get performances.
In the first part of the appendix, we learned why performance is important. Next, we saw how to reuse Closure Library or how to overload default OpenLayers 3 components. We then inspected how to practically use Closure Compiler itself in the OpenLayers development context.
Finally, we introduced you to some tools to improve your overall code quality. In this case, only remember this citation from idiomatic.js:
"All code in any code-base should look like a single person typed it, no matter how many people contributed."
OpenLayers is, at a fundamental level, not doing anything that is conceptually too hard to grasp. It gets map data from a server, and puts them together. From a technical level, however, there is a lot of work going on, and it might seem magical how it all works together so well.
Fortunately, there are many tools to dispel any potential magical thinking we might have and show us how OpenLayers is working behind the scenes. Google Chrome Developer Tools, the included debugger in Google Chrome browser, is one such great tool. Speeding up development time, viewing network communication, and squashing bugs are just a few things that Chrome Developer Tools, and other web development tools, do that make them hard to live without.
To really use OpenLayers effectively and to its full potential, we need to understand how it works. In this appendix, we'll try our best to do just that, by using web development tools to examine OpenLayers' inner workings. By doing so, we'll accomplish two things. First, we'll become familiar with these tools, which will significantly help us when developing our maps. Secondly, and more importantly for now, we'll gain a better understanding of how OpenLayers works.
We'll do another tour about plugins and functions that can improve your experience in Chrome Developers Tools and can help you develop your OpenLayers debugging skills. To finish, the last topic will be how to work with other browsers when debugging. You may not be aware, but Google Chrome and its Developers Tools is around one-third of the browser market.
In this chapter, we'll cover the following topics:
Chrome Developer Tools, also called Chrome DevTools, is the built-in debugger included in Google Chrome browser, a free cross-platform browser. Other modern- and standards-based browsers, such as Mozilla's Firefox, Apple's Safari, Opera, and Microsoft Internet Explorer (8+) also work well for debugging web-based applications and sites.
Chrome DevTools and other web development tools make the web development process much easier and quicker. What do we mean by this? With these tools, we can change anything on our site on the fly without editing or saving any files. We can type in JavaScript code with a command-line interface and execute it immediately. We can view all the requests that our web page sends to servers, along with the server's reply. For example, if our map isn't able to get back map images from the server, we can examine the requests our page is making and find out if we have any typos or haven't set up our map layer properly.
Using these tools makes it a lot easier to develop not only an OpenLayers mapping application, but any web application, and makes it easier to fix any bugs we encounter in the process. The choice to use Google Chrome as the first tool for debugging instead of other debuggers is motivated by its large support for mobile testing, the best built-in tools for debugging at the time of this writing, its support for all OS (Windows, Mac, Linux) and some others features. We'll focus mainly on Google Chrome in this chapter and refer back to it throughout the book. Other tools such as Mozilla's Firefox, Internet Explorer (8+), and Apple's Safari's developer tools work just as well (although some functionality may vary).
To discover this tool, firstly, Google Chrome browser needs to be installed.
So, go to its dedicated download area at http://www.google.com/chrome/ and install it. Depending of your OS, the format for installing the software will be an .exe, a .dmg, a .deb or an .rpm file.
After the Chrome installation, let's open Chrome DevTools:
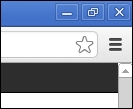
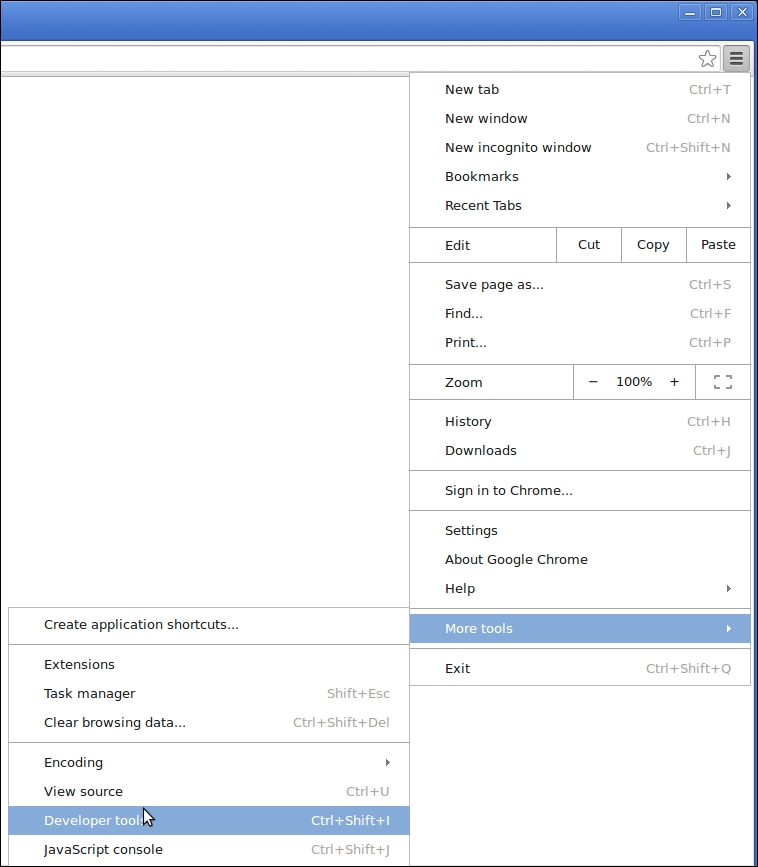
After clicking on the panel activation, the browser windows has been split to display a panel.
An alternative way to open this panel is to right-click in a web page and to click on Inspect.
You can also find the keyboards shortcut for this at https://developers.google.com/chrome-developer-tools/docs/shortcuts.
Now, let's take a look at what the tool looks like after its activation:

The top row starts with a Page Inspector icon and Toogle device mode icon, which is useful for mobiles. Then, multiple panels with textual descriptions such as Elements or Network provide specific functionality (they look and act similar to tabs, but the technical term is panels). The upper row end on the right has a Show Console icon, a Settings icon, a Detached/attached debugger icon and a close button. The position of the icons may change over time as Google Developer Tools is updated; but general functionalities should remain (more or less) the same.
The following content will cover the top row icons from left to right, excluding panels.
In this section, we will see each button in the Chrome Developer Developer Tools to review the available functions you can perform with the debugger.
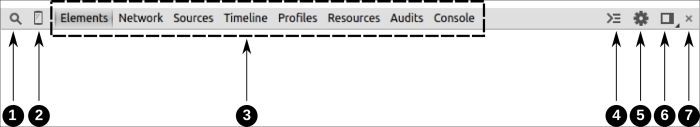
The top row set of controls is called panels; each panel provides a different type of function. The panels act like tabs (the two terms can be used interchangeably), but Chrome Developer Tools refers to them as panels in the documentation. Let's go over each panel, since they are, essentially, what makes up Chrome DevTools. We will not go over these panels from left to right, but instead we will look at the most important ones for beginners first.
The Elements panel provides not just a display of the HTML source code, but also the ability to quickly edit any HTML element and its associated style. It allows users to add, remove, and move HTML elements, edit HTML attributes, and change nearly anything about the page without having to save any files. It also can track when attributes or elements are created, changed, or removed. This helps to make web development much easier and faster.
Chrome DevTools automatically builds a tree structure from HTML code, giving the ability to expand and hide each HTML tag. It is important to note that the code you see in the HTML panel is a generated HTML code—the code in the panel may not be exactly the same as the page's source code (because the browser is interpreting the HTML to be able to show a page content).
Here is what the Elements tab looks like when Chrome DevTools is opened while viewing a web page:
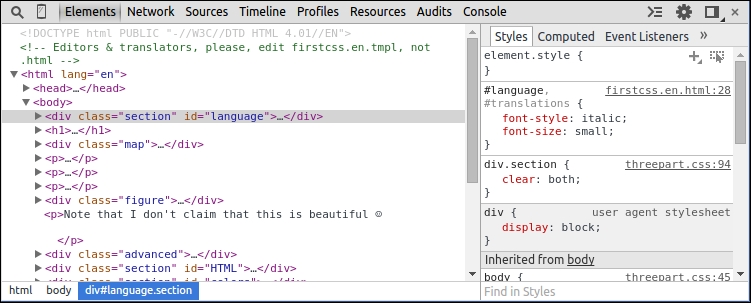
On the left-hand side, Chrome DevTools shows the HTML of the page. It's possible to right-click on any tag and do various things—such as copying the HTML to the clipboard, deleting the element, changing the tag attributes, and more.
On the right-hand side, the associated style information for the selected element is displayed. Properties can be added or modified and will instantly appear on the page, like in the preceding capture image example (at http://www.w3.org/Style/Examples/011/firstcss.en.html), with the div element with id attribute value to language
. Looking at the CSS on the right-hand side, there is a definition for the language id but only font-size and font-style properties are defined. We also see that some other styles are coming from the body element parent. The <div> tag inherits from body the color #333333 or the font-family properties.
If you are unfamiliar with HTML or CSS, the WebPlatform site is a great resource. For more information on HTML, visit http://docs.webplatform.org/wiki/html, and for CSS, visit http://docs.webplatform..
What does this mean? Well, Chrome DevTools lists all inherited style information, and parent element styles propagate down to all their child elements (each child has all its parent's styles, unless the child overrides a style, which doesn't happen in this example).
By double-clicking on pretty much anything in the HTML or CSS list, you can quickly change values and names. Any change you make will immediately show up on the page, which makes it very easy to change style in real time and see how the page is affected without having to edit and save any files.
When you're playing with CSS, you can disable a property with a left click on the left part of the CSS property. You can try this on font-size to see visual change. For CSS, when the code really inherits from a lot of properties, we advise you to go to sub-panel Computed on the right part of Elements panel. You get the summary overview for each property. Play around with it a bit—if you mess anything up, you can just reload the page in Chrome.
When editing pages with Google Chrome Developer Tools, any changes you make will disappear when you refresh the page. You are not editing the actual web server's files with Google Chrome Developer Tools—instead, you are editing a copy that is on your computer that only you can see when you make changes to it. So, if you make changes and want them to be saved, you'll have to edit your actual source code.
In fact, one way to directly edit and save content within Google Chrome Developer Tools is to rely on the Workspace ability we already have evocated when clicking in the Settings icon. Check out the official Chrome Developer browser documentation at https://developer.chrome.com/devtools/docs/workspaces.
Until now, we focused on the right part of panel elements. Let's see how to manipulate and inspect DOM elements in the left Elements window.
Reusing knowledge about OpenLayers renderers from Chapter 3, Charting the Map Class and OpenStreetMap from Chapter 4, Interacting with Raster Data Source, let's review how to manipulate the DOM and changing OpenStreetMap tiles sources on the fly.
So, let's start with the official OpenLayers example from http://openlayers.org/en/v3.0.0/examples/simple.html using Page inspector.
Open the file and at the end of the URL you get from your browser add ?renderer=dom
img tags, right-click on Edit attributes, as illustrated in the following screenshot: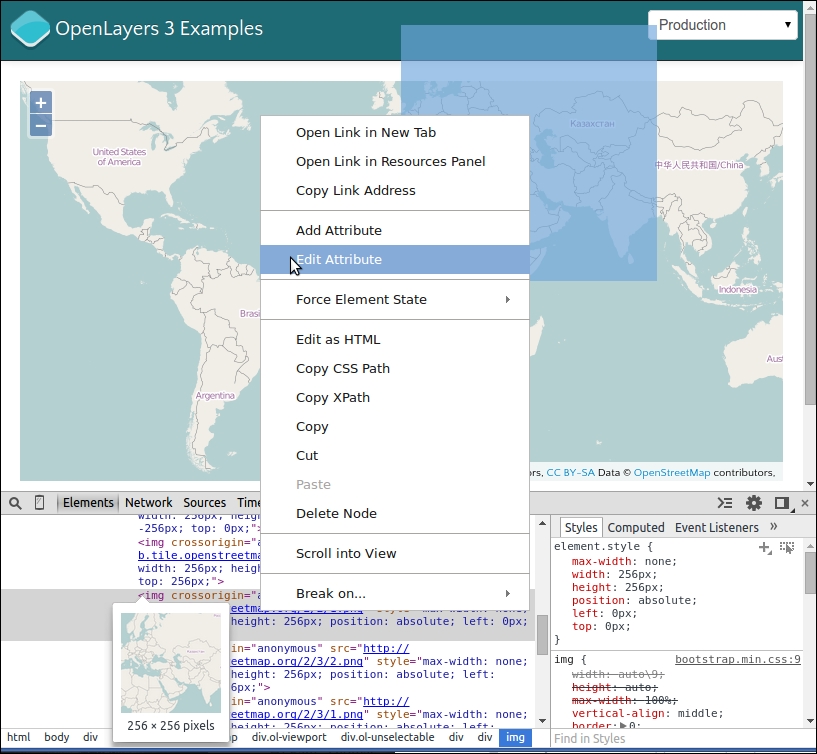
src attribute. So, replace its value with http://tile.stamen.com/toner/2/2/1.png and see the result. In the Elements panel, the img (for the image tag) src attribute contains http://b.tile.openstreetmap.org/2/2/1.png. If you remember, URL can be separated in two parts. The first part, http://b.tile.openstreetmap.org/, (called base URL), will change when the second part, 2/2/1.png, will change according to images you hover on. Here, we only change the first part.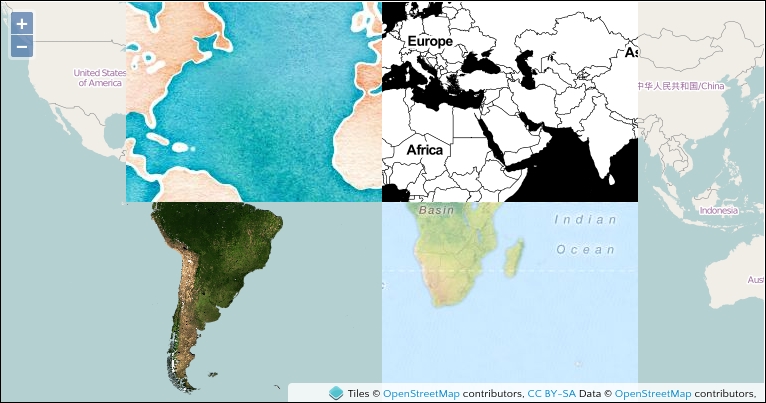
We saw how to modify attributes of HTML elements using the Page Inspector on images. You also saw the correspondence between highlight on the web page and code content in the Elements panel when hovering over. You also rediscovered some different OpenStreetMap backgrounds.
Chrome DevTools's Network panel is a tool we often use throughout this book. It basically provides a way for us to monitor a network activity by viewing all the requests and responses the web page is making. In addition to the initial page load network activity, we are also able to monitor all of the asynchronous JavaScript requests that are made by the web page. Without AJAX, we will have to refresh our entire page any time we want to do anything with our OpenLayers map. So, for example, every time you zoom in, OpenLayers makes a series of requests to the map server to get new map images, and the map server's response is a new map image that OpenLayers then displays. This request/response method is handled via AJAX; without it, we would have to refresh the entire page after every request.
See Appendix B, More details on Closure Tools and Code Optimization Techniques, where a small web history and a diagram covers AJAX.
The Network panel allows us to see the URL that is being requested, the GET or POST parameters, the server's status response, the type of resource requested, the size of the response, and the time it took to complete the request. Let's take a look at what the Network panel looks like for the example from the previous official example used when reviewing Elements panel:
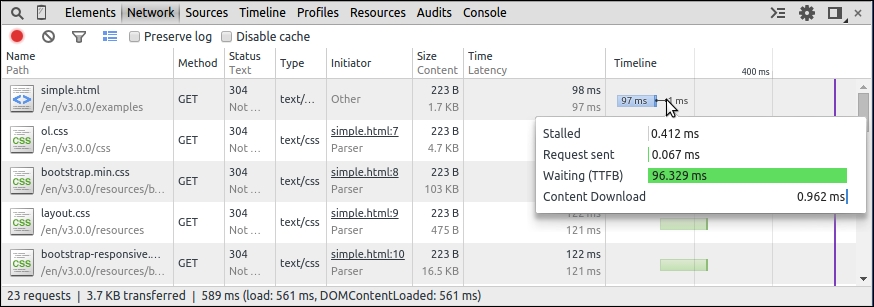
Before we talk about the requests being made, take a look at the buttons above the lists of requests—the first one is dedicated to Record Network Log and the second Clear helps you remove the list of network calls. Then, you can activate Filter, which displays a submenu to filter by resources types for example, Documents, Stylesheets, Images, but also by the type of requests such as XHR or WebSockets. The Filter icon also activates a full text search box. The fourth icon is Use small resource rows. The two checkboxes are available, Preserve Log will cause the list of requests to persist, or not get deleted, on page reloads, while Disable cache will not allow you to use cache. For better performances, some assets such as scripts or images can be kept in your browser memory to speed your browsing experience when you visit the same website again. The drawback is when you debug, you can use an outdated file.
Now, let's break down the actual request list.
The request list shows us all the requests the page makes. Each URL in the previous screenshot is a URL that OpenLayers is making a request to. By clicking on each request, we can see more information about the request, including the full request URL and the response. When we are in the Headers sub-tab, we get a Request URL, Request Method, and Status Code, and after we get all details of Request Headers and Response Headers. The Request URL tab gives all the parameters. The Response tab provides us with the server's response to our request:
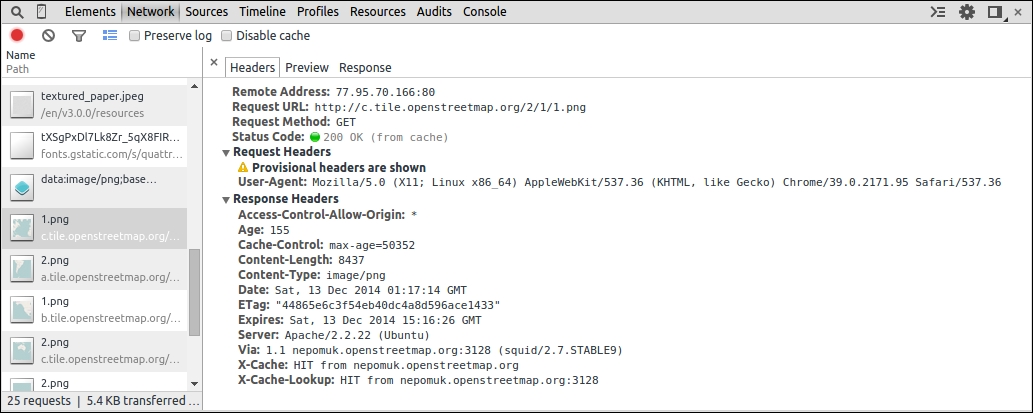
Take a look again at the list—when we look at the first image in the screenshot, the row has the name 1.png. The method, GET in this case, specifies that the request type is GET, which basically means we are embedding variables inside the URL itself, with optional key=value pairs, separated by an & sign.
When we mouse over a URL, we can see more of it; we see the full URL, which may contain a bunch of variables in the key=value&key=value&.... format. In our case, we only have a full URL like http://c.tile.openstreetmap.org/2/1/1.png when hovering.
As we saw in all OpenStreetMap examples through the book, we didn't need parameters. If you remember in Chapter 1, Getting Started with OpenLayers, we told you that OpenLayers consumes cartographic data; some can come from dynamic web mapping server, others from pregenerated data. Our example relies on pregenerated data so that there are no parameters added contrary, for instance, to a WMS data source.
The Sources panel is very powerful. It enables you to view and edit JavaScript and CSS files loaded from the web page. You are not restricted to only view all the JavaScript code associated with the page in this panel; you can use it to do real-time code debugging. You can set watch expressions, view the stack, set breakpoints, and so on. If these terms are foreign, don't worry, we will review some of them.
For example, we want to quickly talk about enabling Pause on exceptions. With this option enabled, Chrome DevTools will stop the web page whenever a JavaScript error is encountered. This makes it very easy to quickly pinpoint where your page is blowing up at. To enable it, simply click on the Pause on exceptions button icon (be careful, it's not the same as an Pause Script Execution icon).
Keep note of this when you enable it. We've been frustrated more than once when developing because we forgot that it had been enabled. When it is enabled, the button isn't gray, as demonstrated with the icon:

Another tip in this panel, is the ability to unminify JavaScript. It's really useful to track errors. You can open a web page with a compressed JavaScript file. If you click on the icon with open/close brackets called Pretty Print, you will see the difference.
You are maybe wondering why we spoke so much about this panel. When you start to make complex web mapping applications, this panel is the best way to analyze how an application works. When you're developing or reusing an already existing code, you can already guess the behavior of the code, but you can't confirm it. The key feature of the debugger is to make this confirmation. Let's see an example of how you can use it.
Breakpoints help you understand available variables and their values, one at a time in your code, and see when the code is executed. Let's see how.
As we didn't have space to cover such a large topic, we chose to let you discover the basic parts using the official tutorial. So head to it and review it at https://developers.google.com/chrome-developer-tools/docs/javascript-debugging. Now after this review, open the example for Chapter 1, Getting Started with OpenLayers, with Chrome Developer Tools opened with the Sources panel. Change the ol.js reference to ol-debug.js (more readable).
Set breakpoints in the HTML page at var osmLayer, var map, map.addLayer, and map.setView. Check the following steps:
osmLayer, map, map.getLayers(), map.getLayers().getArray() , map.getView() and map.getView().getCenter().var osmLayer.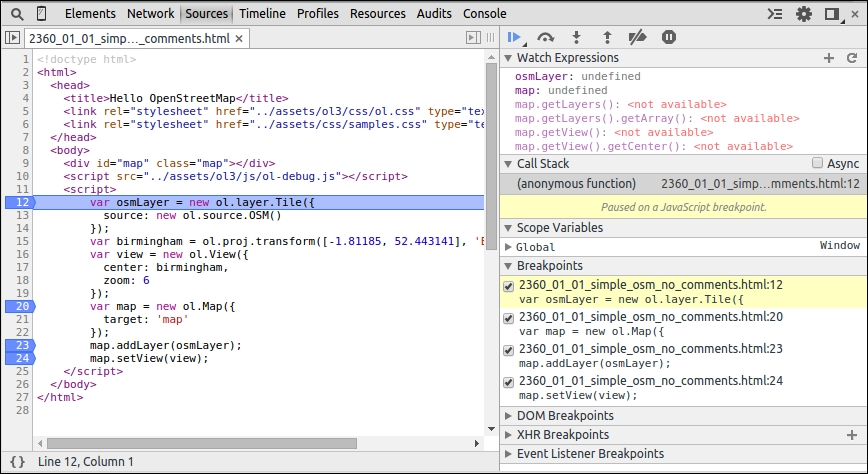
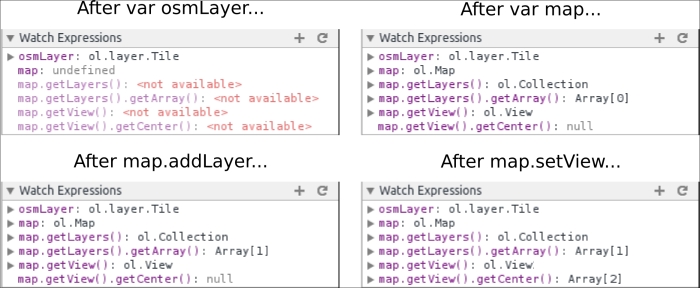
When we began by introducing the library in Chapter 1, Getting Started with OpenLayers, we described every step to create a basic map. With this example, we are able to follow the flow of your code with Chrome Developer Tools. First, all the variables we defined in the Watch Expressions were empty, as seen in the screenshot at step 3.
With the declaration of var osmLayer, the part of figure After var osmLayer... showed us an ol.layer.Tile object was created.
Then, we created a map in the After var map... part. The result is that map variable was assigned an instance of ol.Map. With this ol.Map creation, ol.Collection was created for layers, but there were no layers: map.getlayers().getArray() as a length equal to 0. Moreover, a view was also added in the map but didn't have a center in this step; map.getView() stopped to be empty and was replaced with an ol.View instance.
Then, by adding the layer in the After map.addLayer part, we saw that the map had a layer added: the previous map.getlayers().getArray() was using osmLayer: its length is 1.
At the end, the same process happened for the map view. The Map class with the map.setView method gained the view parameters, and so, map.getView().getCenter() returned an array with coordinates.
This detailed description was a good way to show that we can find how the code works by following the code execution, instead of blindly searching where things happen or only deducing by reading code. When you have enough coding experience, the solution to only follow the code without using a debugger can be better to get a full code overview, but as a beginner, it's not the best solution and you should focus only on small code parts.
We hope with this demonstration, you appreciated discovering one of the main web debuggers features.
After this JavaScript escape, let's return to the CSS topic. Remember we said that we can also edit the CSS content in the Sources panel. Contrary to the Elements panel, we have the option to edit any CSS document associated with the page, not just the style of a selected element. We don't need to not talk much about this panel. We'll give you an accelerated overview for using it in OpenLayers.
What we are customizing are the controls introduced in Chapter 9, Taking Control of Controls. It's time to try it: practicing things on your own will improve your comprehension. For this, we will reuse the OpenStreetMap example from Chapter 1, Getting Started with OpenLayers, and customize the position for zoom buttons and map copyrights.
ol.css file and use the Format button to make it more readable as this file is a .css minified file on one line..ol-zoom class in the ol.css file.left : 0.5em; parameter with right : 0.5em; to make changes to zoom buttons..ol-attribution:not(.ol-collapsed).rgba(255,255,255,0.8);, to rgba(255,0,0,.4);.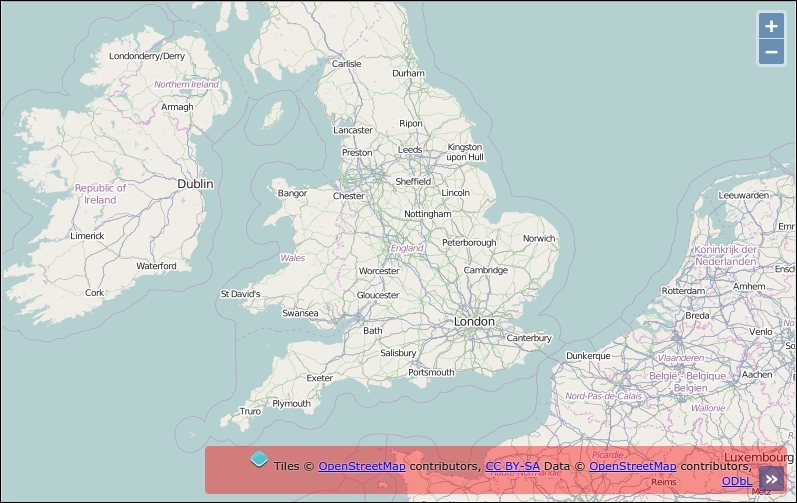
In the previous example, you played with HTML content. Here, the focus was to cover how you can change the style on the fly. We set the position of the zoom control to the top right and we also changed the background for attribution when you open the attributions collapsible block (credits to maps data and tiles) to red with an opacity change. We encourage you to perform more tests on your own to assimilate the way the panel works.
If you are a web designer working on the code or a web developer requiring to make some designs, we advise you to play a lot with this powerful panel. It can greatly speed up your development time when you master it. If you are always editing CSS in your browser, you should consider looking into the Workspace functionality we've already talked about.
The Chrome DevTools Console panel is where we'll spend most of our time. It acts as a powerful JavaScript command line, or interpreter, which means we can type in JavaScript code and execute it right away—no need to save or edit any files. We can also inspect values when we are stopped at a breakpoint in the Sources panel and want to inspect the context at this time.
Another thing that makes this panel so useful is that we can interact directly with the DOM (Document Object Model)—any HTML element on the web page, including any existing JavaScript code the page contains. So, this means we're able to interact with our OpenLayers map on the fly, issuing command and testing code to instantly see what works and what doesn't. As you can imagine, this saves a ton of time!
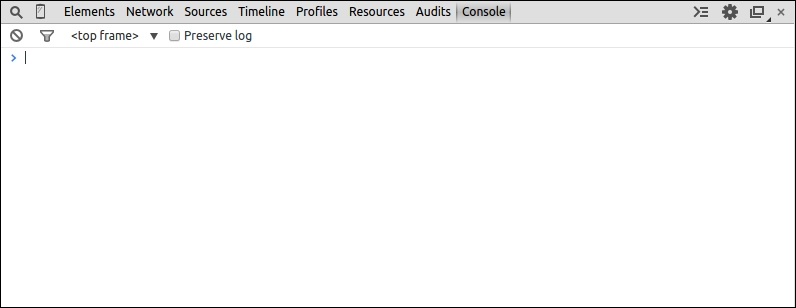
You can choose and type in the console on one line or multi-lines. To use multi-lines, type Shift + Enter to return without executing code.
When you need to discover the structure of an object, the Console panel is a very valuable tool, especially when you want to take a peek at JavaScript components. Assuming we are looking at a page that includes OpenLayers, we can quickly see all of OpenLayer's classes, functions, and so on. It is not a replacement for the API docs, but serves as a good, quick way to view such information.
It looks like the screenshot that follows:
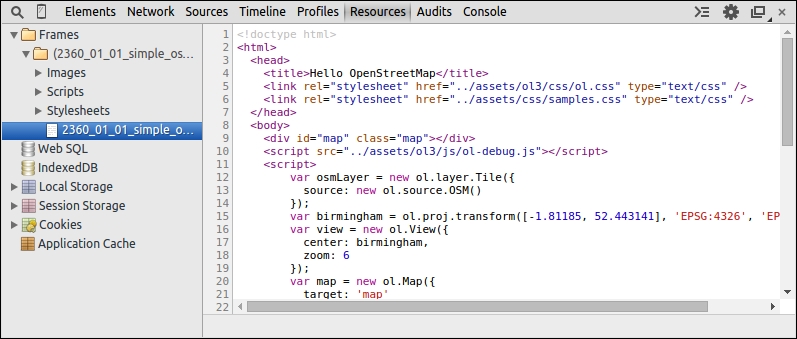
With it, you have a classification of all types of resources. You get all resources depending on frames such as the images, CSS, and HTML files. It is a good way to know what your web page loads.
You also can see all persistent storage. Persistent storage are Web SQL, IndexedDB, Local Storage, Session Storage, and Cookies. Although they might not mean much to you, they provide features, not directly related to OpenLayers, can be useful as they are HTML5 features. We invite you to discover their purpose by visiting http://html5demos.com.
With this various storage, you can keep information for customizing users' experiences. For example, you can use them to customize the language for a web application, store the zoom level for a displayed map, and so on.
To complete and end this panel description, the last thing we need to inspect is the Application Cache. It is the most useful function for our book in Chapter 10, OpenLayers Goes Mobile. It helps you inspect the data cached using the MANIFEST file.
These three panels are not really useful for beginners. They target advanced developers mainly for performances purposes:
If you want more information about these panels, visit the official documentation of Chrome DevTools at https://developers.google.com/chrome-developer-tools/.
Each panel serves a certain purpose and all of Google Chrome DevTools' panels are extremely useful, but throughout this book, we will be mainly focusing on the following panels:
These four panels are the ones that we should use the most throughout this book. We can occasionally come back to the other panels, but we don't need to spend a whole lot of time with them. However, before we conclude this chapter, let's get a bit more familiar with the Console panel, since we will need it in most of our chapters.
We talked a bit about what the console panel is—essentially, a JavaScript command line. We can execute any JavaScript code we want, and interact with any page element. There are two primary components to the Console panel—the console log area and the input area.
The console log area will display information about any errors, along with displaying any code that is entered. The input area allows us to either enter a single line of code or multiple lines of code.
Before we start using the console with our maps, let's get familiar with the console by executing some JavaScript code.
We will do some basic JavaScript coding via the Chrome DevTools console; specifically, just calling a built-in the alert() function to display an alert.
alert('Packt publishing loves open source. You want to write? See http://authors.packtpub.com');alert box pop-up with the text 'Packt publishing loves open source. You want to write? See http://authors.packtpub.com' (or whatever string you passed into the alert function). After the code is executed, it will appear in the log above the input line: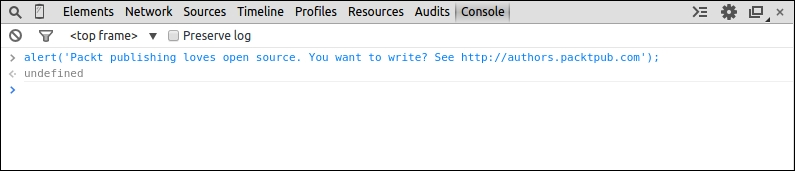
We've just executed some JavaScript code without having to edit and save any files. Although we did a simple alert, we are really not limited by what we can do. Anything that we can save in a JavaScript file, we can also enter in the Console.
You'll also notice that the same code that we typed in appeared in the log area. We'll also get an error message if any errors occur in the code—go ahead and try it! Instead of typing alert('My alert'); type something like fakealert('Boom');. This will give you a reference error, since nowhere is the fakealert()function defined —alert(); on the contrary, it is a built-in function, so we can call it from any page.
That's pretty much all there is to it! The rest just builds on these principles. Let's go ahead and do just one more thing, something that is slightly more involved, before jumping into manipulating an OpenLayers page.
We will introduce object literals and get acclimated with how to manipulate them now, so that we can better work with the OpenLayers code:
var my_parameters = {zoom: false, attribution: false, otherControl: 'myslider'};
console.log(my_parameters);{zoom: false, attribution: false; otherControl: 'mySlider'}. In this case, the object is not complex but when the object is more complex, you will see an arrow before the object, and if you click on it, it will show all the information about the object you just created.console.log(my_parameters.otherControl);
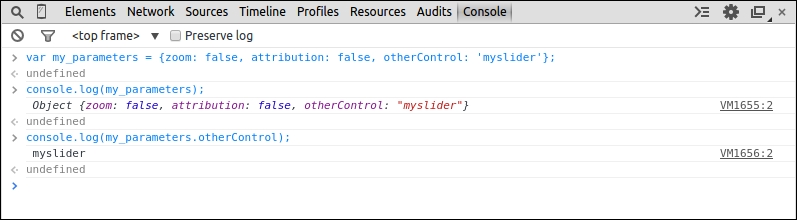
We just created what is called in JavaScript an anonymous object, or object literal. We previously discussed that objects are created from classes, in Appendix A, Object-oriented Programming – Introduction and Concepts and in JavaScript, we need to use the new keyword to instantiate an object from a function. However, here, you can see that there is no new keyword!
The key concept here is that we are just creating a single object that does not derive from a class. Since object literals (anonymous objects) do not derive from a class, it is, essentially, an empty object. It contains only what we explicitly defined. The value associated with a key can be almost anything—a string, integer, function, array, or even another object literal.
We encountered object literals in Chapter 1, Getting Started with OpenLayers —they were the {key:value} pairs used to define the parameters and options of our layer and objects. The only difference is that we did not assign a variable to them; we simply passed them in when we created our layer object.
Object literals are extremely useful for a variety of tasks, and it is a great way to package information in an easy-to-use form. They are in the form of {key:value, key2:value2}. We can access any property of an object literal by using dot notation, in the form of my_object_literal.key. The key, like before, is the key part of the key:value pair. In the preceding code, we call console.log(my_parameters.otherControl); and the value of the key opacity is displayed in the console's log area. You will also encounter an alternative notation and brackets notation, to retrieve the same information. This form is quite useful because you can concatenate values keys in your object.
Using console.log(my_parameters['other' + 'Cont' + 'rol']); will do the same as the previous console.log call. It allows to loop on objects with a key that can change whereas the dot notation does not allow this.
console.log(): The Chrome DevTools function console.log() is a function that will, essentially, display what you pass into it in the console log. You can pass in variables, strings, objects, anything, and it will display in the log. It comes in handy often, so getting familiar with it is a good idea.
We use object literals frequently when making our maps—so if they don't make much sense yet, don't worry. The basic idea to grasp, and the primary way we will use them, is that they are essentially key:value pairs. Before we end this chapter, let's do a quick example where we interact with an OpenLayers map using the Console panel.
We'll use the map we created in Chapter 1, Getting Started with OpenLayers, to do this example, interacting with our OpenLayers map by calling various functions of the map.
../assets/ol3/js/ol.js to ../assets/ol3/js/ol-debug.js and open the file in Chrome. Enable Chrome DevTools and go to the Console panel. If you like, you can take a look at the Network panel and view the network activity to see the requests your page is making.console.log(map);
Take note of the function names, as we'll be using them.
map.getView().setCenter([0, 0]); map.getView().calculateExtent(map.getSize());
map.getView().setResolution(2000); map.getView().calculateExtent(map.getSize())
console.log(map.getSize()); console.log(map.getViewport());
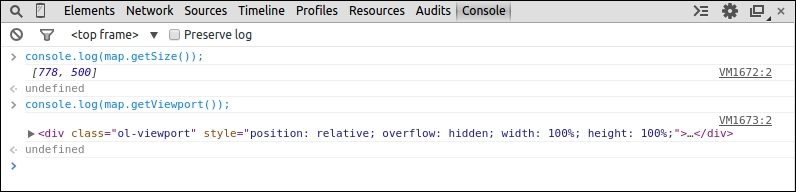
console.log(map); then clicking on the output in the log area). Try playing around with different functions and attributes the map object has. To access the functions, you just need to type in map.function();.map.key, where key would be something like keyHandler_ (so the full code would be map.keyHandler_). Be aware that values with underscore at the end are private when using the compressed ol.js file (it's a naming convention in the library code).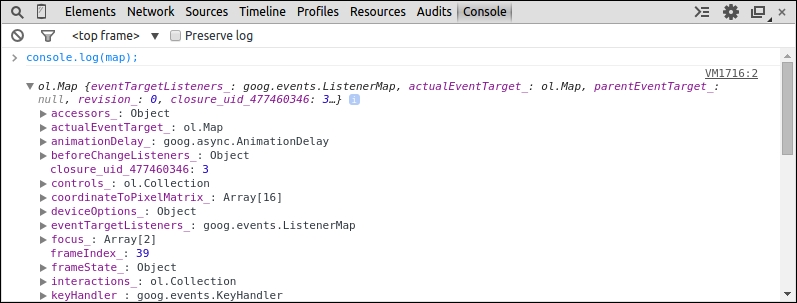
We just executed some functions of our map and accessed some properties of it. All we have to do is call our object, map, followed by a period, then a function or property it owns. Using this dot notation (for example, map.getSize();), we can access any property or function of the map object.
We also saw how the Console panel comes in handy, and took a look at functions that we can call, which the map object owns. Any function listed there can be called via map.functionname();, but some functions require parameters to be passed in or they will not work. However, where can we go to figure out more information about the functions and what they require?
Try to call different functions that you see listed in the Console tab when typing in the window. Many functions will not work unless you pass certain arguments into them, but don't be afraid of errors! Poke around the various functions and properties and try to interact with them using the Console tab like in the preceding example.
The API documentation for the Map class, which our map object derives from (and thus, inherits all the functions and properties of the class) provides more detailed explanations of the properties, functions, and what we can do with them. They can be found at http://openlayers.org/en/v3.0.0/apidoc/. Even though Chrome DevTools is a great resource to quickly interact with code and learn from it, the API docs present an extra level of information that Chrome DevTools cannot necessarily provide. Do not hesitate to visit them at http://openlayers.org/en/v3.0.0/examples/.
Chrome DevTools is evolving rapidly and many new capabilities are being added all the time. Make sure you read the official documentation at https://developer.chrome.com/devtools/index and check back periodically to see what's new.
Although it's more related to programming than web mapping, it's recommended to increase your abilities at using web debuggers.
Chrome DevTools by default offers the main functions to develop and debug with OpenLayers, but to be more efficient, it's really required to use extensions. Extensions are additions to Chrome browser or to the Developer Tools to add or augment default software functions. You can find most of them at http://www.google.com/intl/en/chrome/webstore/extensions.html.
We'll review some of them.
Usually you're consuming web services providing JSON (JavaScript Object Notation) when you're doing mashups. To illustrate why the add-on is useful, we will use a geocoder service, such as Nominatim, to retrieve position for a postal code. A geocoder is a tool to match addresses with geographic coordinates.
For example, typing http://nominatim.openstreetmap.org/search?q=35+Livery+Street+Birmingham&format=json&limit=1 in Chrome will send you the following screenshot:
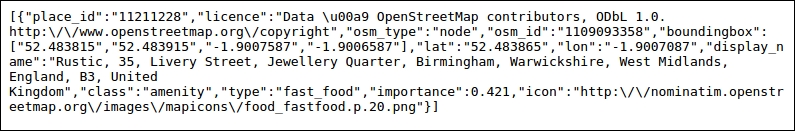
With the extension, you will directly get an indented content, collapsible.
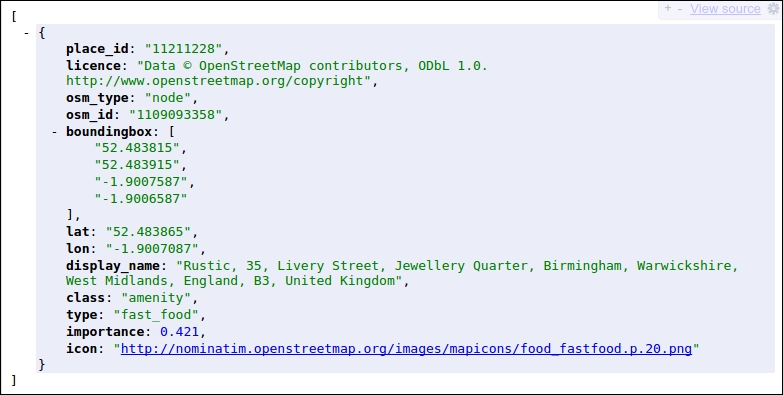
So what is the difference? When it's required to correctly reuse data, we must understand received data and with this plugin, the return content is human readable! Furthermore, OpenLayers can consume GeoJSON, a subset JSON notation dedicated to maps data.
Download it at https://chrome.google.com/webstore/detail/jsonview/chklaanhfefbnpoihckbnefhakgolnmc.
When you are making a custom UI, you always have to try different colors.
You can also retrieve a color you like from another website or an image. In this situation, you will not want to always go back and forth between a graphic tool such as Gimp or Photoshop and your browser. So in this case, you can install ColorZilla. How is this related to OpenLayers? When you want to make customize controls elements, this is an invaluable tool. Go to http://www.colorzilla.com/chrome/ to retrieve it. It's also a plugin available for Firefox.
If you really want to improve your skills for using Chrome Developer Tools, you should visit Code School tutorial at https://www.codeschool.com/courses/discover-devtools. Use also the videos available in the official documentation at https://developers.google.com/chrome-developer-tools/docs/videos.
Visit the Secrets of the Browser Developer Tools website, http://devtoolsecrets.com. It covers all browsers!
During all this chapter, we introduced you to Chrome DevTools. It's one of the most powerful tools for debugging JavaScript applications, but it is important to see the reality of the web market. Just look on this graphic below from StatCounter GlobalStats, http://gs.statcounter.com, that provide statistics from more than 3 million websites.
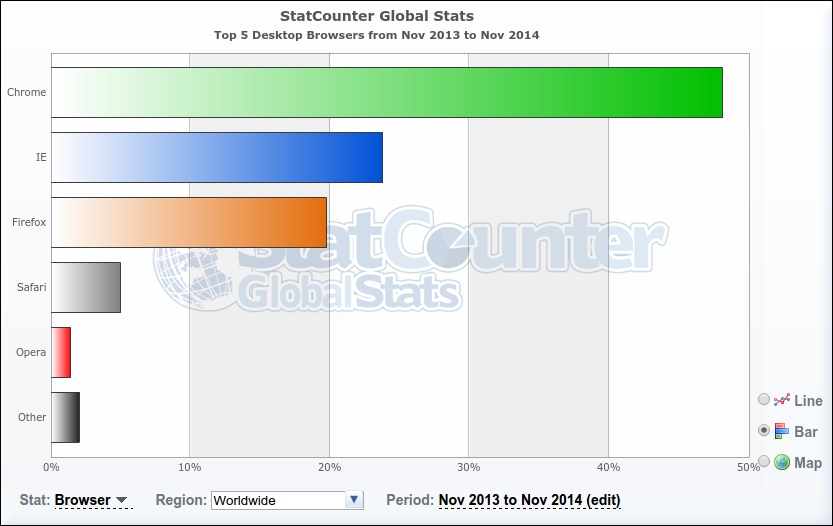
As you see, there exists more than one web browser, and Internet Explorer with Firefox together represents a bit less than 50 percent of the market. It means that your web mapping application must be compliant to those other browsers. Moreover, you have to deal with different versions for the same browser family.
Although OpenLayers itself works really well with all browsers, your own code will not always do it.
Because of this, we'll review some tools to debug in Internet Explorer and Mozilla Firefox. We will describe equivalence between Chrome DevTools panels and browsers-specific debuggers.
Before Internet Explorer 8, there wasn't any debugger built-in. The previous version of OpenLayers library (the 2.x series) was covering old IE versions such as IE 6, 7. OpenLayers 3 supports IE 9+.
Although the IE debugger is considered less powerful than other browsers debuggers, it is valuable tool in particular because of the step-by-step debug.
The following screenshot of IE 9 debugger shows that most panels are similar to Chrome Developer Tools:
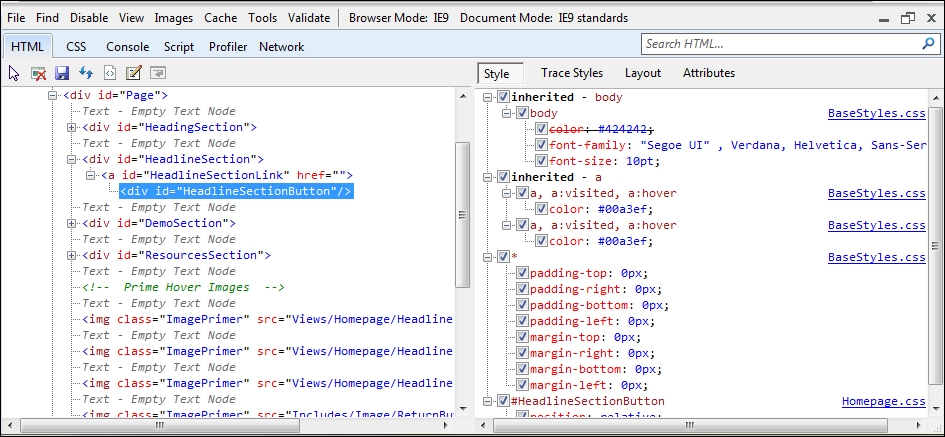
The HTML panel is like the Elements panel, and the CSS and Scripts panels do the same job that the Sources panel in Chrome DevTools does.
The Console and Network panels are quite similar to the ones in Chrome Developer Tools.
In addition, for better performance, for example, to evaluate and improve your JavaScript execution time, a profiler can be found in the Profiles panel but doesn't provide as much functions as its Chrome equivalent.
With IE, each version of the browser debugger gains panels. So, it would be better to review versions differences using the official Microsoft developer website at http://msdn.microsoft.com/en-us/library/ie/.
Like for IE, this part will be dedicated to describe equivalence between Chrome DevTools and Firebug, an extension to Firefox. Although Mozilla Firefox has a built-in debugger included nowadays, Firebug remains the best tool on Mozilla to debug web maps and sites at the time of this writing.
We advise that you install it by visiting the official site at https://getfirebug.com/.
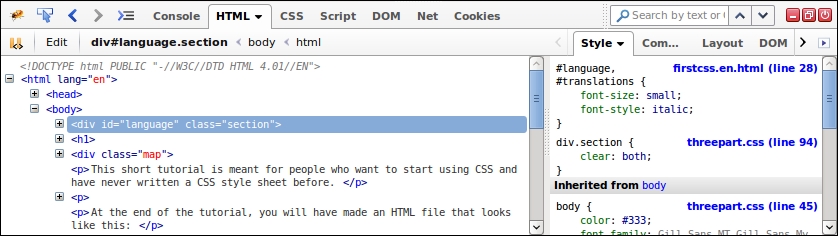
Now, it's time to make the comparison again.
In this case, the Console panel with the DOM panel in Firebug provides the same functionality that Chrome Developer Tools Console panel gives.
The HTML panel is equivalent to the Elements panel.
The CSS and Script panels combined together give you Sources panel functions.
The Timeline, Profiles, and Audits panels are specific to Chrome Developer Tools.
Most of the extensions for Firebug are listed at https://getfirebug.com/wiki/index.php/Firebug_Extensions.
Those extensions help to close the gap between default Chrome Developer and Firefox with only FireBug.
You can also find Mozilla Firefox add-on that do not always depend on FireBug. The official place to get them is https://addons.mozilla.org.
If you need one extension, you will have to install Acebug: https://addons.mozilla.org/en-us/firefox/addon/acebug/.
When you are learning and in particular doing JavaSript test directly in the browser, it behaves like an advanced text editor. Its main goal is to bring new features to Firebug's multi-lines command.
This add-on does the following:
Moreover, the Resources panel that you get with AceBug in Firebug combined with Cookies panel provides similar experience to the Resources panel in Chrome DevTools.
More and more efforts have been done on the built-in Firefox Developers Tools, it starts widening the gap with Firebug debugging functions. Sometimes, it exposes more advanced capabilities than Firebug. You can take a look at it main dedicated page at https://developer.mozilla.org/en-US/docs/Tools.
Learning process goes through repetitions. So, go back to the previous Console panel examples of the chapter and retry them in Mozilla Firefox. Take your time to see differences with Chrome Developer Tools behaviors. After those tests, go to your first OpenLayers example and type ol in the Console panel and click on it to browse like if you were in the Chrome Developer Tools Console tab. We also recommend that you play with autocompletion. Don't hesitate to experiment until you feel confident.
Q1. What panel(s) will you use if you wanted to execute JavaScript code?
Q2. You want to make some changes in CSS styles; what panel(s) can be used?
Q3. Using the sample from Chapter 1, Getting Started with OpenLayers, when you inspect the map object with console.log, what methods are available?
map.getView().map.getLayers().map.getLayer().map.getInteraction().In this appendix, we learned more about how OpenLayers works but before anything, we learned more on how to use Chrome DevTools.
We then took a look at the panels that Chrome DevTools provides and what they are used for. Afterwards, we spent time with the Console panel—something you'll be making extensive use of throughout this book (and when you're developing your own web maps). Then, we reviewed how to improve default Chrome DevTools. Finally, we covered basically main other web debuggers with cross-browsers support in mind.
This appendix aimed to provide some fundamental knowledge of web development tools for getting into both OpenLayers and general web development. Web development tools, such as Chrome DevTools, are one of the biggest assets in our toolkit. They speed up development time, help us identify bugs, interact with our code better, and much more.
Copyright © 2015 Packt Publishing
All rights reserved. No part of this book may be reproduced, stored in a retrieval system, or transmitted in any form or by any means, without the prior written permission of the publisher, except in the case of brief quotations embedded in critical articles or reviews.
Every effort has been made in the preparation of this book to ensure the accuracy of the information presented. However, the information contained in this book is sold without warranty, either express or implied. Neither the authors, nor Packt Publishing, and its dealers and distributors will be held liable for any damages caused or alleged to be caused directly or indirectly by this book.
Packt Publishing has endeavored to provide trademark information about all of the companies and products mentioned in this book by the appropriate use of capitals. However, Packt Publishing cannot guarantee the accuracy of this information.
First published: March 2011
Second published: January 2015
Production reference: 1210115
Published by Packt Publishing Ltd.
Livery Place
35 Livery Street
Birmingham B3 2PB, UK.
ISBN 978-1-78216-236-0
Authors
Thomas Gratier
Paul Spencer
Erik Hazzard
Reviewers
Jorge Arévalo
Gagan Bansal
Christopher Jennison
Arnaud Vandecasteele
Commissioning Editor
Usha Iyer
Acquisition Editors
Usha Iyer
Sam Wood
Content Development Editor
Sweny Sukumaran
Technical Editor
Parag Topre
Copy Editors
Sarang Chari
Janbal Dharmaraj
Neha Karnani
Project Coordinator
Rashi Khivansara
Proofreaders
Ting Baker
Paul Hindle
Linda Morris
Indexer
Mariammal Chettiyar
Graphics
Valentina D'silva
Disha Haria
Abhinash Sahu
Production Coordinator
Nilesh R. Mohite
Cover Work
Nilesh R. Mohite
Thomas Gratier is a GIS consultant living in Nantes, France, who mainly specializes in web development. He has an MSc degree in geography and urban planning from The Institute Of Alpine Geography of The University of Grenoble. Career-wise, he decided to steer towards more technical work but kept his geospatial passion in mind. He's gained 8 years of geospatial and programming experience, working for public authorities on water and flood risk prevention and management, various private urban consultancies in urban planning and web mapping solutions, and, multinational company CapGemini's GIS Division. He's continued building a stronger knowledge in IT technologies, open source and open data, and both web and geo standards. He does his development work with JavaScript, Pythons and PHP. His favorite libraries and tools for working are GDAL/OGR, PostGIS, QGIS, and OpenLayers, but he also enjoys using OpenStreetMap-related libraries, such as Mapnik or Osm2pgsql. He is an open source advocate, a Charter Member of The Open Source Geospatial Foundation (http://www.osgeo.org)(OSGeo). He gets involved in writing French translations for open source geospatial projects, such as MapServer and Zoo Project. With like-minded professionals, he contributes to weekly geospatial news updates at Geotribu (http://geotribu.net). He currently works as a freelance GIS consultant, providing development, consulting, and training services. More information can be found on his website at Web Geo Data Vore (http://webgeodatavore.com).
Paul Spencer is a software engineer who has worked in the field of open source geospatial software for more than 15 years. He is a strong advocate of open source development and champions its use whenever possible. Paul has architected several successful open source projects and been actively involved in many more. Paul was involved in the early design and development of OpenLayers and continues to be involved as the project evolves. Paul joined DM Solutions Group (DMSG) in 1998, bringing with him advanced software development skills and a strong understanding of the software-development process. In his time with the company, Paul has taken on a leadership role as the CTO and primary architect for DM Solutions Group's web mapping technologies and commercial solutions. Prior to joining DMSG, Paul worked for the Canadian Military, after achieving his master's degree in software engineering from The Royal Military College of Canada.
Erik Hazzard is the author of OpenLayers 2.10 Beginner's Guide, Packt Publishing. He has worked as the lead developer for a GIS-based company, has done contracting work with the design studio, Stamen, and has co-founded two start-ups. Erik is passionate about mapping, game development, and data visualization. In his free time, he enjoys writing and teaching, and can be found at http://vasir.net.
Jorge Arévalo is a computer engineer from Universidad Autónoma de Madrid, UAM. He started developing web applications with JavaScript, PHP, and Python. In 2010, he began working with PostGIS and GDAL projects, after participating in GSoC 2009, creating the PostGIS Raster GDAL driver. He also writes a blog on GIS at http://www.libregis.org. Jorge Arévalo has co-written the book, Zurb Foundation 4 Starter, Packt Publishing. He has also worked as a reviewer for the books, PostGIS 2.0 Cookbook, OpenLayers Beginner's Guide (2nd edition), Memcached, Speed Up your Web Application, and QGIS Cookbook, all by Packt Publishing.
Gagan Bansal has done B.Tech in Civil Engineering and then pursued M.Tech in Remote Sensing. He is experienced in maps application development, geospatial database design, and large-scale mapping using satellite data and aerial photographs. He is also experienced in understanding various market problems and deriving a feasible GIS solution using open source software and database. Currently, he is working with Rediff.com as a maps architect and engaged in developing applications for visualization and overlay of news, socioeconomic data, and business data on maps.
Christopher Jennison is an application developer working in Western Massachusetts with experience in GIS application development and mobile platform development. He has worked in web advertising, mobile advertising and application development, and data science and mapping applications. He has worked for HitPoint Studios, as a brand game developer, and The United States Geological Survey, as well as his own private contracts.
Arnaud Vandecasteele is a map lover and an open source / open data evangelist. After his PhD in computer science and GIS, he decided to move to Canada to conduct research on OpenStreetMap and to promote the use of Open Source GIS software. His experience with OpenLayers started from the very beginning of the library in 2006. From his website (http://geotribu.net), he wrote several tutorials to help beginners to use OpenLayers. Currently, Arnaud runs a GIS consultancy firm called Mapali (http://mapali.re/) that creates online mapping applications and provides consultancy services in the fields of web cartography and online GIS using open source software to a wide range of clients in the Indian Ocean (Réunion island, Mauritius).
For support files and downloads related to your book, please visit www.PacktPub.com.
Did you know that Packt offers eBook versions of every book published, with PDF and ePub files available? You can upgrade to the eBook version at www.PacktPub.com and as a print book customer, you are entitled to a discount on the eBook copy. Get in touch with us at <service@packtpub.com> for more details.
At www.PacktPub.com, you can also read a collection of free technical articles, sign up for a range of free newsletters and receive exclusive discounts and offers on Packt books and eBooks.
https://www2.packtpub.com/books/subscription/packtlib
Do you need instant solutions to your IT questions? PacktLib is Packt's online digital book library. Here, you can search, access, and read Packt's entire library of books.
If you have an account with Packt at www.PacktPub.com, you can use this to access PacktLib today and view 9 entirely free books. Simply use your login credentials for immediate access.
Web mapping is the process of designing, implementing, generating, and delivering maps on the Web and its products. OpenLayers is a powerful, community-driven, open source, pure JavaScript web mapping library. With this, you can easily create your own web map mashup using a myriad of map backends. Interested in knowing more about OpenLayers?
This book is going to help you learn OpenLayers from scratch. OpenLayers 3 Beginner's Guide will walk you through the OpenLayers library in the easiest and most efficient way possible. The core components of OpenLayers are covered in detail, with examples, structured so that you can easily refer back to them later.
The book starts off by showing you how to create a simple map and introduces you to some basic JavaScript programming concepts and tools. You will also find useful resources to learn more about HTML and CSS. Through the course of this book, we will review each component needed to make a map in OpenLayers 3, and you will end with a full-fledged web map application.
You will learn some context to help you understand the key role of each OpenLayers 3 component in making a map. You will also learn important mapping principles such as projections and layers. Maps require sources of data as well; so, you will see how to create your own data files and connect to backend servers for mapping. A key part of this book will also be dedicated to building a mapping application for mobile devices and its specific components.
With OpenLayers 3 Beginner's Guide, you will learn how to create your own map applications independently, without being stuck at the first stage of learning. You will acquire the information you need to develop your skills and knowledge of the OpenLayers 3 library.
Chapter 1, Getting Started with OpenLayers will introduce you to OpenLayers 3 and will help you to learn some basic mapping principles. You will see how to get ready for development in OpenLayers and create your first map.
Chapter 2, Key Concepts in OpenLayers will introduce the main components of the OpenLayers library and illustrate how they are related. We will introduce some key concepts, including events and observable properties, and learn some basic debugging techniques.
Chapter 3, Charting the Map Class will describe two of the core components, the Map and View classes, in detail. We will learn about the properties, methods, and events of both classes and apply them in practical examples.
Chapter 4, Interacting with Raster Data Source will introduce the concept of layers and focus on raster layers. We will explain the difference between tiled and untiled layers and learn how to use OpenLayers to visualize any type of image, even non-geospatial ones.
Chapter 5, Using Vector Layers will introduce vector layers and the related source, format, feature, and geometry classes. We will learn the properties, methods, and events associated with each, and how to use them to load a variety of vector data into an OpenLayers map.
Chapter 6, Styling Vector Layers will expand on our knowledge of vector layers by learning how to apply both static and dynamic styles to them. Through hands-on examples, we'll learn how to modify styles interactively in response to user interaction.
Chapter 7, Wrapping Our Heads Around Projections will cover the basic concepts behind map projections and their characteristics. We will cover projection support within OpenLayers by introducing the Proj4js library and applying it to map, vector, and raster layers.
Chapter 8, Interacting with Your Map will dive into the concept of interactions and introduce the default interactions. After covering the available interactions in detail, we will finish with an example showing how to use interactions to draw a rectangle.
Chapter 9, Taking Control of Controls will demonstrate the use of controls and introduce the default controls provided by OpenLayers. We will also review each of the controls in more detail and learn how to make a custom control.
Chapter 10, OpenLayers Goes Mobile will teach us to take advantage of mobile-specific features such as Geolocation and Device Orientation. We will also learn how to debug mobile web applications and look at some mobile-specific browser features that can be useful for geospatial applications.
Chapter 11, Creating Web Map Apps will build a complete application from scratch and learn how to use the OpenLayers build system to create a production-ready application from our code.
Appendix A, Object-oriented Programming – Introduction and Concepts covers the main concepts of Object-oriented Programming (OOP). After, we will discover how to reuse them exploring the OpenLayers API documentation with OOP in mind.
Appendix B, More details on Closure Tools and Code Optimization Techniques will cover more details on Closure Tools and code optimization techniques. This appendix introduces Closure Tools, a set of tools that OpenLayers 3 library relies on. It provides an understanding on how to use the Closure Library and Closure Compiler with a focus on compressing OpenLayers code files. We will finish with a review of styles and syntax for good coding practices.
Appendix C, Squashing Bugs with Web Debuggers provides JavaScript beginners with an in-depth review of browser developer tools. We will review Chrome Developer Tools, additional extensions and finish with debugging tools in other browsers such as IE and Firefox.
The main thing you'll need for this book is a computer and text editor. Your operating system will come with a text editor, any will do, but you will likely find that a text editor focused on developer needs will be most useful. There are many excellent developer-oriented text editors available for various operating systems, see https://github.com/showcases/text-editors and https://en.wikipedia.org/wiki/List_of_text_editors for some options. An Internet connection will be required to view the maps, and you'll also need a recent version of a modern web browser, such as Firefox, Google Chrome, Safari, Opera, or Internet Explorer (version 9 or higher).
For some advanced uses cases, you will also need Python, NodeJS, Java, and Git (a source code control management software). Installation instructions are provided for these additional tools.
No knowledge of Geographic Information Systems (GIS) is required, nor is extensive JavaScript experience. A basic understanding of JavaScript syntax and HTML/CSS will greatly aid in understanding the material, but is not required.
This book is for anyone who has an interest in using maps on their website, from hobbyists to professional web developers. OpenLayers provides a powerful, but easy-to-use, pure JavaScript and HTML (no third-party plug-ins involved) toolkit to quickly make cross-browser web maps. A basic understanding of JavaScript will be helpful, but there is no prior knowledge required to use this book. If you've never worked with maps before, this book will introduce you to some common mapping topics and gently guide you through the OpenLayers 3 library. If you're an experienced application developer, this book will also serve as a reference to the core components of OpenLayers 3.
Instructions often need some extra explanation to ensure they make sense, so they are followed with these sections:
This section explains the working of the tasks or instructions that you have just completed.
You will also find some other learning aids in the book, for example:
These are short multiple-choice questions intended to help you test your own understanding.
In this book, you will find a number of styles of text that distinguish between different kinds of information. Here are some examples of these styles, and an explanation of their meaning.
Code words in text, folder names, filenames, file extensions, pathnames, URLs, and user input are shown as follows: "You can name the folder whatever you like, but we'll refer to it as the sandbox folder."
A block of code is set as follows:
var map = new ol.Map({
target: 'map',
layers: [layer],
view: view
});When we wish to draw your attention to a particular part of a code block, the relevant lines or items are set in bold:
var map = new ol.Map({
target: 'map',
view: view,
layers: [layer],
renderer: 'dom'
});Any command-line input or output is written as follows:
weinre –boundHost <your ip address>
New terms and important words are shown in bold. Words that you see on the screen, in menus or dialog boxes for example, appear in the text like this: "You can do this in several ways but the easiest is to load your page into a web browser and look at the Network tab".
Feedback from our readers is always welcome. Let us know what you think about this book—what you liked or may have disliked. Reader feedback is important for us to develop titles that you really get the most out of.
To send us general feedback, simply send an e-mail to <feedback@packtpub.com>, and mention the book title via the subject of your message.
If there is a topic that you have expertise in and you are interested in either writing or contributing to a book, see our author guide on www.packtpub.com/authors.
Now that you are the proud owner of a Packt book, we have a number of things to help you to get the most from your purchase.
You can download the example code files for all Packt books you have purchased from your account at http://www.packtpub.com. If you purchased this book elsewhere, you can visit http://www.packtpub.com/support and register to have the files e-mailed directly to you.
We also provide you a PDF file that has color images of the screenshots/diagrams used in this book. The color images will help you better understand the changes in the output. You can download this file from: http://www.packtpub.com/sites/default/files/downloads/B02497_ColorImages.pdf
Although we have taken every care to ensure the accuracy of our content, mistakes do happen. If you find a mistake in one of our books—maybe a mistake in the text or the code—we would be grateful if you would report this to us. By doing so, you can save other readers from frustration and help us improve subsequent versions of this book. If you find any errata, please report them by visiting http://www.packtpub.com/submit-errata, selecting your book, clicking on the errata submission form link, and entering the details of your errata. Once your errata are verified, your submission will be accepted and the errata will be uploaded on our website, or added to any list of existing errata, under the Errata section of that title. Any existing errata can be viewed by selecting your title from http://www.packtpub.com/support.
Piracy of copyright material on the Internet is an ongoing problem across all media. At Packt, we take the protection of our copyright and licenses very seriously. If you come across any illegal copies of our works, in any form, on the Internet, please provide us with the location address or website name immediately so that we can pursue a remedy.
Please contact us at <copyright@packtpub.com> with a link to the suspected pirated material.
We appreciate your help in protecting our authors, and our ability to bring you valuable content.
You can contact us at <questions@packtpub.com> if you are having a problem with any aspect of the book, and we will do our best to address it.
Within the past few years, the popularity of interactive web maps has exploded. In the past, creating interactive maps was reserved for large companies or experts with lots of money. But now, with the advent of free services such as Google and Bing Maps, online mapping is easily accessible to everyone. Today, with the right tools, anyone can easily create a web map with little or even no knowledge of geography, cartography, or programming.
Web maps are expected to be fast, accurate, and easy to use. Since they are online, they are expected to be accessible from anywhere on nearly any platform. There are only a few tools that fulfill all these expectations. OpenLayers is one such tool. It's free, open source, and very powerful. Providing both novice developers and seasoned GIS professionals with a robust library, OpenLayers makes it easy to create modern, fast, and interactive web-mapping applications for desktop and mobile.
In this chapter, we will:
OpenLayers is an open source, client-side JavaScript library for making interactive web maps, viewable in nearly any web browser. Since it is a client-side library, it requires no special server-side software or settings—you can use it without even downloading anything! Originally developed by MetaCarta as a response, in part, to Google Maps, the 2.x series of the library has grown into a mature, popular framework with many passionate developers and a very helpful community. At the time of writing, this version is still actively used and maintained, but this book will focus on the latest version, which is 3.0. For people wishing to switch to OpenLayers 3, particularly people already using the OpenLayers 2 series, the main reasons to change are:
You can also add the fact that the library is already used in production, that demonstrates good performance at the Swiss federal geoportal, http://map.geo.admin.ch (see screenshot for reference ) and the OpenGeo Suite, a commercial open source based solution which already bundles the library:
OpenLayers makes creating powerful web mapping applications easy and fun. It is very simple to use—you don't even need to be a programmer to make a great map with it. It's open source, free, and has a strong community behind it. A big advantage of OpenLayers is that you can integrate it into any closed or open source application because it is released under the BSD 2-Clause license. So, if you want to dig into the internal code, or even improve it, you're encouraged to do so. Cross browser compatibility is handled for you by the Google Closure Library— but you need to have IE9+ because VML rendering (specific to IE8 and older versions) is no longer supported. Furthermore, OpenLayers 3.0 supports modern mobile, touch devices making it easy to develop for mobile technology.
OpenLayers is not tied to any proprietary technology or company, so you don't have to worry much about your application breaking with third party code (unless you break it). Although it's open source, you will get good support from the community and there are commercial support options as well. The library is recognized as well —established by the OSGeo (Open Source Geospatial Foundation), having passed through the OSGeo Incubation process, a kind of open source quality mark for geospatial projects.
You can read further about OSGeo Incubation at http://wiki.osgeo.org/wiki/Incubation_Committee
OpenLayers allows you to build entire mapping applications from the ground up, with the ability to customize every aspect of your map—layers, controls, events, and so on. You can use a multitude of different map server backends together, including a powerful vector layer. It makes creating map mashups extremely easy.
We said OpenLayers is a client-side JavaScript library, but what does this mean? The following context answers this question.
When we say client-side, we are referring to the user's computer, specifically their web browser. The only thing you need to make OpenLayers work is the OpenLayers code itself and a web browser. You can either download it and use it on your computer locally, or download nothing and simply link to the JavaScript file served on the site that hosts the OpenLayers project (http://openlayers.org). OpenLayers works on nearly all modern web browsers and can be served by any web server or your own computer. Using a modern, standard based browser such as Firefox, Google Chrome, Safari, or Opera is recommended.
When we say library, we mean that OpenLayers is a map engine that provides an API (Application Program Interface) that can be used to develop your own web maps. Instead of building a mapping application from scratch, you can use OpenLayers for the mapping part, which is maintained and developed by a bunch of brilliant people.
For example, if you'd want to write a blog, you could either write your own blog engine, or use an existing one such as WordPress or Drupal and build on top of it. Similarly, if you'd want to create a web map, you could either write your own from scratch, or use software that has been developed and tested by a group of developers with a strong community behind it.
By choosing to use OpenLayers, you do have to learn how to use the library (or else you wouldn't be reading this book), but the benefits greatly outweigh the costs. You get to use a rich, highly tested, and maintained code base, and all you have to do is learn how to use it. Hopefully, this book will help you with it.
OpenLayers is written in JavaScript, but don't fret if you don't know it very well. All you really need is some knowledge of the basic syntax, and we'll try to keep things as clear as possible in the code examples.
If you are unfamiliar with JavaScript, Mozilla provides phenomenal JavaScript documentation at https://developer.mozilla.org/en/javascript. We should also visit Eloquent JavaScript at http://eloquentjavascript.net, an online book to get started with the JavaScript language We recommend you also do some interactive exercises at Codecademy, http://codecademy.com, a website dedicated to learn JavaScript programming basics and much more.
First off, what is a web-mapping application? To put it bluntly, it's some type of Internet application that makes use of a map. This could be a site that displays the latest geo-tagged images from Flickr (we'll do this in Chapter 11, Creating Web Map Apps), a map that shows markers of locations you've traveled to, or an application that tracks invasive plant species and displays them. If it contains a map and it does something, you could argue that it is a web map application. The term can be used in a pretty broad sense.
So, where exactly does OpenLayers fit in? We know OpenLayers is a client-side mapping library, but what does that mean? Let's take a look at the following figure:
This is called the client/server model and it is, essentially, the core of how all web applications operate. In the case of a web map application, some sort of map client (for example: OpenLayers) communicates with some sort of web map server (for example: a map server using the WMS (Web Map Service) standard, an OpenStreetMap backend, or some satellite images). We've added a bit of complexity in it because the truth is that you can also rely only on client-side for web mapping applications using static content that you have pre-generated. To illustrate, you can use GeoJSON files, a JSON based format to display pins. For example, it is very useful for mobile content.
OpenLayers lives on the client-side. One of the primary tasks the client performs is to get map images from a map server. Essentially, the client asks a map server for what you want to look at. Every time you navigate or zoom around on the map, the client has to make new requests to the server—because you're asking to look at something different.
OpenLayers handles this all for you, and it is happening via AJAX (asynchronous JavaScript + XML) calls to a map server. Refer to http://en.wikipedia.org/wiki/Ajax_(programming) for further information on AJAX. To reiterate—the basic concept is that OpenLayers sends requests to a map server for map data every time you interact with the map, then OpenLayers pieces together all the returned map data (which might be images or vector data) so it looks like one big, seamless map. In Chapter 2, Key Concepts in OpenLayers, we'll cover this concept in more depth.
A map server (or map service) provides the map itself. There are a myriad of different map server backends. The examples include:
If you are unfamiliar with these terms, don't sweat it. The basic principle behind all these services is that they allow you to specify the area of the map you want to look at (by sending a request), and then the map servers send back a response containing the map image. With OpenLayers, you can choose to use as many different backends in any sort of combination as you'd like.
OpenLayers is not a web map server; it only consumes data from them. So, you will need access to some type of WMS. Don't worry about it though. Fortunately, there are a myriad of free and/or open source web map servers available that are remotely hosted or easy to set up yourself, such as MapServer. We speak a lot about web map servers but you must be aware that depending on your web-mapping application, you can use geographic data files to provide the needed data consumed by OpenLayers.
Throughout this book, we'll often use a freely available web-mapping service from http://www.openstreetmap.org/, so don't worry now about having to provide your own.
With many web map servers, you do not have to do anything to use them—just supplying a URL to them in OpenLayers is enough. OSGeo, OpenStreetMap, Google, Here Maps, and Bing Maps, for instance, provide access to their map servers (although some commercial restrictions may apply with various services in some situations).
The Google, Yahoo!, Bing, and ESRI's Mapping APIs allow you to connect with their map server backend. Their APIs also usually provide a client-side interface.
The Google Maps API, for instance, is fairly powerful. You have the ability to add markers, plot routes, and use KML data (things you can also do in OpenLayers)—but the main drawback is that your mapping application relies totally on Google. The map client and map server are provided by a third party. This is not inherently a bad thing, and for many projects, Google Maps and the others like it, are a good fit.
However, there are quite a few drawbacks such as:
Although we mentioned Google Maps API as one of the main maps, its support in OpenLayers is limited. As there are more tiles providers nowadays, it's not worth it to have code maintenance to support Google Maps API, a third party code that can break the main library, as sometimes happened earlier with the OpenLayers 2 API.
So, what's with the layers in OpenLayers? Well, OpenLayers allows you to have multiple different backend servers that your map can use. To access a web map server, you declare a layer and add it to your map with OpenLayers.
For instance, if you wanted to have a Bing Maps and an OpenStreetMap service displayed on your map, you would use OpenLayers to create a layer referencing Bing Maps and another one for OpenStreetMap, and then add them to your OpenLayers map. We'll soon see an example with an OpenStreetMap layer, so don't worry if you're a little confused.
Like layers of an onion, each layer is above and will cover up the previous one; the order that you add in the layers is important. With OpenLayers, you can arbitrarily set the overall transparency of any layer, so you are easily able to control how many layers cover each other up, and dynamically change the layer order at any time.
Most of the time, you make a distinction between base layers and non-base layers. Base layers are layers below the others and are used as a background on your maps to give general context. When you choose one base layer, the others will not be shown. On the top of base layers, you have non-base layers used to emphasize particular topics. You can also choose to use only overlay layers if you're considering that they are enough to understand the map. As a classical example, you could have a Bing map as your base layer, a layer with satellite imagery that is semi-transparent, and a vector layer, all active on your map at once. A vector layer is a powerful layer that allows for the addition of markers and various geometric objects to our maps—we'll cover it in Chapter 5, Using Vector Layers. Thus, in this example, your map would have three separate layers. We'll study in detail about layers and how to use and combine them in Chapter 4, Interacting with Raster Data Source.
The website for OpenLayers 3 is located at http://openlayers.org. Have a look at the following screenshot:
To begin, you need to download a copy of OpenLayers (or we can directly link to the library—but we'll download a local copy). You can download the compressed library as a .zip by clicking on the green button at the bottom of the release page at https://github.com/openlayers/ol3/releases/tag/v3.0.0.
We will cover the website links by following the different areas of the main web page. Let's start with the navigation bar located at the top right area:
Be aware that currently both versions of OpenLayers exist
Let's download the OpenLayers library. After you're done, you should have the OpenLayers library files set up on your computer. Perform the following steps:
v3.0.0.zip version of the OpenLayers v3.0.0. It's the green button on the bottom left of the Github release page for v3.0.0.v3.0.0 (or whatever your version is).v3.0.0 folder. Once inside, you'll see a lot of folders, but the ones we are concerned with right now are the folders named build and css, as seen in the following screenshot:ol3 folder within an assets folder contained within a new folder ol3_samples in your home directory (or C:\ on Windows). Copy the previous build folder from v3.0.0 and rename it as js into the new ol3 directory and also copy the css folder into the same ol3 folder.sandbox into the ol3_samples directory. You can name the folder whatever you like, but we'll refer to it as the sandbox folder. Your new folder structure should look similar to the following screenshot:We just installed OpenLayers 3 by copying over different pre-built, compressed JavaScript files containing the entire OpenLayers 3 library code (from the build directory) and the associated assets (style sheets). To use OpenLayers, you'll need at a minimum, the ol.js file (the other .js files will be needed during the book but are not always required) and the ol.css file. For best practice, we already gave you some tips to structure the code like separate assets, such as css and js, or separate library code from your own code.
If you open the ol.js file, you'll notice it is nearly unreadable. This is because this is a minified and obfuscated version, which basically means extra white space and unnecessary characters have been stripped out to cut down on the file size and some variables have been shortened whenever possible. While it is no longer readable, it is a bit smaller and thus requires less time to download. If you want to look at the uncompressed source code, you can view it by looking in the ol-debug.js file within the js folder of the ol3 directory.
You can, as we'll see in the last chapter of this book, build your own custom configurations of the library, including only the things you need. But for now, we'll just use the entire library. Now that we have our OpenLayers library files ready to use, let's make use of them!
The process for creating a map with OpenLayers requires, at a minimum, the following things:
ol.layer.* classol.Map class by adding a layerol.View class to set for the Map class (defining the area where the map will initially be displayed)Now, we're finally ready to create our first map!
Let's dive into OpenLayers and make a map! After you finish this section, you should have a working map, which uses a publicly available OSM server backend from the OpenStreetMap.org project. Execute the following steps:
assets directory, create a folder css, and create a new file called samples.css. Add the following code:map {
height: 500px;
width: 100%;
background-color: #b5d0d0;
}hello_openstreetmap.html and save the file in the sandbox directory. If you are using Windows, we suggest using Notepad++ in particular because you need to be sure you're editing UTF-8 encoded files. On Linux, you can use Gedit or Geany and for Mac OSX, you can use Text Wrangler (free but not open source). Do not try to edit the file in a program such as Microsoft Word, as it will not save properly. The following code will also be used as the base template code for many future examples in this book, so we'll be using it often and coming back to it a lot:<!doctype html>
<head>
<title> Hello OpenStreetMap </title>
<link rel="stylesheet" href="../assets/ol3/css/ol.css" type="text/css" />
<link rel="stylesheet" href="../assets/css/samples.css" type="text/css" />
</head>
<body>
<div id="map" class="map"></div>
<script src="../assets/ol3/js/ol.js">
</script>
<script>
var osmLayer = new ol.layer.Tile({
source: new ol.source.OSM()
});
var birmingham = ol.proj.transform([-1.81185, 52.44314], 'EPSG:4326', 'EPSG:3857');
var view = new ol.View({
center: birmingham,
zoom: 6
});
var map = new ol.Map({
target: 'map'
});
map.addLayer(osmLayer);
map.setView(view);
</script>
</body>
</html>hello_openstreetmap.html in your web browser. It can be hosted on a server or opened as a file. You should see something similar to the screenshot that follows:We just created our first map using OpenLayers! If it did not work for you for some reason, try double-checking the code and making sure all the commas and parentheses are in place. You can also open the browser debugger and look for JavaScript errors within the console. If you don't know what a console is, don't worry, we will see it soon. You can also refer to the Preface where a link to code samples used in the book is given. By default, we're given a few controls if we don't specify any. We will use the file we created as a template for many examples throughout the book, so save a copy of it so you can easily refer to it later.
The control on the left side (the navigation buttons) is called the Zoom control, which is a ol.control.Zoom object. You can click the buttons to navigate around the map, drag the map with your mouse, use the scroll wheel to zoom in, or use your keyboard's arrow keys. ol.control.Attribution is added by default. It will be populated if a layer (such as OSM) has attribution info available. This control is on the bottom right corner and gives the credits for the data you're using such as license and data producer.
We'll cover controls in greater detail in Chapter 9, Taking Control of Controls.
Now, let's take a look at the code, line by line.
<html> and <head> tag, and the extraneous code you see specifies various settings that inform your browser that this is an HTML5 compliant page. For example, we include the DOCTYPE declaration in line 1 to specify that the page conforms to standards set by the WC3. We also specify a <title> tag, which contains the title that will be displayed on the page. We also add a css stylesheet content to display correctly the zoom and attribution controls, and set the future map size to a height of 500px and a width of 100% (the width will always be at the max width depending on the browser window).This is the structure that all our code examples will follow, so this basic code template will be implicitly assumed in all examples that follow throughout the book.
<body> <div id="map" class="map"></div>
To make an OpenLayers map, we need an HTML element where the map will be displayed in. Almost always, this element will be a div. You can give it whatever ID you would like, and the ID of this HTML element is passed into the call to create the map object. You can style the <div> tag however you would like—setting the width and height to be 100 percent, for instance, if you want a full page map. We choose a class for this, also called map.
<script src="../assets/ol3/js/ol.js" type="text/javascript"></script>
This includes the OpenLayers library. The location of the file is specified by the src='../assets/ol3/js/ol.js' attribute. Here, we're using a relative path. As the hello_openstreetmap.html page is within the sandbox at the same level as the assets, we need to go outside the sandbox directory and then set the path to ol.js file . The file could either be on your computer, or another computer. Browsers can load it on any computer thanks to the relative path.
We can also use an absolute path, which means we pass in a URL where the script is located at. openlayers.org hosts the script file as well; we could use the following line of code to link to the library file directly:
<script src='http://openlayers.org/en/v3.0.0/build/ol.js></script>
Notice how the src specifies an actual URL which is an absolute path http://openlayers.org/en/v3.0.0/css/ol.css at line 5. Either way works, however, throughout the book we'll assume that you are using a relative path and have the OpenLayers library on your own computer/server. If you use the hosted OpenLayers library, you cannot be sure that it will always be available, so using a local copy is recommended.
Be aware that when browsers load a page, they load it from top to bottom. To use any DOM (Document Object Model) elements (any HTML element on your page) in JavaScript, they first have to be loaded by the browser. So, you cannot reference HTML with JavaScript before the browser sees the element. It'd be similar to trying to access a variable that hasn't yet been created. Because of this behavior, don't forget to call your JavaScript content after the <div id="map" class="map"></div>.
<script> block. We'll set up all our code inside it to create our map. Since the OpenLayers library has been included in line 13, we are able to use all the classes and functions the library contains. var osmLayer = new ol.layer.Tile({
source: new ol.source.OSM()
});In the previous three lines of code, we created a global variable called osmLayer. In JavaScript, any time we create a variable we need to place var in front of it to ensure that we don't run into scope issues (what functions can access which variables). When accessing a variable, you do not need to put var in front of it.
Since we are defining osmLayer as a variable at the global level (outside of any functions), we can access it anywhere in our code. We declare the osmLayer as an ol.layer.Tile object. It means we use an ol.layer.Tile class for creating the variable layerOsm.
The object created is also referred to as an instance of the ol.layer.Tile class. We'll talk about what this means later in the Appendix A, Object-oriented Programming – Introduction and Concepts.
Now, let's look at the right hand side of the equal sign (=): new keyword means that we are creating a new object from the class that follows it. ol.layer.Tile is the class name which we are creating an object from. Notice that something is inside the parenthesis: {source: new ol.source.OSM()}. This means we are passing one thing into the class (called an argument). Every class in OpenLayers expects different arguments to be passed into it, and some classes don't expect anything.
The ol.layer.Tile class expects one parameter following the API doc reference. Take a look at: http://openlayers.org/en/v3.0.0/apidoc/ol.layer.Tile.html. The {source: new ol.source.OSM()} is the layer options, consisting of key:value pairs (for example, {key:value} ). This is also called JavaScript Object Literal Notation, a way to create objects on the fly.
JavaScript object literal notation
In OpenLayers, we often pass in anonymous objects to classes . In JavaScript, anonymous objects are commas separated key:value pairs, and are set up in the format of {key1:value1, key2:value2}. They are, basically, objects that are created without deriving from a class. This format is also referred to as object literal notation.
When we say key1:value1, it's similar to saying key1 = value1, but we use a colon instead of an equals sign. We can also affect to a variable an object and reuse this variable instead of creating it on the line, for example:
var layer_parameters = {source: new ol.source.OSM()};
var osmLayer = new ol.layer.Tile(layer_parameters);So, the option source new ol.source.OSM() is the way to tell the characteristic of the tiles we want to retrieve such as the URL or the default attribution text, whereas ol.layer.Tile is the way to say how you ask the map image, not where it comes from.
The type of ol.source can be any from a multitude of different services, but we are using OSM here as a source. OSM (OpenStreetMap), is a crowdsourcing project focusing on creating open source map data. The main visible part of the project is the OSM world map we are using.
The arguments, like the source we can pass in for layers, are dependent on the layer class—we cover layers in detail in Chapter 3, Charting the Map Class. If you don't want to wait, you can also check out the documentation at http://openlayers.org/en/v3.0.0/apidoc/ to see what arguments different layers of classes expect.
var birmingham = ol.proj.transform([-1.81185 52.44314], 'EPSG:4326', 'EPSG:3857');
In this line of code, we take coordinates from a place, Birmingham in the UK, and we use a custom function that transforms [longitude, latitude] to the projected coordinate the map will expect in the view.
var view = new ol.View({ center: birmingham zoom: 6 });In the preceding four lines of code, we are defining a view from class ol.View. It's to use a view. Until now, we have defined what we will see, but with the view, we will define from where we are seeing it. Think of view as equivalent to a shot you might see in a cinema and where the cameraman chooses to see actors with more or less light, from far away or near, from below or above. Maps are usually 2D objects but because of new capabilities in the library, you can also have a tilted 2D view. We will not cover it because it requires advanced knowledge.
We have two options here in the JavaScript object: center and zoom.
The first one sets the center of the map with coordinates. These are not using latitude and longitude coordinates but Spherical Mercator coordinates, a common web mapping standard projection. We will explain this topic in Chapter 7, Wrapping Our Heads Around Projections.
The zoom is a way to set the level of details you get on the map when you open the web page. Change this value to understand better. The value for using the OSM layer can be between 0 and 18. The more you increase the value, the more you zoom in. If you set the value to 20, you will see that the image is always of the level 18 but the library resizes the image itself and and the image quality will be reduced.
var map = new ol.Map({ target: 'map' });We previously created a layer in order to add it to a map but this map was not already created. We have done it using the ol.Map class. The map object is the crux of our OpenLayers application— we call its functions to tell the view bound to the map to zoom to areas, fire off events, keep track of layers, and so on.
The ol.Map class expects a JavaScript object parameter. Within this object, we use one object parameter: target. You can provide another parameter renderer to choose the way the image will be displayed in the browser. It can be, DOM, Canvas, or WebGL. Don't worry about these terms, we will explain what they cover. This is not a mandatory option but we'd prefer to tell you already to be aware of this. You will learn more about this in Chapter 2, Key Concepts in OpenLayers.
The other object parameter is target. Its purpose is to set where you will attach your map in the HTML. It refers to the id of an HTML element available in your web page.
Notice, we don't include everything on one line when creating our map object—this improves readability, making it easier to see what we pass in. The only difference is that we are also adding a new line after the comma separating arguments, which doesn't affect the code (but does make it easier to read).
map.addLayer(osmLayer);
Now that we have created both the map and layer, we can add the layer to the map. In OpenLayers, every map needs to have at least one layer. The layer points to the backend, or the server side map server, as we discussed earlier.
Notice, we are calling a function of the map object. There are actually a few ways to go about adding a layer to a map object. We can use the previous code (by calling map.addLayer), where we pass in an individual layer but we can also add the layers when instantiating the ol.Map with something such as the following:
var map = new ol.Map({ target: 'map',
layers: [osmLayer]
});In this second case, you have to create your layer before the map. Most official examples use the second syntax but for learning purposes, we thought it would be better to separate map instantiation from layers addition.
map.setView(view);
This line enables you to set the view to render the image and display it at the right place you defined previously in the ol.View instance, the view variable.
</script> </body> </html>
These lines close the JavaScript block and the remaining HTML blocks.
After reviewing this first example, if the concept of object-oriented programming is unfamiliar to you, we recommend that you take some time to explore this topic. While you don't necessarily need to know OOP concepts thoroughly to use this book, understanding keywords such as class, properties, abstract class, methods, instance, constructor, or inheritance should ring a bell in your mind. If not, we advise you to visit the Appendix A, Object-oriented Programming – Introduction and Concepts.
Now, let's introduce you to the main resources for getting the most important information about OpenLayers and its ecosystem.
Our coverage of the sample code was not meant to be extremely thorough; just enough to give you an idea of how it works. We'll be covering OOP concepts in more detail throughout the remaining chapters, so if anything is a bit unclear, don't worry too much.
As OpenLayers is a library and provides functions for you, it is important to know what these functions are and what they do. There are many places to do this, but the best source is the API docs.
The API documentation is always up-to-date and contains an exhaustive description of all the classes in OpenLayers. It is usually the best and first place to go when you have a question. You can access the documentation at: http://openlayers.org/en/v3.0.0/apidoc/ for the 3.0.0 release. It contains a wealth of information. We will constantly refer to it throughout the book, so keep the link handy! Sometimes, however, the API docs may not seem clear enough, but there are plenty of other resources out there to help you. We'll cover a bit about how to find your way in API documentation in Chapter 2, Key Concepts in OpenLayers and in Appendix A, Object-oriented Programming – Introduction and Concepts.
The extension website for this book can be found at: http://openlayersbook.github.io/openlayersbook/. Current, up-to-date corrections and code fixes, along with more advanced tutorials and explanations, can be found there. You can also grab the code and more information about this book at Packt Publishing's website, located at https://www.packtpub.com/web-development/openlayers-3-beginner%E2%80%99s-guide.
The OpenLayers mailing list is an invaluable resource that lets you not only post questions, but also browse questions others have asked (and answered). There were two main OpenLayers news groups—Users and Dev for the OpenLayers 2 Version. There is a list only for OpenLayers 3 development discussions located at https://groups.google.com/forum/#!forum/ol3-dev. You may find some users' questions in the archives as it was before for both development and users questions.
Now, user questions should be only posted on http://stackoverflow.com and tagged with openlayers. OpenLayers 3 library developers will answer directly here.
When posting a question, please be as thorough as possible, stating your problem, what you have done, and the relevant source code (for example, "I have a problem with using a WMS layer. I have tried this and that, and here is what my source code looks like..."). A good guideline for asking questions in a way that will best elicit a response can be found at http://www.catb.org/~esr/faqs/smart-questions.html.
Books are great, but they're basically just a one way form of communication. If you have any questions that the book does not answer, your favorite search engine is the best place to go to. The Questions and Answers website http://gis.stackexchange.com, the young brother of StackOverflow, dedicated to GIS (Geographical Information System) can also be quite useful. But, at the end, don't forget that mailing lists and IRC are other great resources.
Sometimes, you will hit an error without understanding why you encounter it, for example related to a mobile browser's unexpected behavior. Before asking to check mailing lists or IRC, we encourage you to make a small search in the list of issues located at Github https://github.com/openlayers/ol3/issues. You can search issues by milestone, status (opened, closed, etc), or keywords.
IRC (Internet Relay Chat) is another great place to go to if you have questions about OpenLayers. IRC is used for group communication; a big chat room, essentially. If you have exhausted Google, issues' trackers, and the mailing list, IRC provides you in real time with other people interested in OpenLayers.
Generally, the people who hang out in the OpenLayers chat room are very friendly, but please try to find an answer before asking in IRC. The server is irc.freenode.net and the chat room is #openlayers. You can download an IRC client online; a good Windows one is mIRC (http://mirc.com). More information about how to use IRC can be found at http://www.mirc.com/install.html. For beginners, we recommend using Chatzilla, a Firefox Mozilla add—on http://chatzilla.hacksrus.com or CIRC, a Google Chrome add—on http://flackr.github.io/circ/.
When you've installed it, just type irc://irc.freenode.net/openlayers (for Chatzilla only) in your browser address bar, press enter, wait and you're ready to speak on OpenLayers IRC channel.
The source code repository location is hosted at GitHub. You can access the entire code repository at http://github.com/openlayers/ol3.
Feel free to download a copy and play around with it yourself. When you become an advanced user, you can submit evolutions to the official source code base and become a contributor to the library. Without going so far, it cannot hurt to download a copy of the code base and look around it yourself to figure out how it's really working!
Nowadays, some people prefer to aggregate content using RSS feeds or social networks.
Let's review how you can access alternatively to all the previous resources and more.
For the OpenLayers 3 Developers mailing list, you can use atom or RSS feed, available at https://groups.google.com/forum/#!aboutgroup/ol3-dev
When you want to get news about OpenLayers 3 development, you have to rely on Github website capabilities.
You can see:
In this chapter, we were introduced to OpenLayers and learnt a bit about it.
We saw what web map applications are and how they work. After that, we created our first map with OpenLayers, then analyzed how the code works. Then, we covered a fundamental concept, object-oriented programming, which we'll need to know about while really working with OpenLayers. Lastly, resources for help and information outside this book were provided.
Now that we have a basic handle on OpenLayers, we'll jump straight into Chapter 2, Key Concepts in OpenLayers. We will discover relationships between library core parts. Using examples, we will also review Events and Observe behaviors. It would be impossible to get an interactive map without them. Then, to finish, we will focus on basic debugging techniques. To learn more about JavaScript debugging, you can also refer to Appendix C, Squashing Bugs with Web Debuggers.
Now that we've seen the basics and made our first map with OpenLayers, let's take a step back and look at the big picture. OpenLayers is a software library based on an Object-oriented design principles, which means that it contains classes to encapsulate behavior, formal relationships between those classes, and standardized mechanisms for communication between objects. While OpenLayers contains many classes, there are just a few that form the foundation of the OpenLayers architecture. In this chapter, we will introduce these core components of the library and also two key concepts— events and observable properties—that are the basis for standardized communication between objects. Along the way, we'll use concrete examples and introduce some basic debugging techniques you can use to solve problems and explore the relationships between objects in a running application.
In this chapter, we will:
The OpenLayers library provides web developers with components useful to build web mapping applications. Following the principles of an Object-oriented design, these components are called classes. The relationship between all the classes in the OpenLayers library is part of the deliberate design, or architecture, of the library. There are two types of relationships that we, as developers using the library, need to know about: relationships between classes and inheritance between classes. We briefly talked about object-oriented programming in Chapter 1, Getting Started with OpenLayers and a more detailed discussion is included in Appendix A, Object-oriented Programming – Introduction and Concepts but for the purpose of this chapter, let's summarize the two types of relationships we are interested in:
We'll start our discussion of the key components of OpenLayers by focusing on the first of these—the relationship between classes. OpenLayers includes a lot of classes for our use, and we'll cover a lot of these in later chapters, but for now, we'll start by looking at the Map class—ol.Map.
Instances of the map class are at the center of every OpenLayers application. These objects are instances of the ol.Map class and they use instances of other classes to do their job, which is to put an interactive map onto a web page. Almost every other class in the OpenLayers is related to the Map class in some direct or indirect relationship. The following diagram illustrates the direct relationships that we are most interested in:
The preceding diagram shows the most important relationships between the Map class and other classes it uses to do its job. It tells us several important things:
view to refer to it. A view may be associated with multiple maps, however.Collection class and a layer may be associated with 0 or one Map class. The Map class has a member variable named layers that it uses to refer to this collection.Collection class and an overlay may be associated with 0 or one Map class. The Map class has a member variable named overlays that it uses to refer to this collection.ol.Collection (more on collections at the end of this chapter) and controls may be associated with 0 or one Map class. The Map class has a member variable named controls that it uses to refer to this collection.Collection class and an interaction may be associated with 0 or one Map class. The Map class has a member variable named interactions that it uses to refer to this collection.Although these are not the only relationships between the Map class and other classes, these are the ones we'll be working with the most. We've already seen some of these classes in action in the examples from the previous chapter. We'll do another example in a moment, but first let's introduce each of these new classes.
View class (ol.View) manages information about the current position of the Map class.If you are familiar with the programming concept of MVC (Model-View-Controller), be aware that the view class is not a View in the MVC sense. It does not provide the presentation layer for the map, rather it acts more like a controller (although there is not an exact parallel because OpenLayers was not designed with MVC in mind.)
Layer class (ol.layer.Base) is the base class for classes that provide data to the map to be rendered.Overlay class (ol.Overlay) is an interactive visual element like a control, but it is tied to a specific geographic position.Control class (ol.control.Control) is the base class for a group of classes that collectively provide the ability to a user to interact with the map. Controls have a visible user interface element (such as a button or a form input element) with which the user interacts.Interaction class (ol.interaction.Interaction) is the base class for a group of classes that also allow the user to interact with the map, but differ from controls in which they have no visible user interface element. For example, the DragPan interaction allows the user to click on and drag the map to pan around.Let's create a new OpenLayers application and identify the components as we go:
components.html in the sandbox directory and put in the standard HTML structure for our applications as follows:<!doctype html>
<html>
<head>
<title>OpenLayers Components</title>
<link rel="stylesheet" href="../assets/ol3/css/ol.css" type="text/css" />
<link rel="stylesheet" href="../assets/css/samples.css" type="text/css" />
</head>
<body>
<div id="map" class="map"></div>
<script src="../assets/ol3/js/ol.js"></script>
<script>
</script>
</body>
</html>layers collection:var layer = new ol.layer.Tile({
source: new ol.source.OSM()
});DragRotateAndZoom:var interaction = new ol.interaction.DragRotateAndZoom();
FullScreen:var control = new ol.control.FullScreen();
<div> tag containing our map:<div id="overlay" style="background-color: yellow; width: 20px; height: 20px; border-radius: 10px;">
var center = ol.proj.transform([-1.812, 52.443], 'EPSG:4326', 'EPSG:3857');
var overlay = new ol.Overlay({
  position: center,
  element: document.getElementById('overlay')
});var view = new ol.View({
center: center,
zoom: 6
});var map = new ol.Map({
target: 'map',
layers: [layer],
interactions: [interaction],
controls: [control],
overlays: [overlay],
view: view
});If you try to interact with the map, you'll notice something immediately—you can't click and drag to pan. Instead, if you hold down the Shift key while clicking and dragging, you'll get a whole new behavior. We've also lost the zoom in and out buttons at the top left corner, and the attribution icon in the bottom right corner, but there is a new button in the top-right corner. What does it do?
In the first step, we added our boilerplate HTML code for a simple OpenLayers application. This includes standard HTML tags suitable for any web page, and also includes the OpenLayers CSS and JavaScript files.
Next, we started creating instances of various OpenLayers components to use with our map. The first one was a layer that renders tiles from the OpenStreetMap tile servers. Next, we created an interaction called DragRotateAndZoom. This interaction has no visible element, but rather is triggered by holding down the Shift key while dragging the map. As the name suggests, this interaction will rotate and zoom the map in response to dragging the mouse cursor. Then we created a control called FullScreen. Again, the name gives away what it does—launches the web page into fullscreen mode. Because it is a control, it has a button that is clicked to activate its behavior. Next, we created an overlay, which displays an HTML element at a specific geographic location. Finally, we created the view, giving it the same center as the position we provided to the overlay.
The last step is to tie it all together with the Map class object by passing all our components as part of the constructor. We'll look at the Map class's constructor in more detail in Chapter 3, Charting the Map Class but for now, it's enough to know that we can provide arrays of layers, interactions, controls, and overlays as options, and the Map class will know what to do with them.
We saw that by providing our own set of interactions and controls; we changed the default behavior of an OpenLayers application. This is because the Map class has a default set of interactions and controls that it creates when they are not explicitly provided as options to the constructor. There are two ways we can restore the default behavior and add our new components as well.
The first way is to use helper functions provided by OpenLayers to obtain the collection of default interactions and default controls and extend those with our new components. We will do something like this (this example is not complete as the Map class is missing a view):
// create our interaction
var interaction = new ol.interaction.DragRotateAndZoom();
// get the default interactions and add our new one
var interactions = ol.interaction.defaults().extend([interaction]);
// create our control
var control = new ol.control.FullScreen();
// get the default controls and add our new one
var controls = ol.control.defaults().extend([control]);
// create the map and pass in the extended set of interactions and controls
var map = new ol.Map({
interactions: interactions,
controls: controls
});The second method is to add them to the map after calling the constructor, for instance, (again, this example is not complete):
var interaction = new ol.interaction.DragRotateAndZoom(); var control = new ol.control.FullScreen(); var map = new ol.Map(); map.addInteraction(interaction); map.addControl(control);
The advantage of the first method (passing constructor options) is that it gives you complete control over which interactions and controls are in use, while the second method (adding them after creating the map) has the advantage of being simpler if you want to add to the existing set of interactions and controls.
In many parts of OpenLayers, you will discover that there are multiple ways of accomplishing a given task. This is part of the design of the OpenLayers library and provides developers with the option to write code in a way that makes most sense for them.
We noted at the end of the previous example that the map wasn't working normally. We replaced the default controls and interactions and so the default behavior wasn't present any more. Let's take a moment to try to fix this. In many cases, mistakes or oversights in our code will produce unexpected results. Web developers have a number of tools available to help them diagnose and fix these problems. In this example, we'll work with the Developer Tools available in the Chrome browser. Similar tools exist for all major browsers; if you are not using Chrome, you should still be able to follow along using your browser's Developer Tools. With the previous example open in your browser, let's get started:
Using any of these methods, a new Developer Tools window will open. By default, the Developer Tools window will be docked to the current tab at the bottom. You can change this by detaching it to a separate window or moving it to one side, but for now, let's keep it at the bottom. It should look something like the following screenshot:
controls = ol.control.defaults();
This should output the value that was assigned to the variable controls, something like the following screenshot:
You can click the small triangle next to the line of output to expose properties of the object, like the following screenshot:
We can't even tell what kind of object this is! Let's fix that first.
ol.js to load the debug version ol-debug.js:<script src="../assets/ol3/js/ol-debug.js"></script>
The build process used to create production and debug versions of OpenLayers is covered in detail in Chapter 11, Creating Web Map Apps and Appendix B, More details on Closure Tools and Code Optimization Techniques.
Now, we can see that the controls variable is an instance of ol.Collection and we should be able to add each of the elements of the collection to the map. The line of output expanded, you can see the properties of the collection object.
The last entry is labeled __proto__ and has a triangle next to it. The __proto__ property is a special property that shows us an object's prototype, essentially the methods it gains from the class the object was created from. We can explore this property for methods available to be called on the object. Note that the __proto__ property may also have a __proto__ property revealing further methods inherited from other classes in the inheritance hierarchy.
addControl method to add one control at a time, so we need a way of doing this for each individual controls in the collection. Collections have a forEach method that invokes a function for each item in the collection, which sounds ideal! Let's give it a try by running the following code in the Console tab:controls.forEach(map.addControl);
Something is not right, we are getting an error. Let's investigate.
this.getControls(). Move the mouse over the this keyword and the debugger will show us what its value is. Now, we can see that this is the Window object and not a Map class object, which is why the getInteractions method is undefined! We need to provide the correct object, map, as the scope of the forEach function call by passing it as the second argument.controls.forEach(map.addControl, map);
Much better! Now, we have all our controls back.
We used the Developer tools console to execute some JavaScript and modify our running application to add the default zoom controls that were missing. Along the way, we ran into a problem and switched to the debug build of the OpenLayers library so that we could get more useful information about problems we ran into. We touched briefly on using the powerful Developer tools, including the Console and Sources panels.
There are a great many things we can do with the Developer tools, and this just touches briefly on one aspect of them. Please read Appendix C, Squashing Bugs with Web Debuggers to learn more about using the Developer tools in application development.
In the following sections, we'll look a little more closely at each of the components we've introduced so far, starting with the view class.
Based on the previous example, use the Console to add the default interactions to the running application. You can get the default interactions by calling the ol.interaction.defaults() method.
The OpenLayers view class, ol.View, represents a simple two-dimensional view of the world. It is responsible for determining where, and to some degree how, the user is looking at the world. We'll cover views in more detail at the end of Chapter 3, Charting the Map Class, but briefly, it is responsible for managing the following information:
Although you can create a map without a view, it won't display anything until a view is assigned to it. Every map must have a view in order to display any map data at all. However, a view may be shared between multiple instances of the Map class. This effectively synchronizes the center, resolution, and rotation of each of the maps. In this way, you can create two or more maps in different HTML containers on a web page, even showing different information, and have them look at the same world position. Changing the position of any of the maps (for instance, by dragging one) automatically updates the other maps at the same time! We'll see an example of this in the next chapter.
So, if the view is responsible for managing where the user is looking in the world, which component is responsible for determining what the user sees there? That's the job of layers and overlays.
A layer provides access to a source of geospatial data. There are two basic kinds of layers, that is, raster and vector layers:
Layers are not the only way to display spatial information on the map. The other way is to use an overlay. As we saw in the example earlier in this chapter, we can create instances of ol.Overlay and add them to the map at specific locations. The overlay then positions its content (an HTML element) on the map at the specified location. The HTML element can then be used like any other HTML element.
The most common use of overlays is to display spatially relevant information in a pop-up dialog in response to the mouse moving over, or clicking on a geographic feature.
In the previous example, we added an overlay but we didn't really investigate how it behaves. Let's do something a bit more interesting with overlays to illustrate what they do. In this example, we'll build an OpenLayers application that displays the latitude and longitude of the mouse position in an overlay when you click on the map:
overlay.html in the sandbox directory. Add the standard boilerplate content to get started:<!doctype html>
<html>
<head>
<title>OpenLayers Overlays</title>
<link rel="stylesheet" href="../assets/ol3/css/ol.css" type="text/css" />
<link rel="stylesheet" href="../assets/css/samples.css" type="text/css" />
</head>
<body>
<div id="map" class="map"></div>
<script src="../assets/ol3/js/ol.js"></script>
<script>
</script>
</body>
</html>var layer = new ol.layer.Tile({
source: new ol.source.OSM()
});
var center = ol.proj.transform([-1.812, 52.443], 'EPSG:4326', 'EPSG:3857');
var view = new ol.View({
  center: center,
  zoom: 6
});
var map = new ol.Map({
target: 'map',
layers: [layer],
view: view
});<div> element. You can change the style of the element if you wish:<div id="overlay" style="background-color: white; border-radius: 10px; border: 1px solid black; padding: 5px 10px;">
Map class:var overlay = new ol.Overlay({
element: document.getElementById('overlay'),
positioning: 'bottom-center'
});map.on('click', function(event) {
var coord = event.coordinate;
var degrees = ol.proj.transform(coord, 'EPSG:3857', 'EPSG:4326')
var hdms = ol.coordinate.toStringHDMS(degrees);
var element = overlay.getElement();
element.innerHTML = hdms;
overlay.setPosition(coord);
map.addOverlay(overlay);
});In this example, we illustrated how an overlay is positioned at a geographic location on the map, how it moves with the map to stay at that same location, and how it can be used to display information about some location.
After setting up the boilerplate HTML structure for the page, we added a raster layer with the OpenStreetMap data, a view, and a map to the application. We then created an overlay object pointing at an HTML element for content and with the positioning set to 'bottom-center', which tells OpenLayers to align the bottom, center of the HTML element with the geographic position of the overlay. This means that the overlay will appear above the location, centered on it.
The last step was to register an event handler (more on events later in this chapter) for the map's click event. When the user clicks on the map, the event handler function is called with an event object that contains coordinate (the geographic position) of the click on the map. We transform the coordinate from the map's projection into decimal degrees (longitude and latitude values) and use a helper function in the OpenLayers library to format this into degrees minutes and seconds (a standard way of representing geographic location in human readable form). We then update the content of our overlay's HTML element with this information, set the position of the overlay to the coordinate provided with the event, and add it to the map using the addOverlay method.
If some of this seems overwhelming, don't worry, we'll be covering all of this in later chapters.
As mentioned earlier, the two components that allow users to interact with the map are interactions and controls. Let's look at them in a bit more detail.
Interactions are components that allow the user to interact with the map via some direct input, usually by using the mouse (or a finger with a touch screen). Interactions have no visible user interface. The default set of interactions are:
ol.interaction.DoubleClickZoom: If you double-click the left mouse button, the map will zoom in by a factor of 2ol.interaction.DragPan: If you drag the map, it will pan as you move the mouseol.interaction.PinchRotate: On touch-enabled devices, placing two fingers on the device and rotating them in a circular motion will rotate the mapol.interaction.PinchZoom: On touch-enabled devices, placing two fingers on the device and pinching them together or spreading them apart will zoom the map out and in respectivelyol.interaction.KeyboardPan: You can use the arrow keys to pan the map in the direction of the arrowsol.interaction.KeyboardZoom: You can use the + and – keys to zoom in and outol.interaction.MouseWheelZoom: You can use the scroll wheel on a mouse to zoom the map in and outol.interaction.DragZoom: If you hold the Shift key while dragging on map, a rectangular region will be drawn and when you release the mouse button, you will zoom into that area.We will discuss interactions in detail in Chapter 8, Interacting with Your Map.
Controls are components that allow the user to modify the map state via some visible user interface element, such as a button. In the examples we've seen so far, we've seen zoom buttons in the top-left corner of the map and an attribution control in the bottom-right corner of the map. In fact, the default controls are:
ol.control.Zoom: This displays the zoom buttons in the top-left corner.ol.control.Rotate: This is a button to reset rotation to 0; by default, this is only displayed when the map's rotation is not 0.ol.control.Attribution: This displays attribution text for the layers currently visible in the map. By default, the attributions are collapsed to a single icon in the bottom-right corner and clicking the icon will show the attributions.We will discuss these controls and more in detail in Chapter 9, Taking Control of Controls.
This concludes our brief overview of the central components of an OpenLayers application. We saw that the Map class is at the center of everything and there are some key components—the view, layers, overlays, interactions, and controls—that it uses to accomplish its job of putting an interactive map onto a web page. At the beginning of this chapter, we talked about both relationships and inheritance. So far, we've only covered the relationships. In the next section, we'll show the inheritance architecture of the key components and introduce three classes that have been working behind the scenes to make everything work.
In this section, we will look at three classes in the OpenLayers library that we won't often work directly with, but which provide an enormous amount of functionality to most of the other classes in the library. The first two classes, Observable and Object, are at the base of the inheritance tree for OpenLayers—the so-called super classes that most classes inherit from. The third class, Collection, isn't actually a super class but is used as the basis for many relationships between classes in OpenLayers—we've already seen that the Map class relationships with layers, overlays, interactions, and controls are managed by instances of the Collection class.
Before we jump into the details, take a look at the inheritance diagram for the components we've already discussed:
As you can see, the Observable class, ol.Observable, is the base class for every component of OpenLayers that we've seen so far. In fact, there are very few classes in the OpenLayers library that do not inherit from the Observable class or one of its subclasses. Similarly, the Object class, ol.Object, is the base class for many classes in the library and itself is a subclass of Observable. Because the functionality contained in these two classes is so fundamental to the understanding of how OpenLayers works, we'll be relying on them for the rest of the book.
The Observable and Object classes aren't very glamorous. You can't see them in action and they don't do anything very exciting from a user's perspective. What they do though is provide two common sets of behaviour that you can expect to be able to use on almost every object you create or access through the OpenLayers library—Event management and Key-Value Observing (KVO).
An event is basically what it sounds like—something happening. Events are a fundamental part of how various components of OpenLayers—the map, layers, controls, and pretty much everything else—communicate with each other. It is often important to know when something has happened and to react to it. One type of event that is very useful is a user-generated event, such as a mouse click or touches on a mobile device's screen. We used this earlier in the chapter to display an overlay at the location of a mouse click. Knowing when the user has clicked and dragged on the Map class allows some code to react to this and move the map to simulate panning it. Other types of events are internal, such as the map being moved or data finishing loading. To continue the previous example, once the map has moved to simulate panning, another event is issued by OpenLayers to say that the map has finished moving so that other parts of OpenLayers can react by updating the user interface with the center coordinates or by loading more data.
Classes inheriting from ol.Observable (including ol.Object) get the following event related methods:
It is very important to pass the exact same listener and scope values to un() as were passed to on(). A common practice is to pass anonymous functions as arguments to functions such as on(), which takes function arguments. Because un() needs the exact same listener argument to work correctly, we can't use anonymous functions if we want to call un() later. However, we can store the key returned by on() and use it with unByKey(). Let's look at some code examples:
var map = new ol.Map({
target: 'map',
view: view
});This creates a Map class object, nothing new here.
map.on( 'moveend', function() {
console.log('move end event!');
});Next, we will register for the moveend
event. The moveend event is triggered by the map after it has been panned or zoomed. The function we provide will be called every time the map moves. Our code will output some text to the debug console. Because we used an inline or anonymous function, we have no way to remove our function if we no longer want to receive events. Or do we?
var key = map.on('moveend', function() {
console.log('move end event!');
});
map.unByKey(key);This code registers for the same moveend event using an anonymous function but this time we will assign the return value to key. We can then use the value assigned to key to unregister our handler.
Let's look at another way:
function onMoveEnd(event) {
console.log('moveend event 2');
}
map.on('moveend', onMoveEnd);
map.un('moveend', onMoveEnd);This block declares a function called onMoveEnd() and registers it for the moveend event. The last line unregisters it. This achieves exactly the same result as the previous code; so, what's the difference? It is mostly to accommodate different coding styles and patterns. Some people prefer to write their code a certain way, or perhaps they have to follow a particular coding style guide (see Appendix B, More details on Closure Tools and Code Optimization Techniques for more information on this), and OpenLayers provides various ways to make it easier.
What about the scope parameter? This is useful for code that is written in an Object oriented style. Here is a contrived example that illustrates how it will be used:
var MyClass = function(label) {
this.label = label;
this.onMoveEnd = function() {
console.log( this.label + ': moveend event');
}
}
var obj1 = new MyClass('Object 1');
var obj2 = new MyClass('Object 2');A simple class called MyClass is defined, which contains a single attribute, label, and a single method, onMoveEnd(). Next, two instances of this class are created with different label values. We can use the onMoveEnd() method of our instances as a function in the second parameter of the on() method. When the onMoveEnd() method is called, it will log a message to the debug console containing the value of the label attribute. Here are some examples of how this can be used:
map.on('moveend', obj1.onMoveEnd);Registering the onMoveEnd() method for the moveend event will work, but the output will be as follows:
Undefined: zoomend event
What's wrong? It turns out that this.label is not defined because the value of this is the global window object. We can correct this by passing a scope object as the third parameter to the on() function:
map.on('moveend', obj1.onMoveEnd, obj1);
map.on('moveend', obj2.onMoveEnd, obj2);Now, the output will be what we expected:
Object 1: moveend event Object 2: moveend event
We then need to use the scope to unregister for the events as follows:
map.un('moveend', obj1.onMoveEnd, obj1);
map.un('moveend', obj2.onMoveEnd, obj2);OpenLayers' Object class inherits from Observable and implements a software pattern called Key-Value Observing (KVO). With KVO, an object representing some data maintains a list of other objects that wish to observe it. When the data value changes, the observers are notified automatically.
The following methods are available in all OpenLayers classes, which inherit from ol.Object. Note that the Object class also contains all the methods provided by the Observable class even though they are not listed here:
The bindTo method is extremely powerful and makes many seemingly advanced tasks quite easy to accomplish. Let's set up an HTML checkbox element that we can use to control the visibility of a map layer.
<div id="map"> and the <script> tag:<input type="checkbox" id="visible" checked> Toggle Layer Visibility
This will add a new HTML element, a checkbox, to our web page and we will use this to turn our layer on and off.
var visible = new ol.dom.Input(document.getElementById('visible'));
visible.bindTo('checked', layer, 'visible');This code creates a new instance of ol.dom.Input, an OpenLayers helper class that connects to our checkbox element. It then uses the bindTo() method to observe changes in the checked attribute and send them to the layer, specifically to the visible property.
You successfully used the bindTo() method to establish the layer as an observer of the checkbox using the ol.dom.Input helper class. We bound the visible property of our layer to the checked property of the ol.dom.Input. When the checkbox is clicked, ol.dom.Input updates the checked property and notifies observers of the checked property that it has changed. Because we bound the visible property of the layer to the checked property of the input, the layer is notified of the change and updates the visible property, which causes the layer to turn on and off.
Property binding works both ways. You can manually change the visibility of the layer using the Console in Web Inspector. Try the following and observe what happens to the checkbox:
layer.setVisible(false); layer.setVisible(true);
You should see the checkbox change state as if you had clicked it.
Sometimes, the property value that you are sharing between two objects is not exactly what you need. For instance, you might want to synchronize two maps so that they are looking at the same center point, but at different resolutions. If we share a view between the maps, we can't have one of them at a different resolution. We could use two views and use events to manually synchronize them—and this is a perfectly valid approach—but wouldn't it be nice if we could use bindTo and just modify the resolution value a little bit? This is exactly what the object returned from bindTo allows us to do. The return value from bindTo is an object with a single function, transform, that you can invoke with two functions as arguments. The first function is used to transform the value going from the source to the target and the second is used to transform the value going to the source from the target. For instance:
var transformer = view1.bindTo(resolution', view2);
var from = function(value) {
return value * 2;
};
var to = function(value) {
return value / 2;
};
transformer.transform(from, to);This example binds the resolution property of view2 (the target) to the resolution property of view1 (the source). We can capture the return value in the variable transformer, create two functions that will transform the resolution value, and call the transformer variable's transform function with our two functions. The result is that view2 parameter's resolution property will be bound to view1 parameter's property but will always have a value twice that of view1.
Most classes in the OpenLayers library have one or more KVO properties (these are specified in the library documentation) and have some special features. As we saw, the name of the property can be used as the key parameter in any of the KVO methods described earlier. Additionally, three events are triggered when the value of a property changes.
The first event is beforepropertychange and is triggered before a property will change. It provides the name of the property that will change to the listener:
layer.on('beforepropertychange', function(event) {
console.log('layer changed in some way');
// event.type == 'beforepropertychange'
// event.key == '<the key that is changing>'
});The second event is propertychange is triggered as (effectively after) the property is changed:
layer.on('propertychange', function(event) {
console.log('layer changed in some way');
// event.type == 'propertychange'
// event.key == '<the key that has changed>'
});A third event is a change event specific to the property that changed. The name of the event is derived from the property name with the prefix change:. This means that we can be notified of changes to individual properties. In our previous example of binding a layer's visibility to a checkbox, we can register to be notified of the change like this:
layer.on('change:visible', function(event) {
console.log('layer visibility changed');
// event.type == 'change:visible'
// event.target == layer
});It may seem like there are a lot of events that happen in response to a KVO property changing and you are right, there are! Each event, though, is slightly different and provides both convenient and optimal ways of responding to changes that happen to objects in OpenLayers.
In addition to events, KVO properties also have special accessor functions called setters and getters defined for them. This means that instead of using the KVO methods get(key) and set(key, value), you can use get<Property>() and set<Property>(value), where <Property> is the capitalized property name. For instance:
layer.get('visible');
layer.getVisible();
layer.set('visible', true);
layer.setVisible(true);These methods are primarily for convenience and you can use either depending on your own preferences.
The last section for this chapter is about the OpenLayers' Collection class, ol.Collection. As mentioned, the Collection class is not a super class like Observable and Object, but it is an integral part of the relationship model. Many classes in OpenLayers make use of the Collection class to manage one-to-many relationships.
At its core, the Collection class is a JavaScript array with additional convenience methods. It also inherits directly from the Object class and inherits the functionality of both Observable and Object. This makes the Collection class extremely powerful and we will use it many times in the rest of this book.
A collection is created just like any other class, just use the new operator:
var collection = new ol.Collection();
The Collection constructor takes one optional argument, an array that is used to initially populate the collection with elements. The elements in the array can be of any type, but if you are using the collection with one of the OpenLayers API methods, the type of the values will typically be specified in the API documentation. For instance, the Map class constructor allows passing a collection of layers, interactions, controls, and overlays. In these cases, the contents of the collection must be instances of the correct type of an object. For instance, check the following code snippet:
var layer1 = new ol.layer.Tile({/*options */);
var layer2 = new ol.layer.Vector({/* options */});
var layerCollection = new ol.Collection([layer1, layer2]);
var map = new ol.Map({
layers: layerCollection
});A Collection class, inherited from the Object class, has one observable property, length. When a collection changes (elements are added or removed), its length property is updated. This means it also emits an event, change:length, when the length property is changed.
A Collection class also inherits the functionality of the Observable class (via Object class) and emits two other events—add and remove. Registered event handler functions of both events will receive a single argument, a CollectionEvent, that has an element property with the element that was added or removed.
The Collection class has the following methods (the ones from Object and Observable classes are not included in this list, but those methods are also available):
This wraps up our overview of the key concepts in the OpenLayers library. We took a quick look at the key components of the library from two different aspects—relationships and inheritance. With the Map class as the central object of any OpenLayers application, we looked at its main relationships to other classes including views, layers, overlays, interactions, and controls. We briefly introduced each of these classes to give an overview of primary purpose. We then investigated inheritance related to these objects and reviewed the super classes that provide functionality to most classes in the OpenLayers library—the Observable and Object classes. The Observable class provides a basic event mechanism and the Object class adds observable properties with a powerful binding feature. Lastly, we looked at the Collection class. Although this isn't part of the inheritance structure, it is crucial to know how one-to-many relationships work throughout the library (including the Map class relationships with layers, overlays, interactions, and controls).
In the next chapter, we'll dig into the Map and View class in much more detail.
The Map class is, as you have probably realized by now, the core piece behind your map. The map object(s) you create is the most important thing behind your map, as without a map object you can't do anything with layers or controls. In this chapter, we'll talk about the Map class, which we've been taking for granted so far.
We will also introduce the concept of a view, which is used to change what we see in a map, and several core concepts you'll need to understand the rest of this book.
We used the Map and View classes so far in this book, without really understanding what's going on. This chapter aims to not only explain how and why we've been doing things, but will also provide thorough coverage of two core classes—the Map and View classes. Specifically, we'll look at:
Map class isMap class relates to the other classes we've discussedMap classView class to change the location displayed by the mapThe OpenLayers' Map class is the core component of OpenLayers. We use it to manage the layers, controls, interactions, and overlays. We've worked with it already by creating a map object, adding layers to it, then using its view to modify its extent. We are yet to discuss the functionality behind the Map class, the core component of our applications.
In OpenLayers, everything belongs to the Map class. The Layer, Control, and Interaction classes must be hooked up to a map if we want them to do anything. So, we need a map object to actually create a useful map—and as you might imagine, we'll see later in this chapter that it is possible to make an application that uses multiple map objects.
Let's walk through creating a simple map from the beginning. Create a new file in your text editor to get started. To make it easy, save this file in the sandbox
folder. Remember that all the samples are set up to use the version of OpenLayers we've provided in the assets folder:
<!doctype html>
<html>
<head>
<title> Map Examples </title>
<link rel="stylesheet" href="../assets/ol3/ol.css" type="text/css" />
<link rel="stylesheet" href="../assets/css/samples.css" type="text/css" />
</head>
<body>
<div id="map" class="map"></div>
<script src="../assets/ol3/ol.js">
</script>We are just setting up a standard HTML 5 web page and including our stylesheets and the OpenLayers library.
<script> block with the following code: <script>
var layer = new ol.layer.Tile({
source: new ol.source.OSM()
});
var london = ol.proj.transform([-0.12755, 51.507222],
'EPSG:4326', 'EPSG:3857');
var view = new ol.View({
center: london,
zoom: 6,
});
var map = new ol.Map({
target: 'map',
layers: [layer],
view: view
});
</script>This code should look familiar to the ones used in the previous chapters, and you'll be seeing it (with minor variations) quite a bit through the rest of this book. We create a layer that will show OSM tiles, use london as our starting point for the view and create an instance of ol.Map in our map div.
</body> </html>
map.html and open it in your web browser, you should see a familiar sight, as shown here:Let's look a little closer at how we create our map object in this block of code:
var map = new ol.Map({
target: 'map',
layers: [layer],
view: view
});We use the new operator to create an instance of the ol.Map class and pass it an object literal containing several options, namely, target, view, and layers. We've used these before in the previous examples without really explaining them or any of the other options we might want to use. Here's the full list of available options and what they do:
|
Name |
Type |
Description |
|---|---|---|
|
|
|
Controls are covered in detail in Chapter 7, Wrapping Our Heads Around Projections; so, we don't need to go in-depth here. We can define our map's controls when we create the map object by specifying them with this option, or we can add them via the |
|
|
|
The
|
|
|
|
Interactions are used by the map to handle browser events, such as the user clicking or dragging on the map. The map passes browser events to each of its interactions in sequence, allowing each to determine whether it should take action and whether it should consume (stop further processing of) the event. The order of interactions is important—if an interaction consumes a browser event, subsequent interactions will not see the event. Interactions are closely related to controls and are discussed in more detail in Chapter 8, Interacting with Your Map with controls. The default interactions, if this option is not provided, are |
|
|
|
This option indicates which HTML element will be used to receive keyboard events for interactions that use them (such as |
|
|
|
The |
|
|
|
This controls the display of the ol3 logo in the map, |
|
|
|
The overlays option defines which overlays will be added to the map initially. We will review them thoroughly in Chapter 8, Interacting with Your Map. |
|
|
|
The number of physical pixels per screen pixel, normally computed automatically. |
|
|
|
The
We'll discuss what these actually mean a little further on in this chapter. |
|
|
|
The target identifies the HTML element in which the map will be drawn on the web page. In all our examples, we pass a string value that matches the |
|
|
|
The |
By default, OpenLayers draws, or renders, the map in the browser using an HTML 5 canvas element and its associated 2D drawing context. This is known as the Canvas renderer. However, OpenLayers actually comes with three renderers. The ability to choose a different renderer for the map can be very powerful but it should also be used with care. Each renderer has some specific capabilities and limitations. In particular, only the Canvas renderer is considered stable at the time of writing this book.
The Canvas renderer draws the map's contents onto an HTML 5 canvas element (http://en.wikipedia.org/wiki/Canvas_element). The canvas element is a high-performance 2D drawing surface supported by all modern web browsers (on Internet Explorer, Canvas support starts with version 9). The canvas renderer is the most fully supported renderer in OpenLayers. It does not support some of the advanced features of the WebGL renderer, including 3D, controlling the contrast, brightness, hue and saturation of a layer, and other advanced capabilities requiring the power of WebGL.
You will most likely want to use this renderer until WebGL is more broadly supported, unless you are building an application that can target browsers that specifically support WebGL.
WebGL (http://en.wikipedia.org/wiki/WebGL) is a powerful technology that gives the web browser access to hardware-accelerated 2D and 3D graphics rendering, normally available only to desktop software, typically games. With this renderer, OpenLayers will be able to efficiently render a lot of vector and raster data simultaneously. At the time of this writing, rendering of vector data with WebGL was still in development and not yet available.
It even provides the ability to render data in 3D and give full 3D navigation. Given how fantastic all this sounds, why wouldn't you use it all the time? Unfortunately, WebGL support in a browser is dependent on two things. First, the user's computer must have a graphics card and software drivers that are capable of supporting it. Second, the web browser itself must support it. Since WebGL is a relatively new specification, only the newest versions of Google Chrome, Safari, and Firefox will enable WebGL on systems with capable hardware. Internet Explorer up to version 10 does not provide WebGL support at all, although there are third-party plugins that can be added by users to provide it. Finally, mobile browser support is very limited and varies widely at this time.
In summary, the WebGL renderer can give your application amazing performance and some cutting edge capabilities if your intended users can be relied on to have the latest web browser versions and capable hardware. It isn't suitable if you need to support older web browsers, Internet Explorer, or mobile users.
The DOM renderer draws the map's contents using HTML elements (<img> and <div> tags) and uses CSS to position them. This renderer is supported by older versions of most browsers, including Internet Explorer 8. However, it does not provide many of the capabilities enjoyed by the Canvas renderer. Of the features that it does not support, the most important is vector support covered in Chapter 6, Styling Vector Layers. The DOM renderer will also generally exhibit poorer performance.
There is some effort being undertaken by community members to provide some vector capabilities for the DOM renderer, including support for Internet Explorer 8, but in general, you will probably not want to use the DOM renderer unless you need to support older browsers that do not provide Canvas support.
Let's modify our example and add a renderer option to see what happens:
The inspector is highlighting the HTML element used to render the map. In this case, that element is the <canvas> element. This element is used for both the WebGL and Canvas renderers. Let's see what happens when we change the renderer.
var map = new ol.Map({
target: 'map',
view: view,
layers: [layer],
renderer: 'dom'
});Now, we see a lot of <img> elements. By choosing the DOM renderer, we have asked OpenLayers to use a different way of presenting the map in the browser. OpenLayers now creates a new <img> element for each map tile coming from the remote server and positions it next to the others to create the complete map.
In Chapter 2, Key Concepts in OpenLayers, we introduced the concept of observable, or KVO, properties and how they can be used. Here are the KVO properties of the Map class:
All properties on the Map class, and all other classes in OpenLayers that inherit from ol.Object, can be used with the KVO methods described previously.
In this example, we'll use the target property to move the map around in our web page:
<div> tag for the map and a <button> tag after the <input> element we added for the bindTo() example. Change the class of both <div> tags to half-map—this class tells the <div> tag to only take up to 50 percent of the width of the page. When the user clicks the button, we'll move the map between the two <div> tags:<div id="map" class="half-map"></div> <div id="map2" class="half-map"></div> <input type="checkbox" id="visible" checked> Toggle Layer Visibility <button onclick="changeTarget();">Change Target</button>
<script> element that contains our new code, right after the code we added in the bindTo() example. The function will first call map.getTarget() to get the ID of the element that the map is currently in. If the ID is map, then we set the target to map2; otherwise, we set it to map:function changeTarget() {
var target = map.getTarget();
if (target == 'map') {
map.setTarget('map2');
} else {
map.setTarget('map');
}
}When you click the button, the changeTarget() function is called. This function uses getTarget() to find out which element the map is rendered in and setTarget() to move it to the other map element.
Moving the map between two HTML elements is really a contrived example to illustrate how the methods work. A more likely use of these methods might be to show and hide the map entirely. Try changing the above example to show and hide the map, rather than moving it. Also, try using get() and set() instead of getTarget() and setTarget() methods.
The Map class, being the central organizing point for OpenLayers, provides methods for managing many aspects of the map. As there are quite a few methods, we've grouped them into some logical groups—Control methods, Interaction methods, Layer methods, Overlay methods, Rendering methods, Conversion methods, and other methods.
These methods are used to manage Controls associated with a map. Controls are covered in more detail in Chapter 9, Taking Control of Controls; so, we won't go into any detail here:
These methods are used to manage interactions associated with a map. Interactions are covered in more detail in Chapter 8, Interacting with Your Map; so, we won't go into any detail here:
The methods are used to manage layers in the map. Layers can also be managed through the layergroup property but these methods are a bit easier to use:
These methods are used to manage overlays associated with a map. Overlays are covered in more detail in Chapter 8, Interacting with Your Map; so, we won't go into any detail here:
When we programmatically change the map's view (which we'll discuss at the end of this chapter), the state of the map changes and a redraw of the map is scheduled. This means that if we change the center of the view from London to New York, the map will re-center on New York and fetch tiles for that area and the screen will be updated almost instantly. This behavior can produce a jarring effect for the user. Fortunately, the Map class provides some ways to modify how the map will change state by using the beforeRender() method and how the map will appear using the render() and renderSync() methods.
The primary use of the beforeRender() method is to add animation effects to our map's navigation. After we add a function using beforeRender(), the map will call the function and allow it to update the state of the map. This function can be used to smoothly animate any of the view's state including location, level of detail, and rotation.
While the creation of animation functions is beyond the scope of this book, their use is straightforward, and OpenLayers provides some useful ways for creating animation functions for most common scenarios. Let's indulge ourselves in a bit of fun by exploring how to create and use them.
All the following methods take a single options argument with three common parameters: start, duration, and easing.
start: This is a number, the time in milliseconds to start the animation at. If not provided, the default is to start immediately. You can use the JavaScript Date object to get the current time in milliseconds, such as var start = (new Date()).getTime();. To specify a start time in the future, just add a number of milliseconds to this number; for instance, to start an effect one second from now, use var start = (new Date()).getTime() + 1000;.duration: This is a number, the duration of the animation in milliseconds, the default is 1000 (1 second).easing: This function is an easing function. An easing function is a function that computes a smooth transition for an animation. The default is ol.easing.inAndOut, which provides a smooth acceleration into and out of an animated transition. These are the built-in easing functions:ol.easing.bounce: This adds a bounce effect to the end of a transitionol.easing.easeIn: This smoothly accelerates the start of the transitionol.easing.easeOut: This smoothly decelerates the end of the transitionol.easing.inAndOut: This smoothly accelerates the start and decelerates the end of the transitionol.easing.elastic: This is similar to the bounce effectol.easing.upAndDown: This applies the transition, and then, reverses itIn addition to the three common options, each animation function has at least one additional property you can provide. Here are the functions with a note on the additional properties that can be passed. We'll try out these functions afterwards:
As you might guess, some of the built-in controls such as the zoom controls use these animation functions to create nice effects.
The best way to understand these animation functions is to try them out. Start from the previous example:
<button onclick="doBounce(london);">Bounce To London</button> <button onclick="doBounce(rome);">Bounce To Rome</button <button onclick="doPan(london);">Pan To London</button> <button onclick="doPan(rome);">Pan To Rome</button> <button onclick="doRotate();">Rotate</button> <button onclick="doZoom(2);">Zoom Out</button> <button onclick="doZoom(0.5);">Zoom In</button>
These are regular HTML buttons that call a function when clicked. We'll add the functions in a moment.
Rome, next to the line where we defined the location of London:var rome = ol.proj.transform([12.5, 41.9], 'EPSG:4326', 'EPSG:3857');
<script> tag to handle the button clicks. Start with the doBounce() function:function doBounce(location) {
var bounce = ol.animation.bounce({
resolution: map.getView().getResolution() * 2
});
var pan = ol.animation.pan({
source: map.getView().getCenter()
});
map.beforeRender(bounce);
map.beforeRender(pan);
map.getView().setCenter(location);
}doPan() function:function doPan(location) {
var pan = ol.animation.pan({
source: map.getView().getCenter()
});
map.beforeRender(pan);
map.getView().setCenter(location);
}doRotate() function:function doRotate() {
var rotate = ol.animation.rotate({
rotation : Math.PI * 2
});
map.beforeRender(rotate);
}doZoom() function:function doZoom(factor) {
var resolution = map.getView().getResolution();
var zoom = ol.animation.zoom({
resolution: resolution
});
map.beforeRender(zoom);
map.getView().setResolution(resolution * factor);
}London and Rome.Not too bad! In a few lines of code, we managed to create some pretty impressive animation effects using ol.animation functions and the Map's beforeRender() method.
In step 3, we created the doBounce() function. This function takes a single parameter, location, which is the location that we want to bounce to. The effect we want to achieve is to smoothly zoom out from our current location and then into the new location. We called ol.animation.bounce() to create a function that implements the bounce animation effect. For this example, we provided only the resolution property and let the other properties (start, duration, and easing) take their default values. We set the resolution property to two times the current resolution of the map's view. This is equivalent to clicking the ZoomOut control (the button in the top-left corner of the map with the minus sign) once. What this does is smoothly zoom out from the current resolution to the next zoom level, and then back into the current resolution.
Next, we created a function that implements the pan animation effect. Again, we used the defaults for start, duration, and easing by not specifying them and set the source property to the current center of the map's view. We added both bounce and pan functions to the map by calling beforeRender(); then, we changed the map's view to go to the location we passed into this function.
In step 4, the doPan() function takes a single parameter, location, and smoothly pans the map to it. To do this, we called ol.animation.pan() with the map's current center for the source as we did in the doBounce() function, then we told the map's view to go to the new location.
In step 5, the doRotate() function doesn't take any parameters; we just wanted to spin the map 360 degrees. We used the ol.animation.rotate() function for this and set the rotation option to specify how much to rotate. When we add this to the map using beforeRender(), the effect happens immediately.
In OpenLayers, rotation is always specified in radians. When we think about rotation, we normally think in degrees. To convert from degrees to radians, it is useful to remember that 180 degrees = PI * radians. We don't need to know the value of PI, JavaScript provides us with the useful constant, Math.PI. The formula to convert degrees to radians is var radians = degrees * Math.PI / 180;. The inverse is var degrees = radians * 180 / Math.PI;. In our example, we wanted to rotate the map 360 degrees. Using the formula above, this becomes 2 * Math.PI, which is the value we used.
Step 6 adds the doZoom() function. It takes a single parameter, factor, which is the amount to zoom. We used ol.animation.zoom() to create our animation function using the view's current resolution as our starting point. Then, we added our animation function and told the map's view to zoom to a new resolution by multiplying the current resolution by the factor parameter. A factor of two will cause the map to zoom out to the next zoom level and a factor of 0.5 will cause the map to zoom in to the next zoom level.
Now that we've seen how the basic animations work, try modifying the animation properties in each function to see how to change its parameters and overriding the default duration, start time and easing functions. You can also try combining the animations in different ways.
When we click on a web page, the browser generates a MouseEvent that contains, among other things, the position that the click happened at. This position is in pixels and is relative to the browser window. In an OpenLayers application, we will often want to respond to the user interacting with the map and it is important to understand these events specify the position in pixels. It is common to need to determine the geographic coordinate that corresponds to this position. OpenLayers provides several methods that allow us to convert between the browser's pixel space and geographic coordinates:
The map object contains a few other methods that don't neatly fit into the previous groups; so, we've included them here for completeness:
The standard KVO events beforepropertychange and change are available, as well as one event for each of the observable properties: change:layergroup, change:size, change:target, and change:view. Review the section on KVO in Chapter 2, Key Concepts in OpenLayers if you don't remember how these events work.
In addition to the KVO related events, however, there are quite a few new events that can be triggered from a map object. As with any other event, you can register for these events using the on() and once() methods discussed earlier. We'll group these events into browser events, map events, and render events.
The Browser events are all events that are provided in response to the user interacting with the map's HTML element. The available events are:
click: This event is fired once for every discrete click on the map. If the user double-clicks on the map, this event will be fired twice. If you want to distinguish between a click and a double-click, use the singleclick event instead.dblclick: This event is fired if the user double-clicks the map.pointerdrag: This event is fired when the user moves the mouse while holding down one of the mouse buttons.pointermove: This event is fired when the user moves the mouse.singleclick: This event is fired when the user single-clicks on the map. There is a short 250 ms delay after the click event before this event is triggered to ensure that the user is not double-clicking the map.Listeners attached to the Browser events will receive an object of the ol.MapBrowserEvent type that contains the following properties:
type – This is a string, MapBrowserEvent.map: The ol.Map is a reference to the map object on which the event happened.browserEvent: The DOMEvent is a standard browser event that was originally issued by the browser. This will contain information about the event (its position and what the user did—move, click, and so on) that you'd be usually looking for.frameState: This is an object representing the current frame state of the map.There are two events that are triggered when the map state changes.
Listeners attached to the map events will receive an object of the ol.MapEvent type, which contains the following properties:
There are two events that are triggered when the map is being rendered. These can be used to programmatically alter the appearance of the rendered map image in interesting ways:
precompose: This event is triggered when the map is rendered, just before all the layers will be drawn into the rendering context.postrender: This event is triggered when the map has completed rendering all the layers into the current rendering context. This is a very interesting event as it provides an opportunity to modify the canvas (for Canvas and WebGL renderers) after the map has been rendered. We'll explore this in Chapter 6, Styling Vector Layers when we discuss vector styling.Listeners attached to the render events will receive an object of the ol.render.Event type that contains the following properties:
type: This is a MapEvent stringtarget: The ol.Map is a reference to the map object on which the event happenedvectorContext: This is a rendering API capable of drawing to the contextframeState: This is an object representing the current frame state of the mapcontext: This is the 2D context associated with the canvas (if applicable)glContext: This is a WebGL rendering context (if applicable)The map object is the central component of an OpenLayers web application. It is a central place to add and remove things such as layers and controls, and bind them all together. The remaining chapters in the book will introduce you to these other things, but one of those bits is really very closely tied to the map object, and that is the view object. The view object provides the map with the information it needs to decide what location and level of detail—or zoom level—you are looking at. A view also has a projection (which we discussed in Chapter 2, Key Concepts in OpenLayers) that determines the geospatial reference system of the map.
OpenLayers currently provides a single View class, ol.View. This class represents a simple 2D view, which can be manipulated through three key properties: center, resolution, and rotation. We will create a new instance of ol.View in the same way that we create a map object, like the following:
var view = new ol.View(ViewOptions);
We've used views in all our examples because a view is a mandatory parameter when creating a new map instance, but we haven't discussed it in detail yet. Let's dive in.
The options you can use when creating a new ol.View instance are as follows:
It is important to understand what is meant by the term resolution and how the various view options related to resolution work together.
In the context of OpenLayers, the term resolution means the number of projection units per pixel. A projection determines how the real world, which is a sphere, is represented in 2D space. The definition of a projection includes a number of things, including a 2D coordinate system and an algorithm for converting real-world locations (latitude and longitude) to and from the projection's coordinate system. The projection's coordinate system is defined in a particular set of units, such as meters, feet, or even decimal degrees. The projection's coordinate system has a bounding box defined as values in the projection's unit system. When we say projection units per pixel, we mean a value expressed in the unit system of the projection.
The most zoomed out state of the map will render the bounds of the projection into a 256 x 256 pixel tile. This is considered the maximum resolution and can be calculated as the width of the projection's bounds divided by 256. When the map is at its most zoomed in, the minimum resolution can be calculated as the width of the projection's bounds divided by the number of tiles wide times 256. We yet don't know how many tiles are required to draw the map at the most zoomed in level; so, this has to be known or computed in some way.
The most zoomed out state of the map is, by convention, called ZoomLevel 0. When a user zooms in or out, they change to the next zoom level. Zooming effectively changes the number of tiles used to represent the projection's bounds. The default zoom factor is 2, which means that zooming in to the next zoom level doubles the number of tiles in the map (in each dimension) and halves the resolution. If ZoomLevel 0 is 1 tile (wide and high), then ZoomLevel 1 is 4 tiles (2 wide and 2 high). ZoomLevel 3 is 16 tiles (4 wide and 4 high). In fact, the number of tiles required for the width and height of any zoom level can be easily calculated as numTiles = 2 ^ zoom. Each zoom level has a resolution defined by the projection's bounds divided by the zoom level's width in tiles. For any given zoom level z, the resolution can be computed as resolution = projection width / (2 ^ z). Likewise, the zoom level equivalent to any resolution can be computed by rearranging the algorithm to z = log(projection width / resolution)/log(2).
When a view is configured, it needs to know a maximum and minimum resolution and a zoom factor for determining the resolutions between the maximum and minimum for zooming. The View class provides several options that are used together to determine the resolution constraints. Since zoom level and resolution can be computed from each other, the constraints can be determined in terms of resolution (maxResolution and minResolution), zoom levels (minZoom is equivalent to maxResolution, maxZoom is equivalent to minResolution), or some combination of these. OpenLayers uses the resolution options in preference to the zoom options if both are provided.
In practice, it is usually sufficient to define just the maxZoom or minResolution because minZoom defaults to 0 (the maximum resolution computed from the projection bounds).
As with the Map class, the View class has a number of KVO properties that have accessor methods (get and set), property binding, and events as discussed earlier:
The View class has several methods in addition to its properties:
We'll wrap up this chapter with a final update to our example by adding a second map and linking the two maps together.
<div> tags; it's the HTML that looks like this:<button onclick="changeTarget();">Change Target</button>
changeTarget(), as we won't need it any more.ol.Map and put it into the map2 <div> tag. Note that there is no view option!var map2 = new ol.Map({
target: 'map2',
layers: [layer]
});view property to the other map object:map2.bindTo('view', map);With a single line of code, we bound the view property of the two maps and were able to produce a pretty interesting effect. By itself, this doesn't do much that could be considered useful but it is the basis for building some interesting functionalities such as creating an overview map or a highlight map that shows the same area as a main map but at a different level of detail.
One thing you probably noticed with the previous example is that changes from one map aren't animated in the other one. This behavior is to be expected. If you recall, we mentioned in the animation section that programmatic changes are applied instantly. Since we aren't adding animation effects with beforeRender(), the changes applied from one view to the other happen instantly and the result is sometimes quite jarring.
Use the knowledge you've gained in this chapter to adapt the previous example into something more useful. Try to make the second map respond to changes in the first map, but zoomed out three times. Remember that zooming out once is equivalent to doubling the zoom level. When the page loads, it should look like this:
When the first map is panned or zoomed, the second map should center on the same location and stay zoomed out in three levels. The second map should not have any controls or interactions—set both the controls and interactions option to new ol.Collection() to achieve this.
Let's do a series of questions to see what you understood during the chapter:
Q1. I want to start my map looking at a specific location and level of detail. Which object is responsible for this?
Q2. I want to take some action when the user pans the map. What event should I listen for?
moveendzoomendQ3. Which object files this event?
Q4. I want to update a property called center of the view object when the center property on another object obj, changes. Which class provides the bindTo() method that I'll use?
ol.Mapol.Viewol.ObjectThis brings us to the end of the Map and View classes. We covered a lot of detail in these two classes and also uncovered some of the common methods used throughout the OpenLayers library that will help us work with events and key-value observing. We tried out many of the methods in various examples.
In the next chapter, we'll dive into raster layers and discover how to add various types of raster data sources to our OpenLayers applications.
Web maps are very popular today, and are growing in popularity. After Google Maps was introduced, there was an explosion of interactive web maps. Google provides an API to interact with its mapping service, as others do now, and OpenLayers works well with most of them. Not only can we use these third-party APIs with OpenLayers, we can also mash up other layers on top of them. Those services are the most popular, but they suffer from bottleneck depending on your web mapping application. So, you need to know mainstream API and alternatives to display raster images.
In this chapter, we will learn the following:
A layer is basically a way to show multiple levels of information independent of each other. Layers are not just a mapping or cartography concept; graphic designers and digital artists make heavy use of layers.
Imagine a printed map of a city. Let's say you also have two sheets of transparent paper. One sheet has blue lines that indicate bus routes, and the other sheet contains green lines that indicate bicycle routes. Now, if you placed the transparent sheet of paper with bicycle routes on top of the map, you will see a map of the city with the bicycle routes outlined.
Putting on or taking off these transparent pieces of paper will be equivalent to turning a layer on or off. The order you place the sheets on top of each other also affects what the map will look like—if two lines intersect, you will either see the green line or the blue line on top. This is the basic concept of a layer.
OpenLayers is a JavaScript library, and as discussed earlier is built using Object Oriented Programming (OOP). When we want to actually create a layer, we will create (or instantiate) an object from an ol.layer.Layer subclass.
OpenLayers has many different ol.layer classes. The layer types are only for different kinds of data (tiles, images, and vector). Using an attached ol.source.* will allow you to connect to a different type of map server 'back end.' Each layer object is independent of other layer objects; so, doing things to one layer won't necessarily affect the other.
How many layers can I have?
The safest maximum amount of layers you can have on a map at one time depends largely on the user's machine (that is, their processing power and memory). Too many layers can also overwhelm users; many popular web maps (for example, Google and Yahoo!) contain just a few layers. We recommend that you don't use a lot of layers or limit the number of layers that you can turn on at the same time. Adding layers is cheap but making composition of the map image is expensive, particularly with Canvas renderer. If you turn on many layers at the same time, you will end up with an unusable map, whereas if only some of them are turned on, you will have good performance. You also need to be aware that using vector layers instead of raster layers is better for composition performances.
Whatever the purpose of your web map application is, you will need at least one layer to have a usable map. An OpenLayers map without any layers would be like an atlas without any maps. You need at least one layer—at least one base layer. All other layers that sit above the base layer are called overlay layers. The concept inherits from the existing OpenLayers 2 series and was seen in Chapter 1, Getting Started with OpenLayers.
A base layer is at the very bottom of the layer list, and all other layers are on top of it. This would be our printed map from the earlier example. The order of the other layers can change, but the base layer is always below the overlay layers. By default, the first layer that you add to your map acts as the base layer. You can, however, change the order of any layer on your map to act as the base layer.
You can also have multiple base layers. Although you can set more than one base layer active at a time, for visual readability, most of the time, you only use one.
Any layer that is not a base layer is called an overlay layer. Like we talked about earlier, the order that you add layers to your map is important. Every time you add a layer to the map, it is placed above the previous one.
After this reminder about layers concepts, see what's happening at the OpenLayers 3 library level inheritance to discover the main layers type.
There are two types of layers: raster and vector layers. The main differences between both are:
PNG or JPEG. They can be generated on server-side or are static. In most cases, your browser doesn't manipulate them but only consumes them.To give you an overview of layers organization at the library level, let's look at the following diagram:
When you are creating a new web mapping application, you have to make a choice between benefits and drawbacks of those layers. For raster, it's mainly that images do not overload the browser as vector layers mostly can. As you can see in the diagram, raster layers such as vector layers are derived from a common ol.layer.Layer class. This ol.layer.Layer class inherits from an ol.layer.Base class, (base in this case means common behavior between layers). This class is also inherited by an ol.layer.Group class designed to group layers to treat them as a single layer. In our case, we will focus mainly on the two raster layer classes, ol.layer.Image and ol.layer.Tile. We will also do a review of the common ol.layer.Layer methods. Moreover, you can divide raster in two categories: tiled or untiled. We will cover both types in this chapter. The ol.layer.Vector class will be covered in Chapter 5, Using Vector Layers.
All raster layers inherit from ol.layer.Layer.
The following table is the list of available properties. You can also use them with vector although it's not required in this chapter:
|
Name |
Type |
Description |
|---|---|---|
|
|
|
This property sets the layer brightness. See Wikipedia webpage (https://en.wikipedia.org/wiki/Brightness) for more information. |
|
|
| |
|
|
|
This property sets the layer hue. You can discover more about hue with the Wikipedia page, https://en.wikipedia.org/wiki/Hue. |
|
|
|
This property sets the layer opacity. Possible values are between |
|
|
|
This property sets the layer saturation. See the dedicated Wikipedia article (https://en.wikipedia.org/wiki/Colorfulness) for more. |
|
|
|
This property defines the source for the layer. Sources are a way to access a resource such as single, tiled images or geographic features. |
|
|
|
This property sets the visibility. The default value is |
|
|
|
This is the minimum resolution (inclusive) at which this layer will be visible. |
|
|
|
This is the maximum resolution (exclusive) below which this layer will be visible. |
You can use those properties to set layer properties at startup. If you need to change one of those properties after layer creation, you always have setters and getters. Getters, if you don't remember the part about JavaScript initialization, are methods of objects you can use to get properties. Setters are also methods but to set properties. The setter and getter for a property are derived from the property name. It starts with a get or set keyword followed by the property with the first letter using uppercase. For example, for opacity, the getter name is getOpacity and the setter name is setOpacity.
You also have some methods that are specific to ol.layer.Layer and not related to properties.
The following are the main methods. We will not cover methods related to events: the ol.layer.Layer inherits from ol.Object via ol.layer.Base (http://openlayers.org/en/v3.0.0/apidoc/ol.html). It's because we already explained how events works within Chapter 2, Key Concepts in OpenLayers.
Let's try to play with the simplest cases.
Follow these steps to change layer properties:
Use the example derived from the first example from Chapter 1, Getting Started with OpenLayers, also available at chapter04/2360_04_01_changing_layer_properties.html:
<!doctype html>
<html lang="en">
<head>
<title>Simple example</title>
<link rel="stylesheet" href="../assets/ol3/css/ol.css" type="text/css" />
<link rel="stylesheet" href="../assets/css/samples.css" type="text/css" />
</head>
<body>
<div id="map" class="map"></div>
<script src="../assets/ol3/ol.js" ></script>
<script>
var osmLayer = new ol.layer.Tile({
source: new ol.source.OSM(),
opacity: 0.6,
brightness: 0.2
});
var view = new ol.View({
center: ol.proj.transform([-1.8118500054456526, 52.4431409750608], 'EPSG:4326', 'EPSG:3857'),
zoom: 6
});
var map = new ol.Map({
target: 'map'
});
map.addLayer(osmLayer);
map.setView(view);
</script>
</body>
</html>ol.source.Source from the osmLayer:console.log(osmLayer.getSource());
osmLayer.setProperties({opacity: 0.4, contrast:0.6});
console.log(osmLayer.get('contrast'));
console.log(osmLayer.get('opacity')); osmLayer.setProperties({opacity: 0.7, contrast:0.3});
console.log(osmLayer.getOpacity());
console.log(osmLayer.getContrast()); osmLayer.set('opacity',1);
osmLayer.setContrast(1);
osmLayer.setBrightness(0);
osmLayer.set('myId', 'myUnique');
console.log(osmLayer.get('myId'));We reviewed how to manage main methods attached to the ol.layer.Layer subclass (remember that ol.layer.Tile inherits from it).
The interesting thing here, is that you are able to manipulate and create generic properties for all the ol.layer.Layer subclasses.
The most common operations on layers have their custom getters/setters such as getVisible() / setVisible(property), but you can replace them with the ol.layer.Layer getters/setters, get('visible')/set('visible', property). These are inherited from ol.Object, and consequently, ol.layer.Tile inherits them too. In the normal case, you use these getters/setters only for arbitrary properties we want to add, such as a name.
Another benefit you may not be aware of is that when you add new properties to a layer object, you can attach information for new applications related to layers. For example, you can set a property to reference metadata for the layer (intellectual properties, license, link to a PDF file to download, or more). Some other ways to use it are to define groups, set a unique identifier, set a display name to reuse in a custom layer manager, and set a reference to a legend resource (URL, image, and so on).
The possibilities are endless.
Now, after this short introduction to manage layer properties, we will review different raster layers and also the source property. It's mainly these elements that make the difference between raster layers in the OpenLayers 3 library.
We mentioned earlier that there are two types of raster layers: tiled and untiled.
Before sharing ideas about tiling, the first thing to do is define tiling. According to Wikipedia, https://en.wikipedia.org/wiki/Tiled_rendering, it can be considered as the process of subdividing an image by regular grid.
So, why is this needed? Again, like for Closure Tools, it's for web performances. You can review about Closure tools in more detail in Appendix B, More details on Closure Tools and Code Optimization Techniques. Raster data and layers are built from other images or from vector data. The idea here with tiles is to balance the time for data processing and the time for transferring the resource (the image) through the network. It's also because using a regular tile grid can be cached, both by the browser and by the server.
Imagine that you require a complex layer. Would you want to wait for five minutes until it renders? (Rendering is the process to generate an image from geographic sources).
The following table shows a summary of pros and cons for using tiled, untiled resources:
To summarize, if you want performance with less flexibility, choose tiled raster, and if you need fresh data and your layers are based on one or two data sources, choose untiled raster. You can also make a mix of both solutions: use tiles at some levels and untiled content at other levels. Another difference we don't really show in the table for tiles, is that you can pregenerate image tiles for an upper level (such as the country level or lower) and choose to generate tiles on the fly only for lower levels (the street level). Depending on the context, you don't choose: you have to connect to a third-party map server where the choice is restricted to the available web services / images.
The purpose of this comparison is to help you understand how to make a good decision concerning the required layers you have to choose. OpenLayers 3 is only a client-side library; however, knowledge about the principle to provide layers is a requirement to use it well. Also, you may need to host, or own, your map server to serve raster data.
If you ever need to serve your own tiles or raster data, you can take a look at the following open source software:
Geoserver: http://geoserver.org
It is a server software that allows you to serve maps and data from a variety of formats to standard clients such as web browsers and desktop GIS programs.
Mapnik: http://www.mapnik.org
It's a toolkit for rendering beautiful maps, with clean, soft feature edges provided by quality anti-aliasing graphics, intelligent label placement, and scalable, SVG symbolization. Most popularly, Mapnik is used to render the OpenStreetMap main map layers.
Mapserver: http://www.mapserver.org
It is an open source geographic data rendering engine written in C. Beyond browsing GIS data, MapServer allows you to create geographic image maps, that is, maps that can direct users to web content. Like GeoServer, it allows map publications via Open Web Standards.
Degree: http://www.deegree.org/
Degree is open source software for spatial data infrastructures and the geospatial web. It shares with GeoServer and Mapserver the ability to serve map via Open Web Standards.
We can also mention that there are map proxy applications such as MapCache http://mapserver.org/mapcache/, GeoWebCache http://geowebcache.org, or MapProxy http://mapproxy.org.
Their important purposes are creating tiles for dynamic web server, caching requested map images using GeoServer, MapServer, Mapnik, Degree, or any other map servers.
So far, we focused on the differences between tiled and untiled, but you also have some differences coming from the source property.
So, how can we define a source? What is its purpose?
Sources in OpenLayers 3 language define how and where you can access the layer. You always need a source from an ol.source subclass in order to retrieve and display layers.
Why did OpenLayers 3 development team invent this concept?
It was mainly for the organization of the code and reusability of the same principles. You gain modularity because you have only three types of layers but more sources. It enables you to decouple the type of layer you are using from the data source and the way you call it. It's simpler to manage a new source than to create a new layer by example if a new source appears.
You can see in the following diagram that ol.source.Source has three main child subclasses, ol.source.Vector, ol.source.TileSource, and ol.source.ImageSource.
They are abstract classes. It means, they work as a skeleton for all types of sources but are never directly used:
Most of the layers we are manipulating are inherited from the past.
Web-based maps are commonplace today. The catalyst for the explosive growth of web maps was the introduction of Google Maps. Web maps existed before, but they were not quick or developer friendly. In June 2005, Google released an API for Google Maps, which provided a frontend client (the role OpenLayers plays), along with an access to the backend map server via their frontend client API.
This allowed anyone to insert not just a Google Map on their site, but also allowed them to add in their own point data and manipulate the map in other ways. Google Maps grew in popularity, and other companies such as Microsoft, Yahoo, MapQuest, MapBox, Nokia, and others followed in their footsteps, creating their own web mapping APIs.
Most of them are more likely to make mashups.
The term mashup refers to an application that combines various different data sources and functionality together. A map mashup is a map that combines different layers and data. Third-party mapping APIs, such as MapQuest and Microsoft Bing Maps, allow people to more easily create these map mashups. For example, a map with an OpenStreetMap base layer overlaid with markers that track places you've traveled to can be considered a map mashup.
OpenLayers did not introduce map mashups, but it allows us to create very powerful ones with ease. Combining an OpenStreetMap layer, a WMS layer, and a vector layer is pretty simple with OpenLayers.
OpenLayers 2 had some third-party mapping APIs embedded into its core, enabling you to use its maps inside your Openlayers-based application. Nowadays, for better decoupling of OpenLayers API from third-party APIs, the OpenLayers 3 team choose to have no support for other mapping APIs that tie together tiles and an associated JavaScript API library.
Why this decision?
One of the main goals of OpenLayers 3 was to rewrite OpenLayers 2, making its API cleaner. The support for Google Maps API in OpenLayers 2 has also put a significant maintenance burden on both library and application developers, to keep up with changes of the Google Maps API. To avoid this in OpenLayers 3, the support for Google Maps using Google Maps API is nonexistent. However, Google does provide its tiles independent from their API, but only to paying customers. Fortunately, you have more alternatives to Google Maps API. We will try to show you that Bing (Microsoft) Maps (with its tiles service) or OpenStreetMap and its derived map images' data services API such as MapQuest can fill the missing provider.
Now, it's time to review all the tiled layers, in particular, to use beautiful background layers for your maps.
All tiled layers share some common properties. They inherit from the ol.source.TileImage. Those common properties are quite useful for other ol.source.* that inherit from it, for example, in some cases to put a logo or give attributions (also called credits) for the maps data and/or tiles. You have to be careful in the API docs online as these properties are considered unstable. You have to uncheck the Stable Only checkbox on the top banner. Unstable doesn't mean that you don't have to use those properties but that they may change with future OpenLayers releases. It's very useful for application developers to see what they may need to use or migrate in the future. See the following table for further information:
The most important functions are mostly those that do not start with the word tile. The tileClass, tileGrid, tileLoadFunction and tilePixelRatio exist but we choose to not cover them as they seem out of the scope for beginners; they help setting access to backend with particular tile grids. Along this book, we will sometimes refer to source as layer but it means a layer with the source adapted for a particular backend.
OpenStreetMap (OSM) is a free, Wikipedia style map of the world driven by user contributed content. You are able to use your own OSM tiles or ones provided through the OpenStreetMap servers.
Setting up an OpenStreetMap service and tiles yourself is not too difficult, but it is outside the scope of this book (visit http://switch2osm.org for more information on this). Accessing OSM with OpenLayers, however, isn't.
More information on the OpenStreetMap project can be found at http://www.openstreetmap.org. To access OpenStreetMap, only using the ol.source.OSM constructor without any options is enough. In the previous examples, we were already using this source, so we will not give you another similar example.
Though using constructor without options can be enough, you can also use other properties. The default constructor code uses the publicly available OSM tiles, but it is easy to point it at your own tiles. To do so, create the layer in this format:
var osmLayer = new ol.layer.Tile({
source: new ol.source.OSM({
url: 'http://{a-c}.tile.opencyclemap.org/cycle/{z}/{x}/{y}.png'
})
});To use this, you will have to replace http://{a-c}.tile.opencyclemap.org/cycle/ with the server hosting your OSM tiles. {z}, {x}, and {y} are variables that OpenLayers will replace with the appropriate values to reference specific map tiles.
The {a-c} parameters mean to say you can access tiles using these URLs:
http://a.tile.opencyclemap.org/cycle,
http://b.tile.opencyclemap.org/cycle,
http://c.tile.opencyclemap.org/cycle
This behavior comes from restrictions from your browser: you can't simultaneously ask images from a same domain. It can only request a certain number of resources from the same domain simultaneously, usually 2 or 4. Using subdomains is a way to bypass this limit and speed up the map displaying.
If you have different sources for tiling, it is not only to provide different URLs to access different map images. The way tiling is done depends on established standards.
For example, Stamen layers, OpenStreetMap layers, and MapQuest layers are using the same tiling convention, whereas WMTS (Web Map Tile Service) can adopt other patterns to display tiles. These patterns are set with the ol.tilegrid.TileGrid object that describe for each arbitrary zoomlevel how the tiles are split.
The rules are the following. In reality, the Earth is not a sphere, but in this case, our planet is assimilated to a sphere because we are using Spherical Mercator projection (mainly known as EPSG 900913 or EPSG 3857). Do not worry about projections at the moment, we will review them in a later chapter as it can be a difficult topic to understand.
The entire sphere is projected on a single square at the 0 level. Then, for each zoom, you increase a level and for each tile at the previous zoom, we get 4 tiles at this one.
With the preceding diagram, you will know how to access a tile covering East Europe such as Poland at the 3 level. The URL always looks like URL_TO_TILES/level_z/x_in_grid_for_level/y_for_grid_in_level.png. So, for Poland that has a zoom level 3, x equal to 4, an y to 2, the URL could be http://b.tile.openstreetmap.org/3/4/2.png or http://c.tile.openstreetmap.org/3/4/2.png to get the right tile.
This source enables your layer to consume OpenStreetMap data and customize OpenStreetMap specific properties.
The constructor is ol.source.OSM and its properties can use following options:
MapQuest was, until around 2008, the leading provider for web mapping API. With the entry of Google Maps, the leadership was lost. In 2010, the company chose to change its position concerning web mapping API, by choosing to exclusively rely on OpenStreetMap data to do the job.
Two layers are available freely. They also provide other services such as their own web mapping API. You can get further information at the Open developer part website at http://developer.mapquest.com/web/products/open/.
The MapQuest source class refers directly to the MapQuest tiles server URL.
The constructor is ol.source.MapQuest.
You are only required to use the source constructor included in an ol.layer.Tile object to add the layer. There are only two options' properties. The first one is the layer. It can take values such as osm (roads), sat (satellite), and hyb (hybride) depending on the tiles you want to display. The other property tileLoadFunction will not be covered here: it's not a common requirement for beginners and we already listed it in the ol.source.OSM. At least, you just need to know that it helps change call to tiles with rules defined in your code.
setVisible to be able to see one layer and hide it to show the other underlying layer.You will get something like the following screenshot if you center on the Statue of Liberty and use the MapQuest OSM layer:
The Stamen layers were named so after a company. To cite the OpenstreetMap wiki, Stamen (http://stamen.com) is a San Francisco design and development studio focused on data visualization and map-making. These layers extensively use OpenStreetMap data in many of their map visualizations and have provided three CC-BY OpenStreetMap tilesets: Toner, Terrain, and Watercolor. You can see how the styles look at the official demo website, http://maps.stamen.com.
Follow these steps to create a Stamen layer:
var stamenLayer = new ol.layer.Tile({
source: new ol.source.Stamen({
layer: 'toner'
})
}); var map = new ol.Map({
layers: [stamenLayer],
target: 'map',
view: new ol.View({
center: ol.proj.transform([2.35239, 48.858391], 'EPSG:4326', 'EPSG:3857'),
zoom: 12
})
});The map we've just created shows a black and white Stamen layer. You can look at other available layers for Stamen, the list is available just after the Stamen Layers' properties below.
Stamen source class refers to the beautiful tiles from Stamen. You can declare their source using the following content.
The constructor is ol.source.Stamen.
We will not review all properties, as most of them are configured by default. You can refer to the API docs at
http://openlayers.org/en/v3.0.0/apidoc/ol.source.Stamen.html.
The most important property to remember is the layer where you set the name of the available layer you want with:
new ol.source.Stamen({
layer: 'toner'
})
You will find all the available layers names derived from the three Stamen layers in the following table, their image type, and their default state. Be careful, particularly when you are using the .jpg images and the opaque property option together, the .jpg image format is unable to work with transparency. Refer to the following table for further information:
|
Name |
Extension |
opaque |
|---|---|---|
|
terrain |
|
true |
|
terrain-background |
|
true |
|
terrain-labels |
|
false |
|
terrain-lines |
|
false |
|
toner-background |
|
true |
|
toner |
|
true |
|
toner-hybrid |
|
false |
|
toner-labels |
|
false |
|
toner-lines |
|
false |
|
toner-lite |
|
true |
|
watercolor |
|
true |
Microsoft provides an interface to their mapping services as well. Their mapping service previously was referred to as Virtual Earth, but they have since rebranded it as Bing Maps. The official Microsoft documentation can be found at http://msdn.microsoft.com/en-us/library/dd877180.aspx.
Bing Maps tiles can be viewed using the official Bing Maps API, but they can also be used through an API that gives direct access to their tiles. This is what we will see now:
style property but also the key. Contrary to the previous examples, a tile access control is done and works through an account associated with a key to use in your code: var sourceBingMaps = new ol.source.BingMaps({
key: 'AibU6zHqoTPYDuNRtHPMJq557poKb9AVTIJ0NWWnNZf8LfoRRwoigHTQ0Frrsr5m',
imagerySet: 'Road',
});ol.layer.Tile layer: var bingMapsRoad = new ol.layer.Tile({
source: sourceBingMaps
}); var bingMapsAerial = new ol.layer.Tile({
source: new ol.source.BingMaps({
key: 'AibU6zHqoTPYDuNRtHPMJq557poKb9AVTIJ0NWWnNZf8LfoRRwoigHTQ0Frrsr5m',
style: 'Aerial',
})
}); var map = new ol.Map({
layers: [bingMapsRoad, bingMapsAerial],
target: 'map',
view: new ol.View({
center: ol.proj.transform([6.562783, 46.517814], 'EPSG:4326', 'EPSG:3857'),
zoom: 13
})
});To make the example work, it's required to put your file on a web server. It can be Apache, but with Python, you can simply do it in the command line in your demo file root directory:
python -mSimpleHTTPServer
Next, open your browser to http://localhost:8000/sandbox/your_file_name.html.
Another way can be to use the node index.js command (if you downloaded the samples code) and open http://localhost:3000/sandbox/your_file_name.html.
Also, you don't have the obligation to create an API key when you are on your local machine. The one used in this book works only when using localhost or the official book website at http://openlayersbook.github.io.
We just made a map using the Microsoft Bing Map tiles' API. It works similar to the OpenStreetMap tiles layers but required to be authenticated. We can communicate with Microsoft tiles API server and use different properties. Let's go over the properties, as there are some that the other third-party sources do not provide.
Bing Maps source helps you consume Bing tiles representing road and imagery in your layer.
The constructor is ol.source.BingMaps and the following table is for the options:
|
Name |
Type |
Description |
|---|---|---|
|
|
|
It is the language and the localization you want to display for your labels. The supported Culture Codes for each style are listed in the official Microsoft documentation at http://msdn.microsoft.com/en-us/library/hh441729.aspx. |
|
|
|
This is the Bing Maps API key. Get yours at http://bingmapsportal.com. |
|
|
|
This is a type of imagery. It can be |
|
|
|
The TileJSON format was invented by MapBox, another company providing OpenStreetMap related services. It relies on JSON notation.
According to the specification, TileJSON is an open standard for representing map metadata. Its main goal is to reference the name, the attribution, the server URL, the minimum and max zoom, the center, the bounds, and the scheme of the tile (for OSM, numbering go top to bottom but other tiles' systems start numbering upwards). You can see all available parameters looking at the official specification at https://github.com/mapbox/tilejson-spec.
As it is not the mainstream way to get tiles, although it's a smart way, we will not review it through an example but directly advise you to go the official demo available at http://openlayers.org/en/v3.0.0/examples/tilejson.html and look into the code.
TileJSON source permits you to display in a tiled layer custom tile. You can declare their source using the following constructor:
ol.source.TileJSON
You can also review the available properties, particularly the required URL parameter on the official API docs at http://openlayers.org/en/v3.0.0/apidoc/ol.source.TileJSON.html.
The WMTS layer is based on the WMTS standards. The specification defines it as The Web Map Tile Service described in this standard builds on earlier efforts to develop scalable, high-performance services for web-based distribution of cartographic maps.
A WMTS-enabled server application can serve map tiles of spatially referenced data using tile images with predefined content, extent, and resolution.
This type of layer is quite different from most of the previous tiled layers we've seen. WMTS layers are more customizable. You can make a request to get tiles in custom projection, you can also choose your grid without caring about the implicit rules, that each tile when you zoom it will give you four tiles, as illustrated with the following figure:
It's really not the most common tiles layer, but you can see it as the most efficient tile system for custom requirements. You can better choose your level of tiling or you can also use custom tile size. For example, for mobile, a smaller tile with 64 pixels for its side can be used instead of the standard 256 pixels size. We recommend, if you are curious, to see the official examples at http://openlayers.org/en/v3.0.0/examples/ using the WMTS keyword. We will not be covering the details here. You can learn more about the standard itself by going to the official dedicated web pages at http://www.opengeospatial.org/standards/wmts.
You also need to understand that one of its main goals was to fill the issue for fast rendering contrary to OGC WMS standard as it can be cached.
WMTS sources are complex to declare. They require more parameters than other sources because of their flexibility. For example, the ability to customize for each tile levels grid means also as a drawback, complexity.
The constructor is ol.source.WMTS. To see its options, we recommend that you visit the official API docs at http://openlayers.org/en/v3.0.0/apidoc/ol.source.WMTS.html.
The DebugTileSource source is only a way to debug tiles rendering in OpenLayers 3. It doesn't use the tile numbering from the source but the internal that OpenLayers use. We just mentioned it to be exhaustive. You use it into a ol.layer.Tile class. You can look at the demo to learn more about it at http://openlayers.org/en/v3.0.0/examples/canvas-tiles.html. It can really help you to debug special grid, for example, in WMTS.
The TileDebugTile source enables you to display numbered grids to show how tiles are regrouped in the OpenLayers Canvas rendering. Canvas is a renderer to display a map in your browser.
The constructor is ol.source.TileDebug and for the options, you should visit the official API docs at http://openlayers.org/en/v3.0.0/apidoc/ol.source.TileDebug.html.
A WMS (Web Map Service) is a standard protocol for serving georeferenced map images over the Internet that are generated by a map server. You can watch the full reference at the official OGC (Open Geospatial Consortium) website, the organization managing this standard (http://www.opengeospatial.org/standards/wms).
The two versions of WMS available are 1.1.1 and 1.3.0.
WMS is dynamic: you can generate on the fly images.
So, why do I see a reference to a tiled WMS in OpenLayers 3?
It's just a way to lower charge on server-side—when you are generating small images, the process is faster, the memory cost does not really change as the number of requests increase, but you gain the ability to cache the tiles.
But wait, so why can't we use ImageWMS with WMS if we can have the advantage of both tiled (caching) and untiled system (freshness)?
We will not directly answer this right now, but will give you the hint in the section dedicated to ImageWMS.
You can refer to the official example to see a simple example as a reference at http://openlayers.org/en/v3.0.0//examples/wms-tiled.html.
To find out what projections a WMS service supports, you can make a getCapabilities request to the server. To make this request, specify the request, service, and version properties in the URL. For example, http://suite.opengeo.org/geoserver/wms?service=WMS&version=1.1.1&request=GetCapabilities.
You also have to be cautious. Here, we use the Version 1.1.1 version call but the specification supports two versions: 1.1.1 and 1.3.0. It's recommended to use 1.3.0 nowadays, but you can meet external WMS web services using only 1.1.1. Just use the VERSION parameter in the params options.
Tiled WMS source helps you set tiled WMS calls for your layer. The constructor is ol.source.TiledWMS and the options are listed in the following table:
Contrary to most components that are useful only in a map context, this component helps you to display any arbitrary images. It's really useful when you need to display a large image and want performances associated with tiles displayed and the usual interactions of mapping such as panning and zooming.
Some use cases can be game maps, discovery of scanned historical documents such as birth certificates for genealogy, or the old maps with no referencing, meaning that they do not overlay well with existing imagery and geographical data.
To make the ol.source.Zoomify component work, you will need to preprocess a large image to create tiles.
ZoomifyImage directory from the third step and generate the tiles for the image. It can take some time, so don't worry, although the program output is not verbose:
python ZoomifyFileProcessor.py path_to_dublin_map/1797-map-of-Dublin.jpg
ol3_samples/assets/data/ directory, the created folder from path_to_dublin_map/1797-map-of-Dublin/. <script> and </script> tags.http://openlayers.org/en/v3.0.0/examples/zoomify.js in your script block.ImageProperties.xml from ol3_samples/assets/data/1797-map-of-Dublin/ file and inspect the WIDTH and HEIGHT attributes from the IMAGE_PROPERTIES xml tag.imgWidth and imgHeight.url variable to /assets/data/1797-map-of-Dublin/ and change the zoom property in the view to 1 instead of 0.If you have some difficulty, do not hesitate to retrieve the file from samples.
We just made a map using images' tiles using Zoomify source with its particular grid.
The main particular thing to understand in the sample is to set a projection definition that uses image pixel coordinates, for example:
var proj = new ol.proj.Projection({
code: 'ZOOMIFY',
units: 'pixels',
extent: [0, 0, imgWidth, imgHeight]
});We use units' pixels instead of the more usual degrees or meters and the original image width and height are used to define the extent. Then, we use pixels as extent units, instead of meters or degrees.
The component retrieves each tile as we zoom in/out. To get an overview of this behavior, we recommend that you open the Network panel and play a bit with the demo.
Now, it's time to review untiled layers.
Although there are really less image layers' sources available than a tiled one, they are also useful depending on your goal or your backend.
We will start with the image WMS layer and then cover other types.
Like the tile layer WMS already reviewed, this component is also using the WMS standard to retrieve the map, imayer. The thing that differs here is that you add a layer using an ol.layer.Image constructor instead of the now more usual ol.layer.Tile and, your ol.source is ol.source.ImageWMS instead. Next, you just have to complete the parameters like for a tiled WMS.
Now, let's see why we need to use untiled WMS.
See the two following images coming from the official example when you zoom in. The first one comes from http://openlayers.org/en/v3.0.0/examples/wms-tiled.html. See the following screenshot:
The second image, as shown here, is the untiled one from http://openlayers.org/en/v3.0.0/examples/wms-image.html:
You can see that, particularly for labels, they are duplicated. This behavior is quite simple: each tile is requested separately in a tiled WMS. Most of the time the position of the label depends on the position of the object, but here you can request it more than one time because of your tiles. In conclusion, be careful to not use tiled WMS when you are using automatic labeling in WMS or you will suffer from labels' duplications.
After this functional review, let's inspect the WMS layer ImageWMS source class properties:
The constructor is ol.source.ImageWMS. Contrary to the tiled version, you can't call multiple URLs. The options are available as follows:
After this raster overview, it's time to review a bit more on how to combine those different layers in a big mashup. We will illustrate it combining the layers based on OpenStreetMap projection, the Spherical Mercator.
Getting other layers to play nicely with these layers involve three things. These rules are also available for others projections:
Using what we've learned so far, let's make a mashup. We'll use OSM derived layers with Bing Maps layer and put at the top a WMS layer. We will also set a small layer switcher (as there is no available component in OpenLayers core code for this).
To achieve your task, combine our knowledge and just follow these instructions:
<!doctype html>
<html lang="en">
<head>
<title>Playing with various sources and layers </title>
<link rel="stylesheet" href="../assets/ol3/css/ol.css" type="text/css" />
<link rel="stylesheet" href="../assets/css/samples.css" type="text/css" />
</head>
<body>
<div id="map" class="map"></div>
<script src="../assets/ol3/ol.js" ></script>
<script>
</script>
</body>
</html><script> tag. We add together two Bing Maps layers and add to them a name using set . We will reuse this parameter later:var bingMapsAerial = new ol.layer.Tile({
source: new ol.source.BingMaps({
key: 'AlQLZ0-5yk301_ESrmNLma3LYxEKNSg7w-e_knuRfyYFtld-UFvXVs38NOulku3Q',
imagerySet: 'Aerial'
})
});
bingMapsAerial.set(
'name', 'Bings Maps Aerial'
);
var bingMapsRoad = new ol.layer.Layer({
source: new ol.source.BingMaps({
key: 'AlQLZ0-5yk301_ESrmNLma3LYxEKNSg7w-e_knuRfyYFtld-UFvXVs38NOulku3Q',
imagerySet: 'Road',
culture: 'fr-FR'
})
});
bingMapsRoad.set(
'name', 'Bings Maps Road'
);var mapQuestAerial = new ol.layer.Tile({
source: new ol.source.MapQuest({layer: 'sat'})
});
mapQuestAerial.set('name', 'MapQuest Open Aerial');topp:states layer from the URL http://demo.boundlessgeo.com/geoserver/wms and various label layers back from the WMS server. We'll also set the opacity to 0.6, that is 60 percent opaque. The projection is not specified: it comes from the view and we know that the remote layer service available has the right projection (using getCapabilities). Go ahead and create the WMS layer and add again a name:var simpleWMS = new ol.layer.Image({
opacity: 0.6,
source: new ol.source.ImageWMS({
url: 'http://demo.boundlessgeo.com/geoserver/wms',
params: {
'LAYERS': 'topp:states'
},
extent: [-13884991, -7455066, 2870341, 6338219]
})
});
simpleWMS.set('name', 'USA layer from Geoserver WMS demo');var layers = [bingMapsAerial, bingMapsRoad, mapQuestAerial, simpleWMS];
map object, add into the layers object and the view too.var map = new ol.Map({
layers: layers,
target: 'map',
view: new ol.View({
center: ol.proj.transform([-90, 40], 'EPSG:4326', 'EPSG:3857'),
zoom: 3
})
});Now, we'll create a function with a special purpose: creating an HTML label tag and also and HTML input checkbox. It will have three parameters: one for the name, one to create an id for the HTML input, and the planned place where we want to create this checkbox:
function generate_checkbox(id_checkbox, label_name, html_element) {
var checkbox = document.createElement('input');
checkbox.type = "checkbox";
checkbox.id = id_checkbox;
var label = document.createElement('label');
label.htmlFor = id_checkbox;
label.appendChild(document.createTextNode(label_name));
html_element.appendChild(checkbox);
html_element.appendChild(label);
}ol.dom.Input and bindTo but don't bother about it at the moment:for (var i = layers.length - 1; i >= 0; i--) {
var id = layers[i].get('id');
var name = layers[i].get('name');
generate_checkbox('layer_id_' + i, name, document.body);
var visible = new ol.dom.Input(document.getElementById('layer_id_' + i));
visible.bindTo('checked', layers[i], 'visible');
};We just created a map using different tiles' layers with a WMS overlay. We also create, as a bonus, a simple but dynamic layer switcher. All the layers use the map's projection, EPSG:3857, and line up with the lower aerial Bing Maps.
We choose, for learning purposes, to only use the OpenLayers library code to manage layers display but an external component to the library is also available for this goal at https://github.com/walkermatt/ol3-layerswitcher. Try it on your own and enjoy! It will be a good opportunity to learn more about ol.layer.Group, we didn't really review until now.
After revising, it's time to see another source to display the image: the ol.source.MapGuide source.
We didn't review this server, although an open source version of this server is available at http://mapguide.osgeo.org, when we saw the various servers available to provide images for the OpenLayers 3 library. We chose to not cover it in detail, because this solution is not mainstream and beginners will not be able to dive deeper in to this complex solution.
You just need to understand that this image source is unusual and is mostly used by people coming from the CAD (Computer-aided design) world because this software was released as open source by AutoDesk, the leading company for 2D/3D drawing software.
There are some quite important differences to make an equivalent map version of the Zoomify sample. Let's see how:
sandbox directory./assets/data/1797-map-of-Dublin.jpg.imgCenter variable to [imgWidth / 2, imgHeight / 2];.var crossOrigin = 'anonymous';.ol.layer.Tile with ol.layer.Image.var source = new ol.source.ImageStatic({
attributions: [
new ol.Attribution({
html: '© <a href="https://commons.wikimedia.org/wiki/File:1797-map-of-Dublin.jpg#Summary">Wikipedia Commons</a>'
})
],
url: url,
imageSize: [imgWidth, imgHeight],
projection: proj,
imageExtent: proj.getExtent()
});You changed the center for the view by using a positive value for the second value in the imgCenter variable. It's because the ol.source.ImageStatic doesn't use the same origin as the ol.source.Zoomify.
We also set as an option, attributions referencing the credits to the Wikipedia Commons image.
The most important parts for configuration for the constructor are the url, imageSize, and imageExtent.
We also reused the projection based on pixels' units to set the projection for the source. As a reminder, you can inspect the available properties for the source.
The class helps to use any image as a layer using a pixel-based projection.
Its constructor is ol.source.ImageStatic. The constructor options are as follows:
To be complete, an ultimate source to review is the ol.source.ImageCanvas.
The ImageCanvas source is already an advanced topic, which is out of this book's scope; so, we will only explain its purpose.
If you remember, the default OpenLayers 3 behavior is to generate an HTML Canvas element to display the map image.
The purpose of ol.source.ImageCanvas is to help you inject in the HTML Canvas map element any arbitrary Canvas element. It's more flexible but the main drawback is the requirement to manage conversions between map units and the canvas element you want to add.
So, if you want to go further, you will need to learn Canvas drawing and also some projection calculations. At best, you will be able to integrate Canvas produced by other libraries. You also need to understand that a Canvas element can be built from vector elements and not only from raster images. It's a silly use case compared to the ideal separation between raster and vector layers.
Its constructor is ol.source.ImageCanvas. If you need it for a special purpose, the best way is to refer to the official documentation at http://openlayers.org/en/v3.0.0/apidoc/ol.source.ImageCanvas.html.
You can see it in action with D3 (another JavaScript library to generate graphic, charts, plots, and also maps), that can produce a canvas element you can use as a layer, as demonstrated in the official example at http://openlayers.org/en/v3.0.0/examples/d3.html.
For getting started with Canvas, use the Mozilla Developer part about the HTML 5 Canvas API at https://developer.mozilla.org/en-US/docs/Web/API/Canvas_API.
In this chapter, we quickly reviewed the layer structure inheritance, focusing on raster. Then, we talked about what raster data layers are, how they work, and what benefits you can get from using different sources to display your maps. We learned how to use the Microsoft Bing Maps layer, all API depending on tiles using OpenStreetMap data. We also discussed tiling in OpenStreetMap that use Spherical Mercator and how to create a map mashup with a layer switcher, mixing various layers and sources' types together. We didn't restrict the chapter to maps as it's possible to also use images unrelated to cartography.
In the next chapter, Using Vector Layers, we will see the concept of vector layer in-depth and the OpenLayers main classes for using them. Like for raster, you will discover not only their specific sources but also the various vector data formats and how to manipulate features and geometry.
Having explored raster layers, it's time to explore the other layer type that OpenLayers supports—vector layers. In this chapter, we'll introduce the vector layer and discover how to display and interact with vector data on the fly. We'll see how we can use vector sources to load vector data in a variety of formats. Through several hands-on examples, we'll explore the Format, Feature, and Geometry classes that are the foundation of OpenLayers 3 vector support.
In this chapter, we will cover using the vector layer class, ol.layer.vector, and some related classes to display vector data. Specifically, we'll:
In OpenLayers, the vector layer is used to display vector data on top of a map and allow real-time interaction with the data. What does this mean? Basically, it means we can load raw geographic data from a variety of sources, including geospatial file formats such as KML and GeoJSON, and display that data on a map, styling the data however we see fit. For example, take a look at the map that follows:
It shows a map with a Bing satellite raster layer and a vector layer on top of it. The vector layer loads data using the OSM XML Vector source and draws it in real time with different styles based on the type and attribute of each feature (the individual points, lines, and polygons). In this example, a small subset of the OSM data has been requested and is styled by OpenLayers to highlight roads (white lines), parking lots (gray polygons), buildings (red polygons), green space (in green, of course) and the location of trees (the green dots). We'll cover vector styles in detail in Chapter 6, Styling Vector Layers.
With a raster image, what you see is what you get. If you were to look at some close up satellite imagery on your map and see a bunch of buildings clustered together, you wouldn't necessarily know any additional information about those buildings. You might not even know they are buildings. Since raster layers are made up of images, it is up to the user to interpret what they see. This isn't necessarily a bad thing, but vector layers provide much more.
With a vector layer, you can show the actual geometry of the building and attach additional information to it—such as its address, who owns it, its square footage, and so on. As we'll see later in this chapter, it's easy to put a vector layer on top of your existing raster layers and create features in a specific location. We'll also see how we can get additional information about features just by clicking or hovering our mouse over them.
We can display any type of geometric shape with the vector layer—points, lines, polygons, squares, markers, any shape you can imagine. We can use the vector layer to draw lines or polygons and then calculate the distance between them. We can draw shapes and then export the data using a variety of formats, then import that data in other programs, such as Google Earth. These are just a few basic cases though, and throughout this chapter, you'll see how powerful the vector layer can be.
Another fundamental difference is that the vector layer is a client side layer. This means that interaction with the actual vector data happens on the client side. When you display vector data, for instance, its visual representation is generated by OpenLayers in response to the rules you define in your code. Raster data looks the way it looks and you can't easily change the color of roads or decide not to display buildings. When you navigate your map, vector data is generally already available and can be displayed immediately. With raster layers, each time you zoom in or out, OpenLayers has to request more image tiles from the server and wait for them to arrive unless they are already in the browser cache.
Since, in most cases, the vector data is loaded on the client side, presentation of and interaction with the vector layer usually happens nearly instantaneously. However, there are some practical limitations. Most vector sources make a lot more data available than can be loaded and rendered in the browser. Network bandwidth, memory and processor speed all have limits and, although computers and web browsers are getting faster and more powerful all the time, there are always practical boundaries to what can be done with vector data. The OpenLayers developers have worked hard to push these boundaries and many things that were impossible to consider even two years ago are now practical—we'll highlight some best practices along the way.
In computer graphics, there are essentially two types of data: raster and vector. The majority of image files—.jpeg, .png, .gif, and other bitmap image formats—are raster images. A photograph, for example, is a raster image. A raster image is a rectangular grid—like graph paper—of color information, and each color point in an image is called a pixel. When you look at a raster image on your computer, it interprets the color information in each pixel and maps this to physical pixels on your screen. As you zoom in on a raster image, there is a point at which each pixel in the raster image can be rendered to a single physical pixel on your screen. This is referred to as the resolution of the image, the most information that the image can accurately represent. As you zoom in further, each pixel in the raster image is drawn into more than one physical pixel and the quality of the image starts to degrade—we say it is pixelated. When you zoom out, each pixel in the raster image requires only part of a physical pixel on the screen and so several adjacent raster pixels are combined to compute a color to display in the physical pixel.
A vector, on the other hand, encodes information about how to draw a particular shape. There might be many ways of representing vector shapes—a straight line can be represented as a starting point and an ending point, or a starting point, direction and distance. When you display a vector on a computer screen, it has to be converted from its encoded format into colors for physical pixels—a process called rasterization. However, because the computer has detailed instructions on how to draw the shape, it can choose a resolution that exactly matches the physical pixels of your computer display every single time it draws it, regardless of how much you zoom in or out. In fact, the same vector information can be drawn on any other screen at the appropriate resolution. For this reason, we often call vector data resolution independent.
Here is an example of how a circle appears when drawn as a vector and a raster. The left side is rendered as a vector and the right side is rendered as a raster. When the image is zoomed, the vector remains sharp and clear but the raster becomes blocky.
We'll begin by creating a basic vector layer. Start a new page using the sandbox template. We'll use some existing vector data (found in the assets/data folder of the sample code that comes with this book) that contains polygons outlining countries of the world and display it in a map:
<script> tag to create our vector layer:var vectorSource = new ol.source.GeoJSON({
projection: 'EPSG:3857',
url: '../assets/data/countries.geojson'
});
var vectorLayer = new ol.layer.vector({
source: vectorSource
});var center = ol.proj.transform([0, 0], 'EPSG:4326', 'EPSG:3857');
var view = new ol.View ({
center: center,
zoom: 1,
});map variable and add the vector layer the same way you would add any other layer:var map = new ol.Map({
target: 'map',
layers: [vectorLayer],
view: view
});Zoom in on the countries and notice how quickly the map zooms and how sharp the outlines of the countries remain.
We just demonstrated how easy it is to incorporate vector data into a map. First, we created a source, specifically one that knows how to read features in the GeoJSON format. We told the source where to find the data (its url property) and what projection we need the data to be in (The view's projection is EPSG:3857, a standard Spherical Mercator projection used in many common commercial maps such as Google and Bing. We'll discuss projections in more detail in Chapter 7, Wrapping Our Heads Around Projections). Next, we created a vector layer and provided it with the source we just created. The view object centers the map at 0 degrees latitude and longitude, and we added all of this to the map in the same way we've used in all the other examples.
Vector layers tend to be very quick, as the data can be stored entirely on the client. Interaction happens instantly, which can greatly enhance the user's experience. Which of the following would be good choices for using vector layers?
Now, before we jump into more advanced uses of the vector layer, first, let's see how it actually works.
There are five things we need to cover to understand how the vector layer works:
Recall from Chapter 3, Charting the Map Class that OpenLayers supports three separate renderer technologies, WebGL, Canvas, and DOM. When OpenLayers draws the layers in a map, it uses one of these renderers to do the actual work of drawing. The renderer requests data from the layer's source for the area being displayed, and then transforms this into the final map image. For raster layers, images are fetched from a remote server and are composited into a Canvas element (for WebGL and Canvas renderers) or <img> tags (for the DOM render). Vector layers work in the same way, but are only supported by the Canvas renderer at the time this book was written. The renderer asks the layer's source to fetch the data it needs and then applies algorithms for rendering the vector data to the Canvas element. As we mentioned earlier, the vector data is not just an image. It can contain additional information such as the coordinates of the data. This additional information can be used for styling features (which we'll cover in detail in the next chapter) or to provide interactive feedback (as we'll see in an example later in this chapter).
The vector layer, by itself, is a layer like the other layers we've discussed so far. To really get the most out of the vector layer class, we'll be working mostly with other classes. For example, to get a basic example working (like the first one in this chapter), we will make use of at least one other class—the ol.source.Source class—to read features from a particular vector format. In fact, under the hood, OpenLayers was using a format, features, geometries, and some styles for this example. All of this happens automatically for the simplest case of drawing some vector data, but in practice, it's necessary to understand how these other classes function as well to get the most out of OpenLayers.
Before we get into too much detail, let's cover the vector layer class, ol.layer.Vector, itself. It is a direct subclass of ol.layer.Layer and inherits its methods and observable properties. Refer to Chapter 2, Key Concepts in OpenLayers if you need a refresher on those methods.
The ol.layer.vector class is used to create a vector layer instance:
var layer = new ol.layer.vector(options);
The options can include all the options for ol.layer.Layer (see Chapter 4, Interacting with Raster Data Source for a refresher if necessary) plus the following additional options that are specific to a vector layer:
The vector layer class also has several methods in addition to those it inherits from ol.layer.Layer.
The vector layer class by itself isn't very useful—it relies on other classes to do all the interesting work. Let's look at the source class, ol.source.vector, and its subclasses first as it's the only thing that is absolutely needed to get a working vector layer.
The vector source class is named after its purpose—to be a source of vector features for a vector layer. It is responsible for fetching features when needed, providing them to the vector layer for rendering, and also for retrieving features based on various criteria. We won't actually use the vector source class as it is a base class for the classes we'll actually be using, such as ol.source.GeoJSON in the preceding example. The following diagram shows how the vector source classes fit together in the OpenLayers architecture:
As you can see, there are quite a few classes in the OpenLayers library that deal with vector formats. The classes that you can create new objects from are highlighted in green. We'll briefly describe each class before we get into more detail:
ol.source.Vector: This is the base class for all vector sources. It provides a common API for accessing features in a vector source.ol.source.Cluster: This source automatically groups features together when they are close to each other, and represents the group as a single feature. The cluster source uses another vector source to access features to be clustered.ol.source.FormatVector: This class provides a common API for sources that use a format for reading and writing features. You cannot create an instance of this class.ol.source.ServerVector: This source uses a loader function that can retrieve vector features on the fly from a server, for example, a WFS (Web Feature Service) server.ol.source.TileVector: This source loads vector features in batches based on a tiling scheme similar to how raster layers load image tiles.ol.source.StaticVector: This source loads vector features from a file in a specific format. It is considered static in that all the available features are read from the file when it is loaded. Although you can create an instance of this class, you will normally use one of the format-specific subclasses.ol.source.GeoJSON: This source reads a file containing features in the GeoJSON format, a standardized encoding of geographic features using JSON.ol.source.GPX: This source reads a file containing features in the GPX (GPS Exchange format), a common file format for GPS devices.ol.source.IGC: This source reads a file in the IGC (International Glider Commission) format, a standard format for recording glider flights.ol.source.KML: This source reads a file in the KML (Keyhole Markup Language), an XML-based format used in Google Maps and related products.ol.source.OSMXML: This source reads a file using the Open Street Map XML schema.ol.source.TopoJSON: This source reads a file encoded in JSON using the TopoJSON specification, an extension of GeoJSON that encodes topology information.The vector source class, ol.source.vector, not only provides a common API for all vector sources but is also be instantiated and used directly. All of its subclasses primarily deal with actually retrieving vector features, but all the useful methods for actually interacting with features once they have been processed exist in this class. You can use this class if you have an existing set of vector features or are getting features in some way not directly supported by the subclasses. Some examples might include:
The vector source constructor takes the following options:
The vector source also provides the following methods:
The vector source can trigger the following events:
There are two subclasses of the vector source, FormatVector and Cluster. The FormatVector class is the basis for many subclasses that obtain features by reading them from some specifically formatted data such as GeoJSON or KML. We'll look into these classes shortly, but first let's take a brief look at the cluster source.
The cluster source dynamically groups (or clusters) features that are near each other based on the current resolution, or zoom level, of a map's view and represents those groups as individual features. It does this by finding features within a certain distance of each other and creating a new feature to represent them. The new feature contains a reference to the original features that are represented by the clustered feature.
Creating a cluster source is the same as creating a vector source except the constructor options include two additional properties:
The cluster source may be used with any type of feature, but it is typically used with a set of point features. This example illustrates using the cluster source with some randomly generated points that are included with the sample files for this project in assets / data / cluster.geojson. We'll first show the original data, then modify the example to use the cluster source. The following are the steps:
var originalSource = new ol.source.GeoJSON({
url: '../assets/data/cluster.geojson'
});var originalLayer = new ol.layer.vector({
source: originalSource,
});layers array:var map = new ol.Map({
target: 'map',
layers: [vectorLayer, originalLayer],
view: view
});originalLayer:var clusterSource = new ol.source.Cluster({
source: originalSource
});
var clusterLayer = new ol.layer.vector({
source: clusterSource,
});originalLayer with clusterLayer in the map's layers:var map = new ol.Map({
target: 'map',
layers: [vectorLayer, clusterLayer],
view: view
});In this example, we discovered how the cluster source works. First, we created a vector layer containing about 5000 points and displayed it on the map. As we saw, it's very hard to see these points when zoomed out. Next, we added a cluster source and a new layer based on the cluster source. Now the number of points displayed on the map changes dynamically as we zoom in and out, and the number of points on the map at any one time is much more manageable.
Typically, when displaying a cluster of features, we would represent the cluster differently depending on how many features are in the cluster—perhaps by adding a text label or changing the size of the point. We'll revisit this example in the next chapter and deal with the styling options then.
The other direct subclass of the vector source is the FormatVector source. This class cannot be directly created, rather it is an abstract class that adds a single method, readFeatures, to the API of all its concrete subclasses. This means that all the other source classes provide a readFeatures method that gets features from some data structure such as a string, array, or JavaScript object. The type of the data structure is determined by the format.
A feature format is responsible for reading features from a structured format that organizes spatial features in a structured way. Each feature format is based on a recognized specification document that defines how that format represents the geospatial data it contains. The feature formats are organized into three distinct groups:
There are two JSON-based formats, GeoJSON and TopoJSON. The GeoJSON format defines a schema used to represent spatial data as JSON data. JSON looks a lot like JavaScript object literals, but it has specific rules for formatting. The main differences between JSON and JavaScript object literals are:
To find out more about the JSON format, see http://www.json.org.
A GeoJSON file may contain either a Feature or FeatureCollection. A Feature is represented in JSON as an object with three keys: type, geometry, and properties. The type is always "Feature". The geometry is an object with a type and coordinates, where the type can be one of "Point", "MultiPoint", "LineString", "MultiLineString", "Polygon", "MultiPolygon", or "GeometryCollection", and the coordinates are an array containing the coordinates in a structure dependency on the type. The properties key is an object that contains keys and values representing nonspatial data associated with the feature.
A FeatureCollection is represented as an object containing two keys: type and features. The type is always "FeatureCollection" and features is an array of GeoJSON features structured as in the preceding paragraph.
An example of a Feature looks like the following:
{
"type": "Feature",
"geometry": {
"type": "Point",
"coordinates": [125.6, 10.1]
},
"properties": {
"name": "Dinagat Islands"
}
}A FeatureCollection looks like the following:
{ "type": "FeatureCollection",
"features": [
{ "type": "Feature",
"geometry": {"type": "Point", "coordinates": [102.0, 0.5]},
"properties": {"prop0": "value0"}
},
{ "type": "Feature",
"geometry": {
"type": "LineString",
"coordinates": [ [102.0, 0.0], [103.0, 1.0], [104.0, 0.0], [105.0, 1.0] ]
},
"properties": {
"prop0": "value0",
"prop1": 0.0
}
},
{ "type": "Feature",
"geometry": {
"type": "Polygon",
"coordinates": [ [ [100.0, 0.0], [101.0, 0.0], [101.0, 1.0],[100.0, 1.0], [100.0, 0.0] ] ]
},
"properties": {
"prop0": "value0",
"prop1": {"this": "that"}
}
}
]
}As you might imagine, this structure is quite easy to use with JavaScript applications and GeoJSON is a popular format for web mapping applications. Read more about this format at http://geojson.org.
The TopoJSON format is an extension of the GeoJSON format that encodes topology. A discussion of topology is beyond the scope of this book; briefly, topology defines rules for representing spatial features in a region. The most common example of this is adjacent polygons sharing a common border. Topological rules require two adjacent polygons sharing a common boundary will share the points that define the common boundary between them such that moving one point changes the boundary of both polygons simultaneously. You can find out more about the TopoJSON format at https://github.com/mbostock/topojson.
The XML formats are based on XML, a metalanguage that describes structured content using tags denoted by the < and > signs. HTML, which we've seen many times in this book already, looks like XML, and the tags in HTML instruct a web browser how to render the page.
Most HTML is not valid XML. HTML does not follow the strict formatting rules required by XML— particularly, there are many tags in HTML that do not require a closing tag. The <img> tag is an example of this. There is a variant of HTML, called XHTML, that defines a valid XML schema for HTML. While there are some advantages to using XHTML, it has not gained widespread adoption because it is more work for developers to ensure a valid document and the perceived benefits are low.
Structured documents based on XML have a specific set of tags and a set of rules on tag content and nesting. Collectively, the tags and rules are called a schema. There are several geospatial formats based on XML and each defines a specific schema. The schema allows developers to write code to parse the spatial information out of the structured document in the same way that the GeoJSON format proscribes a specific JSON object structure.
The XML-based formats are GML, GPX, KML, OSM XML, and WFS. Let's describe each briefly:
While all the formats we've discussed so far can be represented in a plain text file, the text formats differ in that they are not based on standard representation. Rather, they define their own unique structure. There are currently two text formats supported by OpenLayers—IGC and WKT.
Now, we know something about formats, let's look at the next class in the vector source hierarchy—StaticVector. OpenLayers provides the StaticVector source and some format-specific subclasses designed to simplify loading vector features from the supported formats. They are as follows:
ol.source.GeoJSONol.source.TopoJSONol.source.GMLol.source.GPXol.source.KMLol.source.OSMXMLol.source.IGCol.source.WKTEach of these is a vector source that works in exactly the same way, the only difference between them is the format they use internally to read features.
The StaticVector source, as the name suggests, loads a set of vector features from a source that does not change. This means the features are loaded, and parsed, just once, The actual features in the source never change in response to panning or zooming. In all other respects, the StaticVector source works in the same way as the other vector sources.
You can create an instance of StaticVector directly and pass it a format and a source of data, or you can use one of the format-specific subclasses. Let's look first at creating StaticVector instance. Note that several of the options only apply for particular formats, as noted in the description.
It is worth emphasizing at this point that for all the OpenLayers formats, the data stored in files are actually text files. Loading these files in a browser will result in the data being loaded as a JavaScript string. Some libraries will automatically convert data from its text-based representation into another type of object for you. For instance, loading XML data from a text file will often give you a reference to a Document Object after it is loaded. In OpenLayers, every format supports loading data from a string value, but the string must contain data that is in the structure expected by the format.
The actual format-specific source classes generally work the same way and support only those options that make sense from the StaticVector class. However, there are some important differences that are worth noting. All the following source constructors support the attributions, logo, text, url, and urls options listed in the preceding table. For the sake of brevity, these options have been omitted from the following tables.
The two JSON formats, ol.source.GeoJSON and ol.source.TopoJSON, support the two additional constructor options. These are shown in the following table:
The GPX format constructor has no additional options, but will read data from the node and doc options.
The KML format specification requires that the geometry data for features be represented in EPSG:4326. In addition to supporting the node and doc options, the KML format supports two other options. Refer to the following table:
Time to put our new knowledge into action. There are sample files included with the book's code samples in assets / data in each of the formats discussed earlier. Try adding each of them to a map. Remember, you will need to create an appropriate source and a vector layer, and add the vector layer to the map. As with earlier examples, you should be able to use the url option to load the data without having to load and parse it yourself.
The ServerVector source requests features from a server by sending the geographic coordinates of some region it needs features for to a server. As you might imagine, there are many different ways of doing this based on what a particular server understands. Each server has its own unique language for requesting features. Many servers implement a common language based on an open standard called WFS (Web Feature Service) that can simplify the job. Even so, there are different versions and different flavours of WFS that make it difficult to support them all. To avoid this problem, OpenLayers provides a generic mechanism for requesting features for the ServerVector source; specifically it requires that you implement the loader function yourself!
Creating a loader function isn't as hard as it might sound, let's walk through a concrete example that loads features from a WFS server. In this example, we will be using the popular jQuery library to help us load data. If you are not familiar with jQuery, see http://jquery.com for more information.
<script> tag to load jQuery:<!doctype html>
<html>
<head>
<title>vector Examples</title>
<link rel="stylesheet" href="../assets/ol3/ol.css" type="text/css" />
<link rel="stylesheet" href="../assets/css/samples.css" type="text/css" />
</head>
<body>
<div id="map" class="map"></div>
<script src="../assets/ol3/ol.js" type="text/javascript"></script>
<script src="//code.jquery.com/jquery-1.11.0.min.js"></script>
<script>
var tiledRaster = new ol.layer.Tile({
source: new ol.source.OSM()
});
var center = ol.proj.transform([-72.6, 41.7], 'EPSG:4326', 'EPSG:3857');
var view = new ol.View({
center: center,
zoom: 12,
});
var map = new ol.Map({
target: 'map',
layers: [tiledRaster],
view: view
});
</script>
</body>
</html>Next, we'll need to create a style object for displaying our vectors. Don't worry too much about what this is, we'll cover it in detail in Chapter 6, Styling Vector Layers. Add this after the tiledRaster and before the center:
var fill = new ol.style.Fill({
color: 'rgba(0,0,0,0.2)'
});
var stroke = new ol.style.Stroke({
color: 'rgba(0,0,0,0.4)'
});
var circle = new ol.style.Circle({
radius: 6,
fill: fill,
stroke: stroke
});
var vectorStyle = new ol.style.Style({
fill: fill,
stroke: stroke,
image: circle
});vector_template.html and make a copy of it to use for the rest of this example. We'll be using vector_template.html as the starting point for several examples.vectorStyle object, which will handle loading features from the remote server:var vectorLoader = function(extent, resolution, projection) {
var url = 'http://demo.boundlessgeo.com/geoserver/wfs?service=WFS&' +
'version=1.1.0&request=GetFeature&typename=osm:builtup_area&' +
'outputFormat=text/javascript&format_options=callback:loadFeatures' +
'&srsname=EPSG:3857&bbox=' + extent.join(',') + ',EPSG:3857';
$.ajax({
url: url,
dataType: 'jsonp'
});
};
var loadFeatures = function(response) {
var features = vectorSource.readFeatures(response);
vectorSource.addFeatures(features);
};loadFeatures function:var vectorSource = new ol.source.ServerVector({
format: new ol.format.GeoJSON(),
loader: vectorLoader,
strategy: ol.loadingstrategy.createTile(new ol.tilegrid.XYZ({
maxZoom: 19
})),
projection: 'EPSG:3857',
});
var serverVector = new ol.layer.vector({
source: vectorSource,
style: vectorStyle
});serverVector layer to the map's layers:var map = new ol.Map({
renderer: 'canvas',
target: 'map',
layers: [tiledRaster, serverVector],
view: view
});We just created a vector layer that reads features from a remote WFS server as the map is panned and zoomed. A lot just happened, so let's review each step in detail.
In step 1, we set up a new OpenLayers application using the same structure as we've used for all the other examples so far. Nothing new here, except we've chosen a center for the map view somewhere in the north eastern United States and named our base layer tiledRaster to help differentiate it from the vector layers we will be working with.
In step 2, we created a simple vector style object to use with all our vector layers. A vector style consists of several components, in this case, we are defining the style to use for fill (polygons), stroke (lines), and image (points). The color for each is defined using the rgba() syntax, which stands for red, green, blue, and alpha (opacity). In this case, we are using a simple black color and 20 percent opacity. We'll cover styles in much more detail in the next chapter.
Step 4 is really the heart of this example. First, we defined a vectorLoader function. This function is used by ol.source.ServerVector to fetch features from a remote server. The vectorLoader function declares a URL that points to a WFS server. You might think the URL looks a bit complicated, and you are right. For now, just trust that it does the right thing, which is to ask the server for all the vector features contained within the current extent. The jQuery ajax function is used to actually trigger loading the URL. The jsonp data type tells jQuery to request the data by inserting it as a <script> tag, and the callback option in the URL identifies the function that will be executed when the <script> tag is loaded; in this case, the loadFeatures function.
The loadFeatures function takes the features provided by the server, reads them using the vector source (which has a GeoJSON format for parsing the data), and adds them to the layer.
In step 5, we combined all the previous pieces to create the source and layer objects. To define the source, we used ol.source.ServerVector and provided it with a format (GeoJSON in this case), the loader function we defined in the previous step, a loading strategy, and a projection. We'll discuss the loading strategy a bit later. Finally, we created the actual layer object using ol.layer.vector and provide it with our source and style.
After we added this to the map's layers in step 5, we can see it in action. Every time the map is panned or zoomed, the vector layer checks its source for features. The ServerVector source requests data from a remote server using a function that we provide. This gives you a lot of flexibility, but also means that you have to understand how to load data from a remote server. Fortunately, libraries such as jQuery have very good convenience methods for doing just this. The ServerVector source uses its loading strategy to decide how to divide up the requests to the server and passes the appropriate parameters to your loader function. We'll talk a bit more about loading strategies in some time. Once the features are loaded, you can parse them and add them to the source directly. The vector layer then draws the features using the provided style.
To see what happens when features are requested from the server, open Web Inspector, switch to the Network tab, and make sure All is selected, then reload the page.
You can identify the feature requests because they start with wfs?service=WFS. Click on a request to view its response. Notice how some requests have no features, and some have features. Notice how the response is formatted—it looks like a JavaScript function call to loadFeatures() with an object literal as the argument. The loadFeatures() function is the one we specified and that we implemented. This is an example of how jsonp works.
Now that we've seen it in action, let's review the constructor options for a ServerVector source:
The final vector source is TileVector. This source loads features by requesting them in batches based on a tile grid exactly the same way that the raster sources work. The job of a tile grid is to divide the world up into rows and columns and convert geographic coordinates for the current view into row and column references.
If you were following closely in the previous section, you might wonder how TileVector is different from a ServerVector configured with a loading strategy based on ol.loadingstrategy.createTile. The main differences are as follows:
TileVector source has its own loading functionality—you do not need to provide one.TileVector source uses the row, column, and zoom level rather than geographic coordinates to request features from the server.TileVector source provides convenient options for working with tile-based servers.There are several ways of producing and serving vector tiles. One way is to use a program that splits vector data up into tiles based on a particular tile grid and save the tiles to disk in a directory structure based on the zoom level, column,and row. Another way is to use a server that can split up vector data on the fly. The OpenStreetMap wiki has a page dedicated to vector tiles and related resources at http://wiki.openstreetmap.org/wiki/vector_tiles.
The use of a tile grid removes the need to implement a loader function; so, there is less work involved in setting it up. Let's see how easy it is to use the TileVector source:
serverVector layer is defined:var tiledSource = new ol.source.TileVector({
format: new ol.format.TopoJSON({
defaultProjection: 'EPSG:4326'
}),
projection: 'EPSG:3857',
tileGrid: new ol.tilegrid.XYZ({
maxZoom: 19
}),
url: 'http://{a-c}.tile.openstreetmap.us/vectiles-water-areas/{z}/{x}/{y}.topojson'
});var tiledVector = new ol.layer.vector({
source: tiledSource,
style: vectorStyle
});tiledVector layer instead of the serverVector layer:var map = new ol.Map({
renderer: 'canvas',
target: 'map',
layers: [tiledRaster, tiledVector],
view: view
});As you can see, the TileVector source is quite a bit simpler than the ServerVector source. For the TileVector, we provided a format, a projection to convert vector features into (typically, the projection used with the map's view), a tileGrid, and a url. The format specifies what format the features will be in, which tells OpenLayers how to read features from the tiles sent by the server. It also can specify the projection used for the features. In this example, the server provides files in the TopoJSON format, a variant of GeoJSON that encodes topology, in a projection of EPSG:4326 (latitude and longitude). The tileGrid tells OpenLayers how to convert geographic coordinates into rows and columns that the server will understand. You can't just use any tileGrid with any server—it's very important that the tileGrid matches what the server expects. The XYZ tile grid, however, is a very common grid used by most tile servers, both raster and vector. The url property tells OpenLayers where to request each tile from. There are some special placeholders that you can put into a url that OpenLayers will replace on the fly when requesting a specific tile:
{z}: This will be replaced by the current zoom level.{y} or {-y}: This will be replaced by the row of the tile. The {-y} option inverts the y axis, this is needed for some servers.{x}: This will be replaced by the column of the tile.After defining the source, it can be used with the vector layer in the same way the ServerVector source was used, and the layer is added to the map in the same way too.
The result is that when you load the browser, OpenLayers will request vector tiles from the server and render them using the style we defined.
To see what happens when vector tiles are requested, open Web Inspector, switch to the Network tab, and make sure All is selected, then reload the page. You will see the requests that fetch the vector tiles end with the .topojson extension:
Click on some requests and view the responses. Do you see the difference between this and the ServerVector responses? Here, the features are returned directly as a JavaScript object while in the previous example, they were wrapped in a JavaScript function call.
Look through the requests for the raster tiles they are the ones that end with .png. You should be able to find a raster tile for each vector tile because they are using the same tileGrid.
One of the side effects of using vector tiles is that vector features such as lines and polygons may cross more than one tile and will be split up into different features. If you are rendering polygons with a stroke, or lines with dashed styles, you will see some interesting effects at the edges of the tile boundaries. We can see an example of this when first loading the TileVector, in this particular case. The river that runs vertically through the center of the map has several horizontal lines in it that coincide with the tile boundaries. Line features are typically less affected and point features shouldn't be affected at all. You can use polygon features, but you will probably want to render a fill style only to avoid artifacts at the tile boundaries.
Now, we've seen it in action, let's review all the options available when using a TileVector source:
Loading static sources programmatically is very useful, but let's say you want to look at a new GeoJSON file you just found. Opening up your text editor and coding up a quick viewer is pretty easy, but it takes some time, and perhaps, you'll need to check the API documentation (or this chapter!) to recall the exact details. Wouldn't it be nice if you could just drag your new GeoJSON file onto a map and view it without writing any code? Guess what, you can!
vector_template.html file and add a DragAndDrop interaction after the vectorStyle is defined:var dragAndDrop = new ol.interaction.DragAndDrop({
formatConstructors: [
ol.format.GPX,
ol.format.GeoJSON,
ol.format.IGC,
ol.format.KML,
ol.format.TopoJSON
]
});DragAndDrop interaction will fire an event that can be used to actually add the features to the map:dragAndDrop.on('addfeatures', function(event) {
var vectorSource = new ol.source.vector({
features: event.features,
projection: event.projection
});
map.getLayers().push(new ol.layer.vector({
source: vectorSource,
style: vectorStyle
}));
view.fitExtent(vectorSource.getExtent(), map.getSize());
});<script> tag.map.addInteraction(dragAndDrop);
assets | data in your file browser and try dragging one of the vector files onto the map.With a few lines of code, we've created a pretty cool vector file viewer. Let's look at how we accomplished this.
In step 1, we created an instance of ol.interaction.DragAndDrop. This class turns the map into a drop target. When you drag a file from the operating system onto a drop target, the browser emits an ondrop event. The DragAndDrop interaction listens for this browser event and attempts to read features from the file using one of the formats. The DragAndDrop interaction allows you to customize the list of formats to be tried through the formatConstructors option. In this case, we've added all the formats.
In step 2, we add a listener for the DragAndDrop interaction's addfeatures event. This event is triggered when the interaction parses features from a file dropped on the map. The event passed to our handler gives us an array of features and the projection of the features. We take the array of features passed to the event handler and create a new vector source with the features and the projection of the features, then create a new vector layer with this source and our style and add it to the map.
The last thing to do is make sure that the map knows about our interaction, which we did in step 3.
We've been using feature objects throughout the chapter so far without really talking about the Feature class itself. We also hinted at the Geometry class, but we haven't gone into any detail so far. This section will cover both classes in a bit more detail so that you can gain a bit more confidence working with them. Don't worry—it's easy, you've already been exposed to both classes.
Before we get into the Feature class, we should go over the Geometry class, as it's used to create the actual geometry objects that make up a feature object.
Although it is perfectly valid to create features without geometries, they can't be represented on a map. Therefore, the Geometry class is, from the map's point of view, the foundation of the feature object. The Feature class uses the Geometry class to store geometry information about the feature.
However, what exactly is the Geometry class? In a nutshell, it stores geographic information in the form of one or more coordinate pairs. Remember the examples from The feature formats section of this chapter where we added features using the Format subclasses? We briefly saw geometries while reprojecting the features into the map view's projection:
for (var i = 0, ii = features.length; i < ii; ++i) {
var feature = features[i];
var geometry = feature.getGeometry();
geometry.applyTransform(transform);
}In this example, we will transform the feature's geometry from its original projection into the map view's projection so that the loaded feature will align with the raster base map correctly. This is just one part of what we can do with geometries.
When working with the Geometry class, we always use one of its subclass. What do we mean? Think about the Format classes we've used earlier in this chapter—we've talked about format but actually used subclasses of the base Format class the entire time (ol.format.GeoJSON, ol.format.KML, and so on are all subclasses of the ol.format.Format class).
We mentioned before that a geometry object stores geographic information as coordinate pairs. A coordinate pair is simply an array of two, three, or four numbers (we'll get to this in a moment) representing a single location on the earth in a given projection. You're already familiar with coordinates, it's the value that we use to set the center of a view in all of the examples. In the OpenLayers documentation, you'll see coordinates represented with the type ol.Coordinate. This looks like a classname, but really it's a type definition specifying an array of numbers representing a location. There are four different ways, called layouts, of representing a coordinate:
To get maximum performance, OpenLayers' Geometry classes store coordinates in so-called flat arrays, meaning all the values of all the coordinates are stored in a single array of numbers. Because the individual coordinates can have two, three, or four values, all the Geometry classes need to know the layout of the coordinates they are storing.
Before we cover the subclasses, let's quickly go over some of the methods available to all of the subclasses via the base Geometry class. All these methods are available to any Geometry subclass, as all the subclasses inherit from the Geometry class:
There are two direct subclasses of ol.geom.Geometry—ol.geom.SimpleGeometry and ol.geom.GeometryCollection. The GeometryCollection class, as the name suggests, treats several geometries as a single geometry object. The SimpleGeometry class is the base class for geometries we can actually use to represent specific shapes—points, lines, polygons, and so on. Let's look at the SimpleGeometry class and its subclasses first.
We don't use the SimpleGeometry class directly, but it is the base class for all the basic geometry types that OpenLayers understands. We'll look first at the methods provided by SimpleGeometry to all the subclasses, then look at the subclasses themselves:
|
Method |
Parameters |
Description |
|---|---|---|
|
|
| |
|
|
| |
|
|
|
This returns the layout (XY, XYZ, XYM, or XYZM) of the geometry. |
The Point class represents a single point, and MultiPoint is a collection of points. A Circle class is a special case of the Point class that includes a radius property. All take coordinates as the first argument to the constructor. Both Point and Circle expect a single coordinate, while MultiPoint expects an array of coordinates. A Circle takes a second argument, the radius. All take an optional final argument, the layout, which defaults to XY. Here are some examples of creating each type:
var point = new ol.geom.Point([1, 2]); var multipoint = new ol.geom.MultiPoint( [ [1,2], [2,3] ]); var circle = new ol.geom.Circle([1,2], 2);
The LineString class represents a sequence of two or more coordinates that are connected to form a line. As with MultiPoint, MultiLineString is a collection of lines. A LineString is constructed with an array of coordinates, while MultiLineString is created with an array of arrays of coordinates. Both take the layout as an optional final argument, the layout, which defaults to XY. Here are some examples of each:
var line = new ol.geom.Line([ [1, 2],[2,3],[3,4] ]); var multipoint = new ol.geom.MultiPoint([ [ [1,2],[2,3],[3,4], [ [4,5],[5,6] ] ]);
The Polygon class is composed of one or more LinearRing classes. A linear ring is a sequence of three or more coordinates that forms a closed ring, that is, the last coordinate is the same as the first coordinate. When a polygon contains multiple linear rings, the first is called the outer ring and the rest are interior rings. Interior rings define holes in the polygon. And as you might expect, a MultiPolygon is a collection of polygons. Let's see how to make a linear ring and polygon. As with the other geometry types, the layout can be specified as an optional last argument:
var linearRing = new ol.geom.LinearRing([ [1,2],[2,3],[3,4],[1,2]); var polygon = new ol.geom.Polygon([ [ [-20,-20],[-20,20],[20,20],[20,-20],[-20,-20] ] ]);
The last example only used one linear ring for the polygon. Let's use the Web Inspector's console to create a polygon and then add a linear ring to see what happens. Open the vector_template.html file in your browser and then open the Web Inspector's Console. We'll be typing the commands into the console directly and observing the result on the map.
var polygon = new ol.geom.Polygon([ [ [-20,-20],[-20,20],[20,20],[20,-20],[-20,-20] ] ]);
polygon.transform('EPSG:4326', 'EPSG:3857');var source = new ol.source.vector({
features: [new ol.Feature(polygon)],
projection: 'EPSG:4326'
});
var layer = new ol.layer.vector({
source: source,
style: vectorStyle
});map.addLayer(layer);
var linearRing = new ol.geom.LinearRing([ [-10,-10],[10,-10],[10,10],[-10,10],[-10,-10] ]);
linearRing.transform('EPSG:4326','EPSG:3857');
polygon.appendLinearRing(linearRing);We've just seen linear rings in action. When you create a polygon, the first linear ring is the outer boundary of the polygon and any other linear rings you create define holes in the outer ring.
Try the last example again, only this time add two or more linear rings to the polygon and observe what happens.
The GeometryCollection class, as the name suggests, is a collection of geometry objects. Unlike the MultiPoint, MultiLine, and MultiPolygon classes, a GeometryCollection can contain any type of geometry. You can create an instance of ol.geom.GeometryCollection by passing an array of geometries to it, for example:
var geomCollection = new ol.geom.GeometryCollection([geom1, geom2, geom3]);
Although you can use a GeometryCollection as an ol.geom.Geometry class anywhere, you can't use any of the SimpleGeometry methods on a GeometryCollection. Instead there is a separate API for accessing the geometries managed by the collection.
To complete our discussion of vector layers, we'll finish with the Feature class. We've already seen features in action—in fact, you can't display vector data without them—but we haven't really talked about what they are and what they do.
In the previous section, we explored the various OpenLayers Geometry classes. They contain the geospatial coordinates that represent a particular shape. However, to display a shape on the map, we need to work with features. When we model things in the real world and build data structures to represent their position, we also want to capture other information about them. A polygon representing the outline of a building is an interesting thing to display on a map, but when we click on it, it's pretty reasonable to expect to get some information about the building such as its address, its height, and building type (that is, commercial, industrial, or residential). These nonspatial properties of a feature can also be used to change the style of a shape on the map.
A feature combines these two concepts—the spatial location of a thing, and nonspatial properties of the thing that we are interested in.
Creating a new feature is pretty straightforward; you just need to provide a geometry object (to create a feature with no extra properties) or an object literal containing the geometry and other properties of the feature. For instance, given a point geometry, we can construct a simple feature like this:
var point = new ol.geom.Point([x, y]); var feature = new ol.Feature(point);
To create a feature with information associated with the point, we do it this way:
var feature = new ol.Feature({
geometry: point,
name: 'My Cottage'
});By convention, the geometry key is used to specify the geometry associated with the feature. It's possible, though, to use a different key and the setGeometryName() method to change this. For our purposes, we'll be doing it the default way.
We refer to this extra, nonspatial information associated with a feature as properties. The properties associated with a feature are almost completely free-form and contain any value. The geometry property is really the only exception.
You might wonder why we care about the nonspatial properties of a feature since we can create a feature without them and things work just fine. There are essentially two reasons:
We'll look at the first case—interactive information—in the last example for this chapter. We'll explore the second case in the next chapter when we look more closely at styling vector layers.
Before we jump into our last example, let's look at the methods available on a feature object. Note that Feature class is a subclass of ol.Object and inherits all the Event class and KVO properties, methods, and events. We won't include them here, but if you need a refresher jump back to Chapter 2, Key Concepts in OpenLayers for a moment.
While we are not including the ol.Object methods in this list, it is relevant and important to note that feature properties are treated as object properties. This means that you can:
feature.set(key, value)feature.get(key)feature.on('change:<key>', observerFunction), where <key> is the name of a propertyfeature.setProperties(values)One last thing before our final example—feature objects can have their own styles. Normally, styles are assigned to the vector layer and all features that are rendered as part of that layer use the layer's style. It is possible, however, to assign styles to individual features and that style will be used instead of the layer's style. Because a feature comes from a source, and a source can be used for more than one vector layer, this means that a feature without a style can be rendered differently depending on the layer's style while a feature with a style will be rendered the same way regardless of the different styles on different layers.
To wrap up our chapter on vector layers, let's combine our knowledge of layers, sources, and features and create a small application that displays the name of a country when we hover over it with the mouse:
var source = new ol.source.GeoJSON({
projection: 'EPSG:3857',
url: '../assets/data/countries.geojson'
});
var countries = new ol.layer.vector({
source: source
});
var center = ol.proj.transform([0, 0], 'EPSG:4326', 'EPSG:3857');
var view = new ol.View({
center: center,
zoom: 1,
});
var map = new ol.Map({
target: 'map',
layers: [countries],
view: view
});pointermove event provided by the map object. If you don't remember anything about map events, review Chapter 3, Charting the Map Class:map.on('pointermove', onMouseMove);onMouseMove function:function onMouseMove(browserEvent) {
var coordinate = browserEvent.coordinate;
var pixel = map.getPixelFromCoordinate(coordinate);
var el = document.getElementById('name');
el.innerHTML = '';
map.forEachFeatureAtPixel(pixel, function(feature) {
el.innerHTML += feature.get('name') + '<br>';
});
}<div> element to display the country name, just after the <div> that holds the map:<div id="name"></div>
We've just saw how easy it is to interact in real time with vector data sources.
Step 1 just created a vector layer using a static GeoJSON source and added it to the map.
In step 2, we registered for the pointermove event. Recall from Chapter 3, Charting the Map Class that the pointermove event is fired by the map whenever the mouse moves over the map, and it passes a BrowserEvent object that contains, among other things, the map coordinate of the mouse position. Next, we implemented our event handler function. It gets the coordinate from the browser event and finds all features at that coordinate in our country layer's source. If there are any features, we get the name property from the first one and display this in the <div> added in step 4. You may wonder exactly how interactions with your map work behind the scene. Don't worry! We will see them more thoroughly in Chapter 8, Interacting with Your Map.
Vector layers are extremely useful for developing interactive web mapping applications. In this chapter, we've discussed what a vector layer is and its potential limitations. We've explored the various vector data sources that OpenLayers provides, and looked in detail at features and geometries. Through a series of examples, we learned how to load dynamic data from a remote server such as a WFS server, load tiled vector data, load vector data stored in static files, even by dragging them to the map from our file browser, work with geometries and features, and dynamically interact with vector data.
We covered a lot about vector layers, but we're not done yet. It's time to take control of the presentation of our vector data; so, keep reading to learn all about how to use styles with vector layers to really make your maps pop!
By now you should be getting pretty comfortable creating simple OpenLayers maps with a combination of raster and vector data. With raster data, there is no control over presentation, as the saying goes–what you see is what you get. Vector data, on the other hand, gives you direct control over presentation details. We've already alluded to vector styles, and used them in the previous chapter. Now, it is time to take full control of how we present our vector data!
In the last chapter, you saw how powerful the vector layer can be. In this chapter, we'll go a bit deeper and talk about how to customize the appearance of the features within a vector layer. We'll explore the following:
So, what is a vector style? Quite simply, it is a set of instructions about how to draw graphic primitives—the points, lines, polygons, and text that make up our vector features. OpenLayers provides a basic default style that renders features in various shades of blue. While this is quite nice, it's probably not what you'll want to use all the time.
You've already seen an example of a basic vector style in the previous chapter. Let's review it here:
var fill = new ol.style.Fill({
color: 'rgba(0,0,0,0.2)'
});
var stroke = new ol.style.Stroke({
color: 'rgba(0,0,0,0.4)'
});
var circle = new ol.style.Circle({
radius: 6,
fill: fill,
stroke: stroke
});
var vectorStyle = new ol.style.Style({
fill: fill,
stroke: stroke,
image: circle
});This code defines specific rules for the fill, stroke, and image properties of a new ol.style.Style object. The fill and stroke rules specify a color and opacity using the RGBA (Red, Green, Blue, and Alpha) format. The circle style is a special style that draws points as circles of a specific radius with a fill and stroke property. Together, these form a style object that OpenLayers uses to determine how to draw a feature. The fill property is used for filling polygons and circles. The stroke property is used to draw the outline of polygons, lines, and circles. The image property is used for drawing points. There is also a text property that we haven't seen yet.
The vector layer's style property accepts three different ways of specifying styles:
ol.style.Styleol.style.Style instancesWe'll look at style functions in more detail in the second half of this chapter, but briefly, a style function is one that returns an array of style objects to be used for a specific feature and resolution. In combination with feature properties, a style function allows for the implementation of advanced custom styling. Before we can run, we'd better learn how to walk.
We'll start with an example that shows off most of the basic style properties. We'll start with a new HTML page setup the same way we usually start off.
sandbox template and add the standard setup for a map to the main <script> tag:var center = ol.proj.transform([0, 0], 'EPSG:4326', 'EPSG:3857');
var view = new ol.View({
center: center,
zoom: 1
});
var map = new ol.Map({
target: 'map',
view: view
});var countries = new ol.layer.Vector({
source: new ol.source.GeoJSON({
projection: 'EPSG:3857',
url: '../assets/data/countries.geojson'
})
});
var map = new ol.Map({
target: 'map',
layers: [countries],
view: view
});var timezones = new ol.layer.Vector({
source: new ol.source.KML({
projection: 'EPSG:3857',
url: '../assets/data/timezones.kml'
})
});var countryStyle = new ol.style.Style({
fill: new ol.style.Fill({
color: [203, 194, 185, 1]
}),
stroke: new ol.style.Stroke({
color: [177, 163, 148, 0.5],
width: 2
})
});
var timezoneStyle = new ol.style.Style({
stroke: new ol.style.Stroke({
color: [64, 200, 200, 0.5],
}),
text: new ol.style.Text({
font: '20px Verdana',
text: 'TZ',
fill: new ol.style.Fill({
color: [64, 64, 64, 0.75]
})
})
});style property to each of the vector layers so they know which style to use. Also, we'll need to tell the KML source not to extract the default feature styles stored in the KML document:var countries = new ol.layer.Vector({
source: new ol.source.GeoJSON({
projection: 'EPSG:3857',
url: '../assets/data/countries.geojson'
}),
style: countryStyle
});
var timezones = new ol.layer.Vector({
source: new ol.source.KML({
projection: 'EPSG:3857',
url: '../assets/data/timezones.kml',
extractStyles: false
}),
style: timezoneStyle
});With this example, we are illustrating some of the basic styling capabilities of OpenLayers. We combined two static vector sources—countries and time zones—and some simple styles to create our map.
Step 1 set up the same structure we've been using for all our examples. In step 2, we added the country data using a static GeoJSON source and added it to the map with the default styling. Next, we added the time zone data in step 4 and developed some basic styles for the two layers in step 6. The country data is composed of polygons, so we created a fill style and a stroke style for styling the country layer. The time zone data also contains polygons, but we want to see the countries underneath so we created a separate style with just the stroke and text properties for it.
The text property in this example is somewhat contrived to keep things simple. Showing the same text string for each time zone is not what we'd really want to do. Ideally, we'd display information specific to each time zone—perhaps, the name or number of hours from Greenwich Mean Time. We'll cover how to do this a bit later in the chapter though. The last thing is to assign our custom styles to the appropriate vector layer and turn off the automatic extraction of styles from the KML layer, which happened in step 7.
Now that we've reviewed how basic styles work, let's take a closer look at the style object and the properties we can assign to it. Along the way, we'll illustrate each with a specific example.
The style class, ol.style.Style, contains the drawing instructions to be used when rendering a feature. There are five properties we can use when creating a style property:
As you can see, a style is really a composite of several specific types. Including a property turns on drawing of the relevant type and excluding it turns it off. When you specify the style property for a vector layer, this replaces all the default styles; so, you don't need to override all the properties all the time—just specify the ones that are needed and the rest will not be drawn at all. For example, creating a style with just a stroke property will draw polygons with an outline and no fill:
var style = new ol.style.Style({
stroke: new ol.style.Stroke({
color: [127,127,127,1]
})
});Now, let's look at each specific property type with some examples.
The fill style—ol.style.Fill—is used to fill shapes with a solid color. The fill style is used by ol.style.Style as well as a couple of other objects we'll see shortly. It has a single property, color, of the type ol.Color that is used when drawing filled shapes.
Colors may be specified in three ways:
[0,0,0,1], white is represented as [255,255,255,1], and a semitransparent blue green is [0,255,0,0.5]."rgba(red,green,blue,alpha)", where red, green, blue, and alpha are the same as the preceding array form; for example, our semitransparent green color will be "rgba(0,255,0,0.5)".#RRGGBB, where RR is the red value, GG is the green value, and BB is the blue value. The values are a hexadecimal equivalent of the numeric values between 0 and 255, written as 00 to FF. The alpha value is assumed to be 1 in this case.These different representations are equivalent (except for the missing alpha control in hex colors) and you can use whichever is more convenient.
The stroke style— ol.style.Stroke—is used to draw lines. The line style is used by ol.style.Style as well as a couple of other objects we'll see shortly. A stroke style has the following options.
The following diagram illustrates the effect of the various values for lineJoin (top) and lineCap (bottom).
Modify the last example and try out some fill and stroke style properties. In particular, try changing the lineJoin and lineCap properties. Use a wider stroke width to see the effect it produces. Note that the lineCap style won't be apparent when drawing polygons—to see it in action, you'll need a line layer, perhaps, using the fells_loop.gpx file we saw in the previous chapter.
Here are a couple of examples:
var countryStyle = new ol.style.Style({
fill: new ol.style.Fill({
color: [0, 255, 255, 1]
}),
stroke: new ol.style.Stroke({
color: [127,127,127,1.0],
width: 10,
lineJoin: 'bevel',
})
});
var timezoneStyle = new ol.style.Style({
stroke: new ol.style.Stroke({
color: [64, 200, 200, 0.5],
lineJoin: 'round',
width: 10
})
});The image style—ol.style.Image—is used to style point data. You won't be using it directly though. Instead, there are two subclasses that you'll be using: ol.style.Icon and ol.style.Circle. Let's look at the icon style first.
The icon style displays an image at the location of a point. There are quite a few properties associated with the icon style that allow you to align the placement of the image relative to the precise geographic location being represented.
The following diagram illustrates the meaning of the origin, size, and anchor options:
As we haven't seen the Icon style before, let's build an example. As we'll need some point data for this example, the earthquake.kml file should be perfect! We'll use the following image sprite and pick the middle dot. This file is included with the code samples that come with the book; you can find it at assets/img/dots.png.
var earthquakeStyle = new ol.style.Style({
image: new ol.style.Icon({
anchor: [0.5, 0.5],
size: [52, 52],
offset: [52, 0],
opacity: 1,
scale: 0.25,
src: '../assets/img/dots.png'
})
});var earthquakes = new ol.layer.Vector({
source: new ol.source.KML({
projection: 'EPSG:3857',
url: '../assets/data/earthquakes.kml',
extractStyles: false
}),
style: earthquakeStyle
});var map = new ol.Map({
target: 'map',
layers: [countries, timezones, earthquakes],
view: view
});Using the icon style properties, we displayed an image at the location of each of the points in the earthquakes.kml file.
First, we created an icon style pointing at our sprite image and supplied values for offset, anchor, size, and scale to ensure our red dot is used. The sprite is 156 pixels wide and 52 pixels high, and each image in the sprite is 52 by 52 pixels, so we provided a size of [52,52]. An offset value of [52, 0] moved the frame of reference 52 pixels in from the left edge. The anchor position of [0.5,0.5] specified the middle of the image since the default anchor units is fraction. We can also have specified pixels for anchor units and changed our anchor position to [26, 26]. Given the density of the earthquakes, using a 52 by 52 pixel image will overwhelm the map; so, we provided a scale value of 0.25, which effectively shrunk the resulting image to 25 percent of its size, or 13 by 13 pixels.
After creating a new vector layer that used our icon style, we added it to the map.
Like the icon style, the circle style is used for point geometries. It's a much simpler object, though with only four configurable properties:
To round out our understanding of the image styles, redo the previous example using ol.style.Circle instead of ol.style.Icon as the image property of the earthquake style. Your result should look something like this (depending on what values you choose):
We saw the text style in action in the first example, and we also saw that it wasn't very useful to include a static text style—at least in that example. In general, text styles will be much more useful when the text that is displayed is derived from some property of the feature being displayed. We'll look at how to do that at the end of the chapter, so for now, let's finish up the basic style section with the properties available to text styles:
Remember, from the beginning of the chapter, that we said there were three different ways of specifying styles:
ol.style.Styleol.style.Style instancesWe've looked at the first, using ol.style.Style, in detail. The second, an array of styles, is really not much different from the first, that is, you are still dealing with the basic styles. The difference is that when you provide an array of styles, features are rendered once for each style. This means each feature is rendered more than once, which can provide some interesting effects. An example is probably the best way of illustrating this.
In this example, we'll use the country data again and draw each polygon with two styles to create a shadow effect around the continents.
countryStyle to provide a somewhat darker stroke:var countryStyle = new ol.style.Style({
fill: new ol.style.Fill({
color: [203, 194, 185, 1]
}),
stroke: new ol.style.Stroke({
color: [101, 95, 90, 1],
width: 1
}),
zIndex: 2
});var shadowStyle = new ol.style.Style({
stroke: new ol.style.Stroke({
color: [0, 0, 127, 0.15],
width: 8
}),
zIndex: 1
});var countries = new ol.layer.Vector({
source: new ol.source.GeoJSON({
projection: 'EPSG:3857',
url: '../assets/data/countries.geojson'
}),
style: [shadowStyle, countryStyle]
});By combining two styles, we achieved the desired effect. In the first step, we modified our starting style slightly to sharpen the country outline—this makes them easier to see over the shadows. In the second step, we added another style for the country layer with a wide, mostly transparent stroke and no fill. Lastly, we provided an array as the style property for our countries layer.
There is one thing you really need to be aware of when using arrays of styles—each feature is drawn once for each style. This can have dramatic performance implications when dealing with a lot of features. If you create a style array with two styles, you are effectively doubling the number of features being rendered. This will have no visible effect on a small number of simple features, but will start to have a noticeable effect when rendering lots (say hundreds of thousands) of features, or a smaller number of highly complex features.
In practice, it doesn't really double the rendering time as their efficiencies are built into OpenLayers that try to avoid expensive operations as much as possible. For example, the same effect can be achieved using two vector layers. This will be more inefficient as OpenLayers has to process the geometries twice, while they only have to be processed once when using an array of styles.
If you have been paying attention, you will have noticed that we added a zIndex property to each style in the previous example. Try removing the zIndex from both the styles and observe the result. This should give you an appreciation of what the zIndex property does. Without it, OpenLayers renders the features one at a time with their complete style, which would mean that the shadow from one country will overlap an adjacent country rather than just forming a shadow around each continent.
Now that we've seen all the basic style properties and how to combine them as arrays of styles, it's time to learn how to use them in conjunction with feature properties to achieve dynamic styles. This is actually the last of our three ways of specifying the style property—the style function.
We said at the beginning of the chapter that a style function is one that returns an array of style objects to be used for a specific feature and zoom level.
What does this mean? It's really quite straightforward, but extremely powerful. A style function is nothing more than a JavaScript function that receives two parameters—the feature being styled, and the resolution of the map's view. It is required to return an array of ol.style.Style objects when it is called. For instance, we could have written our country style example using a style function like this:
var countryStyleFunction = function(feature, resolution) {
return [countryStyle]; // the basic style we already defined
};
var countries = new ol.layer.Vector({
source: countrySource,
style: countryStyleFunction
});This example doesn't use the feature or the resolution arguments, but does illustrate how simple the concept of a style function is. In fact, when you provide a style or an array of styles as the style property of a vector layer, OpenLayers creates a style function internally that looks exactly like this.
You might be wondering if it's this simple, then how can we claim that it's extremely powerful? The power really comes when you use the feature and the resolution to dynamically create styles.
At the end of the previous chapter, we introduced the concept of feature properties and the methods used to retrieve them. Now, we can make practical use of this knowledge by using properties to create styles on the fly.
For this example, we will render the country layer by styling each country based on income level by associating its country code to income level data provided by the world bank. There are quite a few brackets; so, we've simplified it to four levels: high, medium, low, and poor. We'll draw each country in a color associated with its income level based on these brackets. Let's start from the previous example.
<script> tag, before anything else, we will define colors for the four brackets. Use any colours you like:var high = [64,196,64,1]; var mid = [108,152,64,1]; var low = [152,108,64,1]; var poor = [196,32,32,1];
var incomeLevels = {
'HIC': high, // high income
'OEC': high, // high income OECD
'NOC': high, // high income, non-OECD
'UMC': mid, // upper middle income
'MIC': mid, // middle income
'LMC': mid, // lower middle income
'LIC': low, // low income
'LMY': low, // low and middle income
'HPC': poor // heavily indebted poor country
};var defaultStyle = new ol.style.Style({
fill: new ol.style.Fill({
color: [250,250,250,1]
}),
stroke: new ol.style.Stroke({
color: [220,220,220,1],
width: 1
})
});var styleCache = {};
function styleFunction(feature, resolution) {
var level = feature.get('incomeLevel');
if (!level || !incomeLevels[level]) {
return [defaultStyle];
}
if (!styleCache[level]) {
styleCache[level] = new ol.style.Style({
fill: new ol.style.Fill({
color: incomeLevels[level]
}),
stroke: defaultStyle.stroke
});
}
return [styleCache[level]];
}var source = new ol.source.GeoJSON({
projection: 'EPSG:3857',
url: '../assets/data/countries.geojson'
});
var countries = new ol.layer.Vector({
source: source,
style: styleFunction
});var key = source.on('change', function(event) {
if (event.target.getState() == 'ready') {
source.unByKey(key);
$.ajax('../assets/data/income_levels.json').done(function(data) {
source.forEachFeature(function(feature) {
var code = feature.get('iso_a2');
if (data[code]) {
feature.set('incomeLevel', data[code]);
}
});
});
}
});Let's review what is happening in this example. We are using a standard setup for vector layers, and combining some extra data into our features dynamically. The data is used to style, or classify, the country polygons by the income level as recorded by the world bank. Some interesting things are happening in this example; so we'll look at each step and highlight what's going on.
In step 1, we created some colors to be used to fill countries that fall into one of the four income categories. The number of categories is arbitrary—you can create colors for each of the income levels, or decide to group them differently.
In step 2, we created an object that we can use to look up a color based on an income level, and in step 3, we defined a default style. It's usually good practice when dealing with data that can change to have some kind of fallback so that your code doesn't break. We'll use the default style if we can't find a income level in our lookup object.
In step 4, we created our style function. Another best practice is to reuse style objects as much as possible. Since several countries might be drawn in the same style, we created an empty object (the styleCache) to store previously created styles. The actual function comes next. When the style function is called, it gets a reference to the feature being styled and the current resolution of the view on which it is being rendered. We aren't using the resolution in this example. We are using the feature, however. The feature should have a property called incomeLevel that matches the values in our lookup tables, so we grab that value and assign it to a variable. If the income level wasn't set or if it doesn't exist in the lookup table, we'll return the default style. Otherwise, we can check to see whether the styleCache object already has a style for this income level. If it doesn't, we need to create a new style using the color from our lookup table. In this case, we are using the default style's stroke for everything, but you could easily change the stroke for each feature too. Because we've assigned the new style to the correct slot in the cache, we can then return it directly.
Note that in both cases, we return an array containing the style. This is required for a very important reason: performance! The Style functions are executed a lot of times when rendering vector features and if OpenLayers had to check the return type of each call to see if it was a style object or an array of style objects, this would add significant overhead to the rendering pipeline. For individual features, the difference is so tiny that it's probably not measurable even with the best of tools. For many features, this tiny difference adds up to a lot and it is measurable. The OpenLayers developers have put a lot of effort into this kind of detail and it shows!
In step 5, we modified the layer to use the style function we just created and defined a separate variable for the source. This was to make the next step a little easier.
In step 6, we loaded the income level data. The goal of the code in this step is to load the income data and associate it with the appropriate country feature. To do this, we need to make sure that the country features have been loaded. Once the countries are loaded, then, we need to load the income data. Then we can create a new property on each country feature with the appropriate income level. There are a few important things happening in this step, so we'll review each line:
ol.Observable and so they provide the on() method for this. Recall from Chapter 2, Key Concepts in OpenLayers, that the on() method returns a key that can be used later to deregister an event handler (using the unByKey() method)—we'll need it in just a moment. The change event on a vector source is triggered when the source changes state.unByKey() method so that the handler doesn't get called again. This is very important. A source triggers the change event when its state changes, but also when any of its features change. This means that our event handler will get called again when we add properties to the feature. Since the state of the source will already be ready, our code will try to load the income data again and will create an infinite loop.ajax() method. The data loaded from this file is passed to the function we register using done().forEachFeature() and providing a function that will be called with each feature.iso_a2 property of the feature, which is a two letter code associated with each country. The income data in our file is organized by this code so we can use this code to get the income level for each country.These eight lines of code accomplish quite a bit and combine concepts from other chapters of this book, including Chapter 2, Key Concepts in OpenLayers (event registration and deregistration) and Chapter 5, Using Vector Layers (vector layers, vector sources, and feature properties).
To round off our chapter on vector styles, let's explore combining vector styles with user interaction. In the previous chapter, we responded to the mouse moving over a country by displaying the country's name in an HTML element outside the map. We'll build on this example and take it one step further. As the mouse moves, we'll highlight the country under the mouse and draw its flag and name in the center of the country using a feature overlay. The feature overlays are something new; so, we'll need to learn something about them before we go ahead with our example though.
The FeatureOverlay class, ol.FeatureOverlay, is a special type of vector layer designed to render a small number of temporary features in a specific style. It isn't a full-fledged vector layer, but it is highly optimized for the specific case of highlighting features in a temporary way. This sounds ideal for our use case!
Creating a new feature overlay is just like creating any other class in OpenLayers, just pass some options to configure it. Here are the options that can be passed to the ol.FeatureOverlay constructor:
The FeatureOverlay class has several methods to manage its features, map, and styles as follows:
Feature overlays are pretty simple and most of what you will want to do with a feature overlay once it is configured with a style and map is manage features. Let's see how that's done!
Now we have the knowledge we need to build our final example. We will add some interactivity to our countries layer by highlighting the country under the mouse with a different style—specifically, we will:
var countries = new ol.layer.Vector({
source: new ol.source.GeoJSON({
projection: 'EPSG:3857',
url: '../assets/data/countries.geojson'
})
});
var center = ol.proj.transform([0, 0], 'EPSG:4326', 'EPSG:3857');
var view = new ol.View({
center: center,
zoom: 1,
});
var map = new ol.Map({
target: 'map',
layers: [countries],
view: view
});var baseTextStyle = {
font: '12px Calibri,sans-serif',
textAlign: 'center',
offsetY: -15,
fill: new ol.style.Fill({
color: [0,0,0,1]
}),
stroke: new ol.style.Stroke({
color: [255,255,255,0.5]
width: 4
})
};
var highlightStyle = new ol.style.Style({
stroke: new ol.style.Stroke({
color: [255,0,0,0.6],
width: 2
}),
fill: new ol.style.Fill({
color: [255,0,0,0.2]
}),
zIndex: 1
});function styleFunction(feature, resolution) {
var style;
var geom = feature.getGeometry();
if (geom.getType() == 'Point') {
var text = feature.get('text');
baseTextStyle.text = text;
var isoCode = feature.get('isoCode').toLowerCase();
style = new ol.style.Style({
text: new ol.style.Text(baseTextStyle),
image: new ol.style.Icon({
src: '../assets/img/flags/'+isoCode+'.png'
}),
zIndex: 2
});
} else {
style = highlightStyle;
}
return [style];
}var featureOverlay = new ol.FeatureOverlay({
map: map,
style: styleFunction
});pointermove event and manage the features in our feature overlay based on where the mouse is. This is a pretty big function that exercises our knowledge of geometries from the previous chapter:map.on('pointermove', function(browserEvent) {
featureOverlay.getFeatures().clear();
var coordinate = browserEvent.coordinate;
var pixel = browserEvent.pixel;
map.forEachFeatureAtPixel(pixel, function(feature, layer) {
if (!layer) {
return; // ignore features on the overlay
}
var geometry = feature.getGeometry();
var point;
switch (geometry.getType()) {
case 'MultiPolygon':
var poly = geometry.getPolygons().reduce(function(left, right) {
return left.getArea() > right.getArea() ? left : right;
});
point = poly.getInteriorPoint().getCoordinates();
break;
case 'Polygon':
point = geometry.getInteriorPoint().getCoordinates();
break;
default:
point = geometry.getClosestPoint(coordinate);
}
textFeature = new ol.Feature({
geometry: new ol.geom.Point(point),
text: feature.get('name'),
isoCode: feature.get('iso_a2').toLowerCase()
});
featureOverlay.addFeature(textFeature);
featureOverlay.addFeature(feature);
});
}As you can see, feature overlays make it very simple to create an interactive experience with vector layers. There are a few new concepts in this example, as well as some old ones, so let's review the code step by step.
Step 1 should be pretty familiar to you now—we are creating a vector layer with a GeoJSON source, and adding it to a map with a view centered on 0,0.
In step 2, we set up some styles for our feature overlay to use. There are two styles—one for text and one for polygon highlighting. Notice that the baseTextStyle is an object literal, not a new instance of ol.style.Text. When you create an instance of ol.style.Text, the text to be drawn needs to be passed to that object and you can't change the text after it has been created. The style function allows us to create text styles with the text of the current feature, but we'll need to specify the other options. Since all labels will share the other text options, we can set them up once and just refer to them later in the style function. The options we've specified here are to center align the text, offset it up by 15 pixels (recall that a positive offsetY moves the text down), and provide a fill and stroke color. For the text, the stroke is rendered around the outside of each character so we set a wide, semitransparent stroke to make the text stand out from the map beneath it.
The highlightStyle is straightforward— a fill and stroke style for the highlighted polygon.
The style function needs to be defined before we can use it to create the feature overlay, so in step 3, we defined it. Recall that the style function receives the feature being rendered as the first argument. We drew two types of features, points, and polygons, with two different styles. So, the first thing we did was get the feature's geometry and check to see whether it was a point. If it is a point, we create a new text style and a new icon style specific to the current feature. We got the feature's text property and combined it with the baseTextStyle object to create the text style. Next, we got the isoCode property and used it to create a URL to the flag for the country (the flag icons are conveniently named using the two-letter ISO country code) for a new icon style. Then, we created a new style object for the current feature. If the feature is a polygon, it's much simpler—all we need to do is return the highlightStyle object. Finally, we returned an array containing the style (recall that style functions are required to return arrays for performance reasons).
Step 4, by comparison, was very short! We created a new feature overlay and configured it with the map object and style function. It's really the style function, and step 5, that do all the work.
Step 5 added a handler for the map's pointermove event; so, we could find the feature closest to the mouse and add it to the feature overlay. We actually wanted to highlight two features— the polygon itself and a point at the center of the polygon. It turns out that getting this center point is a bit tricky. Let's review the code carefully.
Line 1 of code in the handler clears any existing features in the feature overlay. It is much easier to retrieve the collection and clear it than to remove individual features in our case.
The browserEvent object provides us with the map coordinate and pixel that the event happened at. We used the pixel location with ol.Map classes forEachFeatureAtPixel function on the next line to retrieve all features at that location from our vector layer. This function invokes a callback function for every feature at the pixel location, providing both the feature and the layer that the feature was found on. The layer parameter may be null if the feature was found on a FeatureOverlay.
Inside our callback function, we tested first to see if the feature was actually on a layer before proceeding. Then we needed to find both the geometry and the center point of the geometry. If all the country features were polygons, we could simply call getInteriorPoint() to retrieve the center and we would be done. Unfortunately, we didn't know what type of features we were dealing with—some of the features in the country data were actually MultiPolygons, and we needed to handle them differently. The switch statement chooses a path based on the type of the feature. Let's look at each case separately.
The first case was for MultiPolygon. As the name suggests, a MultiPolygon class contains multiple polygons (a country and some islands perhaps) and there isn't a convenient way to determine the center of a group of polygons. Instead, a MultiPolygon class has several centers, one for each of its constituent polygons. The getInteriorPoints() method returns the center points for us. We only really wanted a single label though. One way is to get all the interior points and use the first one. The problem with this approach is that there is no particular order to the polygons, and it looks odd to label some random island off the coast rather than the major landmass of a given country. To get around this, we wanted our label to appear at the center of the largest polygon. To get the largest polygon, we first got the array of polygons and then reduced that array to a single value with a function that compared two polygons based on their area. The reduce method is a standard method of JavaScript arrays. Once we've found the largest polygon, we can ask for its interior point.
The second case is for polygon, and was much simpler— we just needed the interior point of the polygon and we were done!
The final case was the default case. While it isn't strictly needed, it is good practice to include a default case in switch statements. The getClosestPoint() method is available on all geometry types and is a safe fallback for our default case.
Now that we had a point coordinate at the best location we could determine for the feature under the mouse, we created a new Feature and provided the point geometry for its location. We also added two properties—text (that we displayed at the point) and isoCode (that we will use to find the flag icon for the country).
Finally, we added both features to the feature overlay so that when the map is next rendered, the country under the mouse will be highlighted in red and display the flag and country name at the center.
This concludes our chapter on styling vector layers. OpenLayers' styling capabilities are quite simple to implement, but can be incredibly powerful. The basic styles are easy to set up and give you a lot of flexibility in styling your vector features. More complex styling is readily implemented through the use of a style function by allowing you to create basic styles tailored to a specific feature and current zoom level of the map. The building blocks—basic styles and the style function—are simple, but the combination of them allows you to create highly custom cartographic representations for your vector data.
In the next chapter, we will dig into projections and discover how to use them to display both vector and raster layers in different projections.
When you look at a map, you are looking at a two-dimensional representation of a 3D object (the Earth). Because we are, essentially, 'losing' a dimension when we create a map, no map is a perfect representation of the Earth. All maps have some distortion.
The distortion depends on what projection (a method of representing the earth's surface on a two dimensional plane) you use. In this chapter, we'll talk more about what projections are, why they're important, and how we can use them in OpenLayers. We'll also cover some other fundamental geographic principles that will help make it easier to better understand OpenLayers.
In this chapter, we will cover the following topics:
Let's get started!
No maps of the earth are truly perfect representations; all maps have some distortion. The reason for this, is because they are attempting to represent a 3D object (an ellipsoid: the Earth) in two dimensions (a plane: the map itself).
A projection is a representation of the entire, or parts of a surface of a 3D sphere (or more precisely, an ellipsoid) on a 2D plane (or other types of geometry).
Every map has some sort of projection—it is an inherent attribute of maps. Imagine unpeeling an orange and then flattening the peel out. Some kind of distortion will occur, and if you try to fully fit the peel into a square or rectangle (like a flat, two-dimensional map), you'd have a very hard time.
To get the peel to fit perfectly onto a flat square or rectangle, you can try to stretch out certain parts of the peel or cut some pieces of the peel off and rearrange them. The same sort of idea applies while trying to create a map.
There are literally an infinite amount of possible map projections; an unlimited number of ways to represent a three-dimensional surface in two dimensions, but none of them are totally distortion free.
So, if there are so many different map projections, how do we decide on which one to use? Is there a best one? The answer is no. The 'best' projection to use depends on the context in which you use your map, what you're looking at, and what characteristics you wish to preserve.
As a two-dimensional representation is not without distortion, each projection makes a trade off between some characteristics. As we lose a dimension when projecting the earth onto a map, we must make some sort of trade off between the characteristics we want to preserve. There are numerous characteristics, but for now, let's focus on three of them.
Area refers to the size of features on the map. Projections that preserve area are known as equal-area projections (also known as equiareal, equivalent, or homolographic). A projection preserves area if, for example, a meter measured at different places on the map covers the same area. Because area remains the same, angles, scales, and shapes are distorted. This is what an equal area projected map may look like:
Here, we use Tissot indicatrix with EPSG:3410 NSIDC EASE-Grid Global, where the EPSG code helps define all existing projections. We will cover EPSG in detail, later in this chapter.
Without going into technical details, Tissot indicatrix is a way to display map projections deformation visually. In a perfect projection, we will keep area, distance, and shape, with circles with equal area and equal distance.
As you see, with this equal-area projection, we have circle and ellipse shapes but areas remain the same.
Scale is the ratio of the map's distance to the actual distance (for example, one centimeter on the map may be equal to one hundred actual meters). All map projections show scale incorrectly at some areas throughout the map; no map can show the same scale throughout the map. There are parts of the map, however, where scale remains correct—the placement of these locations mitigates scale errors elsewhere. The deformation of scale also depends on the area being mapped. Projections are referred to as equidistant if they contain true scale between a point and every other point on the map.
An example to illustrate can be the EPSG:32662 projection known as Plate Carree.
Here, we keep the distance between the center of the ellipse/circle. We overlay on top of the image of a grid so that you can better evaluate distance.
Maps that preserve shape are known as conformal or orthomorphic. Shape means that relative angles to all points on a map are correct. Most maps that show the entire earth are conformal, such as the Mercator projection (used by Google Earth and other common web maps). Depending on the specific projection, areas throughout the map are generally distorted but may be correct in certain places. Also, a map that is conformal cannot be equal-area.
To illustrate shape preservations, let's see the following example using EPSG code 3395 (WGS 84 - World Mercator), where all circles stay circles wherever they are:
Projections have numerous other characteristics, such as bearing, distance, and direction. The key concept to take away here is that all projections preserve some characteristics at the expense of others. For instance, a map that preserves shape cannot completely preserve area.
There is no perfect map projection. The usefulness of a projection depends on the context the map is being used in. A particular projection may excel at a certain task, for example, navigation, but can be a poor choice for other purposes. For example, when we do thematic mapping and respect representations rules, colors are related to areas of countries. When we look at a world thematic map with a wrong projection, our eyes see a country bigger than the others, whereas because of projections, this country can, in reality, have a calculated area identical to countries represented with a smaller size.
The following figure overlays an area preserving projection (Robinson) on top of a Spherical Mercator to show the difference and why it matters:
One of the simple ways to convince you that each projection has a reason to exist is to visit the OpenLayers 3 website examples.
We will compare the scale line example, http://openlayers.org/en/v3.0.0/examples/scale-, with the tiled WMS with the custom projection example, http://openlayers.org/en/v3.0.0/examples/wms-custom-proj.html.
Your instructions until now are:
Projections are projected onto a geometric surface, three of the most common ones being a plane, cone, or cylinder.
Imagine a cylinder being wrapped around the earth, with the center of the cylinder's circumference touching the equator. Now, the earth is projected onto the surface of this cylinder, and if you cut the cylinder from top to bottom vertically and unwrap it and lay it flat, you'd have a regular cylindrical projection:
The Mercator projection is just one of these types of projections. If you've never worked with projections before, there is a good chance that most of the maps you've seen were in this projection.
Because of its nature, there is heavy distortion near the ends of the poles. Looking at the previous screenshot, you can see that the cells get progressively larger, the closer you get to the North and South poles. For example, Greenland looks larger than South America, but in reality, it is about the size of Mexico. For illustrating this problem visually, you can compare countries overlapping with http://overlapmaps.com. If area distortion is important in your map, you might consider using an equal area projection, as we mentioned earlier.
More information about projections can be found at the USGS (US Geological Survey) website at http://pubs.er.usgs.gov/publication/pp1395, where you can download the reference book Map Projections: A Working Manual (U.S. Geological Survey Professional Paper 1395), John P. Snyder, 1987, 397 pages.
As we mentioned, there are literally an infinite number of possible projections. So, it makes sense that there should be some universally agreed upon classification system that keeps track of projection information. There are many different classification systems, but OpenLayers uses EPSG codes. EPSG refers to the European Petroleum Survey Group, a scientific organization involved in oil exploration, which in 2005 was taken over by the OGP (International Association of Oil and Gas Producers).
For the purpose of OpenLayers, EPSG codes are referred to as EPSG:4326.
The numbers (4326, in this case) after EPSG: refer to the projection identification number. It uses the familiar longitude/latitude coordinate system, with coordinates that range from -180° to 180° (longitude) and -90° to 90° (latitude).
Let's create a basic map using a different projection. Using the usual code from Chapter 1, Getting Started with OpenLayers, recreate your map object the following way. We'll be specifying the projection property, along with the center and zoom properties. The projection we will use is EPSG:4326, a projection used for world data. Usually, when you don't specify a projection, the default projection in OpenLayers is EPSG:3857 (historically, called EPSG:900913), used by Google Maps and other third-party APIs such as Bing Maps or OpenStreetMap.
var blueMarbleLayer = new ol.layer.Tile({
source: new ol.source.TileWMS({
url: 'http://maps.boundlessgeo.com/geowebcache/service/wms',
params: {
'TILED' : true,
'VERSION': '1.1.1',
'LAYERS': 'bluemarble',
'FORMAT': 'image/jpeg'
}
})
});var view = new ol.view({
projection: 'EPSG:4326',
center: [-1.81185, 52.44314],
zoom: 6
});var map = new ol.Map({
target: 'map'
});map.addLayer(blueMarbleLayer); map.setView(view);
chapter7_ex1.html. You should see something like the following:We just created a map with the EPSG:4326 projection. The process to use another projection is really similar to all previous examples in the book.
One of the main differences is the backend server. It can provide a layer projected in another projection from the default one in OpenLayers 3 library. In our case, it's the source URL, http://maps.boundlessgeo.com/geowebcache/service/wms, from the blueMarbleLayer layer object that permits this.
The other difference is at the view level. In the constructor, we set a new property: projection that refers to wanted EPSG code and we also directly use coordinates from the projection to set the center on our map.
Apart from the code, you'll notice that the example looks quite different from the maps we've made so far. This is because of its projection.
OpenLayers supports any projection, but if you want to use a projection other than EPSG:3857, you must specify this option in the view projection. The default value is EPSG:3857.
If you do not specify this option, the default value is used (most of the other maps so far, have been using the default values).
You can pass to the projection a string with EPSG:yourcode, but you can also give it an ol.proj.Projection object. You can define it manually but most of the time, you will retrieve it from a preconfigured projection setting. We will only cover how to define it when you are using Proj4js, a JavaScript library dedicated to manage projections. As a beginner will not need to work with use cases without EPSG codes. Be careful, as OpenLayers only supports EPSG:4326 and EPSG:3857 (both with a few aliases) out-of-the-box.
Longitude and latitude are two terms most people are familiar with, though they have limited geographic knowledge or get confused by the two. Let's take a look at the following screenshot and then go over these two terms:
Latitude lines are imaginary lines parallel to the equator, aptly known also as parallels of latitude. Latitude is divided into 90 degrees, or 90 spaces (or cells), above and below the equator. -90° is the South Pole, 0° would be the Equator, and 90° is the North Pole.
Each space, or cell, (from 42° to 43°, for example) is further divided into 60 minutes and each minute is further divided into 60 seconds. The minutes and seconds terminology has little to do with time. In the context of mapping, they are just terms used for precision. The size of a degree of latitude is constant (if calculation bot is based on projected distance). Because they measure 'north to south', OpenLayers considers the y coordinate to be the latitude.
Longitude lines are perpendicular to the lines of latitude. All lines of longitude, also known as meridians of longitude, intersect at the North Pole and South Pole, and unlike latitude, the length of each longitude line is the same. Longitude is divided into 360 degrees, or spaces. Similar to latitude, each space is also divided into 60 minutes, and each minute is divided into 60 seconds. For EPSG:4326, -180 to 0 measures west of the Greenwich meridian, whereas 0 to 180 measures east of Greenwich.
As the space between longitude lines gets smaller, the closer you get to the poles, the size of a degree of longitude changes (when not relying on projected distance). The closer you are to the poles, the lesser time it will take you to walk around the Earth.
With latitude, it makes sense to use the equator as 0°, but with longitude, there is no spot better than to start the 0° mark at. So, while this spot is really arbitrary, the Observatory of Greenwich, England, is today universally considered to be 0° longitude. Because longitude measures east and west, OpenLayers considers the x coordinate to be longitude.
Let's take a look at a couple of examples on coordinates from our previous maps:
map.getView().getCenter();
Depending on where you have panned, your output should read something like the following:
[9397474.0038099,3595597.9798909]
map.getView().getCenter();
You should see something like the following:
[-72.8125, 19.6875]
ol.coordinate.toStringHDMS([-72.8125, 19.6875]);
We just took a look at the longitude and latitude values for the center of the map in two different maps with different projections. When we call map.getView().getCenter(), we get back an ol.Coordinate object, in fact, an array of x, y values.
In the first map, the max extent of the map was between -20037508.342789244 meters and 20037508.342789244 meters for x, and between -20037508.342789244 meters and 20037508.342789244 meters for y.
These are the values used by the EPSG:3857, and it is an x and y type of Cartesian coordinate system. The values for x and y change in the second map because they are not in the same projection (they are in EPSG:4326). So, x are between -180° and 180° and y between -90° and 90°.
The x and y means longitude and latitude, respectively in EPSG:4326 and easting and northing in EPSG:3857. To understand definition of easting and northing, go to the Wikipedia dedicated page, https://en.wikipedia.org/wiki/Easting_and_northing.
So far, we've been talking about the abstract idea of a projection. Let's dive into OpenLayer's ol.proj namespace functions and the associated class ol.proj.Projection class, which is what we use to actually handle projections. The ol.proj.Projection class relies on internal code, managing the most used projection in the web mapping world: the EPSG:4326 projection (also named WGS 84) and the EPSG:3857 projection, also known as EPSG:900913 (using leetspeak, it means Google, the first company relying on this exact projection), and also, alternatively named WGS 84 Spherical Mercator. For reference, you can have the full history of the second projection at http://wiki.openstreetmap.org/wiki/EPSG:3857
For other use case such as custom projections, OpenLayers, for convenience, supports an external library called Proj4js, which can be found at http://proj4js.org. First, we'll talk about what we can do without the Proj4js library, and then talk about what we can do with it.
In truth, whenever you load your web mapping application, you have already instantiated the default projections, EPSG:4326 and EPSG:3857.
You only need to access ol.proj.Projection by typing the following line of code:
ol.proj.get('EPSG:3857')In ol.proj.get, you can use a projectionCode, a string for identifying the WKID (Well Known Identifier) for the projection, such as an EPSG code in the form of EPSG:4326.
When creating a map and loading a particular projection, you will only require to declare Proj4js-specific definition and use OpenLayers built-in functions to use them. This string, such as EPSG:4326, is also known as an SRS (Spatial Reference System) code. When passing in a code, like we've done with all our examples so far, ol.proj.get() will automatically create a projection object, as long as the projection definition is known to Proj4js.
The projection class (the list is available at http://openlayers.org/en/v3.0.0/apidoc/ol.proj.Projection.html) has a number of methods, including the following:
Transforming a point means you take a coordinate in one projection and turn it into a coordinate of another projection. This operation is also called reprojection. The term reprojection is also applied when deforming a raster image from one projection to another. Apart from transforming EPSG:4326 to EPSG:3857 and vice versa, OpenLayers does not provide support for transforming other projections out-of-the-box. To do transforms with other projections, you can include Proj4js (which can be found at http://proj4js.org) or provide your own transforms and register them with OpenLayers. You may be wondering why. The main reason is to not maintain projections in the core library when we can keep it outside, in a well-maintained library. The other goal, is to avoid increasing the overall library size. There are thousands of projections, whereas most projects only require some of them. The gain is not worth the drawback.
In most scenarios, it is the job of the backend map server to handle projection transformations. Often, it's useful or faster to do it on the client-side (such as in the case of vector layer coordinate transformations) because we don't need to call server-side again for transformation or because we don't control the server-side like for external web services. Let's take a look at how to transform EPSG:4326 to EPSG:3857 with OpenLayers.
Proj4js is not necessary for this example, as transforming between these two projections is possible without proj4js. Try the following steps:
var proj_4326 = ol.proj.get('EPSG:4326');
var proj_3857 = ol.proj.get('EPSG:3857');var point_to_transform = [-79, 42];
EPSG:4326 (our source proj_4326 projection object) to EPSG:3857 (our destination proj_3857 projection object):var myTransformedPoint = ol.proj.transform(point_to_transform, proj_4326, proj_3857);
console.log(myTransformedPoint); console.log(myTransformedPoint[0], myTransformedPoint[1]);
[-8794239.7714444, 5160979.4433314] -8794239.7714444 5160979.443 3314
We just transformed a point in the EPSG:4326 projection to a point in the EPSG:3857 projection. Let's take a closer look at the transform method we called on the point_to_transform object:
ol.proj.transform(point_to_transform, 'EPSG:4326', 'EPSG:3857');
This will transform the original point from the EPSG:4326 projection to the EPSG:3857 projection. Notice, we are calling the function directly from an ol.Coordinate array. The ol.proj.transform() function's definition is as follows:
In this case, our source projection is in EPSG:4326, and our destination projection is in EPSG:3857. Keep in mind however, that EPSG:4326 and EPSG:3857 are the only two projections you can do transforms on with OpenLayers out-of-the-box.
When creating a map, all the raster layers (image-based layers; nearly every layer except the vector and image layer) must be in the same projection as the map. It's possible to do projection transformations with coordinates and the vector layer, but once OpenLayers gets back an image from a map server, it cannot reproject the image itself (that's something the map server has to do).
The Proj4js library allows you to transform the coordinates from one coordinate system into another coordinate system. The Proj4js website is http://proj4js.org. By just including the Proj4js library on your page (like you do with OpenLayers), you can do more transforms within OpenLayers. Note that Proj4js also only ships with only a few codes. Definitions need to be added for all others.
The site http://epsg.io contains Proj4js definitions for most of the EPSG codes. When you are using data from foreign countries, you need to know the most common used projections. For this, go to the ProjFinder website, http://projfinder.com, and guess projections for unknown places.
Ideally, you should be using the same projection throughout your map, but there are times when you may want to display the coordinates in a different projection—such as with a vector layer. Let's take a look at how to set up the Proj4js library.
This step is similar to the way we set up the now usual template for OpenLayers 3.
proj4.js file into a new assets/proj4js directory at the root code directory.<head> section of your code before the OpenLayers 3 library inclusion code:<script src="../assets/proj4js/proj4.js"> </script>
var test_proj = proj4('EPSG:4326');
console.log(test_proj);
Object {forward: function, inverse: function, oProj: Projection}
We just included the Proj4js library and tested to see if it worked. If you received an error when you attempted to call proj4('EPSG:4326'), it means that the location of the proj4.js file was wrong. Ensure that the path in the <script> tag correctly references the JavaScript file.
Proj4js custom projections are required, particularly when you are using data at the local level and you want to use your country official projection(s) or you depend on external data sources such as web services.
Now that the Proj4js library is included, you can do transforms with more projections, the same way we did in the previous example. Except EPSG:3857, EPSG:4326, and EPSG:4269, there are no projections defined; however, you are able to define them yourself. For example, for France, the main official EPSG code is as follows:
proj4.defs("EPSG:2154","+proj=lcc +lat_1=49 +lat_2=44 +lat_0=46.5 +lon_0=3 +x_0=700000 +y_0=6600000 +ellps=GRS80 +towgs84=0,0,0,0,0,0,0 +units=m +no_defs");After this, you'd be able to use EPSG:2154 for projection transformations just like you were able to use EPSG:4326 and EPSG:3857 from the earlier examples.
A more complete list of projections (containing Proj4js definitions for nearly any EPSG code) can be found at http://epsg.io.
To get projection definitions, you can copy them from http://epsg.io or also load them from the URL. For example, adding the proj4.js script after the <script src="http://epsg.io/2154.js"></script>. The URL pattern to retrieve the definition is http://epsg.io/xxx.js where xxx is the EPSG code you want to use.
When you are using custom projections in OpenLayers 3, you need to declare the projection, as described earlier. Use ol.proj.get to retrieve its definition and define the projection extent. For this, reuse the http://epsg.io site.
When you want to declare a custom projection, you must create an object, such as the preceding one, when you start your JavaScript code:
var projection = ol.proj.get('EPSG:2154');
projection.setExtent([-378305.81, 6093283.21, 1212610.74, 7186901.68]);You will then be able to use the usual ol.proj.transform function with this new projection.
Sometimes, in another context for example, to provide parameters to web services it can be necessary to convert extent between projections. Let's inspect how to do this operation.
Until now, we only see how to do reprojection using points coordinates but how can we do it for extent?
console.log(extent);
ol.proj.transformExtent(extent, 'EPSG:21781', 'EPSG:4326');
We reused the function behind the ol.proj.transform function without knowledge.
The ol.proj.transformExtent method expects an extent as a first parameter, as a second parameter, it needs the origin projection, and as a third parameter, it's the destination projection. We declared that we use as input the extent; as origin, EPSG:2181; and as destination, EPSG:4326. At the internal OpenLayers 3 library level, the function loops on the extent and transforms each coordinate.
With this function, if we need to get a bounding box in EPSG:4326 from local projections, it will really help.
If you remember Chapter 4, Interacting with Raster Data Source, we introduced you to the tiled and untiled raster. Most tiled rasters do not serve in a foreign projection, for example, a non-Spherical Mercator projection, but contrary to most cases, WMS sources can be served and consume using custom projections.
In this part, we will see how to display the WMS image coming from the authority responsible for geology maps in France, the BRGM (equivalent to USGS to simplify):
ol3.js file.<script> tag and declare the additional projection for local projection, in this case, Lambert 93, an official projection for France:proj4.defs("EPSG:2154","+proj=lcc +lat_1=49 +lat_2=44 +lat_0=46.5 +lon_0=3 +x_0=700000 +y_0=6600000 +ellps=GRS80 +towgs84=0,0,0,0,0,0,0 +units=m +no_defs");var extent = [-378305.81, 6093283.21, 1212610.74, 7186901.68];var projection = ol.proj.get('EPSG:2154');projection.setExtent(extent);
EPSG:2154, the EPSG code for Lambert 93:var layers = [new ol.layer.Image({
source: new ol.source.ImageWMS({
url: 'http://geoservices.brgm.fr/geologie',
attributions: [new ol.Attribution({
html: '© ' +
'BRGM (French USGS equivalent)'
})
params: {
'LAYERS': 'SCAN_F_GEOL1M',
'VERSION': '1.1.1'
},
extent: extent
})
})var map = new ol.Map({
layers: layers,
target: 'map',
view: new ol.view({
projection: projection,
center: [495520.187986, 6587896.855407],
zoom: 2
})
});We reused the custom projection by first declaring the Proj4js projection declaration and its extent. We recommend that you visit the website http://epsg.io to better understand how to get the extent and the meaning of the second parameter in from the proj4.defs function.
Then, we used our raster WMS knowledge to create the layer. Analyzing the network can be useful to remind you about the relationship between the WMS source layer declaration and the backend web server delivering the image. You can look in particular at getCapabilities, to inspect the available projections and the layers name you may change, if you want to play with the sample. The most important part to understand is to set the projection in the map view projection parameter. How can we deduce this? We understood that because in all the code, we never set any projection at the layer or source level. We should mention that Proj4js is not needed for maps, as long as they do not need any client-side transforms.
Using our example, a minimal case can be achieved replacing previous projection declarations by only declaring a projection, with units and code parameters like below:
var projection = new ol.proj.Projection({
code: 'EPSG:2154',
units: 'm'
});When someone reviews someone else job, it seems to be quite easy but reusing the same method for your own case is not the same, and will help you to really understand it.
So, we will ask you to complete a simple job:
getCapabilities operation to get a layer's name or projections available for the data. If you don't find public web services using local projections for your country, to complete the assessment, explore other countries local projections web services.Never forget to inspect the Network panel to help you if you encounter web services issues. You may also need to use the DOM renderer within the map; it helps you to inspect the url call. With the default canvas renderer, images are assembled in the background and you can't get the WMS URL that can help you.
To find the open data portals, the main entry for America is https://www.data.gov. For Europe, you should visit http://publicdata.eu. For a worldwide overview, go at http://datacatalogs.org, a website for A Comprehensive List of Open Data Catalogs from Around the World. To grasp the state of OpenData in your country, you can visit Global Open Data Index at http://global.census.okfn.org. It's a website maintained by the community to make surveys about each country's open data initiative. The focus is mainly on the type of open data datasets available.
After inspecting how to work with custom projection using raster layers, it's time to see vector reprojection. We already reviewed how to manipulate vector but not explaining further how to manage vector projections. Let's see a bit about them.
When you draw in OpenLayers, you draw in local projections' features. Then, if you need, for example, to exchange data source with a third party, sometimes you need to make reprojections. It's useful to know how to consume data and reproject them or on the contrary, export them. It's what we will see here:
sandbox directory.var projection declaration, add a new GeoJSON source, a vector source:var countriesSource = new ol.source.GeoJSON({
projection: 'EPSG:2154',
url: '../assets/data/nutsv9_lea.geojson'
});console.log statements:countriesSource.once('change', function(evt) {
if (this.getState() == 'ready') {
console.log(this.getFeatures()[0].getGeometry().getCoordinates());
console.log(this.getFeatures()[0].getGeometry().clone().transform('EPSG:2154','EPSG:4326').getCoordinates());
}
});countriesSource as the source. You will normally write something like the following:var layers = [
new ol.layer.Image({
}),
new ol.layer.Vector({
source: countriesSource
})
];var bbox = new ol.layer.Vector({
source: new ol.source.GeoJSON()
})
map.addLayer(bbox);featureCollection inline. It's recommended by the GeoJSON specifications to have coordinates using EPSG:4326:var geojson = {
"type": "FeatureCollection",
"features": [
{
"type": "Feature",
"properties": {},
"geometry": {
"type": "Polygon",
"coordinates": [
[[-0.944824, 46.134170], [-0.944824, 48.312428],
[4.438477, 48.312428], [4.438477, 46.134170],
[-0.944824, 46.134170]
]
]
}
}
]
}ol.format.GeoJSON with defaultDataProjection:var format = new ol.format.GeoJSON({
defaultDataProjection: 'EPSG:4326'
})bbox layer:var features = format.readFeatures(geojson, {
dataProjection : 'EPSG:4326',
featureProjection: 'EPSG:2154'
});
bbox.getSource().addFeatures(features);console.log statements to help inspect the result, but also see how you can use writeFeatures and reproject.console.log(features);
console.log(
format.writeFeatures(features, {
dataProjection : 'EPSG:4326',
featureProjection: 'EPSG:2154'
})
);We first set a source by defining its target projection. You might not remember but when you consume GeoJSON, the data default projection is supposed to be EPSG:4326, but our previous map example relies on EPSG:2154, a local projection. By setting this parameter, we are able to tell our application to make a reprojection from EPSG:4326 to EPSG:2154.
How can we be sure it works? You just need to inspect your GeoJSON file and see the coordinates. For EPSG:4326, the approximate values are mostly less than a hundred degrees, whereas with EPSG, the units are meters and expressed with thousands of meters.
For this purpose, we already set a listener with countriesSource.once('change', function(evt) { to inspect the features values. We checked before firing the console.log statements that the GeoJSON was ready to use getState. Then, we tried to inspect the coordinates that the layer vector source contained. As you can see, we chained methods to write a shorter code. We requested all the features with the getFeatures method; the 0 index is to select only the first feature in the array. By reusing this feature, we got geometry with getGeometry, and on this geometry, we retrieved the coordinates.
With a second console.log, we started like the previous statement, but we cloned the geometry. It's because we wanted to keep the values in the original feature intact. The API documentation mentions about the ol.geom.Geometry transform method that it transforms a geometry from one coordinate reference system to another, modifies the geometry in place. If you do not want the geometry modified in place, first clone() it and then use this function on the clone.
If you extend both returned arrays in the console, you will see that the transformation to EPSG:2154 was already stored in the features, and by transforming again, we were able to get the EPSG:4326 original values.
For the rectangle box in the new layer, we choose another way to manipulate projections with vector. We choose to use an empty source within a new vector layer.
The goal was to show you that when you need to add features using the addFeatures method from the ol.source.GeoJSON vector source, you need to reproject features using an object ol.format. Here, we used ol.format.GeoJSON, but it could have been ol.format.WKT. As long as the type of format accepts dataProjection and featureProjection as options in the readFeatures, you can make reprojections.
The important part to keep in mind is the role of the ol.format.GeoJSON methods, readFeatures and writeFeatures and their options.
When you use readFeatures, you reproject from EPSG:4326 to EPSG:2154, and when you use writeFeatures, you reproject from EPSG:2154 to EPSG:4326.
At the code level, when you use readFeatures, you need to provide a string or a GeoJSON object with options and when you write them, it must be Array.<ol.Feature> with options. An excerpt from the document will help to understand those options (common to readFeatures and writeFeatures), as follows:
We also need to mention that for simplicity, we used readFeatures and writeFeatures, but for only one feature (when outside a GeoJSON FeatureCollection), you have to use the readFeature and writeFeature methods (note the singular in the methods' names). Refer to the complete API documentation for more at http://openlayers.org/en/v3.0.0/apidoc/ol.format.GeoJSON.html.
After this review, it's up to you to imagine how you can play with features from the source and also how to manage projections in other formats in various use cases, as we mainly focus for demonstration on GeoJSON.
Q1. Give some reasons why you might want to use a projection other than EPSG:3857?
Q2. Which areas will not be best suited for displaying the EPSG:3857 projection?
Q3. You need to get your local country EPSG code, where do you need to go to be efficient?
In this chapter, we talked about projections. We covered what they are and the various different types of projections. Longitude, latitude, and other geographic concepts were also discussed. While we just scratched the surface of these pretty complex topics, you should have enough fundamental information to understand how to use projections.
We also talked about the ol.proj.Projection
class and the namespace ol.proj associated for coordinates' manipulation, along with how to transform coordinates and use the Proj4js library. You'll often work with data in coordinate systems other than EPSG:4326, and knowing how to work with and transform data in other projections is important. Because Proj4js alone is not useful without OpenLayers 3, we also reviewed the different use cases for managing projections in a layer context, depending on the main layer type, for example, vector or raster. It can be useful to know reprojection in vector when you want to manage projections in the various ol.format classes we already discovered in Chapter 5, Using Vector Layers.
Now, after reviewing how projections work, it's time to review how interactions components work. Without even being aware, we already use them but never really highlighted them until now. When you pan the map for instance, you are already using interactions. Let's dive into the next chapter, Interacting With Your Map.
This chapter's goal is to review main interactions in OpenLayers 3. Interactions are components that manage relations between mouse or keyboard actions and the map. They do not rely on HTML elements like buttons.
What are the main interactions? It's the most asked function for end users, such as interactions with events on the map to retrieve map or layers information or to create new information with a drawing. You can, for example, click on a polygon representing a property and find out who owns the place and since when. All such information is called attributes. Along this chapter, we will see how to use main interaction-related components, in particular for querying, drawing, and modifying geographical features. Then, we will see the default interactions at both the functional and code levels. We will end by reviewing the remaining interactions.
In this chapter, we will cover:
Let's get started by reviewing the part related to conversion and selection of vector formats.
Selection is mainly achieved through vector layers. So, a small introduction to data conversion can be useful.
In this section, we want to introduce you to the creation of static data in a particular vector, which is required in most cases where there is a need to click on your map to get information.
Let's see how you can provide vector data to our OpenLayers 3 library. We will not explain again how to work with vectors here—just how to provide them.
If you remember, we told you in Chapter 1, Getting Started with OpenLayers, in the section Anatomy of a web-mapping application, that the OpenLayers 3 library can consume dynamic vector data or static. The main difference resides in the fact that data is dynamically provided on demand. At the end of it all, OpenLayers consumes the same formats.
As a reminder for vector layers, the main following formats are supported:
You can go further by reviewing the content from Chapter 5, Using Vector Layers, and inspecting all ol.format.* available following the API documentation at http://openlayers.org/en/v3.0.0/apidoc/ol.format.html. You should not forget some formats can be abstract classes for other formats.
We have chosen to focus only on GeoJSON and KML: they are the most used formats for static files. As long as your applications do not use large amount of data, it's one of the most practical solutions. But most of the time, we don't have data directly available in those formats: a large percentage of geographic data production and manipulation is done using desktop mapping software that does not use those formats as a primary storage solution.
To understand why, let's see a context where you start to make your own examples. In this case, you have three main choices to have data:
From a programmer's point of view, GIS (Geographical Information System) is software to manage geographical datasets and make maps. We really chose to restrict the definition to keep it simple. That's why we encourage you to learn further by starting with the GIS Wikipedia page http://en.wikipedia.org/wiki/Geographic_information_system and also try out searches through search engines on the topic.
GIS was first used for desktop applications. With the growth of the Web, the GIS world extended to the Internet. The main problems to fill the gap between desktop-oriented geographic data and web geographic data were:
The second is also partly broken with open data, but lots of open data datasets always use GIS Desktop formats like the shapefile. We will not explain this format but demonstrate by an example of how you can do some data conversion.
To find open data portals, the main entry for America is https://www.data.gov.
For Europe, you should visit http://publicdata.eu.
For a worldwide overview, go at http://datacatalogs.org, a website for A Comprehensive List of Open Data Catalogs from Around the World.
To grasp the state of OpenData in your country, you can visit the Global Open Data Index at http://global.census.okfn.org. It's a website maintained by the community to make surveys about each country's open data initiative. The focus is mainly about the type of open data datasets available.
For illustration purposes, we will use data coming from the Geographical Information System at the Commission (GISCO), a Eurostat (an European commission organism) service which promotes and stimulates the use of GIS within the European Statistical System and the Commission. We chose to use the Nomenclature of Units for Territorial Statistics (NUTS), the main administrative units within Europe. Perform these steps to achieve the objective outlined in this paragraph:
ZIP file. After that, click on the Submit button. The following screenshot is the result of these two steps:shp file name NUTSV9_LEAC.shp. You will also see in the page center an Overview Map.ZIP file mygeodata.json. Here's how the screen will look upon performing these steps:NUTSV9_LEAC.json. Rename it now to nutsv9_lea.geojson. Our application will use it later.We saw how we can use an external online website to have a first approach of geographical data conversion without installing specific software on your machine. You also saw that you only review a small part of the possibilities of the online tool to make conversion.
After this small conclusion, let's work more on the topic of data.
Remember that we introduced open data portals during the chapter and GIS files formats in particular in Chapter 5, Using Vector Layers. To revise and go a bit further, perform the following tasks:
Data conversion tips
We chose to introduce you to an on-line application to make GIS data conversion. Imagine that you need to filter a large dataset and the upload size is big; you may need to use a local application for this. We advise you to do it with QGIS at http://qgis.org, an open source desktop software where you can view the geographical dataset itself in a GUI. If you prefer the command line, you'd better use GDAL (Geospatial Data Abstraction Library), a tool to make GIS data conversion, available at http://gdal.org.
You should also visit the website http://www.mapshaper.org. Contrary to the reviewed use case, the goal of MapShaper is to simplify the data in order to get a lighter dataset, in particular to gain time when loading. Do not hesitate because most of the time, you don't need a high level of precision!
With this example, you will also be able to learn some useful things that you will learn more deeply in Chapter 6, Styling Vector Layers. Perform the following steps to do just that:
2360_08_01_simple_select.html and put it in the sandbox directory.assets folder, and put the file nutsv9_lea.geojson there, or download it also from the support site. python -m SimpleHTTPServer because of Ajax's same-origin policy requirements.http://localhost:8000/2360_08_01_simple_select.html if you use the Python server) to click on the blue features. Use the Shift key, and select more than one feature to get a result that might look like the following screensot:Let's have a look at the code used in this task.
First, we declared the usual raster layer as the background with the following code:
var raster = new ol.layer.Tile({
source: new ol.source.MapQuest({layer: 'sat'})
});Then, we started to declare the style that is applied when we select one or more features. It's exactly like the usual styling.
Later, when selecting with the ol.interaction.Select, we will reuse this style. Here's how we declare the style:
var selectEuropa = new ol.style.Style({
stroke: new ol.style.Stroke({
color: '#ff0000',
width: 2
})
});This part is dedicated to preparing styling for the vector layer when there is no selection; it's the blue stroke you see in the preceding screenshot:
var defaultEuropa = new ol.style.Style({
stroke: new ol.style.Stroke({
color: '#0000ff',
width: 2
})
});Next, we started to declare the vector layer and its source ol.source.GeoJSON, where we mentioned the projection of the map and the GeoJSON file we produced in the previous part of the chapter. We lowered the GeoJSON file and renamed the extension nutsv9_lea.geojson. We added into the style property in ol.layer.Vector an ol.style.Style class that uses your previous defaultEuropa, as follows:
var vectorEuropa = new ol.layer.Vector({
id: 'europa',
source: new ol.source.GeoJSON({
projection: 'EPSG:3857',
url: '../assets/data/nutsv9_lea.geojson'
}),
style: defaultEuropa
});We also needed to declare the interaction constructor to make the selection, or our style for selection will never work.
The way to do it is to instantiate it with:
var selectInteraction = new ol.interaction.Select({
condition: ol.events.condition.singleClick,
toggleCondition: ol.interaction.condition.shiftKeyOnly,
layers: function (layer) {
return layer.get('id') == 'europa';
}
});When you are in a complex map, you have more than one layer. Using the option layers is the way to say the click will only query information from layers that match the condition. You use a function to do this filtering. You can also use an array of layers, but it's less powerful. So, if you click in a place where a feature with layer id is 'europa', it will apply the right style. The condition variable is a static variable you can choose when you want to change behavior for select. By default, it's the single click that triggers the selection, but it can also be, for example, the Alt + click that can do it if you wish. It's also the same for toggleCondition. The purpose of this property is to set the condition when you want to toggle selection. In this case, we just use the default condition for learning purposes.
Then, we do the usual operations: declare the center, the view, and the map, then add to the map the layers, and set the view for the map, as follows:
var london = ol.proj.transform([-0.12755, 51.507222], 'EPSG:4326', 'EPSG:3857');
var view = new ol.View({
center: london,
zoom: 6
});
var map = new ol.Map({
target: 'map'
});
map.addLayer(raster);
map.addLayer(vectorEuropa);
map.setView(view);At the end of it all, we finished by adding the ol.interaction.Select object, as follows:
map.getInteractions().extend([selectInteraction]);
An alternative syntax to get the same result can be done by adding it in the interactions property of the ol.Map constructor, as follows:
var map = new ol.Map({
interactions: ol.interaction.defaults().extend([selectInteraction]),
target: 'map'
});After this first introduction, let's do another useful example to learn how to manage multi-selection or make a selection with points instead of polygons.
Now, let's reuse the previous example and discover more.
2360_08_01_simple_select.html in a new file called 2360_08_02_select_options.html.vectorEuropa declaration, add the following JavaScript code to create the vector layer for points. A new dataset, a GeoJSON file france_4326.geojson, is available on the book's webpage:var defaultFrancePoints = new ol.style.Style({
image: new ol.style.Circle({
fill: new ol.style.Fill({
color: 'blue'
}),
stroke: new ol.style.Stroke({
color: '#ffcc00'
}),
radius: 8
})
});
var selectFrancePoints = new ol.style.Style({
image: new ol.style.Circle({
fill: new ol.style.Fill({
color: '#ff0000'
}),
stroke: new ol.style.Stroke({
color: '#ffccff'
}),
radius: 16
})
});
var vectorFrancePoints = new ol.layer.Vector({
id: 'france',
source: new ol.source.GeoJSON({
projection: 'EPSG:3857',
url: '../assets/data/france_4326.geojson'
}),
style: defaultFrancePoints
});selectInteraction declaration, as follows:var selectInteraction = new ol.interaction.Select({
layers: function(layer) {
return layer.get('selectable') == true;
}
});vectorEuropa, add the new vector layer, as follows:map.addLayer(vectorFrancePoints);
selectable to be more meaningful, as follows:vectorEuropa.set('selectable', true);
vectorFrancePoints.set('selectable', true);We will not review all the code, but focus only on important points.
In the new block that declares the vectorFrancePoints layer, we just reviewed the vector point styling. Using the ol.style.Circle component, we set in style with the key image.
We kept the logic of the styles in order to keep the behavior for the selection: rules as reminders are applied if conditions they contain are met, whereas the style in ol.layer.Vector is the default style for the vector layers.
In the selectInteraction declaration, we changed the property that helps match our layers. Previously, we were matching using id with the value europa, and now, we are matching if a property selectable is true. But, as we do not declare initially in the layers some properties, we set them by adding a selectable property to both layers.
After you've seen everything you have to know about the ol.interaction.Select component, it's time to try to go further to really acquire knowledge by yourself about this part of the library.
For this, reuse the previous example and improve it using the following instructions:
linestrings. It can be SHP, KML, or GeoJSON. If required, transform the format to be able to consume it with the OpenLayers 3 library.styles you have to use to style the linestrings layer.ol.dom.Input to be able to play on selectability.Until now, we have only focused on the ol.interaction.Select component. Its main goals are to be able to highlight information by making a symbolization change and get information from the geographic features, for example.
But how can you also return information from the layers on your map and show them? That what we will see in the next part.
If you remember the description of layers, two main layers types are vector and raster. Some layers with specific ol.source accept methods to access geographic features in your map. The map queries each of the specified layers for this information, but not all layers support this. Only layers that support querying for geographic features will return results.
Without going deep into explanation, think that for the vector, you are querying the features near the point where you've done the click. Whereas for raster, you ask a remote resource to get a position on the image and extrapolate from this position the features of the image.
We will first review how to work with a vector source and then with raster sources. Do not worry if you don't already understand everything: we will review some concepts in the chapters dedicated to layers in particular.
So, we will see first how to get features from vectors, then explore how to do it from the method associated with raster, and try to discover where they differ.
Let's try with another example to discover more about the forEachFeatureAtPixel method. It should remind you about the last sample from Chapter 5, Using Vector Layers. To complete the task, check the following steps:
2360_08_01_simple_select.html in a new HTML file 2360_08_03_foreachfeatureatpixel.html.ol.js JavaScript file reference with ol-debug.js.map.on('click' , function(evt) {
var pixel = evt.pixel;
console.log(evt);
console.log(pixel);});console.log statements, and add the following code just after the line var pixel = evt.pixel;displayFeatureInfo(pixel);.displayFeatureInfo before the map.on( code:var displayFeatureInfo = function(pixel) {
var features = [];
map.forEachFeatureAtPixel(pixel, function(feature, layer) {
features.push(feature);
});
console.log(features);};console.log with this code:var container = document.getElementById('information');
if (features.length > 0) {
var info = [];
for (var i = 0, ii = features.length; i < ii; ++i) {
info.push(features[i].get('N3NM'));
}
container.innerHTML = info.join(', ') || '(unknown)';
} else {
container.innerHTML = ' ';
}<div id="information"></div>
First, with console.log, we tried to see the event content and also get the pixel position with an array of x, y, where we click. Next, we made a call to the function that relies on a map.forEachFeatureAtPixel function. Its purpose is to get back every feature under the click using the pixel position from the event where we want to see the return you get from the callback in success property and also restrict the action on the vectorEuropa layer.
We also saw that the return contained the ol.Feature object, and because of this, we chose to play to try if the return was empty or not. As a click can send back more than one feature, we used a loop to push the features property N3NM information in an array. Depending on this, we have the choice to display or not the name of the NUTS region with the attribute N3NM in a DOM element in the screenshot FR717 Savoie.
After this review, we know how to retrieve and manipulate information from vector layers. You understand that the method map.forEachFeatureAtPixel within displayFeatureInfo sends back ol.Feature. You can manipulate to retrieve geometry or attributes from the layers you click on.
There is another way to retrieve information when clicking, and it's with the WMS getGetFeatureInfoUrl method. In which circumstances should we use it, and why does it exist?
The title can be unclear if you don't already have some basics.
For this, we will start by reviewing the Open Geospatial Consortium (OGC) Web Map Services (WMS) standard.
Let's begin with the basics of WMS, and later, we will come back to the main topic.
For this, we will reuse two excerpts from the Geoserver documentation (a server-side component that can work with the OpenLayers 3 library).
The first one summarizes what WMS is:
"The OGC Web Map Service (WMS) specification defines an HTTP interface for requesting georeferenced map images from a server."
The second one, a table, gives you the type of requests the WMS standard can perform:
In this list of possible operations, the most common operation is GetMap, an operation that send back an image to display in a client, JavaScript or desktop.
But you also see GetFeatureInfo, an optional operation for WMS.
Here, when you read, the point is that it's not the client side that manages returned features, but the server side. The purpose here is to have less load on the client side: managing a lot of features in the client side is mainly a pain, in particular if you use DOM.
The idea is to send the information to a server and retrieve the minimum and really light result. The result can be an HTML, a GML, raw text or depending on your server, also a GeoJSON. To illustrate, type into your browser the following URL:
You will see an HTML table with information from the point where we clicked on: INFO_FORMAT= text/html. It is the way to say we want an HTML format return.
As a conclusion, just retain at the moment that when you choose to use the OpenLayers getGetFeatureInfoUrl method, you are supposed to use it with WMS layers.
Now, you have enough knowledge, let's go back to the main topic.
Let's start with a new example:
2360_08_01_simple_select.html to reuse it as a model in 2360_08_04_getgetfeatureinfourl.html.ol.js file the HTML content that follows:<script src="http://code.jquery.com/jquery-1.11.0.min.js"></script>
<script> </script>. Next, add the following code into the same block:var wms_layer = new ol.layer.Tile({
source: new ol.source.TileWMS({
url: 'http://demo.opengeo.org/geoserver/wms',
params: {'LAYERS': 'ne:ne'}
})
});
var view = new ol.View({
center: [0, 0],
zoom: 1
});
var map = new ol.Map({
layers: [wms_layer],
target: 'map',
view: view
});
var viewProjection = view.getProjection();
var viewResolution = view.getResolution();
map.on('click', function(evt) {
var container = document.getElementById('information');
var url = wms_layer.getSource().getGetFeatureInfoUrl(
evt.coordinate, viewResolution, viewProjection,
{'INFO_FORMAT': 'text/javascript',
'propertyName': 'formal_en'});
if (url) {
var parser = new ol.format.GeoJSON();
$.ajax({
url: url,
dataType: 'jsonp',
jsonpCallback: 'parseResponse'
}).then(function(response) {
var result = parser.readFeatures(response);
if (result.length) {
var info =[];
for (var i = 0, ii = result.length; i < ii; ++i) {
info.push(result[i].get('formal_en'));
}
container.innerHTML = info.join(', ');
} else {
container.innerHTML = ' ';
}
});
}
});We started by creating a tiled WMS layer, a raster type layer. Next, we created the view and the map. Then we got parameters from the view required later in the code—the resolution and the projection—and we got the DOM element information reference where we will display our click result. The most important part happens in the declaration map.on('click', function(evt) {, means wherever you click in the map, the code within the block is executed.
In this block, we declared an url variable to call the WMS web service. Its result was provided by a function generated from a WMS source using also the coordinates of the click, the resolution, the projection, and the query parameters.
The coordinates were provided by the click. The query parameters defined the returned type expected from the web service. In this case, we wanted the JSONP return encapsulating GeoJSON (JSONP) using 'INFO_FORMAT': 'text/javascript'. They also help to select only the properties we want from the web service ('propertyName': 'formal_en').
You can discover more by setting a breakpoint, and when clicking on the map, copying the URL string, and then, opening it in a new browser window to inspect.
Then, we declared an ol.format.GeoJSON object called parser, a component designed to understand the returned GeoJSON content from the Ajax call just after.
The Ajax call was done using a jQuery function $.ajax({...}).then(function(response) {, hence the jQuery script addition previously. The url parameter is not enough to manage JSONP. We need to custom the Ajax call to manage JSONP. JSONP allows remote calls to resources external to your website without encountering any issues with Ajax same origin policy (see the Wikipedia web page about the subject https://en.wikipedia.org/wiki/Same-origin_policy).
The code in the block reuses the received content and adds it as a JavaScript object in the result variable. This new object, an array, is manipulated to retrieve the text data United States of America and displays it in the container DOM element.
It's recommended also that you see in the network panel what happens every time you click on the map. The following screenshot is a depiction of the network panel:
The important thing here is you rely on a web service able to provide a raster map based on a standard, and you are also able to get remotely the features below the place where you click. The main advantage here is to have less coupling between your server code and your JavaScript code. However, on the other side, you can suffer from latency (time to receive the response from the URL call). Up until now, every piece of information returned was always displayed in a DOM element outside of the map. How can we display it on the top of the map as a pop-up?
That's what we will see in the next part mainly based on ol.Overlay, a component we already use in the Chapter 2, Key Concepts in OpenLayers.
To add a pop-up, you can rely exclusively on HTML and CSS, but the OpenLayers 3 library bundles a component to help you to display information in a pop-up.
You will find below the reference for this component called ol.Overlay. Only a light review will be done here because some examples will follow to illustrate.
The object is instantiated with a constructor such as:
var yourOverlay = new ol.Overlay({
element:document.getElementById('yourOverlayElement')
})Because ol.Overlay inherits from ol.Object, we only describe here the methods related to the object itself.
You can check out the complete ol.Overlay API documentation at http://openlayers.org/en/v3.0.0/apidoc/ol.Overlay.html.
After this small component review, we will first see the simplest case for using ol.Overlay with a static example where the information is not coming from any query but only from a DOM element.
To illustrate the simplest use case for ol.Overlay, let's perform the following steps:
2360_08_01_simple_select.html, we always used in the chapter, in a new file 2360_08_05_simple_overlay.html. You can also check the code at the Packt code book URL.assets/css/samples.css this code:#popup {
background: red;
}<div id="map" class="map"></div> with <div id="map" class="map">, as follows:<div id="popup"><b>OpenLayers 3 Code Sprint</b> <i>Humanities A3</i></div> </div>
var popup = new ol.Overlay({
element: document.getElementById('popup')
});
var osmLayer = new ol.layer.Tile({
source: new ol.source.OSM()
});
var ol3_sprint_location = ol.proj.transform([-1.20472, 52.93646], 'EPSG:4326', 'EPSG:3857');
var view = new ol.View({
center: ol3_sprint_location,
zoom: 16
});
var map = new ol.Map({
target: 'map'
});
map.addLayer(osmLayer);
map.setView(view);
map.addOverlay(popup);
popup.setPosition(ol3_sprint_location);Let's review the code to understand the way ol.Overlay works.
First, we defined a new ol.Overlay with the following:
var popup = new ol.Overlay({
element: document.getElementById('popup')
});The element property in the object literal option of the constructor has to reference an HTML element.
Here, we reference the HTML text <b>OpenLayers 3 Code Sprint</b> <i>Humanities A3</i> located in a <div> tag with an id value of popup.
Next, we performed the usual steps, such as creating layers, creating map, adding the layers, and setting the view, as follows:
var osmLayer = new ol.layer.Tile({
...
...
map.setView(view);Just after this block, we added the ol.Overlay object to the map in order to declare that we are using an overlay:
map.addOverlay(popup);
Instead of adding overlays after the preceding map, you can also use the option in the ol.Map constructor, as shown in the following sample:
var map = new ol.Map({
target: 'map',
overlays: [popup]
});The following line was to set the position of the DOM element by matching coordinates and image position:
popup.setPosition(ol3_sprint_location);
The name overlay implies also that there is something at the top of something else. To understand, just see the screenshot of the Chrome Developers Tools Elements panel, as follows:
As you see, the pop-up is included in a div tag, also contained in a div tag with class ol-overlaycontainer situated after the canvas element (where the map is drawn).
Now, let's assemble our knowledge with overlay and map feature methods.
In this case, we will reuse just the previous example as a model.
2360_08_06_layer_overlay.html.<b>OpenLayers 3 Code Sprint</b> <i>Humanities A3</i> from the HTML.osmLayer declaration, add the following code, where we are reusing again the vectorEuropa layer with the styles:var selectEuropa = new ol.style.Style({
stroke: new ol.style.Stroke({
color: '#ff0000',
width: 2
})
});
var defaultEuropa = new ol.style.Style({
stroke: new ol.style.Stroke({
color: '#0000ff',
width: 2
})
});
var vectorEuropa = new ol.layer.Vector({
id: 'europa',
source: new ol.source.GeoJSON({
projection: 'EPSG:3857',
url: '../assets/data/nutsv9_lea.geojson'
}),
style: defaultEuropa
});ol.interaction.Select component, as shown in the following code.var selectInteraction = new ol.interaction.Select({
layers: function (layer) {
return layer.get('id') == 'europa';
}
});map.addLayer(osmLayer);, add to the map the following new layer:map.addLayer(vectorEuropa);
map.addOverlay(popup);, add the code that follows:function pickRandomProperty() {
var prefix = ['bottom', 'center', 'top'];
var randPrefix = prefix[Math.floor(Math.random() * prefix.length)];
var suffix = ['left', 'center', 'right'];
var randSuffix = suffix[Math.floor(Math.random() * suffix.length)];
return randPrefix + '-' + randSuffix;
}
var container = document.getElementById('popup');
var displayFeatureInfo = function(pixel, coordinate) {
var features = [];
map.forEachFeatureAtPixel(pixel, function(feature, layer) {
features.push(feature);
});
if (features.length > 0) {
var info = [];
for (var i = 0, ii = features.length; i < ii; ++i) {
info.push(features[i].get('N3NM'));
}
container.innerHTML = info.join(', ') || '(unknown)';
var randomPositioning = pickRandomProperty();
popup.setPositioning(randomPositioning);
popup.setPosition(coordinate);
} else {
container.innerHTML = ' ';
}
};
map.on('click', function(evt) {
var coordinate = evt.coordinate;
displayFeatureInfo(evt.pixel, coordinate);
});First, we added to the previous example the vector EuropaLayer in order to have areas easier to click on. It's because areas cover the entire map contrary to points where you need accurate clicking.
Next, we declared a function pickRandomProperty in order to generate a random string, fitting positioning parameters expected by the ol.Overlay component for a small demonstration purpose.
Then, we declared a modified displayFeatureInfo function reusing most of the code from 2360_08_03_foreachfeatureatpixel.html, where we set the positioning and the position. The position requires coordinates, so we added a second argument to displayFeatureInfo.
For positioning, we chose to display the content by changing the pop-up position randomly. This position is relative to the click event; to get this result, we reused the function pickRandomProperty, as follows:
var randomPositioning = pickRandomProperty(); popup.setPositioning(randomPositioning);
We also used the setter on the pop-up element in order to change its position according to the retrieved click coordinates, as follows:
popup.setPosition(coordinate);
We finished with the now quite usual block to add a click event to the map map.on('click', function(evt), but we retrieved the coordinates also and not only the pixel position to reuse the function displayFeatureInfo.
Now, you will learn to make dynamic use of ol.Overlay. You are also able to put a pop-up on your map using your geographic features.
You can try by yourself some experiments by following instructions given in the next section.
In order to go further, we advise you to do some exercises with ol.Overlay.
Your new assignment can be the following:
setTimeout() function to stop displaying the pop-up after some time. You can see a reference about setTimeout at https://developer.mozilla.org/en-US/docs/Web/API/WindowTimers.setTimeout. A short article at http://davidwalsh.name/javascript-debounce-function will also help you to understand why it can be useful.Interactions can happen not only with selecting and displaying information from your map. It's also possible, for example, to create new features by drawing points, lines, or polygons. You can also update features. We will mainly focus on geometric representations because the built-in functionalities in OpenLayers 3 are mainly dedicated for this.
To be able to do a basic save, we have developed a server-side script based on Node.js, a software platform for scalable server-side and networking applications. For the client side, the code will be more classical.
index.js and package.json files from the code from upcoming_url and put them in the ol3_samples directory.ol3_samples folder path, as follows:npm install
features.geojson into ol3_samples/assets/data/.index.js and opening http://localhost:3000/features.geojson. You should see something like the following:{type: "FeatureCollection", features: [ ]}2360_08_07_create_new_content.html in the usual sandbox folder by copying 2360_08_01_simple_select.html.<div> tag for the map and a form to enable you to choose future drawing types (point, line string, and polygon) with the following code:<div id="map" class="map">
</div>
<form class="form-inline">
<label>Geometry type </label>
<select id="type">
<option value="Point">Point</option>
<option value="LineString">LineString</option>
<option value="Polygon">Polygon</option>
</select>
</form>
<script src="../assets/ol3/ol.js"></script>
<script src="http://code.jquery.com/jquery-1.11.0.min.js"></script><script> without forgetting to close it at the end, and copy the following code into it:var raster = new ol.layer.Tile({
source: new ol.source.MapQuest({layer: 'sat'})
});
var source = new ol.source.GeoJSON({
url: '/features.geojson'
});
var vector = new ol.layer.Vector({
id: 'vector',
source: source,
style: new ol.style.Style({
fill: new ol.style.Fill({
color: 'rgba(255, 255, 255, 0.2)'
}),
stroke: new ol.style.Stroke({
color: '#ffcc33',
width: 2
}),
image: new ol.style.Circle({
radius: 7,
fill: new ol.style.Fill({
color: '#ffcc33'
})
})
})
});
var map = new ol.Map({
layers: [raster, vector],
target: 'map',
view: new ol.View({
center: [-11000000, 4600000],
zoom: 4
})
});http://localhost:3000/sandbox/2360_08_07_create_new_content.html to see the definitive sample look.var typeSelect = document.getElementById('type');
function addInteraction() {
draw = new ol.interaction.Draw({
source: source,
type: typeSelect.value
});
map.addInteraction(draw);
}
typeSelect.onchange = function(e) {
map.removeInteraction(draw);
addInteraction();
};
addInteraction();componentReload on the page to see that you can draw but there is no persistency.addInteraction function, copy the following code:draw.on('drawend',
function(evt) {
console.log(evt.feature);
var parser = new ol.format.GeoJSON();
var features = source.getFeatures();
var featuresGeoJSON = parser.writeFeatures(features);
$.ajax({
url: '/features.geojson',
type: 'POST',
data: featuresGeoJSON
}).then(function(response) {
console.log(response);
});
},
this);We created a map that uses a drawing component.
Each time you choose a Geometry type, it removes the ol.interaction.Draw component and adds again a new one using the code in typeSelect.onchange.
In the called function, the key feature is the drawend event bound to the draw component. Each time the user finishes drawing, it fires an event that send a feature.
In our case, we chose to get features from the source as GeoJSON using ol.format.GeoJSON and send them via an Ajax post call.
Depending on your backend, or for client storage, you can change what you want to send. The sample sends all features using a GeoJSON format, but you can customize the URL call, change the format to let's say GML, or only send the added feature and not all the features.
For this last case, you can see the log returned from console.log(evt.feature);.
The assignment will be quite simple because the component at the time of writing needs some refining. It's possible to edit content but there are no events to catch at the end of modification: we will be unable to save the modified features. We will cover the client as is.
2360_08_01_simple_select.html as 2360_08_08_modify.html.var london, add the following code:var modify = new ol.interaction.Modify({
features: selectInteraction.getFeatures()
});map.getInteractions().extend([selectInteraction]); with the following code:map.getInteractions().extend([selectInteraction, modify]);
var selected_features = selectInteraction.getFeatures();
selected_features.on('add', function(event) {
var feature = event.element;
feature.on('change', function(event){
event.target.getGeometry().getCoordinates());
});
});We saw in this sample how to use ol.interaction.Modify here using the modify component. We also saw that it requires ol.interaction.Select. To be able to listen to change, there is no available method on ol.interaction.Modify to directly know the modification to the features. You have to listen to changes on features with selected_features.on('add', function(event) {.
To make this behavior really more obvious, we also used a console.log statement, so when using the browser console debugger, you are able to follow the call when a feature is modified.
After reviewing, drawing, and modifying features, it's time to deepen our interactions knowledge: preferring a practical approach, we only scratched the surface (their definitions) until now.
Until now, we never inspected relations between interactions. So, it's time to examine ol.interaction.* classes. All the classes inherit from ol.interaction.Interaction, but compared to controls, it's less simple; you also have subclasses.
See the following diagram to grasp the relationships between the different interaction classes:
An inspection of the above schema shows that every ol.interaction component inherits from ol.interaction.Interaction. In some cases, when an interaction uses a mouse, pen, or touchscreen, it will need to inherit from ol.interaction.Pointer, which deals with this use case.
You can also note with the schema that interactions are tied to touch events for mobile, mouse events like click or drag, mouse events with the mouse wheel, and the keyboard. You can combine them depending on the expected behaviors. Luckily, by default, you can deal with them with ease. Let's see how. After this, we will explore different ways to make more customizations.
Most of the time, you don't really need to deal with interaction behaviors, but sometimes knowing how to manage them is a requirement.
You have two choices for simple cases:
var map = new ol.Map({
...
controls:[],
interactions:[],
...
});Consider that you need most default behaviors, but you don't need all of them. In this case, you will have to use the ol.interaction.defaults function.
As mentioned previously, the best and simplest way to handle interactions is by reusing the ol.interaction.defaults function, as follows.
Let's review the properties you can set in the options:
Let's deactivate zoom and pan with the keyboard and also the rotate when doing Alt + Shift + mouse drag.
For this, do the following:
<div id="map" class="map"></div> the attribute tabIndex with a value 0 to make it focusable.keyboard option to false in the interactions property of the ol.Map object.altShiftDragRotate option. Try different actions with the left, right, up, and down arrows or with the plus and minus keys.Here you just saw an example to deactivate some default behaviors.
By changing keyboard options to false, we make the application unable to respond to keyboard interaction with pan and zoom.
After reviewing the ol.interaction.defaults function itself, you also learn that each map already embedded nine ol.interaction by default, and for keyboard, the switch works for all keyboard interactions.
Let's see exactly what each of those interactions does at the functional level more than at the code level. We already introduced them in Chapter 2, Key Concepts in OpenLayers, so you should not be lost.
ol.interaction.DoubleClickZoom: This interaction allows users to zoom by double-clicking. You can set the duration to change animation time and delta when you want to change the zoom delta.ol.interaction.DragPan: It allows to you to pan by dragging the map. You can set panning behavior by setting the kinetic property.ol.interaction.DragRotate: This interaction makes the map rotate when you combine both the Alt and Shift keys together to rotate the map image. You can change it by changing the condition property.ol.interaction.DragZoom: It enables you to draw a temporary rectangle when pressing the Shift key with the keyboard. Then, this rectangle is used to zoom on the selected region of the rectangle. You can change the condition for the behavior with a condition, but you can also choose a style when drawing. The most interesting part in this component, other than its behavior, is that it inherits from ol.interaction.DragBox. It means that we will be able to reuse the drawing rectangle behavior for other purposes and not only for zooming like here. Later in the chapter, we shall see how.ol.interaction.PinchRotate: On mobile devices, one of the main interactions is the pinch. In the OpenLayers 3 library's case, it is supported by default. The name itself is enough to understand that this component has a behavior similar to DragZoom, but when pinching. You can set the threshold property if your application requires to change sensitivity for rotating the map.ol.interaction.PinchZoom: As the previous component, it relies on the pinch but in order to zoom. It's like when you are browsing on mobile, but instead of getting only a lens effect, you really make a zoom in your map. You change the animation duration, setting the same duration property in the component.ol.interaction.KeyboardPan: Its role is to manage map browsing using only the keyboard. It needs to make the map focusable by adding a tabIndex attribute at your map div level. To get the focus for the map, you need to use the tab key. Then, panning can be controlled using the up, down, left, and right keys. The option pixelDelta enables you to set the translation in pixels when pushing on the keys. By default, it value is 128 pixels. It is also possible to set the now usual condition property.ol.interaction.KeyboardZoom: Its goal is similar to the previous component except that it applies when you use the keys plus and minus instead. This interaction can be set just as for DoubleClickZoom with the delta property and also the condition too.ol.interaction.MouseWheelZoom: As its name implies, this interaction is related to the use of the mouse wheel to zoom in or zoom out. The only custom behavior you can set for this interaction is the duration of the animation by default to 250 milliseconds.After this more verbose part, it's time to see the missing interactions.
We will first look at ol.interaction.DragRotateAndZoom, and then we will move on to the others.
These other interactions were sometimes used along the book chapters, but we did not always explain them completely; it was impossible with all the other concepts that required explanation at the time.
Let's follow the component's self-explaining name to try out it behaviour :
ol.interaction.defaults sample.interactions block in the ol.Map object as follows:var map = new ol.Map({
...
interactions: ol.interaction.defaults({
shiftDragZoom: false
}).extend([new ol.interaction.DragRotateAndZoom()]),
...
});First, as it can conflict with ol.interaction.DragRotateAndZoom, we deactivated the shiftDragZoom interaction by setting it to false. We chose this option, but it was also possible to change the key to activate the function using the condition property.
You also saw the now-common pattern to add interactions to existing default interaction using an array within the extend block. Practically, you also learned how to use the behavior.
Now, let's jump to the next interaction.
This interaction, according to the official documentation API, is for handling input of vector data by drag and drop. We already saw an example of using this in Chapter 5, Using Vector Layers.
The only additional thing that you can add is that when you drop the file after dragging it, when the event is triggered, you can get not only the features or their projection (experimental), but you can also get the filename. It can be useful, for example, to give a name to the layer, imagining we use the component together with a layer tree.
How did we deduce that it was also possible to retrieve this information? We did this simply by inspecting the API at http://openlayers.org/en/v3.0.0/apidoc/ol.interaction.DragAndDrop.html. It mentions the function signature when an event is fired, as follows:
addfeatures(ol.interaction.DragAndDropEvent).You can see that ol.interaction.DragAndDropEvent is involved. If you inspect its API definition, you will see and not be really surprised to discover members are features, files, and projections.
Just as a quick reminder, here are the DragAndDrop options (experimental):
|
Name |
Type |
Description |
|---|---|---|
|
|
|
These are the format constructors. |
|
|
|
This is the target projection. By default, the map's view's projection is used. |
Now, let's continue with another interaction implying always a drag-related event.
The official documentation describes this interaction as:
"Allowing the user to zoom the map by clicking and dragging on the map, normally combined with an ol.events.condition that limits it to when the Shift key is held down."
When reviewing ol.interaction.DragBox and seeing that it's the base class for ol.interaction.DragZoom, we already give you some hints for other use cases based on the same logic. It can be to select features based on a rectangular selection, to draw a rectangle, or to use it as a bounding box to generate and draw other shapes, such as ellipsoids and circles.
Let's look at how you can, for example, get the drawn rectangle as a GeoJSON string, where you've done a selection. Here, we suppose you are working on your desktop as mouse interaction is not available with mobile devices.
After introducing the goal, we should do the following:
osm_default and map variables.ol.interaction.DragBox, as follows:var dragBoxInteraction = new ol.interaction.DragBox({
condition: ol.events.condition.shiftKeyOnly,
style: new ol.style.Style({
stroke: new ol.style.Stroke({
color: 'red',
width: 2
})
})
});DragRotateAndZoom, deactivate DragZoom, and add the new interaction in the interactions parameter within ol.Map, as follows:interactions: ol.interaction.defaults({
shiftDragZoom: false
}).extend([dragBoxInteraction]),dragBoxInteraction and map declarations:dragBoxInteraction.on('boxend', function(e) {
var format = new ol.format.GeoJSON();
var geom = e.target.getGeometry();
geom.transform('EPSG:3857', 'EPSG:4326');
var feature = new ol.Feature({
geometry: geom
});
var obj = format.writeFeatures([feature]);
console.log(JSON.stringify(obj));
});In the first part, you should be able to draw the rectangle, but no events fired then like with the DragZoom for example. We chose to play with all the available options.
We set the condition to be able to activate the behavior only with the Shift key using ol.events.condition.shiftKeyOnly and changed the style to make a red border with 1 pixel's width.
We added the new interaction but disabled the other, which also uses ol.events.condition.shiftKeyOnly.
Finally, we reused the event listener to catch when the rectangle drawing ends with boxend.
Within this event, we manipulated the returned geometry ol.geometry.Polygon to change it projection and reuse it into ol.Feature. By providing this feature with the writeFeatures method of a new ol.format.GeoJSON, we were able to make the GeoJSON object and converted it into a string.
As a reminder, in the following table, you will find the expected optional parameters (and experimental) for the interaction:
|
Name |
Type |
Description |
|---|---|---|
|
|
|
This is a function that takes |
|
|
|
This is a style for the box. |
After this last assignment for the book, it's time for revision.
Let's look at a few questions to see what we understood during the chapter:
Q1. In a context where we want to query a WMS, what components and methods would be required for this?
ol.Map.ol.layer.Tile.ol.source.ImageWMS.ol.layer.Vector.ol.source.TileWMS.Q2. What will happen if we use the addCondition property value ol.interaction.condition.onlyAltKey to build ol.interaction.Select?
Q3. We want to make a style change. When selecting, what type is required in the option style of ol.layer.Vector?
ol.style.Style.ol.style.Stroke.ol.style.Fill.ol.style.Style.Q4. What is(are) the condition(s) not present by default in the available conditions when using interactions :
ol.events.condition.neverShift.ol.events.condition.never.ol.events.condition.shiftAlways.ol.events.condition.noModifierKey.ol.events.condition.shiftKeyOnly.In this chapter, we discovered more about the way to query information from your map. Compared to a paper map, interactive feedback from a map is one of the most powerful features you can expect. We hope following our guidance was not too tough.
Starting with data manipulation, you learned more about the complex world of GIS. Next, we discovered about the dedicated components to select and query maps. Afterwards, with a pop-up, we inspected how to nearly reproduce the Push Pins map (you can always reproduce it as an additional task).
We created and modified our own geographical data instead of consuming existing data.
Inspecting the default interactions, we helped to explain some hidden interactions, requiring key and mouse combinations. We didn't restrict our inspection to default interactions: we saw all interactions except the one concerning mobile devices like PinchZoom or PinchRotate as we will review them in Chapter 10, OpenLayers Goes Mobile.
Now, we will dive into controls. Controls are quite similar to interactions, but they depend on the DOM element. We will look at all the available controls in the coming chapter. This chapter will also help you to understand not only the purpose, but also the ways of creating custom controls.
So far, we've taken for granted that we will zoom in/out when clicking on plus or minus buttons. We haven't discussed much about what actually is behind the map interaction when you use buttons. The ol.control namespace contains numerous classes that make our maps interactive, in particular to configure behavior on your map. There are many built-in controls, each with their own unique functions. You can easily customize them with a CSS style or other parameters. Contrary to interactions, controls depend on DOM elements and not keyboard and mouse input only.
In this chapter, we'll cover the following topics:
ol.control classes and their organizationControls allow us to interact with our map. They also allow us to display extra information, such as displaying a scale bar with the ol.control.ScaleLine control. Before, in the previous generation of OpenLayers, version 2.x, some controls did not have a visual appearance. Nowadays, those elements, which do not rely on a DOM element, are called interactions like for example, touch interactions on mobiles. You can have as many controls on your map as you'd like. There are even some cases where you may not want any controls—such as embedding an unmovable map in a page, or showing a static map for printing.
There are two methods for adding controls to a map:
ol.control.* objects when you instantiate the map object.addControl(), method passing in a single control object. If you need to pass more than one control, just loop using an array of control objects, using the same addControl().When you create your map, three control objects are added automatically. These three controls are as follows:
ol.control.Attribution: This is responsible for displaying credits for producers of map data sources or tiles providers like for OpenStreetMap. By default, the control is located in the bottom-right corner.ol.control.Zoom: This is responsible for showing the plus and minus buttons in the top-left corner. Those buttons when clicking help to do a zoom in for plus and a zoom out for minus.ol.control.Rotate: This is responsible for resetting the map rotation to 0.Since these controls are added without us explicitly adding them, how do we choose to not include them? The simplest way is to pass an empty array or null to the control's property when instantiating the map. Another way to change default controls is to explicitly set the options for each of them to true or false when you call the ol.controls.defaults function in the controls property of the ol.Map object.
Let's review this use case before going further.
Follow these steps to start manipulating the default controls:
<!doctype html>
<html>
<head>
<title>Default controls</title>
<link rel="stylesheet" href="../assets/ol3/css/ol.css" type="text/css">
<link rel="stylesheet" href="../assets/css/samples.css" type="text/css" />
</head>
<body>
<div id="map" class="map"></div>
<script src="../assets/ol3/ol.js"></script>
<script>
</script>
</body>
</html><script> </script> add the declaration to the map:var osm_default = new ol.layer.Tile({
source: new ol.source.OSM()
});
var map = new ol.Map({
layers: [osm_default],
target: 'map',
view: new ol.View({
center: ol.proj.transform([-1.81185, 52.443141], 'EPSG:4326', 'EPSG:3857'),
zoom: 6 })
});python -m SimpleHTTPServer or node index.js (if you are using the code from the book samples) because some sources are sensitive to the URL context (or you will get a blank map).ol.control.defaults to cancel all default controls parameters in the map constructor. See the following code to understand this:var map = new ol.Map({ layers: [osm_default],
controls: ol.control.defaults({
zoom: false,
attribution: false,
rotate: false
}),
});Let's examine the interesting part of the code:
controls: ol.control.defaults({
zoom: false,
attribution: false,
rotate: false
})To manage default controls, we must use a parameter in the ol.control.defaults function. This first parameter is an object that contains a key referring to the default controls. You can set their value to false to disable the corresponding control.
This object also supports other keys to set options for each default controls. These keys are attributionOptions, rotateOptions, and zoomControlOptions. We mentioned them here but we will see them later when reviewing each control individually.
The following table, an excerpt from the API documentation of ol.control.defaults, summarizes these properties:
After this long introduction to manipulation of controls, let's review all of them step by step. You can refer to the following diagram for a quick overview of the class hierarchy:
As you can see, all ol.control.* classes inherit from ol.control.Control.
So, first let's see this ol.control.Control.
The ol.control.Control is the parent class of all the available controls. It inherits from ol.Object, an abstract class that also inherits from ol.Observable, a convenient class to provide and manage listeners.
This object is responsible for the common options that all controls contain. All controls inherit from ol.control.Control, and it's exactly the same for the options. To understand its properties, just review how a control can be described.
"A control is a DOM element related to the map and that can be attached to an existing DOM element."
If you refer to the following table. The DOM element is the element property, the place that contains the look for the control. The target property is the place where you add the element into the DOM.
Never forget that it is useful to know ol.control.Control to understand its subclasses, but you never directly use it. You reuse this class only if you need to create your own control but it's not the time for this. First, we need to study controls provided by the Openlayers 3 library, which will be explained in the following sections.
The ol.control.Attribution control is not very new. We are already using it implicitly since we used the ol.layer.OSM class in Chapter 1, Getting Started with OpenLayers.
These are the options concerning the ol.control.Attribution control.
You can see all properties you can set for the control. You should be aware that those properties are considered as experimental in the OpenLayers 3 release.
We will discover the way to customize it in the following section.
Attributions, as a reminder, are the way to mention credits for layers sources that reference source of the tiles and/or data. The ol.control.Attribution control is dedicated for this.
ol.control.defaults options in the controls property of the map, and also set logo options to false at the ol.Map level:logo: false
controls: ol.control.defaults({
attributionOptions: {
},
}),attributionOptions to the following content and reload the page:attributionOptions: {
className: 'myCustomClass'
},myCustomClass to try to understand the effect of the className option in attributionOptions.attributionOptions:attributionOptions: {
className: 'myCustomClass',
target: document.getElementById('myattribution'),
},<div id="map" class="map"> </div>the following content:<br/> <div id="myattribution"></div>
We first introduced you to the className property. This enables you to change the default class name for the control. Then, you can customize your control with CSS according to this new class name. You may have noticed that, in the first case, you were unable to see the content in the browser, but only in the debugger because the element was always attached to the map element with its child, the <div class="ol-viewport" ...> tag.
With the second case, we showed you the purpose of the target property: you can tell the control where you want to attach the control. So, you need to use a DOM selector such as document.getElementById('myattribution').
With this action, you might have seen that the control is now well separated from the <div id="map" class="map"></div> HTML.
It is now easy to customize as per your wish and you can display credits outside of the map: it can be useful when you use a lot of layers and don't want to display too much information.
The ol.control.Zoom control displays a plus and minus element to zoom in and zoom out. It is one of the default controls.
The zoom options are similar to both previous controls but we also have some other properties such as a delta property. The other specific properties are only to change text for the control or when the mouse hovers them.
We will not cover those options as they are quite straightforward to understand but advise you to play with it within the context of OpenStreetMap. If you remember, OpenStreetMap behavior for tiles in Chapter 1, Getting Started with OpenLayers (each zoom multiply zoom by 2), you will also remember how to play with the delta property. For each click on the control, your delta is 1. Change this property to a value, either 2 or 4, and try to click on the plus (+) and minus (-) buttons and see the change.
You can find the properties list for the control as follows:
The ol.control.Rotate control is not really obvious to understand. As OpenLayers 3 targets mobile browsers or applications, it can be useful to reset the rotation when you choose to make an interactive map that relies on the compass from your device. Sometimes, you want to reset the north direction for readability for end users. In fact, this control is a default one.
You can make it appear by reopening the previous example, then click and drag while pressing down both Shift and Alt keys. You will see a result like the following:
Let me remind you that you will find the options available to customize the Rotate control:
You can play around with these options; for example, you can always display North with an arrow like for paper maps with autoHide. It's also possible, if your application is not targeting English-speaking users, to change the tipLabel.
With this control, you can easily switch to the fullscreen mode that relies on HTML5. Also, for this reason, it will work better with a modern browser that supports this feature, such as Google Chrome, Firefox, and so on. Typing Esc will take you out from this mode.
This is the first control we've reviewed that is a not a default one. If you need it, you can use the ol.Collection returned by the ol.control.defaults method and with it the ol.Collection extend method, add the control using an array to the collection, when instantiating ol.Map with the bare minimum (no options):
controls: ol.control.defaults().extend([new ol.control.FullScreen()]),
As a reminder, supposing map is the ol.Map object name, you can also add the control with the following line:
map.addControl(new ol.control.FullScreen());
These FullScreen are options for the FullScreen control. Except for the keys property that depends on latest support in browsers and tipLabel to set the tip text on the button, the properties are the usual ones, the ones inherited from ol.control.Control. All are considered as experimental.
The ol.control.MousePosition control helps you to determine the coordinates where your mouse is pointing on the map.
One way to do this is by instantiating the element with the syntax that follows:
controls: ol.control.defaults().extend( [
new ol.control.MousePosition({
key: value,
...
})
]),The object into the control constructor is optional.
The MousePosition options are the available properties you pass to the control ol.control.MousePosition. They help customize the behavior of the control such as coordinates formatting or units.
We will review these options with an example.
Follow these steps to get started with the mouse position behavior:
myposition such as <div id="myposition"></div>.var mousePosition = new ol.control.MousePosition({
coordinateFormat: ol.coordinate.createStringXY(2),
projection: 'EPSG:4326',
target: document.getElementById('myposition'),
undefinedHTML: ' '
});map.addControl(mousePosition);
assets/css/samples.css:#myposition > .ol-mouse-position {
position: relative;
margin-left: 20px;
font-size: 30px;
}Here, we choose to use most of the options of the controls.
The first one, coordinateFormat, accepts an ol.CoordinateFormatType. It simply means that when you retrieve the coordinates, you may want to change them to Degrees Minutes Seconds notation or you may want to change the precision you display in the HTML file.
The two relevant options to set here are:
Be careful to not set ol.coordinate.toStringHDMS() instead; it's a bit surprising, but you need to use the class itself.
The projection option helps you choose the coordinates you want. You may have forgotten but each projection has a defined unit system (and subunits). For example, the EPSG:4326 projection returns units in a decimal degree. It's what you see in the bottom of the previous image. The undefinedHTML option just sets what you want to display when you are not hovering over the map. You can confirm availability by searching in the Chrome debugger Elements panel, the string in precedent example.
The target option and the CSS part were only to remind you of previous use cases.
We've never really insist until now, but you can also set the parameters after controls creation. In fact, for each property, you always have a setter and a getter.
Just open your browser with the example, type in the console the following line, and hover over the map to understand:
mousePosition.setProjection(ol.proj.get('EPSG:3857'))As you see, you can really explore the methods available in the ol.control.MousePosition control. We really encourage you to play in the console using auto completion: you will see that you can really find useful things that may remind you of other examples. You should also focus on the Fires: part of the API documentation at http://openlayers.org/en/v3.0.0/apidoc/ol.control.MousePosition.html because it will help you to apply your events knowledge in the context of controls and here, the mousePosition control.
If you remember, we already introduced you to this control in the Chapter 7, Wrapping Our Heads Around Projections at a functional level.
The purpose of ol.control.ScaleLine is to show a scale line bar to give people an overview of scale and distance. Be aware that it is only useful for projection that keeps distances.
You just need to add it to the map with something such as map.addControl(new ol.control.ScaleLine()) if you don't use the options.
The following is the options list you can set for the scale line control:
Although this book is about introducing the OpenLayers 3 library, we suppose that if you are reading this, it also means you want to understand what you are doing. So, let's give you some tasks to do by yourself:
minWidth property to a value you want in pixels.ol.control.ScaleLineUnits description is available in the following content). When you want to display your map legend using others units, you need to know the available units. You can find them using the table that follows, extracted from the ol.control.ScaleLineUnits type definitions in the OpenLayers 3 API:|
Name |
Type |
Default |
|---|---|---|
|
degrees |
|
This property returns the the string degrees required for internal library units changes. Check out Wikipedia to learn more on this unit (decimal degree) at http://en.wikipedia.org/wiki/Decimal_degrees. |
|
imperial |
|
This property is similar to previous property but returns the string imperial. Check out Wikipedia to learn more about the unit at http://en.wikipedia.org/wiki/Imperial_units. |
|
nautical |
|
This property is similar to the previous property but returns the string nautical. It refers to nautical miles. Check out Wikipedia for more information at http://en.wikipedia.org/wiki/Nautical_mile. |
|
metric |
|
This property is similar to the previous property, but returns the string metric that refers to metre or meter. Check out Wikipedia for an history at http://en.wikipedia.org/wiki/Metre. |
|
us |
|
This property is similar to the previous property but returns the string US. It refers to US units. Check out Wikipedia for more information at http://en.wikipedia.org/wiki/United_States_customary_units. |
target property or both of themThe ol.control.ZoomSlider control helps you to see your zoom levels using a slider. We advise you to go to the official example at http://openlayers.org/en/v3.0.0/examples/zoomslider.html because it's well illustrated for CSS styling. You can display the slider horizontally or vertically for the example illustrated in the following screenshot:
The following content presents the available options/properties in ol.control.ZoomSlider.
|
Name |
Type |
Description |
|---|---|---|
|
|
| |
|
|
| |
|
|
|
You can manage and try to better understand resolutions by using the getResolution() function at the view level (with map.getView()).
The ol.control.ZoomToExtent control permits you to create a button to go to a particular extent.
In a real context, it may help you to get a map with a zoom on a country, and using this control, you will be able to zoom directly on a particular city. In another case, you may want to go back to the initial extent of your map, and this control is also a way to address this requirement.
In order to learn better, let's try another example:
map.getView().getZoom() and map.getView().getCenter().zoomToExtentControl:var zoomToExtentControl = new ol.control.ZoomToExtent({
extent: [-11243808.051695308, 4406397.202710291, -4561377.290892059, 6852382.107835932]
});map instantiation:addControl(zoomToExtentControl);
var controls = map.getControls();
var attributionControl;
controls.forEach(function (el){
if (el instanceof ol.control.Attribution) {
attributionControl = el;
}
})ol.control.Attribution control using the reference you retrieve and supposing map reference the ol.Map instance.map.removeControl(attributionControl);
Here, we've just seen an example to learn how to manage the ol.control.ZoomToExtent control. The most interesting part is related to the code that enables you to find your control reference without having an object control reference. For this, we use the instanceof JavaScript function.
Now, we also know how to list controls for a map using the map.getControls() function, and also loop through it using the forEach method from ol.Collection.
Finally, we discovered how to remove a control when for any reason, we needed to delete it afterward with the map.removeControl() function. You also have to understand that for learning purposes we don't check everything. For example, imagine there were more than one ol.control.Attribution control. A good exercise can be to change code to manage this case.
These properties set the options for the ol.control.ZoomToExtent control.
Now, we got an overview of controls, let's see how to make our own ones, for specific purposes.
You may wonder "why do we need to learn that?"
Some points to explain this requirement are:
Let's see how we can do it.
Let's get started. Contrary to most examples, it will need more code than usual. So, to keep things simple, we will explain how to build the sample by retrieving the various code files instead of inlining it. After these operations, we will focus on the important parts of the code to understand them:
css class with the export-geojson string from assets/css/samples.css and copy paste them in your own samples.css file. Next, retrieve a new JavaScript file from https://github.com/eligrey/FileSaver.js/blob/master/FileSaver.js into a new subdirectory, assets/js.features.geojson file from assets/data/features.geojson, within the book samples.chapter09/2360OS_09_06_custom_control.html.index.js, open your browser, and draw something. Push on the new button named G just below the minus plus buttons and you can download a file.We will just highlight the most important parts.
At a functional level, we reused ol.interaction.Draw with the possibility to switch between drawing points, lines, and polygons. We removed the server-side dependency for saving the efforts for the same.
Instead we introduced a new component, app.generateGeoJSONControl, with the following snippet:
controls: ol.control.defaults().extend(new app.generateGeoJSONControl({source: source})
]),This component reuses the declared ol.source.GeoJSON vector source used to get a GeoJSON content with the source: source option.
This new control is created by declaring a namespace with:
window.app = {};
var app = window.app;Then, we declared the function with app.generateGeoJSONControl = function(opt_options) { and directly prepared to get opt_options with the following line of code:
var options = opt_options || {};
We made an anchor DOM element, then a temporary variable with var this_ = this; to be able to keep the scope for the getGeoJSON function.
Within this named function, we stopped a default behavior to not get the URL changed and started to manipulate the features from the source to transform them to a GeoJSON string. With a new download function, we made it possible to save the text content in a file.
This declaration is not the call; so, we needed to bind the function to event click and touchstart for desktop and mobiles experiences on the anchor DOM element with:
anchor.addEventListener('click', getGeoJSON, false);
anchor.addEventListener('touchstart', getGeoJSON, false);Near the end, we added a new <div> tag and appended anchor as a child.
We made an interesting statement by using a call function from ol.control.Control:
ol.control.Control.call(this, {
element: element,
target: options.target
});It enables us to reuse the option from the parent control and to set them, for example, target and element, the newly created <div> tag.
Making a call was just to call the function of the parent class; so, after the end of the app.generateGeoJSONControl function, we explicitly used a special declaration ol.inherits to apply the ol.control.Control parent methods and properties to our custom class:
ol.inherits(app.generateGeoJSONControl, ol.control.Control);
Q1. You need to stop the zoom in / zoom out behavior on the map. In the ol.Map object, what do you need to change in the options and why?
Q2. If you want to use panning on your map, what do you need to change in ol.Map?
Q3. Assuming I have made my own control named mycustomControl and I declare the following within ol.Map:
controls: ol.control.defaults().extend([
mycustomControl({source: source})
])What will happen and why?
In this chapter, we discovered more about the controls. Up untill now, we've used it without really understanding their purpose—what can they do for us?
Firstly, we organized our thoughts using inheritance schema. In fact, it's more complicated, but for a beginner book, it was quite enough. We didn't go too deep; we used and reviewed existing components but didn't focus a lot on creating new ones. You don't really need to use augmented controls in most cases. When you need to make a new control, don't hesitate to review the behavior from the various interaction: it's simple to combine them with buttons.
After this review of how to use controls with your map using the available components from API, it's time to dive into OpenLayers support for mobile. You will learn how OpenLayers touch events work but also how to reuse device geolocation and orientation. Using the mobile context, we will review some HTML 5 features that can help with improving application experiences. This overview will cover web mapping sites such as native applications for mobiles.
The rise in popularity of mobile devices—smart phones and tablets—has changed the landscape of web development. Now, users expect our websites and applications to work on their mobile devices' smaller screens, respond to touchscreen interfaces and know where they are via integrated GPS. OpenLayers 3 provides some great features targeting mobile platforms, and we will highlight those in this chapter. But, developing mobile-friendly web applications has its challenges too, so we'll look at how to debug web applications on mobile devices and at some strategies to use when mobile devices lose their network connections.
In this chapter, we will cover the following topics:
One of the biggest differences between desktop and mobile web applications is how we interact with an application. On a desktop or laptop computer, we have a keyboard and a mouse or trackpad, and we point and click or click and drag things. On mobile devices though, there is no keyboard and no mouse pointer. Instead, we use our fingers, and we do things like touch, drag, and tap. We can also do more complicated things, such as pinching two fingers together or rotating two fingers, and we usually expect this to do something in an application. In mapping applications on touch devices, for instance, we might expect that dragging a finger will pan the map and pinching two fingers will zoom in or out.
OpenLayers provides touch support for us in the form of interactions—recall that we talked about interactions in Chapter 8, Interacting with Your Map. The touch-specific interactions are as follows:
ol.interaction.DragPan: This pans the map in response to one or more fingers being dragged across the screenol.interaction.PinchRotate: This rotates the map in response to two fingers twisting in a circular motion on the screenol.interaction.PinchZoom: This zooms the map in or out in response to two fingers pinching in or out on the screenThese interactions are created by default and enabled on devices that support touch events. Let's see them in action!
Because we'll view the examples in this chapter on a mobile device with a browser that does not have direct access to your development machine, we'll need to serve them through a web server and access them using the HTTP protocol. Your computer also needs to be connected to the same Local Area Network (LAN) as your mobile device.
We've already been using a web server with the samples using the URL http://localhost/. This URL uses the name localhost, a special name that tells the web browser to connect to the local machine. This is great for your desktop browser, but it isn't going to work for our mobile device. You'll need to find the IP address of your computer on the LAN.
On Windows, open a command prompt (cmd.exe) and type ipconfig.
You should see something like the following screenshot:
The ipconfig command will output some information about your network connections; the actual output will be different depending on your setup and how you are connected to the network, but you are looking for the marked line in the following screenshot:
Write down the IP address for future reference.
On OSX, you can find your IP address from System Preferences. Perform the following steps to find your IP address:
On Linux, open a terminal window and use the ifconfig command to get your IP address. If you are connecting using WIFI, type:
ifconfig wlanO
If you are connecting using Ethernet (cable), type:
ifconfig ethO
You will see output like the following screenshot:
You should see the IP address between inet addr and Bcast.
Before we continue, let's make sure that the IP address is correct. Replace localhost in your browser address bar with your IP address, and make sure that the page loads the same way. For instance, if you determined that your IP address is 192.168.0.1, then the URL would start with http://192.168.0.1/. Next, open the web browser on your mobile device and enter the same test URL. You should see that page opens in your mobile device's web browser.
If you are having problems with this step, make sure that WIFI is enabled on your mobile device and that it is connecting to the same network as your development machine.
Now, we are ready to test our new setup with a fully mobile-capable OpenLayers application. As you'll see in the following steps, there's nothing special you need to do with OpenLayers itself to work in a mobile environment:
mobile.html:<!doctype html>
<html>
<head>
<title>Mobile Example</title>
<meta name="viewport" content="width=device-width, initial-scale=1.0, maximum-scale=1.0, user-scalable=no">
<link rel="stylesheet" href="../assets/ol3/ol.css" type="text/css" />
<link rel="stylesheet" href="../assets/css/samples.css" type="text/css" />
</head>
<body>
<div id="map" class="full-map"></div>
<script src="../assets/ol3/ol.js"></script>
<script>
var layer = new ol.layer.Tile({
source: new ol.source.OSM()
});
var london = ol.proj.transform([-0.12755, 51.507222], 'EPSG:4326', 'EPSG:3857');
var view = new ol.View({
center: london,
zoom: 6,
});
var map = new ol.Map({
target: 'map',
layers: [layer],
view: view
});
</script>
</body>
</html>We created an example very similar to the ones we've been using in previous chapters and, just by loading it on a mobile device, we get new capabilities from OpenLayers' default touch interactions. We can now pinch to zoom in and out, move two fingers in a circular motion to rotate the map, and touch drag the map to pan around.
We made a couple of small changes to the example we used in previous chapters though, so let's highlight the differences. In the <head> section, we've added a <meta> tag. The <meta> tag provides information to the web browser rendering the page, its name indicates the type of information it is providing, and its content is the information or data we want to inform the browser about. In this case, we've used the viewport <meta> tag to provide some information that mobile web browsers can use to modify how a user interacts with the web page in a mobile browser. Let's break down the content and explain what it's doing, as follows:
<meta name="viewport" content="width=device-width, initial-scale=1.0, maximum-scale=1.0, user-scalable=no">
The content is a series of comma-separated key-value pairs formatted as key=value. The width key indicates how wide the browser's viewport should be. It can be set to a specific number of pixels or to a predefined value device-width, which indicates that the viewport should be 100 percent wide. The initial-scale and maximum-scale keys constrain the mobile browser viewport scale factor, which would allow rendering a page more zoomed-in than its default. Setting the user-scalable key to no disables zooming the web page in response to the user performing a pinch gesture. We want the pinch gesture to zoom the map, not the whole page. We've also changed the class name used on the HTML element that contains the map from map to full-map. This changes the map element to take up 100 percent of the width and the height of the browser viewport.
The remainder of the example is exactly the same as in previous chapters. In fact, you can load this example in your normal web browser, and it should function in exactly the same way as many of the other examples, the only difference being that the map will fill your browser window.
So, we get touch support in our web mapping application without really having to do anything at all. But just supporting touch events isn't that exciting. Let's explore what else OpenLayers has to offer on mobile devices, starting with finding our location.
OpenLayers provides us with the ol.Geolocation class, which can be used to find the current location of the user and to track changes in location over time. This class accesses information provided by web browsers through the HTML 5 Geolocation API.
Before we go any further, it's important to discuss the technology behind the Geolocation API a little bit to understand its limitations. The location of a device can be determined by several methods. Typically, we think of the location as being determined by a Global Positioning System (GPS), but in practice, the location of a device can be determined by several means, including the following:
A mobile device can use any of these techniques to determine its location, and the owner of the device can choose to turn any or all of these methods off, perhaps for privacy reasons or to conserve battery power.
Let's add another resource to our page, so that we can access some nice icons. In the past, we might have done this by creating images for each of the icons we wanted and then adding <img> tags. We are going to try a different approach this time using an iconic font called Font Awesome. We'll discuss why after the example; for now, just follow these steps:
<link> tag to the <head> tag of your HTML document, just after the link to ol.css:<link href="//netdna.bootstrapcdn.com/font-awesome/3.2.1/css/font-awesome.css" rel="stylesheet">
<style> section inside the <head> tag:<style>
.marker {
position: absolute;
width: 24px;
height: 24px;
font-size: 24px;
}
</style><div> tag just after the map <div> tag:<div class="map"></div> <div id="location" class="marker icon-flag"></div>
<script> tag, after all the other code:var marker = new ol.Overlay({
element: document.getElementById('location')
});
map.addOverlay(marker);
var geolocation = new ol.Geolocation({
tracking: true
});
geolocation.bindTo('projection', view);
geolocation.bindTo('position', marker);Step 1 adds a link to a stylesheet that defines an iconic font, which we'll discuss in more detail in just a moment. In step 2, we created a new CSS class called marker that we can add to the HTML elements we want to be displayed as markers on the map. This class sets the width and height of the element to be 24 pixels and also the font size, as we are using an iconic font for our marker images. In step 3, we added the HTML element we want to use as our marker. We gave it an ID of location, so that we could refer to it later and added both marker and icon-flag to the class. The marker class makes the element a specific size, and the icon-flag class indicates which icon to use from our iconic font. In step 4, the new code we added creates a new ol.Overlay attached to our marker element and adds it to the map. Then, we create an instance of ol.Geolocation and tell it we want to track location updates. Then, we bind the projection property of the geolocation object to the view's projection and position properties to the marker. The geolocation object will now automatically convert location updates into the correct projection for our view and move our marker overlay to our current location.
Iconic fonts are just like any other font, except that the characters in the font are designed as pictures instead of letters. Like text in a web page, the icons in a font are easily resizable and adapt to different resolution displays automatically. Mobile devices such as the iPhone 4 and later sport retina displays have a high pixel density. Normal images on retina devices end up looking blocky. Icon fonts are automatically rendered at a higher resolution on retina devices and are crisp and clear.
FontAwesome (http://fortawesome.github.io/Font-Awesome/) is a popular iconic font (at the time of writing this) and is easy to use in any web application, just by including a single <link> tag and then using icon-specific class names. We'll use a couple more Font Awesome icons in later examples, but if you are interested in what icons are available, visit their site and take a look around.
Font Awesome isn't the only choice for an icon font, and there are many tools on the Web to help you make your own icon fonts from existing vector art.
Now that we've seen ol.Geolocation in action, let's take a look at its full capabilities.
When creating an instance of ol.Geolocation, you can provide the following optional properties to control its initial behavior:
The Geolocation class inherits from ol.Object and has the following key-value observing (KVO) properties (recall that we discussed KVO in Chapter 2, Key Concepts in OpenLayers):
Many new computers, and especially mobile phones and tablets, provide hardware support to track their orientation. The HTML 5 specification defines the DeviceOrientation API to expose this information. Just as with the Geolocation API, OpenLayers provides the ol.DeviceOrientation class to make it easier to work with this API in a stable, cross-browser compatible way.
Device orientation refers to the orientation of the mobile device relative to a common starting point. A device's orientation is then reported as angles of rotation from this common reference orientation. For mobile devices, the reference orientation is defined as the phone lying face up on a table with the top of the phone pointing north. For computers, it is the same, except the screen is open at 90 degrees. This represents the zero state, and all angles are reported relative to this state.
Device orientation is reported as three angles—alpha, beta, and gamma—relative to the starting orientation along the three planar axes X, Y, and Z. The X axis runs from the left edge to the right edge through the middle of the device. Similarly, the Y axis runs from the bottom to the top of the device through the middle. The Z axis runs from the back to the front through the middle. In the starting position, the X axis points to the right, the Y axis points away from you, and the Z axis points straight up from the device lying flat, as shown in the following screenshot:
In practice, this allows us to respond to the user turning and tilting the device. The most useful property is the value of alpha, which lets us figure out where the compass heading the device is pointing at. Let's see this in action!
In this example, we'll display an icon at the user's location, use values from the DeviceOrientation API to create a simple compass, and by rotating it, show which way is north. Perform the following steps to achieve what's been set out in this paragraph:
<div id="location" class="marker icon-arrow-up"></div>
var deviceOrientation = new ol.DeviceOrientation({
tracking: true
});
deviceOrientation.on('change:heading', onChangeHeading);
function onChangeHeading(event) {
var heading = event.target.getHeading();
var el = document.getElementById('location');
el.style['-webkit-transform'] = 'rotate('+heading+'rad)';
el.style['transform'] = 'rotate('+heading+'rad)';
});Let's walk through the code and see what it does. First, we create a new instance of OpenLayers' helper class ol.DeviceOrientation and indicate we would like to receive orientation updates, as follows.
var deviceOrientation = new ol.DeviceOrientation({
tracking: true
});Next, we register a function to receive updates to the heading property, and it will be passed an event object that has the information we need, as follows.
deviceOrientation.on('change:heading', onChangeHeading);The function that receives the orientation update event does several things. First, we get the value of the heading property (in radians) from the event target.
var heading = event.target.getHeading();
We mentioned before that the value of alpha is used to figure out the compass heading. Not all devices support reporting of the device orientation in the same way. In particular, WebKit on iOS reports an alpha value that is computed from where the device is pointing when tracking is turned on instead of from north. OpenLayers provides a special property, heading, which reports the true angle from north and standardizes this across different devices behind the scenes.
Next, we obtain a reference to the HTML element that contains our arrow. We gave it an ID to make this easier, as follows.
var el = document.getElementById('location');Finally, we use CSS to rotate the arrow relative to north so that it's pointing in the direction our phone is pointing. The CSS3 transform property can apply a number of transformation functions to an element (see https://developer.mozilla.org/en-US/docs/Web/CSS/transform); in this case, we've selected the rotate function. We set the angle we want to rotate and specify that the value is in radians, since that is the unit that OpenLayers reports angles in. The following is the code to accomplish this:
el.style['-webkit-transform'] = 'rotate('+heading+'rad)';
el.style['transform'] = 'rotate('+heading+'rad)';We set this property twice to accommodate Safari and Chrome, which still only support the vendor-specific prefixed version of the property name.
Here is the complete API for the DeviceOrientation class.
When creating an instance of ol.DeviceOrientation, there is only one option currently available, which is as follows:
The DeviceOrientation class inherits from ol.Object and has the following KVO properties.
Mobile web browsers offer some exciting capabilities for our web applications, especially for map applications! But they offer some challenges too. We've seen in Chapter 2, Key Concepts in OpenLayers, that web developers have powerful tools like Chrome Developer Tools at their disposal for debugging web applications. But it's not that easy on mobile devices, where these tools don't exist. Fortunately, there is an answer! In this section, we'll cover techniques for debugging web applications on each of iOS and Android, as well as another tool that isn't device-specific.
The simplest way to debug web applications on iOS is to enable remote debugging with Safari on your Mac. If you don't have a Mac, skip ahead to the Debugging on Anything section.
We just enabled some pretty powerful debugging capabilities for our mobile application development. In the first step, we turned on the Web Inspector option that lets us access debug information for the current web browser process in Safari. In the second step, we enabled the Developer menu for Safari on a Mac computer. Finally, when we connect an iOS device to a Mac computer with a USB cable, we can use Safari's web debugging capabilities with the mobile Safari browser.
Depending on your version of Safari, Web Inspector might appear differently. In any case, Web Inspector has basically the same capabilities as those of Chrome Developer Tools, which were introduced in Chapter 2, Key Concepts in OpenLayers, and you have full access to inspect the HTML created for your application, change CSS styles dynamically, run JavaScript code, and view logfiles.
If you have an Android device, you can debug your web applications using the ADB Chrome extension and the Chrome DevTools introduced in Chapter 2, Key Concepts in OpenLayers. There are quite a few steps to get it all working, but it's worth it when you need it! So, here goes:
Phew! First, we made sure that we installed Chrome for Android on the device and the latest version of Chrome on our computer. Next, we installed ADB Chrome Extension for Chrome. Then, we allowed USB debugging on the device. Finally, we launched ADB Chrome Extension to see it in action. You can now debug your mobile web application running on your device with the Chrome Developer Tools.
It is also possible to debug using Firefox on Android; see https://developer.mozilla.org/en-US/docs/Tools/Remote_Debugging/Firefox_for_Android for more information.
Native debugging on mobile is great once you get it working, but what do you do when you don't have a USB cable with you, you have an iPhone but not a Mac, or you want to debug on some other device? There's a solution, of course, and the solution is to use WEINRE (WEb INspector REmote), an open source package that gives you an almost native debugging capability for mobile devices.
WEINRE is part of the Apache Cordova project (http://cordova.apache.org/) and was pioneered by Patrick Mueller. We will talk about Apache Cordova in the next section.
Using WEINRE involves combining three separate components, as follows:
The debug client and the debug server run on our development computer and the debug target runs on the mobile device.
To activate the debug target, we will need to add some JavaScript code, provided by the debug server, into the web page.
WEINRE is a Node.js application and is published as an NPM package. We've already talked about using Node.js and NPM to run a small server for editing features in Chapter 8, Interacting with Your Map. To install WEINRE then, all we need to do is open a command prompt and run the following command:
npm install –g weinre
This is how the command prompt would look when we run the preceding command. This command instructs NPM to install the WEINRE package globally, which will make the weinre command available to you.
To start WEINRE, we need to use the IP address of the development machine—see the beginning of this chapter if you don't remember it. Open a command prompt and run the following command:
weinre –boundHost <your ip address>
This is how the command prompt would look when we run the preceding command. The boundHost option allows the debug target's JavaScript to be loaded in a page on another machine, such as our mobile device. There are several other command-line options that you can supply to the weinre command; for the most part, you don't need them, but you can read about them in the WEINRE documentation at http://people.apache.org/~pmuellr/weinre/docs/latest/Running.html.
WEINRE starts a debug server and reports the URL at which the debug server page can be accessed. Copy this URL and open it in a web browser. The following is how the page will look when these actions have been performed:
This page has the information and links we need to get started with debugging our mobile web application. The first section, Access Points, contains links to the debug client user interface and documentation. The second section, Target Demos, gives you some quick links to try out WEINRE debugging right away. Try them if you like. The third section contains the link to the JavaScript we will need to add to our mobile web page to activate the debug target code. Let's go ahead with this now.
Open the mobile example page in a code editor. Copy the <script> tag from the following example in the target script section, and paste it into the example page just after the <title> tag, as follows:
<title>Mobile Examples</title> <script src="http://192.168.209.8:8081/target/target-script-min.js#anonymous"></script>
Now, for the big finale—load the mobile example on your mobile device, and then click on the link to open the debug client on your desktop machine. After that, this is how your screen will look:
The Remote tab shows the debug target connected and some other information. You can now click on the Elements, Resources, Network, Timeline, and Console tab. Click on the Elements tab to show the Elements panel. This is how your screen will look after performing these actions:
You can use the Elements panel just like Chrome Developer Tools and explore the DOM. Note that it can take a few moments for WEINRE to respond with information, so be patient and wait for it to appear.
The Resources panel shows WebSQL databases and data stored in the local storage and session storage. The Network panel shows XML HTTP requests issued after the page has loaded. Unlike Chrome Developer Tools, it can't capture the assets loaded by the page itself.
The Timeline panel can be used to display timing information about events and to track user-triggered events. Using this panel is beyond the scope of this book, but if you are interested, then check out the WEINRE documentation.
The last tab, Console, displays the JavaScript log and provides a command line for executing arbitrary JavaScript in your web page. Try typing the following command into the console and hit Enter:
alert('test');Your screen will look like this when the preceding command has been entered.
You should see an alert pop up on your mobile device, as shown in the following screenshot:
The Console tab also shows log messages, and we can filter by message types (Errors, Warnings, and Logs). Some log messages are generated by the browser itself, typically when an error happens, and we can use WEINRE to see if errors are happening. We can also programmatically send messages to log in our code using methods of the global console object that are available in all web browsers.
WEINRE isn't as complete as native debugging with iOS and Android, but it can certainly help out at a pinch.
One of the great challenges in delivering content to the mobile web is that mobile devices can easily be disconnected from the Internet. As users move around, they go in and out of range of WIFI and cellular networks, and the state of their network connection can change frequently. Native applications on mobile devices solve this problem by being installed on the device. Many native applications also cache content for offline use and are designed to handle the transient nature of mobile network connections. Web browsers, including mobile web browsers, typically cache web page content to help pages load faster. While this can help mobile web applications quite a bit, the cache managed by the web browser is unreliable, can be cleared by user settings, and might not keep critical content for your application. The cache also doesn't provide a mechanism to store generated data and stores only assets required to load a web page.
In this section, we will introduce three technologies that can help you with taking a web application offline:
The HTML 5 ApplicationCache interface is designed to help address the unreliable nature of web browser caches by allowing a developer to control how content is cached for offline use. The ApplicationCache interface provides us with the following benefits:
ApplicationCache is not displaced by new content in the normal browser cache, so it is much more reliableIf you are thinking Sounds great, lets get me some of that, read on!
Taking advantage of the ApplicationCache interface is actually very simple, and there are three steps we need to take:
A MANIFEST file is a plain text file that you can create in any text editor. The easiest way to describe its content is by example, so let's take a look at a MANIFEST file and then describe it in detail:
CACHE MANIFEST # version 2 CACHE:index.htmlscripts/app.jscss/styles.cssimages/logo.png NETWORK:login.php FALLBACK:images/large/ images/offline.jpg*.html /offline.html SETTINGS:prefer-online
The first line is mandatory; it must contain the specific text CACHE MANIFEST.
The second line is a comment. Comments are any line starting with a # character. One important characteristic of ApplicationCache is that the browser will usually not replace cached content with an updated version from the server unless the MANIFEST file changes or the prefer-online setting is specified. It is a common convention to include a comment near the top of the MANIFEST file, indicating a date or version number. When content is updated, the date or version in the MANIFEST file can also be updated, which will trigger the browser to download changed content. The third line declares the CACHE section. The CACHE section explicitly declares URLs that will be stored in the ApplicationCache. This line can be optional. If it is omitted, any files after the first line will be considered part of the CACHE section up to the start of any other section. The following lines up to the NETWORK line define files, by URL, that are to be cached. Wildcards are not allowed in the CACHE section. Do not include the MANIFEST file in the list of files to be cached, or it will be very difficult for users to get updates. URLs can be relative or absolute and might point to resources on domains other than that of the page being loaded. Check the following line, for example:
CACHE: http://another.server.com/logo.png
Next, comes the NETWORK section. This section contains a whitelist of resources that the browser will not cache (unless explicitly declared in the cache section), and which it is permitted to access when online. In this example, the browser can access login.php when online, and the results of loading that page will not be cached. This section is typically used to identify URLs that are part of a server API or content that cannot be used if it is out of date. URLs cannot contain wildcards, but a single wildcard character is allowed on a line by itself to indicate that any URL can be loaded. Check the following line for example:
NETWORK: *
The FALLBACK section defines alternate resources to be used if a particular resource is not available. Wildcards and path matching are allowed in this section. The first line of the FALLBACK section shows how you would display the image from images/offline.jpg for any image in the images/large path that is unavailable. In the next line, we specify that any HTML page that cannot be accessed should use offline.html instead. URL prefixes are allowed (a path to a folder for instance), but the wildcard character * is not permitted. Also, only URLs in the same domain as the web page can be listed in this section. As of writing this book, only one value is permitted in the final SETTINGS section, the prefer-online setting. If this is present in the SETTINGS section, then the browser will attempt to access the server version of resources before using the cached version.
Note the following rules for a MANIFEST file:
CACHE MANIFEST.# character is considered a comment.# character is a valid component of a URL.CACHE section up to the start of one of the other sections. Thus the CACHE: line is not strictly needed.CACHE, NETWORK, FALLBACK, and SETTINGS. A section is started by putting the section name followed by the : character.In order to trigger the use of an ApplicationCache MANIFEST file, you must include a reference to the MANIFEST file in your web page. This is done as an attribute of the <html> tag, as follows:
<html manifest="/myapp.appcache">
The value of the attribute is the URL to your MANIFEST file. Although the MANIFEST file can have any extension, it is standard practice to use .appcache as the file extension, and we recommend you follow this practice. The MANIFEST file must be delivered by a web server with mime-type of text/cache-manifest. The instructions for configuring a web server to serve particular files with a particular mime-type vary depending on the particular web server in use. Please consult the documentation for your web server to determine the best way to accomplish this.
Let's take the MANIFEST file out for a spin with our mobile example. The first thing we need to do is decide which resources we want to be included in our application cache and which we want to be excluded. Our application is pretty simple, so we won't need to exclude anything. So, here's what we will do:
myapp.appcache next to your example's HTML file.The first six lines are files requested directly by our application, and the remainder are map tiles loaded from the OpenStreetMap server. We'll explicitly cache the first six in our example.
CACHE MANIFEST # version 1 CACHE: 2360OS_10_04_appcache.html ../assets/ol3/ol.css ../assets/css/samples.css ../assets/css/font-awesome.css ../assets/ol3/ol.js ../assets/font/fontawesome-webfont.woff?v=3.2.1 NETWORK: *
<html> tag, as follows:<html lang="en" manifest="myapp.appcache">
We created an application cache MANIFEST file for our application, so it can load our application even when it has no network connection. The CACHE section contains the files we are explicitly using in our application. The NETWORK section contains the wildcard character to allow our application to access any URLs when we are online so that we can get map tiles. Now, when the mobile device is offline (it has no network connection), the application can still be loaded correctly.
Unfortunately, if you pan or zoom, you will start to see some blank spots. These are map tiles that are not cached by our browser. On the first load, you should see any map tiles that were loaded while we were online (in step 5). Any tiles you accessed prior to going offline might be available in the normal browser cache until it is cleared or they are displaced by newer content.
In summary, the ApplicationCache interface provides an easy and convenient mechanism to ensure content is available offline and to speed up loading of any web application by explicitly caching content in the browser for online and offline use. Unfortunately, for mapping applications, it doesn't solve the problem of accessing remote servers, including map tile sources, while offline. The next section, on HTML5 Storage, discusses part of the solution, and the final section, on Apache Cordova, provides another alternative.
Mobile web applications are a fast-growing market. Users with mobile devices expect access to all content on their mobile devices. While mobile web applications provide a great user experience in most cases, they often fall short of so-called native applications because they do not have access to convenient offline storage, capabilities of the physical device such as the camera, and data available to other applications, such as the user's contact list. Short of building a native application, there doesn't seem to be a way to access the full capabilities of mobile devices. But, do we really want to recode our great web application into native code for iOS, Android, Blackberry, Windows Mobile, and whatever other devices our users might have?
It turns out that we don't have to. On every major mobile platform, the web browser is also available as a component that can be embedded into a native application. This one fact means that it is possible to create native applications whose entire user interface is a web page and still have access to all the native functionality of the device. Doing this on every platform that you might want to support probably seems like a daunting task even if you know anything about coding native applications—or perhaps especially if you do!
Open source to the rescue again! Apache Cordova, a fantastic project of the Apache Foundation, provides the framework to create native applications from mobile web applications with almost no need to know anything about native development—and it works on all major mobile platforms. Not only will Cordova provide you with the tools to wrap your web application up into a native application, it also exposes the most common native capabilities to your web application, including:
Unfortunately, we can't cover using Apache Cordova in any detail in this book—there simply isn't enough room; it's enough material for an entire book by itself! If you need access to more than the web browser can provide on mobile devices though, we highly recommend that you check out the Apache Cordova website at http://cordova.apache.org/, where you will find lots of great information and starter projects to get you going on each platform.
Let's bring together what we've learned by expanding our application to track our movement over time and display it on the map. Recall that we covered vector features in Chapters 6, Styling Vector Layers, and Chapter 5, Using Vector Layers. So, here's what we will do:
<script> tag:var trackStyle = new ol.style.Style({
stroke: new ol.style.Stroke({
color: 'rgba(0,0,255,1.0)',
width: 3,
lineCap: 'round'
})
});
var trackFeature = new ol.Feature({
geometry: new ol.geom.LineString([])
});
var trackLayer = new ol.layer.Vector({
source: new ol.source.Vector({
features: [trackFeature]
}),
style: trackStyle
});trackLayer to the map, so add it to the array of layers where we create the map, as follows:var map = new ol.Map({
target: 'map',
layers: [layer, trackLayer],
view: view
});trackFeature as we move by modifying what happens when the geolocation object's position changes, as follows:geolocation.on('change:position', function() {
var coordinate = geolocation.getPosition();
view.setCenter(coordinate);
trackFeature.getGeometry().appendCoordinate(coordinate);
});We just created a very simple tracking application that follows our location and renders a line on the map to show where we've been. In step 1, we created a few new objects based on our knowledge of vector layers and features from Chapters 6, Styling Vector Layers, and Chapter 5, Using Vector Layers. First, we created a style object that draws our line in blue. Next, we created a feature object containing a LineString geometry to record our movements in. Lastly, we created a vector layer with a source that references our track feature using our style for blue lines. In step 2, we added the layer to the map. In step 3, we updated the geometry of the track feature by appending the latest position update coordinate to its LineString geometry.
Q1. Which OpenLayers class provides access to a mobile device's location?
ol.GeoLocation.ol.View.ol.DeviceOrientation.Q2. Which OpenLayers class tells you which direction your mobile device is pointing in?
ol.GeoLocation.ol.View.ol.DeviceOrientation.Q3. Which OpenLayers class would you use to center the map on your current location?
ol.GeoLocation.ol.View.ol.DeviceOrientation.This brings us to the end of this chapter. We've seen that OpenLayers is basically mobile-ready out-of-the-box, and there's really not much we need to do to make it work in a mobile web browser. The GeoLocation and DeviceOrientation classes provide access to some useful information in a mobile environment, including our position, speed, altitude, and direction of travel, and we saw these in action. We can even tell which direction our device is pointing in. We've learned how to debug mobile applications and how to prepare them for working offline. We wrapped up with an example that records our movement over time using vector layers and features.
In the next and final chapter, we will be building a complete application from scratch using everything we've learned so far. We'll also be introducing the OpenLayers build tools and learning how to create a production-ready application.
By now, we've covered all the parts of OpenLayers that are essential for making our own web map application. So far, we've been focusing on how to use the various different parts of OpenLayers. In this chapter, we'll put together those pieces that we've learned and demonstrate how to create an actual web map application with OpenLayers.
While we won't be introducing many new things in this chapter, we will put them together in ways we haven't before. Throughout this chapter, we'll:
In this chapter, we'll be developing a web map application that loads in data from a third-party source (Flickr). The examples have been structured with iterative development in mind. What this means is that you start small and make many changes, gradually building up your web map from nothing into something useful. Iterative development is an important, popular, and effective way to develop applications. The core idea is that you create something simple, get it working, and then improve it. You can figure out more quickly what does and doesn't work by improving on, and learning from, the previous iterations.
Another strategy we'll make use of is modular programming. What this means, essentially, is that we try to keep things as discrete (or modular) as possible. By doing so, once we know a component works, we don't have to worry about it later.
Because OpenLayers is so flexible, it's easy to make third-party software and data work with our maps. Sharing geospatial data is becoming more popular, with services such as Flickr and Twitter freely offering geospatially embedded data. Being able to visualize data often helps us to understand it. Using OpenLayers, we can place geospatial data (say, Twitter posts or Flickr images) on a map and get a clearer picture about the data.
Many popular sites provide an API (Application Programmer Interface) that allows programmers to interact with their data. For instance, both Flickr and Twitter provide APIs that enable developers to view recent updates (photo uploads and tweets). These APIs (but not all APIs) let us get geospatial data that we can use with OpenLayers. Flickr provides some very easy-to-use methods to retrieve data with associated geographic information; so, we'll focus this chapter on building a web-mapping application around Flickr.
You can find out more about APIs and what they support at various websites, a good one is http://www.programmableweb.com.
While Flickr provides a very robust developer API, we'll only interface with Flickr via URL calls that provide access to feeds. Feeds provide information about data, and we can get different kinds of feeds (for example, a specific user's feed or the feed for all users combined). It's really quite easy to do; we just make a call to a URL and specify certain parameters. The base URL we'll call is http://api.flickr.com/services/feeds/geo/?format=kml. The format parameter can be a number of values—KML, JSON, RSS, SQL, and so on. We'll be using KML and JSON in this chapter. When calling this URL, a file in the format you ask for will be returned that contains information about the latest photos uploaded that have geographic information associated with them (that's what geo in the URL is for).
Flickr's API documentation can be found at http://www.flickr.com/services/api/. More information about the Flickr feeds can be found at http://www.flickr.com/services/feeds/.
We can refine the data that is returned by adding additional parameters to the URL. You can specify a user's ID via the ID key, a group via the g key, and tags via the tags key. You can also specify other things, such as a certain coordinate and radius—for now, we'll just be focusing on the tags key.
Let's create a web map application that will pull in data from Flickr and display it on a map. This will allow us to see, geographically, from where photos were submitted. We can, for example, search for bird photos and get an idea where some particular bird species might be common (or at least, commonly photographed and uploaded to Flickr).
The application will provide a search box to enter tags and refresh the map based on them, and allow you to click on points on the map to view the photo and details about it.
We'll break down the development of this application into small steps:
Okay, we've got a goal in mind and broken it down into some manageable steps—we'll start simple and improve in increments until we reach our goal. Let's get started.
The first step in our application will require us to get data from Flickr. We'll request some data and save it locally.
bird as a tag. Open up this URL in your web browser, and you should be able to download it as a KML file from http://api.flickr.com/services/feeds/geo/?format=kml&tags=bird.flickr_data.kml and place it in your map directory.style tags—if we want, we can directly apply the styles from the file to our map (as we'll see soon).We just downloaded the latest images in the KML format that contained a tag called bird. When you call the URL and pass in a tag, Flickr will return to you the latest images uploaded that have some geographic information associated with them. You may be wondering why we downloaded the KML file. If you remember from Chapter 5, Using Vector Layers, we can just create a vector layer and point to the Flickr URL, instead of a local file. Doing this adds complexity, however, because Flickr does not support Cross Origin Resource Sharing. When we download the KML file, we can access it directly. When we're in the development mode, we want to keep things as easy as possible to debug and fix. Once we get the code working to load the KML file we downloaded (in the next example), we don't need to worry about it anymore. When we develop our application and find bugs or errors with it, we don't have to spend much time tracking them down. We get the static file working, and we move on to the next task. We don't have to worry about the Flickr API going down, our requests not completing, or other things—we can focus on other parts. Once we get more parts of our application working, then we'll switch to using the dynamic URL. For now, let's use the static file.
With the data from Flickr from the previous example, we have enough to get started. We'll create our simple application with an OSM base layer and a vector layer filled with the Flickr data on top of it:
flickr.html. We'll use the familiar structure. Also, we'll start with ol-debug.js and optimize it later:<!doctype html>
<html>
<head>
<title>Flickr App</title>
<link rel="stylesheet" href="../assets/ol3/css/ol.css" type="text/css">
<link rel="stylesheet" href="../assets/css/samples.css" type="text/css">
</head>
<body>
<div id="map" class="map"></div>
<script src="../assets/ol3/js/ol-debug.js></script>
<script>
</script>
</body>
</html><script> tag. Adjust the URL property to point to where you saved your file:var flickrSource = new ol.source.KML({
url: '../assets/data/flickr_data.kml',
projection: 'EPSG:3857'
});
var flickrLayer = new ol.layer.Vector({
source: flickrSource
});var layer = new ol.layer.Tile({
source: new ol.source.OSM()
});var center = ol.proj.transform([0,0], 'EPSG:4326', 'EPSG:3857');
var view = new ol.View({
center: center,
zoom: 1
});
var map = new ol.Map({
target: 'map',
layers: [layer, flickrLayer],
view: view
});The automatic styles provided in the KML file make it a little difficult to see the photos, especially when we are zoomed out—the thumbnails of the photos are just too large. It'll be nice to make the thumbnails of the photos smaller, but we don't have any control over the default style provided with the KML file. However, we should be able to replace the default styles with our own and achieve the effect we want.
We'll accomplish this in two steps. First, we'll replace the default style with a simple one, and then, we'll develop a new style to display smaller thumbnails:
extractStyles: false to its options:var flickrSource = new ol.source.KML({
url: '../assets/data/flickr_data.kml',
projection: 'EPSG:3857',
extractStyles: false
});function flickrStyle(feature) {
var style = new ol.style.Style({
image: new ol.style.Circle({
radius: 6,
stroke: new ol.style.Stroke({
color: 'white',
width: 2
}),
fill: new ol.style.Fill({
color: 'green'
})
})
});
return [style];
}assets folder, yours will look different if you downloaded new data:Great, we've replaced the automatic style extracted from the KML file with a simple one driven by a style function. Our style function returns an array containing our simple circle style. If you have been paying attention, you should have noticed that our style function is not at all efficient—we are creating a new copy of exactly the same style for every single feature! Don't worry though, this is a temporary state that we'll fix shortly by generating a unique style for each feature, based on its photo and we'll add caching when we do.
We can use OpenLayer's icon style to display an image, we just need the URL to the photo. We can use the JavaScript console to take a quick look at what data is associated with each feature, so that we can figure out where the URL is stored. With the previous example running in your browser, open the JavaScript console and type the following commands:
var feature = flickrSource.getFeatures()[0]; feature.getProperties();
This gets the first feature from the vector source and displays its properties, which should show you something like the following screenshot:
Well, that wasn't as useful as we'd hoped. The URL to the photo is not there, so what's happening? It turns out that the KML format includes style information and OpenLayers is smart enough to extract that information and automatically generate style functions for the features. Unfortunately, OpenLayers is also hiding all the extra information about the feature that we need. We need a different solution.
We mentioned earlier that the Flickr feed API supports more than just the KML format. It also supports a variety of RSS versions and JSON. That sounds promising; let's see if we can do better with the JSON version. Refer to the following steps:
flickrSource, with a generic vector source. Reload the page and make sure that everything still works. You should see the base map but no features (we'll add them shortly):var flickrSource = new ol.source.Vector();
json. Load the following URL in your browser and save the result to a new file called flickr_data.json:jsonFlickrFeed (on the first line, this means that it is intended to be loaded as JSONP).JSONP, or JSON with Padding, is a technique for loading JSON data from a remote server that avoids the restrictions of the same-origin policy. See http://en.wikipedia.org/wiki/JSONP for a good description of why and how JSONP works. For now, it is sufficient to know that JSONP will invoke a callback function and pass the data to it.
The next few lines appear to be metadata about the response—a title, description, date, and so on. What comes next seems to be what we want—an array of objects that represent photos, complete with links to photos and geographic locations. Perfect!
ajax method to do this:$.ajax({
url: '../assets/data/flickr_data.json',
dataType: 'jsonp',
jsonpCallback: 'jsonFlickrFeed',
success: successHandler
});successHandler function to process the data into features and add them to the map:function successHandler(data) {
var transform = ol.proj.getTransform('EPSG:4326', 'EPSG:3857');
data.items.forEach(function(item) {
var feature = new ol.Feature(item);
feature.set('url', item.media.m);
var coordinate = transform([parseFloat(item.longitude), parseFloat(item.latitude)]);
var geometry = new ol.geom.Point(coordinate);
feature.setGeometry(geometry);
flickrSource.addFeature(feature);
});
}var feature = flickrSource.getFeatures()[0]; feature.getProperties();
Allowing for different features in the new data file, the application should look exactly the same as before. The only difference is, we are now using JSON data instead of KML. Let's review how we changed from KML to JSON.
The JSON data is not in a format that is directly usable by OpenLayers; so, we need to do most of the work that a format-specific source would do for us. The first step was to remove the KML source and replace it with a generic vector source, into which we can insert the features as we get them. The next step is to load the data. We've chosen to use jQuery's ajax function to do this. The ajax function needs a URL to load from, a function to call when the data is loaded (successHandler) and a configuration to help it understand that the data is in the JSONP format:
dataType: 'jsonp'
And, that it uses a specific callback function name:
jsonpCallback: 'jsonFlickrFeed'
The final step is to interpret the data once it is loaded and create the features we need. We do this inside successHandler by first creating transform that will convert coordinates from latitude and longitude into the projection we are using for the map's view:
var transform = ol.proj.getTransform('EPSG:4326', 'EPSG:3857');Then, we loop over all the items and turn each one into a feature. Each item is an object literal containing all the information we need for positioning and styling the photo. We create a new feature object and pass it this information, so that we can access it later for styling purposes:
var feature = new ol.Feature(item);
From looking at the properties of each photo, we see that the URL to the photo is stored in the media attribute under a key called m. This will be inconvenient to work with later; so, we create a new property called url with the value we want:
feature.set('url', item.media.m);We need to create a new geometry object to represent the feature's location using the latitude and longitude of the photo (remembering to also transform the coordinates into the view's projection) and set it as the geometry of the feature:
var coordinate = transform([parseFloat(item.longitude), parseFloat(item.latitude)]); var geometry = new ol.geom.Point(coordinate); feature.setGeometry(geometry);
Finally, we added the feature to our vector source:
flickrSource.addFeature(feature);
Now that we've got that sorted out, we should be able to create a thumbnail style for our photos reasonably easily:
var cache = {};flickrStyle function and replace it with the following:function flickrStyle(feature) {
var url = feature.get('url');
if (!cache[url]) {
cache[url] = new ol.style.Style({
image: new ol.style.Icon({
scale: 0.10,
src: url
})
});
}
return [cache[url]];
}We just updated our style function to return a more suitable style. In the first step, we created an object to act as a cache for our styles, so that we don't create them multiple times (that's inefficient!), and in the second, we updated our style function to create a new icon style for the feature, if one isn't in the cache already. Our icon style takes care of scaling the image to 10 percent of its original size so that it's not too big for the map area.
So far, we've accessed data from Flickr, saved it to a file, added it to our map and created a simple photo thumbnail style. This is pretty cool, but we really haven't done much other than just load in the data, from an OpenLayers's point of view. It's useful, but we really haven't created a full-featured web application just yet. So, let's focus on how to build a more useful web-mapping application. To do this, we'll basically need to do two general things:
Let's focus on the first part, and then change the data source after we develop some interactivity.
We need to decide what interactivity we'd like to provide to make our application interactive for our users. We'd like our users to be able to click on a photo and see relevant information. For this, we can use the select interaction. What should happen when we select a feature? We'll want to show information about the feature we clicked on, and that information is the Flickr photo itself and any associated attributes. So, let's keep things for now and show the photo's information below the map when a feature is selected.
So, let's go ahead and add a select interaction to our application:
select interaction. We'll add events soon, but for now, let's just create the control and add it to the map and then activate it. Add this at the end of the main <script> tag after all the other code:var select = new ol.interaction.Select({
layers: [flickrLayer]
});
map.addInteraction(select);style option that allows us to do this. We'll create a new function to return a selected style by making a copy of our flickrStyle function and cache object, using a larger scale value, and using the new style function with the select interaction:var selectedCache = {};
function selectedStyle(feature) {
var url = feature.get('url');
if (!selectedCache[url]) {
selectedCache[url] = new ol.style.Style({
image: new ol.style.Icon({
scale: 0.50,
src: url
})
});
}
return [selectedCache[url]];
});
var select = new ol.interaction.Select({
layers: [vectorLayer],
style: selectedStyle
});We just added some interactivity to our map. Let's recap how we did this.
The first step, was to add a select interaction to the map, configured to select features from our vector layer:
var select = new ol.interaction.Select({
layers: [flickrLayer]
});
map.addInteraction(select);The default selection style wasn't appropriate; so, we added a new function for styling selected features. We created a new cache object for selected styles, so that we could use the URL as the value for caching, and the style we used was the same thumbnail style but with a larger photo.
We've duplicated the style code, which was easy to do and doesn't really introduce any problems in the runtime efficiency of our code. However, duplicated code can cause maintenance problems in real applications and some effort should be made to avoid obviously duplicate code. Try refactoring the style-related code to eliminate duplication as much as possible. You'll still need separate functions for the select interaction and the vector layer, but the code inside each layer looks like a candidate for moving into a new consolidated function that takes scale as a parameter.
The next step is to display some information about photos when they are selected. To do this, we'll need to listen for an event on the select interaction's collection of selected features and retrieve the features that were selected. Our plan is to have some photo information display when we select features:
<div> tag that will appear below the map. In your HTML code, add the following line after the map's <div> tag:<div id='photo_info ></div>
var selectedFeatures = select.getFeatures();
add event. For now, let's put the URL of the selected photo into our photo_info <div> tag:selectedFeatures.on('add', function(event) {
var feature = event.target.item(0);
var url = feature.get('url');
$('#photo-info').html(url);
});photo_info <div> tag:selectedFeatures.on('remove', function(event) {
$('#photo-info').empty();
});We used the select interaction to respond to the user selecting photos. While there is no direct way to do this, we can use the add and remove events of the collection returned by getFeatures to update our photo_info div with some information about the selected photo.
Earlier, we revealed what information is available for each feature by running the following code in the JavaScript console:
var feature = flickrSource.getFeatures()[0]; feature.getProperties();
And, we saw the following in the console:
We can see that each feature has some interesting information we might want to display:
author and author_id: These are useful for identifying the Flickr user that took the photo.date_taken and published: These contain the date that the photo was taken and the date it was published to Flickr.description: This is a pregenerated HTML string that contains useful information about the photo including the user's description, if available.link: This takes you to the actual Flickr page for the photo.tags: This is a space-separated list of tags associated with the photo.title: This was provided by the user that uploaded the photo.The description property seems like a great thing to display. It's nicely formatted and includes some interesting information for some photos. Unfortunately, all that nice formatting only shows up if we insert the description as HTML into our page. Injecting untrusted HTML into a page, without first sanitizing it, makes your application prone to XSS (Cross-site scripting) attacks, a technique for injecting and executing unauthorized JavaScript into web pages. You should never inject HTML from an untrusted source into a web page. Even though it might seem safe to trust Flickr, we'll be prudent and avoid the description property by creating our own description from other information available.
We need a programmatic way to display the information about our photos in the web page. This means taking data about the selected features and creating HTML elements for them. For the purpose of this chapter, we'll create an HTML template and populate it with data from the feature. While there are many different approaches and libraries for implementing HTML templates, our needs are simple; so, we'll do it without depending on another library.
We'll need several HTML elements to display each piece of information, and a way to specify where in the elements we want to put what information. We could write the template as a JavaScript string, but then we couldn't put line breaks into the HTML and it will be difficult to read in the code. Instead, we'll use the same technique that most templating libraries use—a <script> tag with the id and type attributes set to something other than text/javascript. We'll explain how it works later. We'll use brace brackets { and } around key words to indicate where we want to place specific information.
<body> tag, by convention, they are usually added after everything else and just before the </body> tag at the end:<script type="text/html" id="photo-template">
<a href="{link}" target="_blank" title="Click to open photo in new tab" style="float:left; "><img src="{url}"></a><br>
<p>Ta ken by <a href="http://www.flickr.com/people/{author_id}" target="_blank" title="Click to view author details in new tab">{author}</a> on {date_taken} at lat: {latitude} lon: {longitude}</p><br>
<p>Tagged in <b>{tags}</b></p>
</script>function photoContent(feature) {
var content = $('#photo-template').html();
var keys = ['author','author_id','date_taken','latitude','longitude','link',
'url','tags','title'];
for (var i=0; i<keys.length; i++) {
var key = keys[i];
var value = feature.get(key);
content = content.replace('{'+key+'}',value);
}
return content;
}selectedFeatures.on('add', function(event) {
var feature = event.target.item(0);
var content = photoContent(feature);
$('#photo-info').append(content);
});We just built a simple templating system that lets us put feature properties into an HTML template and injected the results into the page to show information about each feature in the selected cluster. Let's review each step in detail.
In the first step, we created our HTML template by putting the HTML code we want to display for each photograph into a <script> tag. This probably sounds strange, but it is a technique used by many template libraries. The <script> tag has a type attribute that tells the browser how to interpret its content. When we are writing JavaScript, the value of the type attribute is text/javascript. If the type attribute is not specified, all browsers will assume that the type is just this—text/javascript. However, if the type is set to something else that the browser does not recognize, such as text/html, then the browser will ignore both the tag and its contents. It is still in the DOM, however, and we can retrieve its content using jQuery's html() method, just as we will with any other HTML element. This allows us to write readable HTML that can be accessed programmatically, without having to worry about it showing up in the web page.
The template content is self-explanatory. We used an anchor tag around the image and some <p> tags for extra information about the author and keywords that the photo was tagged with. We placed brace brackets around a keyword in each place we wanted to insert some information dynamically from a feature property. To keep it simple, the keywords will match the feature property names. Thus, the following line in the template will get replacements for {link} and {url} from the current feature:
<a href="{link}" target="_blank" title="Click to open photo in new tab"><img src="{url}"></a><br>In the second step, we added a function that generates HTML content for a given feature by replacing placeholders in the template with actual values. The first step is to get the content of the template as a string, for which we use jQuery's html() method:
var content = $('#photo-template').html();Next, we have an array of the property names we want to process replacements for.
var keys = ['author','author_id','date_taken','latitude','longitude','link','url','tags','title'];
For each of these, we get the value of the previous property from the feature:
for (var i=0; i<keys.length; i++) {
var key = keys[i];
var value = feature.get(key);Finally, we replaced the placeholder (the key wrapped in brace brackets) with the value and when all replacements were done, we returned the resulting string:
content = content.replace('{'+key+'}',value);
}
return content;In the last step, we made use of our function to get HTML for the selected feature and added it to the page:
$('$photo_info').append(content);The data we've loaded (flickr_data.json) is from a third-party source, but it's only fresh up to the point that we download it. Our application will load the data in real time when the page is loaded. Now that everything is functional with static data, its time to get dynamic and load data in real time.
In this exercise, we'll change our code to fetch the data from Flickr when the page loads, rather than using a previously downloaded file. As you'll see, this is quite straightforward.
$.ajax function and load data directly from the live feed rather than our static file. Go ahead and modify the URL:$.ajax({
url: 'http://api.flickr.com/services/feeds/geo/?format=json&tags=bird',
dataType: 'jsonp',
jsonpCallback: 'jsonFlickrFeed',
success: successHandler
});Showing bird pictures from around the world is nice—but what about giving users the ability to show a photo with any tag they want? That's what we'll do next. So far, we've created a map that lets users interact with Flickr data. As far as we're concerned, we're more or less done with the interaction part. Now, we'll focus on changing the data source part. Currently, we're only asking for photos with the bird tag, but we want to allow that to be any tag.
An important concept in application development is to keep things modular. This basically means that we try to write out applications in such a way that we can take out, and put in, different parts without drastically changing the rest of our code. In this case, we will leave the interaction part of our code alone (what we've done so far at least) and focus mainly on the code that retrieves data.
What needs to happen? Well, let's think this through. We want the user to be able to specify any tag they want. We want to allow multiple tags. This means we'll need to change the URL that the $.ajax function is loading, but only after the user specifies some tags. We'll want to create a function to wrap the $.ajax call and come up with a way to change the URL based on the selected tags. We'll also need to deal with removing existing features when the tags change.
So, we know we need to allow a variable that specifies the tags parameter in the URL to be based on user input. We'll need to create an input box that will allow the user to specify tags. We'll also have a submit button that will, when clicked, call a function that updates the $.ajax method's URL with the specified parameters.
Let's add some more interaction to our map now. We'll add an input box that will change the requested Flickr data based on the user's input:
<div id="search" style="position: absolute; top: 10px; right: 10px; padding: 5px; background-color: rgba(255,255,255,0.5);"> <input type="text" placeholder="Search photos by tag(s)" style="width: 200px"> <button type="button">Search</button> </div>
$.ajax call with a function that will get called when the button is clicked. This function will do three things. First, it will clear the existing features from the map. Next, it will clear any selected photo info. Finally, it will request new data from Flickr with the appropriate tags:function loadFlickrFeed(tags) {
selectedFeatures.clear();
flickrSource.clear();
$('#photo-info').empty();
$.ajax({
url: 'http://api.flickr.com/services/feeds/geo',
data: {
format: 'json',
tags: tags
},
dataType: 'jsonp',
jsonpCallback: 'jsonFlickrFeed',
success: successHandler
});
}loadFlickrFeed function:$(document).on('click', '#search button', function() {
var value = $('#search input').val();
var tags = value.split(' ').join(',');
loadFlickrFeed(tags);
});loadFlickrFeed function will get called and refresh the vector layer. Try typing in various tags (or multiple tags separated by a comma) and hitting the button:We just updated our Flickr application to allow user input that affects what data is shown. We did this in a sort of modular way—we didn't have to change any of the previous code we wrote. Instead, we just created a function that clears the existing features and loads new ones based on the selected tags. Now that we've written an application, let's talk a little bit about how to deploy it.
What does it mean to deploy an OpenLayers (or any other) application? Basically, deploying something means that we're switching from a development mode to a production mode; we're releasing something for the rest of the world to see.
The production application should be as fast and bug free as possible. As we want the production version to be accessed as quickly as possible, this will often include removing things we used in the development environment and tweaking the production environment to better handle a lot of users. This also means using files that are as small in size as possible. While fully optimizing a web application is beyond the scope of this book, there are a couple of things we can do with OpenLayers to help optimize our JavaScript file size: create a custom build of OpenLayers and compile our code with the OpenLayers code.
There are many other things we should do to better prepare our production environment, such as using caching, as well as combining and minimizing our website's assets. These, and other practices, are outside the scope of this book, but further information can be found at http://en.wikipedia.org/wiki/Web_performance_optimization#Best_practices.
OpenLayers provides an easy way to create a custom build of the library to include in your page that contains only the things you need. Throughout this book, we've been including a file called ol.js (or ol-debug.js), a file that contains all the functionality (classes, functions, and so on) that OpenLayers provides. So far, this has been great—we've been developing up to this point, so we want to be sure that we have access to all the classes that we may use.
Well, the ol.js file we've been using is around 391 KB, and the debug version is 3.5 MB! Both are quite large files to load, especially since they contain only JavaScript code. Even though large file sizes aren't as much of an issue as they were years ago, when everyone was on slower connections, a large JavaScript file in a production environment is something we want to avoid if at all possible. This is especially true for mobile environments, where users pay for data plans and data speeds can be highly variable.
We want all our files in a production environment to be as small as they can absolutely be. This will allow users to download the files faster (since there is less to download), which decreases the page's loading time (saves on bandwidth expenses). Faster page loads (even if the speed is only perceived) will greatly enhance the user's experience. Fortunately, we can greatly reduce the size of the OpenLayers library file with a build tool provided by OpenLayers.
To optimize your application code for production, there are two approaches you can take:
The following table shows the advantages and disadvantages of each approach:
|
Approach |
Advantages |
Disadvantages |
|---|---|---|
|
Combined compilation | ||
|
OpenLayers and application code separate |
|
Before going further, you will need to follow the installation process for Python, Java, and Node following the guide in Appendix B, More details on Closure Tools and Code Optimization Techniques. These tools are required to create custom builds of OpenLayers.
The standard release archive for OpenLayers does not contain the build tools we require. Additionally, the build tools provided with OpenLayers work only with code cloned from a Git repository. The instructions for this book are designed for version 3.0.0 of OpenLayers. To make sure that you are using the correct version, you can check out the v3.0.0 branch of the repository using the following command:
git checkout -b v3.0.0
If you have already run the OpenLayers build tools on a version other than v3.0.0, it is recommended to remove the build and node_modules folders and start again.
We'll briefly cover how the closure compiler works to optimize your code, as we will need to understand it a little bit to use it properly. More detailed information can be found in Appendix B, More details on Closure Tools and Code Optimization Techniques.
The closure compiler optimizes code by applying a series of transformations to your code. Covering all of these is the topic for a whole book in itself, but for our purposes it does three basic things:
When the compiler rewrites your code, it will attempt to use language features that reduce the overall size of your code and execute more efficiently. This can include the following:
Generally, these changes are safe and do not change the logic or functionality of your code. They simply take advantage of language features to fit your code into less space.
The compiler will also attempt to remove the so-called dead code. Dead code is any function that the compiler determines will not be called by the application. It is sometimes difficult for the compiler to automatically determine what code your application will use, especially if you are creating a separate build. In these cases, we need to tell the compiler what things we need to keep even though they might be considered dead code. This is generally done in two ways depending on our strategy. If we are creating a combined build, the compiler can generally determine what functions we will need automatically, but it doesn't know what files to include in the first place. To help the compiler, we add code to register these dependencies. If we are creating a separate build, the compiler doesn't have our code to analyze; so, we have to use a different technique. In this case, we will provide an explicit list of functions to keep in the compiled library.
We will cover both techniques shortly.
The final compiler technique we need to discuss is the renaming strategy. Generally, when we are writing code, we use descriptive names for functions and variables. This makes code much more readable to ourselves and others, and it's much easier to remember names that mean something when writing our code. However, these long names take up space—1 byte per character—and when they are used repeatedly, it can really add up. The JavaScript engine in a browser doesn't really care about our descriptive names though. A name like X1 is just as good as GeoJSONParser, and as long as it is used in the right places, we can save 11 bytes for every use of GeoJSONParser by replacing it with X1. Using short names is not practical for application developers, but it is something that can be done really well by a compiler.
Unfortunately, this is one of the biggest gotchas of using the Closure Compiler. It renames objects, functions, and properties very aggressively and makes them effectively unusable by external code. There are two main problems we need to be aware of concerning this renaming.
When creating a standalone build of OpenLayers, we need to make sure that the objects, functions, and parameters we need are not renamed. This is done using exports, which will be covered later in this chapter.
When creating a combined build of OpenLayers with our application code, we no longer have to worry about exports because our use of the OpenLayers objects, functions, and properties will be taken into consideration by the compiler and renamed appropriately. However, if we use other third-party libraries (for instance, jQuery), the closure compiler does not know about them and will rename our use of their objects, functions, and properties. There are two things we can do to tackle the second problem. First, we can provide special JavaScript files, called externs, which define the objects, functions, and properties of external libraries. The compiler can then correctly avoid renaming parts of our code that we need to preserve. The second, is to use string values in key places, because the compiler will never rename a string value. This technique relies on the ability for JavaScript code to reference object properties using array-like syntax. For instance, if we have a property name on an object foo, normally, we would reference it like the following:
foo.name = 'test';
The compiler might rewrite this code like the following:
XB.XC='test';
If foo is an object coming from some external library that relies on name, our code may break in unusual ways. To prevent this, we can use the array-like notation with a string value to avoid renaming:
foo['name'] = 'test';
We'll see an example of this in our next example.
Exports and externs are quite similar. The first is for choosing the library code you want to expose the third-party code, whereas the second, is to stop the default renaming behavior for the third-party code. To fully grasp the difference, you should refer to the official topic on Do Not Use Externs Instead of Exports! at https://developers.google.com/closure/compiler/docs/api-tutorial3#no.
There are a few steps we need to take to create a combined build. These are as follows:
<script> tag that contains all the JavaScript code into a file and save it as flickr_combined.js. You can, of course, call it something different but the remainder of this example will refer to it by this name. If you choose a different name, make sure to change all the references appropriately.<script> tag to load flickr_combined.js and everything should work as before. If you want to try this, go ahead but remember to remove the script tag afterwards. We won't be using flickr_combined.js directly.goog.require statements to our JavaScript file. Let's go ahead and do that now. Add the following at the top of your flickr_combined.js file:goog.require('ol.Feature');
goog.require('ol.geom.Point');
goog.require('ol.interaction.Select');
goog.require('ol.layer.Tile');
goog.require('ol.layer.Vector');
goog.require('ol.Map');
goog.require('ol.proj');
goog.require('ol.source.OSM');
goog.require('ol.source.Vector');
goog.require('ol.style.Icon');
goog.require('ol.View');If you are using the ol-debug.js build of OpenLayers, then this change will continue to work. If you are using ol.js, however, it will not work as the goog namespace is not exported in the optimized build of OpenLayers.
The OpenLayers build tool runs inside the OpenLayers directory. The easiest way for OpenLayers to find your code is to copy it into the ol3 directory. Go ahead and copy flickr_combined.js into the ol3/build directory now.
flickr_combined.json file within the ol3/build directory and give it the following content. We'll go over the parts of this file afterwards:{
"exports": [],
"src": ["src/**/*.js", "build/flickr_combined.js "],
"compile": {
"externs": [
"externs/closure-compiler.js",
"externs/geojson.js",
"externs/jquery-1.7.js",
"externs/oli.js",
"externs/olx.js",
"externs/proj4js.js",
"externs/vbarray.js"
],
"define": [
"goog.dom.ASSUME_STANDARDS_MODE=true",
"goog.DEBUG=false"
],
"jscomp_error": [
"accessControls",
"ambiguousFunctionDecl",
"checkEventfulObjectDisposal",
"checkRegExp",
"checkStructDictInheritance",
"checkTypes",
"checkVars",
"const",
"constantProperty",
"deprecated",
"duplicateMessage",
"es3",
"es5Strict",
"externsValidation",
"fileoverviewTags",
"globalThis",
"internetExplorerChecks",
"invalidCasts",
"misplacedTypeAnnotation",
"missingGetCssName",
"missingProperties",
"missingProvide",
"missingRequire",
"missingReturn",
"newCheckTypes",
"nonStandardJsDocs",
"suspiciousCode",
"strictModuleDepCheck",
"typeInvalidation",
"undefinedNames",
"undefinedVars",
"unknownDefines",
"uselessCode",
"visibility"
],
"extra_annotation_name": [
"api", "observable"
],
"compilation_level": "ADVANCED",
"output_wrapper": "// OpenLayers 3. See http://ol3.js.org/\n(function(){%output%})();",
"use_types_for_optimization": true,
"manage_closure_dependencies": true
}
}ol3 directory. Execute the following command:node tasks/build.js build/flickr_combined.json build/flickr_combined.built.jsgit status
flickr_combined.built.js back into the working directory of your application code.<script> tag that loads the ol-debug.js script to point to the new JavaScript file, for instance:<script src="flickr_combined.built.js"></script>
We created a custom build of OpenLayers combined with our application code using the provided build tools. We'll review the steps but first, let's take a look at the resulting file sizes:
|
Files Used |
Net Size | |
|---|---|---|
|
Before (debug build) |
|
3.3 MB |
|
Before (optimized build) |
|
385.7 KB |
|
After |
|
153 KB |
As you can see, our final built file is less than half the size of the full OpenLayers build. Okay, now let's review how we did it.
For the OpenLayers build tools to work, they need our application's JavaScript and a configuration file. We first extracted the JavaScript from our HTML into a separate file, then added some extra lines of code to help the Closure compiler understand what parts of OpenLayers we use by adding goog.require statements. Figuring out what you are using from OpenLayers can be a bit tricky in larger applications, but using searching for ol. (that's ol followed by a period) will identify the correct things.
The next step, was to create a configuration file for the build tool. This configuration file is written in the JSON format, which looks a lot like JavaScript. The configuration file has several parts to it:
exports: This identifies specific objects and methods in the OpenLayers library that should not be renamed when creating an optimized build. We'll see how this works in the next example, but for this example, we left it empty because we are combining our application code with OpenLayers.src: This identifies all the source JavaScript files that the compiler should consider when creating the optimized build. We say consider because not all the code will be included in the output. In our configuration file, we can specify the path to the OpenLayers source files (src/**/*.js) and our application file (build/flickr_combined.js).compile: This contains directives specific to the Closure compiler. Modifying this section requires advanced knowledge of the Closure compiler and we won't be covering it in this book. It is normally sufficient just to copy this section to each new configuration file that you create. The one exception is the externs array. The externs array identifies files that contain type hints for the closure compiler. If you are using a third-party library in your application code, you will need to provide an externs file for that library to prevent the compiler from renaming function and property names in your code. For instance, we are using jQuery with our application and have included the jQuery-1.7.js externs file provided with OpenLayers. Externs for other libraries can be found at https://github.com/google/closure-compiler/tree/master/contrib/externs.With our application code prepared and a configuration file, we then run the command-line build tool providing it the name of the configuration file and the name of the JavaScript file to create:
node tasks/build.js build/flicker_combined.json build/flickr_combined.built.js
We then copied the resulting file, flickr_combined.built.js, back into our application folder and updated the script tag to load this file instead of ol-debug.js. The net result is an impressive drop in file size and the elimination of one JavaScript file to load.
In large applications, it is not uncommon to have your JavaScript code separated out into different files based on some logical breakdown of the code. OpenLayers, for instance, has 330 separate JavaScript files. When you have a lot of different files, the net effect of combining them all into a single file is much more apparent to the user.
While the combined build creates a single JavaScript file that contains both OpenLayers library code and your application code, a separate build creates a single JavaScript file that contains just the OpenLayers code required by your application. The main difference with this approach is that we will not use goog.require to tell the compiler what parts of OpenLayers we want to use. Instead, we will use the exports property of the configuration file. The other difference, is that we will not include our application source file in the src configuration.
Unlike before, we don't need to move our application code into a separate file. Unless you kept a copy of the application from before the previous example, however, we'll need to fix up our HTML file a little bit for this example. This example assumes you are starting with the previous example:
flickr_combined.js and call it flickr_separate.js. As always, you may use a different name but make sure it is consistent! You might also want to make a copy of your HTML file and use it for the rest of this example.flickr_separate.js and remove all the goog.require statements from the beginning of the file.<script> tag to load flickr_separate.js after the <script> tag that loads the combined build file:<script src="flickr_separate.js"></script>
flickr_separate.json in the OpenLayers build directory. Give it the following content:{
"exports": ["ol.Map",
"ol.Map#*",
"ol.View",
"ol.animation.*",
"ol.control.*",
"ol.layer.Tile",
"ol.proj.*",
"ol.source.OSM",
"ol.source.Vector",
"ol.source.Vector#getFeatures",
"ol.source.Vector#addFeature",
"ol.source.Vector#removeFeature",
"ol.layer.Vector",
"ol.interaction.Select",
"ol.interaction.Select#getFeatures",
"ol.interaction.Select#on",
"ol.Observable#on",
"ol.Feature",
"ol.Feature#get",
"ol.Feature#set",
"ol.geom.Point",
"ol.style.Style",
"ol.style.Fill",
"ol.style.Stroke",
"ol.style.Circle",
"ol.style.Text",
"ol.style.Icon"
],
"src": ["src/**/*.js"],
"compile": {
"externs": [
"externs/bingmaps.js",
"externs/bootstrap.js",
"externs/closure-compiler.js",
"externs/example.js",
"externs/geojson.js",
"externs/jquery-1.7.js",
"externs/oli.js",
"externs/olx.js",
"externs/proj4js.js",
"externs/tilejson.js",
"externs/topojson.js",
"externs/vbarray.js"
],
"define": [
"goog.dom.ASSUME_STANDARDS_MODE=true",
"goog.DEBUG=false"
],
"jscomp_error": [
"accessControls",
"ambiguousFunctionDecl",
"checkEventfulObjectDisposal",
"checkRegExp",
"checkStructDictInheritance",
"checkTypes",
"checkVars",
"const",
"constantProperty",
"deprecated",
"duplicateMessage",
"es3",
"externsValidation",
"fileoverviewTags",
"globalThis",
"internetExplorerChecks",
"invalidCasts",
"misplacedTypeAnnotation",
"missingGetCssName",
"missingProperties",
"missingProvide",
"missingRequire",
"missingReturn",
"newCheckTypes",
"nonStandardJsDocs",
"suspiciousCode",
"strictModuleDepCheck",
"typeInvalidation",
"undefinedNames",
"undefinedVars",
"unknownDefines",
"uselessCode",
"visibility"
],
"extra_annotation_name": [
"api", "observable"
],
"jscomp_off": [
"es5Strict"
],
"compilation_level": "ADVANCED",
"output_wrapper": "// OpenLayers 3. See http://ol3.js.org/\n(function(){%output%})();",
"use_types_for_optimization": true,
"manage_closure_dependencies": true
}
}ol3 directory, as we did before:node tasks/build.js build/flickr_separate.json build/flickr_separate.ol.js
flickr_separate.ol.js back to your application folder next to flickr_separate.js.flickr_combined.js to point to this new file:<script src="flickr_separate.ol.js"></script>
We just created a custom build of the OpenLayers library that contains only the code we need, and which exports only the things we actually use. The resulting library is a little bit larger—177.5 KB vs 156.5 KB—because the compiler is preserving the names of the objects, functions, and properties that we have exported. Let's review these steps.
First, we adapted our previous example and modified a copy of our application code to remove the goog.require statements. Those won't be needed for the compiler, and in fact, won't work with our custom build because the goog namespace is not exported.
Next, we created a new configuration file for the compiler. You probably noticed that it's nearly identical to the one from the previous example. In fact, there are two differences and they are very important. First, we removed our application source from the build by removing it from the src property. Second, we explicitly listed the names of objects and functions we want exported in the exports section.
Populating exports is really the trickiest part of creating a separate build. As with the combined build, a search of your code for ol. will identify all the main classes that you are referencing and these can be included directly in the exports array. However, exporting a class does not automatically export any of its properties or methods. We also need to know what methods we call on all objects that are exported. In some cases, we don't actually call any methods on the objects we created, but in other cases, we do. Finding these methods is a bit more time consuming as it requires manually reading the code.
When adding a method name to the exports list, we write it with the object name first, a # symbol, and then the method name, for instance see the following:
ol.Map#getSize
It is also possible to export all methods of an object by using * instead of a method name after the # symbol. While this is quick and easy, it will produce much larger builds than necessary in most cases.
You've reached the end of the book! In this chapter, we built a simple web map application that grabs Flickr data based on user input. We covered some development concepts throughout the chapter, such as attempting to keep our code modular. We learned how to interact with other third-party APIs, and built an application from the ground up. Lastly, we talked about deployment and learned how to use the OpenLayers build script. Now that you've finished reading this book (I hope you've enjoyed it), you should be able to go out and make your own impressive web maps!
When you need to make a custom map using the OpenLayers 3 library, you need to grasp the common programming sentences and vocabularies.
Why? It's because OpenLayers relies on JavaScript, a programming language based on object-oriented programming (OOP). Knowledge about OOP is shared amongst programmers. Without this knowledge, it will be difficult to talk about programming issues, for example, on a forum.
We will see that behind complex words lie simple concepts. In fact, everyone uses OOP concepts on a daily basis but without being aware of it.
In this appendix, we will cover:
Let's talk about how object-oriented programming works from a theoretical and technical level.
Object-oriented programming is a programming paradigm. It added a new way to manage code by using the concept of object as opposed to procedural programming where code follow the reading order. By using OOP, you gain reusability of code. The main gain is related to encapsulation or separation of concern. Each object has his own life.
To understand object orientation, let's take a simple example—animals. Your cat is a class. If you have four cats, you have four objects of type cat. Each of them has different properties name, age and sex values. A cat can move. In OOP terms, move is a method of the class cat.
Let's review some questions that can help you understand keywords and concepts we will implicitly use.
An object can be considered a thing that can perform actions and has properties. The action defines the object's behavior. For instance, the cat can jump. Your cat's age is eight so the property value is 8.
In pure OOP terms, an object is an instance of a class.
In an OpenLayers context, imagine you want a side-by-side map where you prepared a div with id attribute equal to map1 and another one for the id attribute with the value map2. You will use the JavaScript new operator to declare two instances of the ol.Map class like following:
var map1 = new ol.Map({ target: 'map1'});
var map2 = new ol.Map({ target: 'map2'});An instance means that each object based on the class has it own properties values.
In our example, the target property is different for the map1 and map2 objects.
A class can be considered as an extensible program-code-template.
When you already know OOP, you use the word class to declare it but in JavaScript, the class is known as a function. Also, functions are used as constructors.
The following excerpt from OpenLayers illustrates how a class looks:
ol.Map = function(options) {
}We also recommend you inspect the full ol.Map class at http://openlayers.org/en/v3.0.0/apidoc/map.js.html after reviewing the following information box to discover on your own the class methods and properties.
We will abusively use classes to describe object-oriented programming but the truth is that JavaScript is based on prototypes and not classes. We chose to simplify the explanation as more people understand OOP based on classes. The main goal is to explain inheritance in particular. To learn the difference. we recommend going to https://developer.mozilla.org/en-US/docs/Web/JavaScript/Guide/Details_of_the_Object_Model for more.
To instantiate an object, you need to use the new keyword on a JavaScript function.
For example, when using new ol.Map(), the function ol.Map is called the constructor. It's the function you use with the new keyword to create an object. You can give options to the constructor.
There are other ways to create an object but to keep thing simple, we chose to restrict our explanation to the most common way when using the OpenLayers library. If you want to go further, go to https://developer.mozilla.org/en-US/docs/Web/JavaScript/Guide/Working_with_Objects.
Inheritance is the ability of a new class to be created, from an existing class by extending it. With this, you use the DRY (Don't repeat Yourself) principle. For example, you can reuse method or properties from a parent class. Don't sweat, it's time to explain!
Imagine after describing your cat, you also want to describe your dog in OOP.
Cats and dogs are not the same but they share some characteristics like their name, their sex or their age or they ability to move. However, a cat can jump from windows whereas a dog can't. We don't want to maintain two classes because they have common properties. You can achieve this by using a new class called animal. It can be represented like the following diagram:
In your code, instead of declaring every common property and method twice, you declare that your Cat class inherits from the Animal class, so you can reuse properties and methods from the parent class. Cat and Dog are subclasses of the Animal class. You can also says that the Cat class extends the Animal class.
Why do you think it's useful to review this abstract concept?
It's because you need to figure out the relations between OpenLayers 3 library components. The library heavily uses inheritance and for creating your own components, it's a requirement.
It's a class you use to define properties for other class that need to inherit it properties and / or methods but you never directly instantiate this class. The animal can be considered as an abstract class. However, in OpenLayers, the ol.source.XYZ isn't an abstract class, although ol.source.OSM is its child class.
Namespace helps you to organize your code by grouping it logically, and also by separating variables from the global.
You can declare a namespace with something like below:
var app = {
main: ""
}or
var app = {};
app.main = {};The ol.* classes in the API documentation illustrate the namespace purpose http://openlayers.org/en/v3.0.0/apidoc/.
Methods are actions you can use within the object. Getters and setters are special types of methods. A setter's purpose is to set property within the object, whereas a getter is to get property from the object.
In OpenLayers, most classes inherit from the ol.Object class. This class is fundamental for using setters and getters within the library. The excerpt from the official documentation is quite clear about them:
"Classes that inherit from this have predefined properties, to which you can add your own. The pre-defined properties are listed in this documentation as Observable Properties, and have their own accessors; for example,
ol.Maphas atargetproperty, accessed withgetTarget()and changed withsetTarget(). However, not all properties are settable. There are also general-purpose accessors,get()andset(). For example,get('target')is equivalent togetTarget()."
Let's have a look at the API and understand how it uses the OOP concepts.
After reviewing the most important principles, let's inspect the API to sort out how to analyze it with OOP concepts.
For this, we will reuse the ol.source.XYZ API documentation, http://openlayers.org/en/v3.0.0/apidoc/ol.source.XYZ.html. First, let's start with the content on top of the page.
The illustration above is self-explanatory. You should follow the link for the constructor function, the subclasses to inspect properties, and methods subclasses inherits and discover provided properties and methods from ol.source.TileImage.
Using the following screenshot, you will be able understand inheritance:
Looking at the screenshot, we are able to figure out most of the inheritance. We deduced the exact class inheritance by hovering over the inherited keyword with the mouse to see the URL that gives us a hint about it.
Within the previous screenshot, for readability, we had to remove the full ol.source.XYZ class description. If we include and follow all the available methods, the relationships between ol.source.XYZ class methods and properties and their parent and child classes, the result will be as follows:
For a more complete abstract about object-oriented programming, check out https://en.wikipedia.org/wiki/Object-oriented_programming.
For a review concerning JavaScript object-oriented programming, head on to https://developer.mozilla.org/en-US/docs/Web/JavaScript/Introduction_to_Object-Oriented_JavaScript.
Closure Tools are a set of utilities used for web development. It is mainly supported by Google, but is open source under the Apache License Version 2.0, a well-established permissive license. The name Closure Tools hides under it a lot of subtools, which will make your life as an apprentice developer easier. It includes a JavaScript optimizer, a JavaScript library, a templating library, a style checker and style fixer, and at last, a stylesheet language. Just to illustrate how powerful this set can be, think that most Google JavaScript applications, such as Gmail or Google Maps, use these components.
Why are we introducing you to these tools?
The OpenLayers 3 library itself depends on the Closure Library, the JavaScript library attached to Closure Tools. Its main goal is to leverage cross-browser support. You also know you can write your application in pure JavaScript.
However, you can also consider Closure for advanced uses like creating your own component such as controls and buttons with special behavior inherited from an existing OpenLayers component. You will also get some useful UI components. It is also a good toolset to achieve better file compression when you want an efficient web mapping application, using the Closure Compiler, another utility from the Closure Tools bundle.
We will not review all Closure Tools but only the most useful. Specifically, we will cover the following topics:
If you have ever done a bit of web development, and in particular, JavaScript, you must have heard about jQuery, the most popular JavaScript library with more than 50 percent of the worldwide websites using it. To not reinvent the wheel, the OpenLayers development team chose Closure Library rather than jQuery. Why was this decision made? For a better understanding, you need a bit of history of the Web.
In the olden days, there wasn't a lot of JavaScript. All applications were created using simple HTML and CSS. There was dynamic content when reloading a full page using a server-side such as PHP or Java. However, people wanted a smoother web navigation experience. With the way AJAX works it was possible, as illustrated in the following figure, and people began to focus more and more on the client-side:
The main two problems associated with this evolution are:
When you are at home, you don't really suffer from bandwidth restriction, but in other cases, you will always suffer from high latency. If you are planning to work on mobile support with limited bandwidth, high latency, and a browser with limited memory, it can be a pain.
A good part of the solution lies in compression.
You have three levels of compression available for JavaScript, depending on technology:
For performance, the last method will work the best, and the Closure Library is the only JavaScript library able to work this way, when combined with Closure Compiler.
Closure Tools, in particular, Closure Library and Closure Compiler are among the best tools to deal with this case.
Although both tools are tightly related, we will review the most useful functions related to Google Closure Library and later explain how to use Closure Compiler to optimize code.
Although we can download the library on our computer, to remain simple, we will use a remote JavaScript library version.
<!DOCTYPE html>
<html>
<head>
<title>Dom manipulation</title>
<script src='https://rawgit.com/google/closure-library/master/closure/goog/base.js'></script>
<script>
goog.require('goog.dom');
</script>
</head>
<body>
<ul id="my_layers_list">
<li>My first layer</li>
<li>My second layer</li>
<li>My third layer</li>
<li>My background or base layer</li>
</ul>
<script>
var my_layers_list = goog.dom.getElement('my_layers_list');
var myTitle = goog.dom.createDom('h1');
var myText = goog.dom.createTextNode("My simple layers list");
goog.dom.append(myTitle, myText);
goog.dom.insertSiblingBefore(myTitle, my_layers_list);
</script>
</body>
</html>In order to understand the code, let's review the lines related to the Google Library:
<script src='https://rawgit.com/google/closure-library/master/closure/goog/base.js'> </script>
Load the library base from a remote file. The code hosted on Github, needs to use a third-party website https://rawgit.com to be able to serve the .js files:
goog.require('goog.dom'); This line is the way to say make available the function from goog.dom namespace of the library. If you forget this call, every function call starting with goog.dom will fail. This call adds a call to <script src='https://rawgit.com/google/closure-library/master/closure/goog/base.js'> and must be separated in a dedicated <script> tag.
The goal here is to load only required functions and to keep your JavaScript clean with namespacing. Namespace enables separation of functions based on a common name. The chosen namespace for the Google Library is goog, so every function based on the library will start with goog. In this case, the goog.dom namespace is created. To discover the available functions in the namespace, you can use your JavaScript debugger and type goog.dom var my_layers_list = goog.dom.getElement('my_layers_list');. This line selects from DOM the element with an attribute ID, 'my_layer_lists'.
var myTitle = goog.dom.createDom('h1'); creates an <h1> tag in an HTML fragment, an element separated from the DOM, which you plan to add later to the web page DOM:
var myText = goog.dom.createTextNode("My simple layers list");The following code line adds a text node, the visible element in HTML you will see in a web page.
goog.dom.append(myTitle, myText);
Add the text node to the <h1> tag. That is, the two previous floating elements <h1> </h1> and My simple layers list became: <h1>My simple layers list</h1>
goog.dom.insertSiblingBefore(myTitle, my_layers_list);
Add the combined fragment to the DOM: it will be visible in your browser. We choose to use the insertSiblingBefore method. Its purpose is to add a fragment in the DOM before a reference DOM element. So, the text with <h1> tags will appear before the list.
With this example, we have reviewed a small subset of the goog.dom functions.
You will need them, for example, for interactivity like displaying an element with a color change, or for having an application that reacts to a click of a button.
Google library is an ever evolving JavaScript library
In a real context, outside experimentations such as the first Closure Library code example, you will need to retrieve it using an SCM (Source Code Management) software. Its goal is to follow every change in the code. It is one of the most useful tools for developers. The one you need is called Git. Don't worry about it at the moment, we will need it in the Installing the OpenLayers development environment section. For now, just remember the URL to get the code from https://github.com/google/closure-library
To give you an overview of the most useful functions, we have mentioned below some statistics on the most used namespaces and sub-namespaces' functions in the OpenLayers 3 library. We also chose to keep the functions at the first level such as goog.require(. You can make the distinction between functions and namespaces with the open parenthesis. We also ordered the list in the following table:
|
Namespace and sub-namespaces |
Numbers of occurrences |
|---|---|
|
|
1436 |
|
|
812 |
|
|
765 |
|
|
349 |
|
|
295 |
|
|
289 |
|
|
196 |
|
|
168 |
|
|
136 |
|
|
113 |
|
|
100 |
|
|
81 |
|
|
72 |
|
|
68 |
|
|
39 |
|
|
35 |
|
|
22 |
|
|
21 |
|
|
14 |
|
|
13 |
|
|
12 |
|
|
11 |
|
|
9 |
|
|
5 |
|
|
4 |
|
|
3 |
|
|
2 |
|
|
1 |
Let's talk about goog.require and goog.provide. The Google Library, and hence the OpenLayers internal code, manages dependencies using these two declarations. In a file, goog.require helps declaring required functions needed in the application code, whereas the goog.provide is the opposite: it permits declaring that some functions are within a file. These declarations combined with Closure Compiler usage help solve dependencies between the various library files and also with the application code. Reusing these dependencies will enable combining code for production.
Other important functions are goog.inherits and goog.base: you will find them to apply inheritance concepts already evoked in Appendix A, Object-oriented Programming – Introduction and Concepts.
With previous functions, you might think that some functions not at the top of the list are not useful, but you shouldn't. In fact, we invite you to review them because the code for the core of a JavaScript library differs from the code application to use it. In particular, look at goog.userAgent functions or goog.style.
To have an overview of the available functions, the recommended way is to visit the official website, https://developers.google.com/closure/library/, to review the API, http://docs.closure-library.googlecode.com/git/index.html. For samples, look at the available demos you have to use at https://github.com/google/closure-library/tree/master/closure/goog/demos/. It's a great complementary help to the API, in particular to get an overview of the goog.ui components.
Next, let's head to an example to make your own component using Closure Library.
When a component is not available, you will have to write some application code or for reuse purpose, make your own. In this section, we will first review some of the concepts of JavaScript applied with Google Closure Library. After this, we will see one of the official sample code to understand how to use the library to create your own customized component.
Let's start with the inheritance. It should ring a bell; otherwise, you should review Appendix A, Object-oriented Programming – Introduction and Concepts. This example will be enough to introduce you to other key concepts of the library:
<!DOCTYPE html>
<html>
<head>
<title>Inheritance</title>
<script src='https://rawgit.com/google/closure-library/master/closure/goog/base.js'></script>
</head>
<body>
<script>
//Parent Class
goog.provide('myNamespace.layer.Layer');
/**
* @constructor
*/
myNamespace.layer.Layer = function (options) {
this.color_ = options.color || 'grey';
}
myNamespace.layer.Layer.prototype.getColor = function () {
return this.color_;
}
//Sub Class
goog.provide('myNamespace.layer.Vector');
/**
* @constructor
* @extends {myNamespace.layer.Layer}
*/
myNamespace.layer.Vector = function (options) {
goog.base(this, options);
if (options.style) {
this.style_ = options.style;
}
}
goog.inherits(myNamespace.layer.Vector, myNamespace.layer.Layer);
//Create a new instance of Vector layer and call to method from parent class.
var myVector = new myNamespace.layer.Vector({
color: 'white',
style: 'myStyle'
});
console.log(myVector.getColor());
</script>
</body>
</html>Launch it in your browser with the debugger, like Google Developer Tools, opened.
Let's review the code for the main lines:
<script src='http://closure-library.googlecode.com/svn/trunk/closure/goog/base.js'> </script>
This inserts the call to Closure Library:
goog.provide('myNamespace.layer.Layer');This declares the parent namespace (and class) with goog.provide:
/**
* @constructor
*/
myNamespace.layer.Layer = function (options) {
this.color_ = options.color || 'grey';
}This declares the parent constructor:
myNamespace.layer.Layer.prototype.getColor = function () {
return this.color_;
}This adds a method to the prototype of the object:
goog.provide('myNamespace.layer.Vector');This declares the children's namespace (and class) with goog.provide:
/**
* @constructor
* @extends {myNamespace.layer.Layer}
*/
myNamespace.layer.Vector = function (options) {
goog.base(this, options);
if (options.style) {
this.style_ = options.style;
}
}This declares the children's constructor and specifies who the parent is, in comments with @extends.
In the function, goog.base(this, options); can be replaced with myNamespace.layer.Layer.call(this, options); for a pure JavaScript alternative. It says to call the options from the current constructor:
goog.inherits(myNamespace.layer.Vector, myNamespace.layer.Layer);
This makes myNamespace.layer.Vector inherit from its parent myNamespace.layer.Layer.
var myVector = new myNamespace.layer.Vector({
color: 'white',
style: 'myStyle'
});
console.log(myVector.getColor());This instantiates myNamespace.layer.Vector with options and makes a console call to get the method call to the parent class in order to retrieve the color.
Until now, we mainly covered Closure Library, but this knowledge can be reused in OpenLayers. You will see that OpenLayers application code can really look like Closure Library.
To see the similarity between Closure Library and OpenLayers application code, we will review inheritance in a real OpenLayers context. So, we will ask you to review an official example available at http://openlayers.org/en/v3.0.0/examples/custom-controls.html.
It will also be a good opportunity to review inheritance knowledge from Chapter 2, Key Concepts in OpenLayers; Chapter 9, Taking Control of Controls and Appendix A, Object-oriented Programming – Introduction and Concepts.
This example contains the following JavaScript content:
/**
* Define a namespace for the application.
*/
window.app = {};
var app = window.app;
//
// Define rotate to north control.
//
/**
* @constructor
* @extends {ol.control.Control}
* @param {Object=} opt_options Control options.
*/
app.RotateNorthControl = function(opt_options) {
var options = opt_options || {};
var anchor = document.createElement('a');
anchor.href = '#rotate-north';
anchor.innerHTML = 'N';
var this_ = this;
var handleRotateNorth = function(e) {
// prevent #rotate-north anchor from getting appended to the url
e.preventDefault();
this_.getMap().getView().setRotation(0);
};
anchor.addEventListener('click', handleRotateNorth, false);
anchor.addEventListener('touchstart', handleRotateNorth, false);
var element = document.createElement('div');
element.className = 'rotate-north ol-unselectable';
element.appendChild(anchor);
ol.control.Control.call(this, {
element: element,
target: options.target
});
};
ol.inherits(app.RotateNorthControl, ol.control.Control);
//
// Create map, giving it a rotate to north control.
//
var map = new ol.Map({
controls: ol.control.defaults({
attributionOptions: /** @type {olx.control.AttributionOptions} */ ({
collapsible: false
})
}).extend([
new app.RotateNorthControl()
]),
layers: [
new ol.layer.Tile({
source: new ol.source.OSM()
})
],
renderer: exampleNS.getRendererFromQueryString(),
target: 'map',
view: new ol.View({
center: [0, 0],
zoom: 2,
rotation: 1
})
});These questions are for improvement:
RotateNorthControl component?ol.inherits is an alias to goog.inherits)?Until now, we focused on Closure Library. However, as we mentioned at the start of this chapter, for performance, we need to use Closure Compiler as well. It is time to do it!
The more we can learn without installing tools the better it is to lower the learning entry. So, we will use the Closure Compiler online tool. Go to the official URL, http://closure-compiler.appspot.com and you will get the following screenshot:
To display the ability of the Closure Compiler to compress files, we will ask you to try it online. Perform the following actions:
// ADD YOUR CODE HERE section in the left-hand text area.The results you get from your experiment are as follows:
|
Compression level |
Original size |
Original gzipped size |
Save percentage |
Compiled size |
Compiled gzipped size |
Save gzipped percentage |
|---|---|---|---|---|---|---|
|
WHITESPACE |
940 bytes |
391 bytes |
45.21% |
515 bytes |
238 bytes |
39.13% |
|
SIMPLE |
940 bytes |
391 bytes |
52.77% |
444 bytes |
224 bytes |
42.71% |
|
ADVANCED |
940 bytes |
391 bytes |
85.74% |
160 bytes |
141 bytes |
66.75% |
Let's take a look at the results of the different optimizations mode to compare:
goog.provide("myNamespace.layer.Layer");myNamespace.layer.Layer=function(options){this.color_=options.color||"grey"};myNamespace.layer.Layer.prototype.getColor=function(){return this.color_};goog.provide("myNamespace.layer.Vector");myNamespace.layer.Vector=function(options){goog.base(this,options);if(options.style)this.style_=options.style};goog.inherits(myNamespace.layer.Vector,myNamespace.layer.Layer);var myVector=new myNamespace.layer.Vector({color:"white",style:"myStyle"});console.log(myVector.getColor());As you can see, everything is preserved. You only made the code compact by removing white space.
var myNamespace={layer:{}};myNamespace.layer.Layer=function(a){this.color_=a.color||"grey"};myNamespace.layer.Layer.prototype.getColor=function(){return this.color_};myNamespace.layer.Vector=function(a){myNamespace.layer.Layer.call(this,a);a.style&&(this.style_=a.style)};goog.inherits(myNamespace.layer.Vector,myNamespace.layer.Layer);var myVector=new myNamespace.layer.Vector({color:"white",style:"myStyle"});console.log(myVector.getColor());As you can see the compiler has done a substituting job by replacing all the goog functions. The only remaining namespaced function is goog.inherits. The function arguments are also renamed. It remains quite readable. If you replace the JavaScript from the example with this one, you can always call in your console the function with their original names.
function b(a){this.a=a.color||"grey"}function c(a){b.call(this,a);a.style&&(this.c=a.style)}goog.b(c,b);console.log((new c({color:"white",style:"myStyle"})).a);As you can see in this case, most of the code is renamed. The code in itself will have the same behavior but you can't call it with the original functions you wrote.
The ADVANCED way of doing it is the more efficient way to compress, but it requires extra work as compared to the SIMPLE mode. In particular, you need to add extra comments to be able to run the compiler. We gave you a working example, but removed the text @constructor on the sample code and run again the ADVANCED mode and observe. Because of this mode when you are using foreign code such as an external library, you have to mention preserve this code from renaming. For this, you have to declare what we call externs. If you don't have available externs with the library you are using, your code will fail to execute correctly.
Do not worry at the moment! The OpenLayers tools we will review already support jQuery externs, for example. We recommend that you go to the dedicated web pages from Google because it's an advanced feature (https://developers.google.com/closure/compiler/docs/api-tutorial3) and because we will review later how to solve it in the OpenLayers 3 context. You can also solve the problem using only the SIMPLE mode but you will lose a part of the gain of Closure Tools.
We will now see the application of what we learned so far in OpenLayers.
When you choose to release your application online and you need performance for your web mapping applications, you need to perform certain steps.
Closure Compiler enables you to do so at the JavaScript level. In the OpenLayers project, some tools facilitate the use of Closure Compiler.
These tools, such as Closure Compiler, depend on three languages: Python, Java, and Node. We will quickly review the install process to run it.
We will review how to install the environment on the different operating systems. We will start with Python. Then, we will install NodeJS. Next, we will do a Java installation and we will end with other tools such as Git installing.
Closure Compiler requires 2.x series of Python. You can install it using the following instructions for Microsoft Windows and Linux. For Mac OSX, Python is already bundled.
Go to http://www.python.org/downloads/ and follow these steps:
Click on the link referring to the latest Python 2.x series (2.7.9 at writing time). Next, click Download on the Windows x86 MSI Installer or Windows X86-64 MSI Installer, depending of your Microsoft Windows architecture.
;C:\Python27;C:\Python27\Scripts.You need to open a command line as superuser:
On a RedHat-based OS:
yum install python python-setuptools
On Ubuntu/Debian OS:
apt-get install python python-setuptools
On every OS, open a command line (for MS-DOS, go to open Command Prompt or Bash for Linux/Mac OSX) and type:
python –-version
It will echo something such as Python 2.7.5.
For all OS, you must install pip, a packet manager for Python.
Download it at https://bootstrap.pypa.io/get-pip.py and then execute the following code line:
python get-pip.py
It's quite easy. We will not rely on external packages but only official binaries. Check out the official website at http://nodejs.org/download/.
Just download the binary, and then execute the installer. Nowadays, except if you have an old Windows XP, you should download the 64 bit Windows Installer (.msi).
Instructions are for both RedHat-based OS and Ubuntu/Debian OS.
su or by adding sudo:
mkdir /opt/node && chmod -R 777 /opt/node/
/opt/node directory.~/.profile file the following:
export PATH=$PATH:/opt/node/bin
We have assumed you started from scratch. You may already have Java installed. Mostly, it will be the JRE (Java Runtime Environment). JRE is enough to execute Java, but we can also use the developer-oriented JDK (Java Development Kit).
Before downloading a new JRE, try to see if you already have Java installed. For this, open a command prompt and type the following:
java -version
If the feedback is not something like java version "1.7.0_xx", you should consider installing the JRE. The returned version must be 1.7.0_xx (xx is the exact version) and it should not be 1.6.0_xx or 1.8.0.xx. At the writing time, the version was 1.7.0_72.
Independent of the OS, head to http://www.oracle.com/technetwork/java/javase/downloads for downloading the file you require to have Java JRE (Java Runtime Environment).
As there are many links, you will find the following screenshot with the mouse indicating the link to follow:
After download, run the installer and set the PATH, as for Python.
Here, you will need to add a new system environment variable called JAVA_HOME with the value C:\Program Files\Java\jrexxx or C:\Program Files(x86)\Java\jrexxx, depending on your architecture (32 or 64 bit). You will follow the same recipe described to change PATH in Python but instead of editing an existing variable, you will add it.
After, add at the end of the PATH environment ;%JAVA_HOME%\bin.
On a RedHat-based OS:
Retrieve the RPM from the URL retrieved by following the screenshot JRE Download button and perform the following command as superuser (depending on your java version):
rpm -ivh jre-7u72-linux-x64.rpm
On an Ubuntu/Debian OS, get the tar.gz Linux file instead of the RPM file:
tar xvzf jre-7u72-linux-x64.tar.gz mv jre1.7.0_72 /opt/ && chmod -R 777 /opt/jre1.7.0_72
In ~/.profile, add the following content at the end of the file:
export JAVA_HOME=/opt/jre1.7.0_72 export PATH=$PATH:$JAVA_HOME/bin
In the information box about Closure Library, we mentioned an SCM called Git. Now, it's time for installation. Let's see how it works on a different OS.
Head to the msysGit project, https://msysgit.github.io, download the installer by clicking on the Download link and execute it.
After installation, add to the PATH, as for Python, the string; C:\msysgit\bin\;C:\msysgit\bin\mingw\bin
yum install git-core
On an Ubuntu/Debian OS:
apt-get install gitMac OSX
Go to the Mac installer website, http://code.google.com/p/git-osx-installer, and install it.
Now that you have Git, you can install other tools.
Now, everything is ready! So, let's start to use the Closure Compiler to better understand how to optimize your code to display faster maps. We will review how to use the OpenLayers development workflow to make your custom application.
We will inspect reusing the workflow for developing the OpenLayers core library to run the official examples. For this purpose, start with the following step:
git clone https://github.com/openlayers/ol3.git cd ol3 git checkout v3.0.0
npm install sudo pip install -r requirements.txt
build.cmd checkdeps or ./build.py checkdeps on Linux / Mac OSX. It will return if dependencies are solved to proceed to the next step.build.cmd build.cmd host-examples build.cmd serve
./build.py ./build.py host-examples ./build.py serve
You may need an offline API, if for example, you're working in public transportation or without a network connection. To generate it, execute the ./build.py apidoc or build.cmd apidoc. Then, open it with http://localhost:3000/build/hosted/HEAD/apidoc/. You can also get it directly from the v3.0.0.zip file, downloaded from Chapter 1, Getting Started with OpenLayers.
http://localhost:3000/examples/ and open Google Chrome Developers Tools. You will see the examples like the one you get on the official website that follows:http://localhost:3000/build/hosted/HEAD/examples/attributions.html.?mode=whitespace or ?mode=simple, or ?mode=raw.We serve files on a small web server. In the first case, the loader.js file retrieves the dependencies and adds for each required files the script tag with the src attribute. In the second case, we chose to open the hosted files, the ones you get when you browse the official website, http://openlayers.org.
In the second case, depending on the provided values for the mode parameter, we will load different files for the OpenLayers 3 library:
<script> tag. This does not run the Compiler, so no checks are performed.SIMPLE_OPTIMIZATIONS enabled. Without an option in the URL, this loads the JavaScript as compiled with ADVANCED_OPTIMIZATIONS enabled.Hey! These options look familiar, where did we see them?
Remember that we had mentioned to you that OpenLayers tools are using Closure Compiler. Let's see how OpenLayers takes benefits from it.
When you changed examples with the raw mode, you may have noticed (in particular by filtering the script in the Network panel) that the loaded files number greatly differs from the URL without it. What can make this difference? Let's see some practical uses to understand.
We waited until now to review the removal of the unused code feature related to Google Closure Compiler.
As we already said, when you switch between examples, you load different files. How does it work?
Open your browser Network panel. Open the URL for one of the official examples and add ?mode=raw.
Then, in the console, type console.log(paths.length);.
Just compare the length between the examples. If your example in the URL is animation.html, inspect also the animation-require.js files, you will see that there are some lines beginning with goog.require('...'). The loader gets the name from the file via loader?id=examplename, and with the goog.require indications from examplename-require.js, Closure Compiler generates the list of files to load for the example.
When Compiler does not find the required goog.require statements, it excludes the files and the resulting build file is smaller. On mobile applications, it is invaluable. Just be careful to not break your application, for example, if you forget to add a statement.
When you run ./build.py or build.cmd, you have something such as 2014-12-10 18:41:23,358 build/ol.js: node tasks/build.js config/ol.json build/ol.js. We will reuse the beginning command to compile the ol.js file again and play with the Closure Compiler builder included in the OpenLayers 3 toolkit. The ol.json file is used to provide parameters to Closure Compiler to make the build and ol.js is the output result.
To build, you have two choices:
.js lightened buildAt the moment, you have a shared JSON file for all examples in config/examples-all.json. We will reuse it.
We will reuse the animation sample, from the local OpenLayers installation, to try out both ways of building code:
animation.html and animation.js files from the examples folder into animation-exports.html and animation-exports.js.config/ol-animation-exports.json inspired by the config/examples-all.json with the following content:{
"exports": ["ol.Map",
"ol.Map#*",
"ol.View",
"ol.animation.*",
"ol.control.*",
"ol.layer.Tile",
"ol.proj.*",
"ol.source.OSM"
],
"src": ["src/**/*.js"],
"compile": {
"externs": [
"externs/bingmaps.js",
"externs/bootstrap.js",
"externs/closure-compiler.js",
"externs/example.js",
"externs/geojson.js",
"externs/jquery-1.7.js",
"externs/oli.js",
"externs/olx.js",
"externs/proj4js.js",
"externs/tilejson.js",
"externs/topojson.js",
"externs/vbarray.js"
],
"define": [
"goog.dom.ASSUME_STANDARDS_MODE=true",
"goog.DEBUG=false"
],
"jscomp_error": [
"accessControls",
"ambiguousFunctionDecl",
"checkEventfulObjectDisposal",
"checkRegExp",
"checkStructDictInheritance",
"checkTypes",
"checkVars",
"const",
"constantProperty",
"deprecated",
"duplicateMessage",
"es3",
"externsValidation",
"fileoverviewTags",
"globalThis",
"internetExplorerChecks",
"invalidCasts",
"misplacedTypeAnnotation",
"missingGetCssName",
"missingProperties",
"missingProvide",
"missingRequire",
"missingReturn",
"newCheckTypes",
"nonStandardJsDocs",
"suspiciousCode",
"strictModuleDepCheck",
"typeInvalidation",
"undefinedNames",
"undefinedVars",
"unknownDefines",
"uselessCode",
"visibility"
],
"extra_annotation_name": [
"api", "observable"
],
"jscomp_off": [
"es5Strict"
],
"compilation_level": "ADVANCED",
"output_wrapper": "// OpenLayers 3. See http://ol3.js.org/\n(function(){%output%})();",
"use_types_for_optimization": true
}
}animation-exports.js file, remove the goog.require statements.animation-exports.html, change the script src attribute from loader.js?id=animation to ../build/ol-animation-exports.js and add a new script reference with <script src="animation-exports.js"></script>.ol-animation-exports.js file from the root ol3 folder using the following command:
node tasks/build.js config/ol-animation-exports.json build/ol-animation-exports.js
./build.py serve or build.cmd serve and open your browser at http://localhost:3000/examples/animation-exports.html.animation.html and animation.js from the examples folder into animation-combined.html and animation-combined.js.<script src="jquery.min.js"></script>
<script src="../build/ol-animation-combined.js"></script>config/ol-animation-exports.json into config/ol-animation-combined.json.[] and add at the end of the array, contained in the src value, the .js files declaration to get a result like the following:"src": [
"src/**/*.js",
"examples/animation-combined.js"
]examples/animation-combined.js file the code from resources/example-behaviour.js.externs/example.js, from the config/ol-animation-combined.json file.
node tasks/build.js config/ol-animation-combined.json build/ol-animation-combined.js
http://localhost:3000/examples/animation-exports.htmlUntil now, to facilitate learning, we used code for samples within the HTML. For compressing code, firstly, you need to have all your JavaScript code in a separate .js file.
In the first case, we used exports in the ADVANCED mode. At the functional level, exporting means that you want to stop obfuscating variables, for example, renaming variables and properties to shorter ones. The advantage of this, is that you can use code from outside the library, in a third-party JavaScript file. It can help you, for example, in designing a subset of the OpenLayers 3 library for specific use cases or making your own library based on the OpenLayers 3 and a custom code augmenting the default.
At the code level, to know what we want to export, we reuse the content from goog.require statements in the example. These statements are deduced from the code namespaces and constructors . If you limit yourself to these statements to declare exports, when compiling and executing code, you will get some errors stating undefined in the browser debugger console. Mostly, it means you protect the constructor but you didn't choose some functions to protect. To protect from variable renaming, you will need to use the * character. It's what we have done with ol.Map#* or ol.proj.*.
In the ol.Map#* case, we said that we wanted to protect all functions from ol.Map.prototype to be renamed by using the # character. In the ol.proj.* use case, we just protected the all ol.transform namespace.
For externs, we will not go in to the details of how they work, but you just have to understand that it's a way to protect code from other libraries to be renamed by Closure Compiler by declaring their variables' and functions' signatures.
If we review the other parameters in the first JSON file, the most important ones are:
src: This helps define where your compiler has to search for code when managing dependencies. Those dependencies are declared by declarations in code.compilation_level: This can be set to ADVANCED, WHITESPACE_ONLY, or SIMPLE. We chose to look at the ADVANCED case, because once we have understood how to work with the advanced option, the others can be worked on easily.use_types_for_optimization. In fact, it highlights the importance of comments also known as annotations. We will start by quoting the official Closure Compiler documentation:"The Closure Compiler can use data type information about JavaScript variables to provide enhanced optimization and warnings. JavaScript, however, has no way to declare types. Because JavaScript has no syntax for declaring the type of a variable, you must use comments in the code to specify the data type."
From this, we can deduce that you can use Closure Compiler without always using comments but comments can help you catch errors using variables type checking based on comments (based on a standard called JSDoc).
It's also useful, because when Closure compiler uses the ADVANCED mode, the compiler renames variables to decrease the build size and annotations act as hints for the tool. Moreover, the commenting code is anyways a good practice to maintain code: do not hesitate to use them. Navigate to the official Closure Compiler documentation (https://developers.google.com/closure/compiler/docs/js-for-compiler) to see the exact grammar.
Another good tip related to annotations is the fact that adding an annotation @api (specific to OpenLayers) is the way to export a function when you use OpenLayers 3 default build system.
For instance, you can add @api to ol.Ellipsoid and ol.Ellipsoid.prototype.vincentyDistance in the file src/ol/ellipsoid/ellipsoid.js (for reference, see src/ol/map.js line 160). Then, launch node tasks/build.js config/ol.json build/ol.js and reuse the generated ol.js instead of the usual one. You will see that you can use, in your application code, the following code:
var ellipsoid_wgs84 = new ol.Ellipsoid(6378137, 1/298.257223563); var distance_ol3_vincenty = ellipsoid_wgs84.vincentyDistance([5, 34], [12, 56])
We will not inspect all the other parameters, because it's mostly not required to understand their meanings. If you would like to read further about them, we recommend that you go to the API and to the readme file about tasks that document most parameters at https://github.com/openlayers/ol3/blob/v3.0.0/tasks/readme.md.
If we dive into the case where we build everything together, the essential part is the inclusion of the build/ol-animation-combined.js file in the src array parameter.
As we removed the script tag calling resources/example-behaviour.js from animation-combined.html, we had to combine resources/example-behaviour.js with examples/animation-combined.js files. It's because adding a file into src array is not enough. You need goog.require into the file to be combined with the main OpenLayers 3 library code.
With the inclusion of resources/example-behaviour.js, the other important part was to remove the externs/example.js line, in order to unprotect the exampleNS namespace, so that we can rename it.
You should also note that in both reviewed case, compression can be achieved because of already mentioned goog.require and goog.provide. At the code level, they allow you to create a dependencies tree to gather each required function and variable within OpenLayers core library code source files.
If you inspect the size of the resulting files, you will see that although we have more content in the ol-animation-combined.js file than ol-animation-exports.js, the first one weighs 190Ko (65Ko manually gzip compressed), whereas the second size is 212Ko (71Ko manually gzip compressed).
The conclusion is that compiling everything together is the best solution to gain size in your code.
Now, try to reuse this knowledge in your own OpenLayers samples build.
Now that you have all the basic knowledge about OpenLayers toolkit to compress code, try and apply it your own project.
To improve your skills, you can perform the same task we did in the previous Time for action section, but using a different example. You can use the JSON files from the build/examples because they may help you to solve building dependencies. Be careful, if you rely only on those files, it will not work the expected way if you use the export method or you change JavaScript calls in samples HTML files.
To try it out.
You have to change the paths in samples, and then test them by interacting with your samples; it may work when they are loading, but they will fail later when clicking and panning.
Remember we told you that without externs, you can't use external libraries in the ADVANCED mode? We recommend you comment out or remove externs, to see what will happen if we don't use them. In particular, try to remove jQuery externs, and try to build the examples from Time for action.
What do you see? If you don't have any ideas, you can see that externs' keywords refers to some JavaScript files. If you need, for example, to use a library such as Underscore (another JavaScript Library to use more functional programming), just copy the externs, add your path to the JSON file, say, "../externs/underscore.js", and after this, you are ready to use your library in the Closure Compiler ADVANCED mode.
To find out about externs, go to this Closure Compiler web page: https://github.com/google/closure-compiler/wiki/Externs-For-Common-Libraries
If you require another less common library, find it using a search engine or by generating it with this tool: http://blog.dotnetwise.com/2009/11/closure-compiler-externs-extractor.html
In the worst case, you will be stuck and will only be able to use the SIMPLE mode or to use the exports method, building a minimum Openlayers core library.
Q1. When using the OpenLayers 3 toolkit, your code is not working in the ADVANCED compilation mode, although it's perfectly fine in the SIMPLE mode, what can be the cause (multiple choices accepted)?
goog.requiregoog.inheritsgoog functions in your custom codeNow, we have seen mainly an underlying way to compress the JavaScript code; we will introduce you to syntax and styles in JavaScript code. When you start to write more than ten lines of code, it starts to become an obligation!
Syntax and styles are the way to keep your code clean and to share it. You can always do dirty work, but for maintainability of long term, it is a must to enforce some rules.
For this, we rely on Closure Linter, one of the Closure tools. It also requires Python to run. We already installed it with pip install -r requirements; so, let's see how to use it. Later, we will see some alternatives.
We will retrieve one file from the previous OpenLayers library Version 2.12.
For this, download the file Map.js from https://raw.github.com/openlayers/openlayers/release-2.12/lib/OpenLayers/Map.js.
Type the following command:
gjslint Map.js
You will get 605 errors with messages like below:
----- FILE : /home/thomas/Map.js ----- Line 1, E:0001: Extra space at end of line Line 7, E:0200: Invalid JsDoc tag: requires Line 266, E:0131: Single-quoted string preferred over double-quoted string. Line 982, E:0120: Binary operator should go on previous line "+" Line 1106, E:0002: Missing space before "(" Line 1131, E:0002: Missing space after "function" Line 1089, E:0110: Line too long (83 characters). Found 605 errors, including 0 new errors, in 1 files (0 files OK).
Some of the errors reported by GJsLint may be auto-fixable using the fixjsstyle script. Please double-check any changes it makes and report any bugs. The script can be run by executing:
fixjsstyle Map.js
So now, make a copy of the Map.js file to save it in an eventual case where the fixer would suffer from a bug. Then, execute the following recommended line:
fixjsstyle Map.js
You will see:
fixjsstyle Map.js Fixed 582 errors in /home/thomas/Map.js WARNING: Line 1089 of /home/thomas/Map.js is now longer than 80 characters.
Relaunch the gjslint again:
gjslint Map.js
You now have only 23 errors. Really good compared to the previous 605 errors. You can ignore, in this case, errors like:
Be aware, that you can use options to comply more or less to the language but can't customize everything. You are also encouraged to play with the options. To discover them, execute the following command:
gjslint -–help
For example, try the --strict options that check also your file indentation and you get 1867 errors or use the recursive option -r to apply check on a every JavaScript files in a directory.
We use a practical approach, but to understand the adopted code style, we invite you to go to the Google JavaScript Guide at http://google-styleguide.googlecode.com/svn/trunk/javascriptguide.xml, in particular, if you don't want to fix all your code at the end of your project.
We gave you some information about the raw use of the Linter, but like for other cases, you already can check your code in the default OpenLayers development environment. Just launch ./build.py lint or build.cmd lint, depending on your OS.
Although syntax and styles are considered as good practices. Good practices are not rules; you choose to respect them more or less. Never forget that consistency is important, particularly when you need to share your code with other people. We reviewed how to do it with Closure Linter but this is not the only way. Let's broaden your vision.
It is always easier to use the same tools for all your JavaScript, but we advise that you be curious about other JavaScript coding styles for improving your knowledge and choose the coding style that fits you.
We recommend that you not only look at https://github.com/rwldrn/idiomatic.js but also at big library projects.
For example, check out the following links:
To enforce your own coding style and share it, the most valuables tools are as follows:
Although those tools are interesting, the errors you receive when using them on your files are not always clear. So, we advise that you look at http://jslinterrors.com.
In this appendix, we learned a lot about the Closure Tools. It is always important to understand how things work to be able to track why your code is not working. Without this review, when using, for example, the ADVANCED mode, you will stay stuck and end up keeping the default file for production. If you do so, you are losing partly the OpenLayers 3 philosophy: this version is a rewrite to have a better API and to get performances.
In the first part of the appendix, we learned why performance is important. Next, we saw how to reuse Closure Library or how to overload default OpenLayers 3 components. We then inspected how to practically use Closure Compiler itself in the OpenLayers development context.
Finally, we introduced you to some tools to improve your overall code quality. In this case, only remember this citation from idiomatic.js:
"All code in any code-base should look like a single person typed it, no matter how many people contributed."
OpenLayers is, at a fundamental level, not doing anything that is conceptually too hard to grasp. It gets map data from a server, and puts them together. From a technical level, however, there is a lot of work going on, and it might seem magical how it all works together so well.
Fortunately, there are many tools to dispel any potential magical thinking we might have and show us how OpenLayers is working behind the scenes. Google Chrome Developer Tools, the included debugger in Google Chrome browser, is one such great tool. Speeding up development time, viewing network communication, and squashing bugs are just a few things that Chrome Developer Tools, and other web development tools, do that make them hard to live without.
To really use OpenLayers effectively and to its full potential, we need to understand how it works. In this appendix, we'll try our best to do just that, by using web development tools to examine OpenLayers' inner workings. By doing so, we'll accomplish two things. First, we'll become familiar with these tools, which will significantly help us when developing our maps. Secondly, and more importantly for now, we'll gain a better understanding of how OpenLayers works.
We'll do another tour about plugins and functions that can improve your experience in Chrome Developers Tools and can help you develop your OpenLayers debugging skills. To finish, the last topic will be how to work with other browsers when debugging. You may not be aware, but Google Chrome and its Developers Tools is around one-third of the browser market.
In this chapter, we'll cover the following topics:
Chrome Developer Tools, also called Chrome DevTools, is the built-in debugger included in Google Chrome browser, a free cross-platform browser. Other modern- and standards-based browsers, such as Mozilla's Firefox, Apple's Safari, Opera, and Microsoft Internet Explorer (8+) also work well for debugging web-based applications and sites.
Chrome DevTools and other web development tools make the web development process much easier and quicker. What do we mean by this? With these tools, we can change anything on our site on the fly without editing or saving any files. We can type in JavaScript code with a command-line interface and execute it immediately. We can view all the requests that our web page sends to servers, along with the server's reply. For example, if our map isn't able to get back map images from the server, we can examine the requests our page is making and find out if we have any typos or haven't set up our map layer properly.
Using these tools makes it a lot easier to develop not only an OpenLayers mapping application, but any web application, and makes it easier to fix any bugs we encounter in the process. The choice to use Google Chrome as the first tool for debugging instead of other debuggers is motivated by its large support for mobile testing, the best built-in tools for debugging at the time of this writing, its support for all OS (Windows, Mac, Linux) and some others features. We'll focus mainly on Google Chrome in this chapter and refer back to it throughout the book. Other tools such as Mozilla's Firefox, Internet Explorer (8+), and Apple's Safari's developer tools work just as well (although some functionality may vary).
To discover this tool, firstly, Google Chrome browser needs to be installed.
So, go to its dedicated download area at http://www.google.com/chrome/ and install it. Depending of your OS, the format for installing the software will be an .exe, a .dmg, a .deb or an .rpm file.
After the Chrome installation, let's open Chrome DevTools:
After clicking on the panel activation, the browser windows has been split to display a panel.
An alternative way to open this panel is to right-click in a web page and to click on Inspect.
You can also find the keyboards shortcut for this at https://developers.google.com/chrome-developer-tools/docs/shortcuts.
Now, let's take a look at what the tool looks like after its activation:
The top row starts with a Page Inspector icon and Toogle device mode icon, which is useful for mobiles. Then, multiple panels with textual descriptions such as Elements or Network provide specific functionality (they look and act similar to tabs, but the technical term is panels). The upper row end on the right has a Show Console icon, a Settings icon, a Detached/attached debugger icon and a close button. The position of the icons may change over time as Google Developer Tools is updated; but general functionalities should remain (more or less) the same.
The following content will cover the top row icons from left to right, excluding panels.
In this section, we will see each button in the Chrome Developer Developer Tools to review the available functions you can perform with the debugger.
The top row set of controls is called panels; each panel provides a different type of function. The panels act like tabs (the two terms can be used interchangeably), but Chrome Developer Tools refers to them as panels in the documentation. Let's go over each panel, since they are, essentially, what makes up Chrome DevTools. We will not go over these panels from left to right, but instead we will look at the most important ones for beginners first.
The Elements panel provides not just a display of the HTML source code, but also the ability to quickly edit any HTML element and its associated style. It allows users to add, remove, and move HTML elements, edit HTML attributes, and change nearly anything about the page without having to save any files. It also can track when attributes or elements are created, changed, or removed. This helps to make web development much easier and faster.
Chrome DevTools automatically builds a tree structure from HTML code, giving the ability to expand and hide each HTML tag. It is important to note that the code you see in the HTML panel is a generated HTML code—the code in the panel may not be exactly the same as the page's source code (because the browser is interpreting the HTML to be able to show a page content).
Here is what the Elements tab looks like when Chrome DevTools is opened while viewing a web page:
On the left-hand side, Chrome DevTools shows the HTML of the page. It's possible to right-click on any tag and do various things—such as copying the HTML to the clipboard, deleting the element, changing the tag attributes, and more.
On the right-hand side, the associated style information for the selected element is displayed. Properties can be added or modified and will instantly appear on the page, like in the preceding capture image example (at http://www.w3.org/Style/Examples/011/firstcss.en.html), with the div element with id attribute value to language
. Looking at the CSS on the right-hand side, there is a definition for the language id but only font-size and font-style properties are defined. We also see that some other styles are coming from the body element parent. The <div> tag inherits from body the color #333333 or the font-family properties.
If you are unfamiliar with HTML or CSS, the WebPlatform site is a great resource. For more information on HTML, visit http://docs.webplatform.org/wiki/html, and for CSS, visit http://docs.webplatform..
What does this mean? Well, Chrome DevTools lists all inherited style information, and parent element styles propagate down to all their child elements (each child has all its parent's styles, unless the child overrides a style, which doesn't happen in this example).
By double-clicking on pretty much anything in the HTML or CSS list, you can quickly change values and names. Any change you make will immediately show up on the page, which makes it very easy to change style in real time and see how the page is affected without having to edit and save any files.
When you're playing with CSS, you can disable a property with a left click on the left part of the CSS property. You can try this on font-size to see visual change. For CSS, when the code really inherits from a lot of properties, we advise you to go to sub-panel Computed on the right part of Elements panel. You get the summary overview for each property. Play around with it a bit—if you mess anything up, you can just reload the page in Chrome.
When editing pages with Google Chrome Developer Tools, any changes you make will disappear when you refresh the page. You are not editing the actual web server's files with Google Chrome Developer Tools—instead, you are editing a copy that is on your computer that only you can see when you make changes to it. So, if you make changes and want them to be saved, you'll have to edit your actual source code.
In fact, one way to directly edit and save content within Google Chrome Developer Tools is to rely on the Workspace ability we already have evocated when clicking in the Settings icon. Check out the official Chrome Developer browser documentation at https://developer.chrome.com/devtools/docs/workspaces.
Until now, we focused on the right part of panel elements. Let's see how to manipulate and inspect DOM elements in the left Elements window.
Reusing knowledge about OpenLayers renderers from Chapter 3, Charting the Map Class and OpenStreetMap from Chapter 4, Interacting with Raster Data Source, let's review how to manipulate the DOM and changing OpenStreetMap tiles sources on the fly.
So, let's start with the official OpenLayers example from http://openlayers.org/en/v3.0.0/examples/simple.html using Page inspector.
Open the file and at the end of the URL you get from your browser add ?renderer=dom
img tags, right-click on Edit attributes, as illustrated in the following screenshot:src attribute. So, replace its value with http://tile.stamen.com/toner/2/2/1.png and see the result. In the Elements panel, the img (for the image tag) src attribute contains http://b.tile.openstreetmap.org/2/2/1.png. If you remember, URL can be separated in two parts. The first part, http://b.tile.openstreetmap.org/, (called base URL), will change when the second part, 2/2/1.png, will change according to images you hover on. Here, we only change the first part.We saw how to modify attributes of HTML elements using the Page Inspector on images. You also saw the correspondence between highlight on the web page and code content in the Elements panel when hovering over. You also rediscovered some different OpenStreetMap backgrounds.
Chrome DevTools's Network panel is a tool we often use throughout this book. It basically provides a way for us to monitor a network activity by viewing all the requests and responses the web page is making. In addition to the initial page load network activity, we are also able to monitor all of the asynchronous JavaScript requests that are made by the web page. Without AJAX, we will have to refresh our entire page any time we want to do anything with our OpenLayers map. So, for example, every time you zoom in, OpenLayers makes a series of requests to the map server to get new map images, and the map server's response is a new map image that OpenLayers then displays. This request/response method is handled via AJAX; without it, we would have to refresh the entire page after every request.
See Appendix B, More details on Closure Tools and Code Optimization Techniques, where a small web history and a diagram covers AJAX.
The Network panel allows us to see the URL that is being requested, the GET or POST parameters, the server's status response, the type of resource requested, the size of the response, and the time it took to complete the request. Let's take a look at what the Network panel looks like for the example from the previous official example used when reviewing Elements panel:
Before we talk about the requests being made, take a look at the buttons above the lists of requests—the first one is dedicated to Record Network Log and the second Clear helps you remove the list of network calls. Then, you can activate Filter, which displays a submenu to filter by resources types for example, Documents, Stylesheets, Images, but also by the type of requests such as XHR or WebSockets. The Filter icon also activates a full text search box. The fourth icon is Use small resource rows. The two checkboxes are available, Preserve Log will cause the list of requests to persist, or not get deleted, on page reloads, while Disable cache will not allow you to use cache. For better performances, some assets such as scripts or images can be kept in your browser memory to speed your browsing experience when you visit the same website again. The drawback is when you debug, you can use an outdated file.
Now, let's break down the actual request list.
The request list shows us all the requests the page makes. Each URL in the previous screenshot is a URL that OpenLayers is making a request to. By clicking on each request, we can see more information about the request, including the full request URL and the response. When we are in the Headers sub-tab, we get a Request URL, Request Method, and Status Code, and after we get all details of Request Headers and Response Headers. The Request URL tab gives all the parameters. The Response tab provides us with the server's response to our request:
Take a look again at the list—when we look at the first image in the screenshot, the row has the name 1.png. The method, GET in this case, specifies that the request type is GET, which basically means we are embedding variables inside the URL itself, with optional key=value pairs, separated by an & sign.
When we mouse over a URL, we can see more of it; we see the full URL, which may contain a bunch of variables in the key=value&key=value&.... format. In our case, we only have a full URL like http://c.tile.openstreetmap.org/2/1/1.png when hovering.
As we saw in all OpenStreetMap examples through the book, we didn't need parameters. If you remember in Chapter 1, Getting Started with OpenLayers, we told you that OpenLayers consumes cartographic data; some can come from dynamic web mapping server, others from pregenerated data. Our example relies on pregenerated data so that there are no parameters added contrary, for instance, to a WMS data source.
The Sources panel is very powerful. It enables you to view and edit JavaScript and CSS files loaded from the web page. You are not restricted to only view all the JavaScript code associated with the page in this panel; you can use it to do real-time code debugging. You can set watch expressions, view the stack, set breakpoints, and so on. If these terms are foreign, don't worry, we will review some of them.
For example, we want to quickly talk about enabling Pause on exceptions. With this option enabled, Chrome DevTools will stop the web page whenever a JavaScript error is encountered. This makes it very easy to quickly pinpoint where your page is blowing up at. To enable it, simply click on the Pause on exceptions button icon (be careful, it's not the same as an Pause Script Execution icon).
Keep note of this when you enable it. We've been frustrated more than once when developing because we forgot that it had been enabled. When it is enabled, the button isn't gray, as demonstrated with the icon:
Another tip in this panel, is the ability to unminify JavaScript. It's really useful to track errors. You can open a web page with a compressed JavaScript file. If you click on the icon with open/close brackets called Pretty Print, you will see the difference.
You are maybe wondering why we spoke so much about this panel. When you start to make complex web mapping applications, this panel is the best way to analyze how an application works. When you're developing or reusing an already existing code, you can already guess the behavior of the code, but you can't confirm it. The key feature of the debugger is to make this confirmation. Let's see an example of how you can use it.
Breakpoints help you understand available variables and their values, one at a time in your code, and see when the code is executed. Let's see how.
As we didn't have space to cover such a large topic, we chose to let you discover the basic parts using the official tutorial. So head to it and review it at https://developers.google.com/chrome-developer-tools/docs/javascript-debugging. Now after this review, open the example for Chapter 1, Getting Started with OpenLayers, with Chrome Developer Tools opened with the Sources panel. Change the ol.js reference to ol-debug.js (more readable).
Set breakpoints in the HTML page at var osmLayer, var map, map.addLayer, and map.setView. Check the following steps:
osmLayer, map, map.getLayers(), map.getLayers().getArray() , map.getView() and map.getView().getCenter().var osmLayer.When we began by introducing the library in Chapter 1, Getting Started with OpenLayers, we described every step to create a basic map. With this example, we are able to follow the flow of your code with Chrome Developer Tools. First, all the variables we defined in the Watch Expressions were empty, as seen in the screenshot at step 3.
With the declaration of var osmLayer, the part of figure After var osmLayer... showed us an ol.layer.Tile object was created.
Then, we created a map in the After var map... part. The result is that map variable was assigned an instance of ol.Map. With this ol.Map creation, ol.Collection was created for layers, but there were no layers: map.getlayers().getArray() as a length equal to 0. Moreover, a view was also added in the map but didn't have a center in this step; map.getView() stopped to be empty and was replaced with an ol.View instance.
Then, by adding the layer in the After map.addLayer part, we saw that the map had a layer added: the previous map.getlayers().getArray() was using osmLayer: its length is 1.
At the end, the same process happened for the map view. The Map class with the map.setView method gained the view parameters, and so, map.getView().getCenter() returned an array with coordinates.
This detailed description was a good way to show that we can find how the code works by following the code execution, instead of blindly searching where things happen or only deducing by reading code. When you have enough coding experience, the solution to only follow the code without using a debugger can be better to get a full code overview, but as a beginner, it's not the best solution and you should focus only on small code parts.
We hope with this demonstration, you appreciated discovering one of the main web debuggers features.
After this JavaScript escape, let's return to the CSS topic. Remember we said that we can also edit the CSS content in the Sources panel. Contrary to the Elements panel, we have the option to edit any CSS document associated with the page, not just the style of a selected element. We don't need to not talk much about this panel. We'll give you an accelerated overview for using it in OpenLayers.
What we are customizing are the controls introduced in Chapter 9, Taking Control of Controls. It's time to try it: practicing things on your own will improve your comprehension. For this, we will reuse the OpenStreetMap example from Chapter 1, Getting Started with OpenLayers, and customize the position for zoom buttons and map copyrights.
ol.css file and use the Format button to make it more readable as this file is a .css minified file on one line..ol-zoom class in the ol.css file.left : 0.5em; parameter with right : 0.5em; to make changes to zoom buttons..ol-attribution:not(.ol-collapsed).rgba(255,255,255,0.8);, to rgba(255,0,0,.4);.In the previous example, you played with HTML content. Here, the focus was to cover how you can change the style on the fly. We set the position of the zoom control to the top right and we also changed the background for attribution when you open the attributions collapsible block (credits to maps data and tiles) to red with an opacity change. We encourage you to perform more tests on your own to assimilate the way the panel works.
If you are a web designer working on the code or a web developer requiring to make some designs, we advise you to play a lot with this powerful panel. It can greatly speed up your development time when you master it. If you are always editing CSS in your browser, you should consider looking into the Workspace functionality we've already talked about.
The Chrome DevTools Console panel is where we'll spend most of our time. It acts as a powerful JavaScript command line, or interpreter, which means we can type in JavaScript code and execute it right away—no need to save or edit any files. We can also inspect values when we are stopped at a breakpoint in the Sources panel and want to inspect the context at this time.
Another thing that makes this panel so useful is that we can interact directly with the DOM (Document Object Model)—any HTML element on the web page, including any existing JavaScript code the page contains. So, this means we're able to interact with our OpenLayers map on the fly, issuing command and testing code to instantly see what works and what doesn't. As you can imagine, this saves a ton of time!
You can choose and type in the console on one line or multi-lines. To use multi-lines, type Shift + Enter to return without executing code.
When you need to discover the structure of an object, the Console panel is a very valuable tool, especially when you want to take a peek at JavaScript components. Assuming we are looking at a page that includes OpenLayers, we can quickly see all of OpenLayer's classes, functions, and so on. It is not a replacement for the API docs, but serves as a good, quick way to view such information.
It looks like the screenshot that follows:
With it, you have a classification of all types of resources. You get all resources depending on frames such as the images, CSS, and HTML files. It is a good way to know what your web page loads.
You also can see all persistent storage. Persistent storage are Web SQL, IndexedDB, Local Storage, Session Storage, and Cookies. Although they might not mean much to you, they provide features, not directly related to OpenLayers, can be useful as they are HTML5 features. We invite you to discover their purpose by visiting http://html5demos.com.
With this various storage, you can keep information for customizing users' experiences. For example, you can use them to customize the language for a web application, store the zoom level for a displayed map, and so on.
To complete and end this panel description, the last thing we need to inspect is the Application Cache. It is the most useful function for our book in Chapter 10, OpenLayers Goes Mobile. It helps you inspect the data cached using the MANIFEST file.
These three panels are not really useful for beginners. They target advanced developers mainly for performances purposes:
If you want more information about these panels, visit the official documentation of Chrome DevTools at https://developers.google.com/chrome-developer-tools/.
Each panel serves a certain purpose and all of Google Chrome DevTools' panels are extremely useful, but throughout this book, we will be mainly focusing on the following panels:
These four panels are the ones that we should use the most throughout this book. We can occasionally come back to the other panels, but we don't need to spend a whole lot of time with them. However, before we conclude this chapter, let's get a bit more familiar with the Console panel, since we will need it in most of our chapters.
We talked a bit about what the console panel is—essentially, a JavaScript command line. We can execute any JavaScript code we want, and interact with any page element. There are two primary components to the Console panel—the console log area and the input area.
The console log area will display information about any errors, along with displaying any code that is entered. The input area allows us to either enter a single line of code or multiple lines of code.
Before we start using the console with our maps, let's get familiar with the console by executing some JavaScript code.
We will do some basic JavaScript coding via the Chrome DevTools console; specifically, just calling a built-in the alert() function to display an alert.
alert('Packt publishing loves open source. You want to write? See http://authors.packtpub.com');alert box pop-up with the text 'Packt publishing loves open source. You want to write? See http://authors.packtpub.com' (or whatever string you passed into the alert function). After the code is executed, it will appear in the log above the input line:We've just executed some JavaScript code without having to edit and save any files. Although we did a simple alert, we are really not limited by what we can do. Anything that we can save in a JavaScript file, we can also enter in the Console.
You'll also notice that the same code that we typed in appeared in the log area. We'll also get an error message if any errors occur in the code—go ahead and try it! Instead of typing alert('My alert'); type something like fakealert('Boom');. This will give you a reference error, since nowhere is the fakealert()function defined —alert(); on the contrary, it is a built-in function, so we can call it from any page.
That's pretty much all there is to it! The rest just builds on these principles. Let's go ahead and do just one more thing, something that is slightly more involved, before jumping into manipulating an OpenLayers page.
We will introduce object literals and get acclimated with how to manipulate them now, so that we can better work with the OpenLayers code:
var my_parameters = {zoom: false, attribution: false, otherControl: 'myslider'};
console.log(my_parameters);{zoom: false, attribution: false; otherControl: 'mySlider'}. In this case, the object is not complex but when the object is more complex, you will see an arrow before the object, and if you click on it, it will show all the information about the object you just created.console.log(my_parameters.otherControl);
We just created what is called in JavaScript an anonymous object, or object literal. We previously discussed that objects are created from classes, in Appendix A, Object-oriented Programming – Introduction and Concepts and in JavaScript, we need to use the new keyword to instantiate an object from a function. However, here, you can see that there is no new keyword!
The key concept here is that we are just creating a single object that does not derive from a class. Since object literals (anonymous objects) do not derive from a class, it is, essentially, an empty object. It contains only what we explicitly defined. The value associated with a key can be almost anything—a string, integer, function, array, or even another object literal.
We encountered object literals in Chapter 1, Getting Started with OpenLayers —they were the {key:value} pairs used to define the parameters and options of our layer and objects. The only difference is that we did not assign a variable to them; we simply passed them in when we created our layer object.
Object literals are extremely useful for a variety of tasks, and it is a great way to package information in an easy-to-use form. They are in the form of {key:value, key2:value2}. We can access any property of an object literal by using dot notation, in the form of my_object_literal.key. The key, like before, is the key part of the key:value pair. In the preceding code, we call console.log(my_parameters.otherControl); and the value of the key opacity is displayed in the console's log area. You will also encounter an alternative notation and brackets notation, to retrieve the same information. This form is quite useful because you can concatenate values keys in your object.
Using console.log(my_parameters['other' + 'Cont' + 'rol']); will do the same as the previous console.log call. It allows to loop on objects with a key that can change whereas the dot notation does not allow this.
console.log(): The Chrome DevTools function console.log() is a function that will, essentially, display what you pass into it in the console log. You can pass in variables, strings, objects, anything, and it will display in the log. It comes in handy often, so getting familiar with it is a good idea.
We use object literals frequently when making our maps—so if they don't make much sense yet, don't worry. The basic idea to grasp, and the primary way we will use them, is that they are essentially key:value pairs. Before we end this chapter, let's do a quick example where we interact with an OpenLayers map using the Console panel.
We'll use the map we created in Chapter 1, Getting Started with OpenLayers, to do this example, interacting with our OpenLayers map by calling various functions of the map.
../assets/ol3/js/ol.js to ../assets/ol3/js/ol-debug.js and open the file in Chrome. Enable Chrome DevTools and go to the Console panel. If you like, you can take a look at the Network panel and view the network activity to see the requests your page is making.console.log(map);
Take note of the function names, as we'll be using them.
map.getView().setCenter([0, 0]); map.getView().calculateExtent(map.getSize());
map.getView().setResolution(2000); map.getView().calculateExtent(map.getSize())
console.log(map.getSize()); console.log(map.getViewport());
console.log(map); then clicking on the output in the log area). Try playing around with different functions and attributes the map object has. To access the functions, you just need to type in map.function();.map.key, where key would be something like keyHandler_ (so the full code would be map.keyHandler_). Be aware that values with underscore at the end are private when using the compressed ol.js file (it's a naming convention in the library code).We just executed some functions of our map and accessed some properties of it. All we have to do is call our object, map, followed by a period, then a function or property it owns. Using this dot notation (for example, map.getSize();), we can access any property or function of the map object.
We also saw how the Console panel comes in handy, and took a look at functions that we can call, which the map object owns. Any function listed there can be called via map.functionname();, but some functions require parameters to be passed in or they will not work. However, where can we go to figure out more information about the functions and what they require?
Try to call different functions that you see listed in the Console tab when typing in the window. Many functions will not work unless you pass certain arguments into them, but don't be afraid of errors! Poke around the various functions and properties and try to interact with them using the Console tab like in the preceding example.
The API documentation for the Map class, which our map object derives from (and thus, inherits all the functions and properties of the class) provides more detailed explanations of the properties, functions, and what we can do with them. They can be found at http://openlayers.org/en/v3.0.0/apidoc/. Even though Chrome DevTools is a great resource to quickly interact with code and learn from it, the API docs present an extra level of information that Chrome DevTools cannot necessarily provide. Do not hesitate to visit them at http://openlayers.org/en/v3.0.0/examples/.
Chrome DevTools is evolving rapidly and many new capabilities are being added all the time. Make sure you read the official documentation at https://developer.chrome.com/devtools/index and check back periodically to see what's new.
Although it's more related to programming than web mapping, it's recommended to increase your abilities at using web debuggers.
Chrome DevTools by default offers the main functions to develop and debug with OpenLayers, but to be more efficient, it's really required to use extensions. Extensions are additions to Chrome browser or to the Developer Tools to add or augment default software functions. You can find most of them at http://www.google.com/intl/en/chrome/webstore/extensions.html.
We'll review some of them.
Usually you're consuming web services providing JSON (JavaScript Object Notation) when you're doing mashups. To illustrate why the add-on is useful, we will use a geocoder service, such as Nominatim, to retrieve position for a postal code. A geocoder is a tool to match addresses with geographic coordinates.
For example, typing http://nominatim.openstreetmap.org/search?q=35+Livery+Street+Birmingham&format=json&limit=1 in Chrome will send you the following screenshot:
With the extension, you will directly get an indented content, collapsible.
So what is the difference? When it's required to correctly reuse data, we must understand received data and with this plugin, the return content is human readable! Furthermore, OpenLayers can consume GeoJSON, a subset JSON notation dedicated to maps data.
Download it at https://chrome.google.com/webstore/detail/jsonview/chklaanhfefbnpoihckbnefhakgolnmc.
When you are making a custom UI, you always have to try different colors.
You can also retrieve a color you like from another website or an image. In this situation, you will not want to always go back and forth between a graphic tool such as Gimp or Photoshop and your browser. So in this case, you can install ColorZilla. How is this related to OpenLayers? When you want to make customize controls elements, this is an invaluable tool. Go to http://www.colorzilla.com/chrome/ to retrieve it. It's also a plugin available for Firefox.
If you really want to improve your skills for using Chrome Developer Tools, you should visit Code School tutorial at https://www.codeschool.com/courses/discover-devtools. Use also the videos available in the official documentation at https://developers.google.com/chrome-developer-tools/docs/videos.
Visit the Secrets of the Browser Developer Tools website, http://devtoolsecrets.com. It covers all browsers!
During all this chapter, we introduced you to Chrome DevTools. It's one of the most powerful tools for debugging JavaScript applications, but it is important to see the reality of the web market. Just look on this graphic below from StatCounter GlobalStats, http://gs.statcounter.com, that provide statistics from more than 3 million websites.
As you see, there exists more than one web browser, and Internet Explorer with Firefox together represents a bit less than 50 percent of the market. It means that your web mapping application must be compliant to those other browsers. Moreover, you have to deal with different versions for the same browser family.
Although OpenLayers itself works really well with all browsers, your own code will not always do it.
Because of this, we'll review some tools to debug in Internet Explorer and Mozilla Firefox. We will describe equivalence between Chrome DevTools panels and browsers-specific debuggers.
Before Internet Explorer 8, there wasn't any debugger built-in. The previous version of OpenLayers library (the 2.x series) was covering old IE versions such as IE 6, 7. OpenLayers 3 supports IE 9+.
Although the IE debugger is considered less powerful than other browsers debuggers, it is valuable tool in particular because of the step-by-step debug.
The following screenshot of IE 9 debugger shows that most panels are similar to Chrome Developer Tools:
The HTML panel is like the Elements panel, and the CSS and Scripts panels do the same job that the Sources panel in Chrome DevTools does.
The Console and Network panels are quite similar to the ones in Chrome Developer Tools.
In addition, for better performance, for example, to evaluate and improve your JavaScript execution time, a profiler can be found in the Profiles panel but doesn't provide as much functions as its Chrome equivalent.
With IE, each version of the browser debugger gains panels. So, it would be better to review versions differences using the official Microsoft developer website at http://msdn.microsoft.com/en-us/library/ie/.
Like for IE, this part will be dedicated to describe equivalence between Chrome DevTools and Firebug, an extension to Firefox. Although Mozilla Firefox has a built-in debugger included nowadays, Firebug remains the best tool on Mozilla to debug web maps and sites at the time of this writing.
We advise that you install it by visiting the official site at https://getfirebug.com/.
Now, it's time to make the comparison again.
In this case, the Console panel with the DOM panel in Firebug provides the same functionality that Chrome Developer Tools Console panel gives.
The HTML panel is equivalent to the Elements panel.
The CSS and Script panels combined together give you Sources panel functions.
The Timeline, Profiles, and Audits panels are specific to Chrome Developer Tools.
Most of the extensions for Firebug are listed at https://getfirebug.com/wiki/index.php/Firebug_Extensions.
Those extensions help to close the gap between default Chrome Developer and Firefox with only FireBug.
You can also find Mozilla Firefox add-on that do not always depend on FireBug. The official place to get them is https://addons.mozilla.org.
If you need one extension, you will have to install Acebug: https://addons.mozilla.org/en-us/firefox/addon/acebug/.
When you are learning and in particular doing JavaSript test directly in the browser, it behaves like an advanced text editor. Its main goal is to bring new features to Firebug's multi-lines command.
This add-on does the following:
Moreover, the Resources panel that you get with AceBug in Firebug combined with Cookies panel provides similar experience to the Resources panel in Chrome DevTools.
More and more efforts have been done on the built-in Firefox Developers Tools, it starts widening the gap with Firebug debugging functions. Sometimes, it exposes more advanced capabilities than Firebug. You can take a look at it main dedicated page at https://developer.mozilla.org/en-US/docs/Tools.
Learning process goes through repetitions. So, go back to the previous Console panel examples of the chapter and retry them in Mozilla Firefox. Take your time to see differences with Chrome Developer Tools behaviors. After those tests, go to your first OpenLayers example and type ol in the Console panel and click on it to browse like if you were in the Chrome Developer Tools Console tab. We also recommend that you play with autocompletion. Don't hesitate to experiment until you feel confident.
Q1. What panel(s) will you use if you wanted to execute JavaScript code?
Q2. You want to make some changes in CSS styles; what panel(s) can be used?
Q3. Using the sample from Chapter 1, Getting Started with OpenLayers, when you inspect the map object with console.log, what methods are available?
map.getView().map.getLayers().map.getLayer().map.getInteraction().In this appendix, we learned more about how OpenLayers works but before anything, we learned more on how to use Chrome DevTools.
We then took a look at the panels that Chrome DevTools provides and what they are used for. Afterwards, we spent time with the Console panel—something you'll be making extensive use of throughout this book (and when you're developing your own web maps). Then, we reviewed how to improve default Chrome DevTools. Finally, we covered basically main other web debuggers with cross-browsers support in mind.
This appendix aimed to provide some fundamental knowledge of web development tools for getting into both OpenLayers and general web development. Web development tools, such as Chrome DevTools, are one of the biggest assets in our toolkit. They speed up development time, help us identify bugs, interact with our code better, and much more.
Copyright © 2015 Packt Publishing
All rights reserved. No part of this book may be reproduced, stored in a retrieval system, or transmitted in any form or by any means, without the prior written permission of the publisher, except in the case of brief quotations embedded in critical articles or reviews.
Every effort has been made in the preparation of this book to ensure the accuracy of the information presented. However, the information contained in this book is sold without warranty, either express or implied. Neither the authors, nor Packt Publishing, and its dealers and distributors will be held liable for any damages caused or alleged to be caused directly or indirectly by this book.
Packt Publishing has endeavored to provide trademark information about all of the companies and products mentioned in this book by the appropriate use of capitals. However, Packt Publishing cannot guarantee the accuracy of this information.
First published: March 2011
Second published: January 2015
Production reference: 1210115
Published by Packt Publishing Ltd.
Livery Place
35 Livery Street
Birmingham B3 2PB, UK.
ISBN 978-1-78216-236-0
Authors
Thomas Gratier
Paul Spencer
Erik Hazzard
Reviewers
Jorge Arévalo
Gagan Bansal
Christopher Jennison
Arnaud Vandecasteele
Commissioning Editor
Usha Iyer
Acquisition Editors
Usha Iyer
Sam Wood
Content Development Editor
Sweny Sukumaran
Technical Editor
Parag Topre
Copy Editors
Sarang Chari
Janbal Dharmaraj
Neha Karnani
Project Coordinator
Rashi Khivansara
Proofreaders
Ting Baker
Paul Hindle
Linda Morris
Indexer
Mariammal Chettiyar
Graphics
Valentina D'silva
Disha Haria
Abhinash Sahu
Production Coordinator
Nilesh R. Mohite
Cover Work
Nilesh R. Mohite
Thomas Gratier is a GIS consultant living in Nantes, France, who mainly specializes in web development. He has an MSc degree in geography and urban planning from The Institute Of Alpine Geography of The University of Grenoble. Career-wise, he decided to steer towards more technical work but kept his geospatial passion in mind. He's gained 8 years of geospatial and programming experience, working for public authorities on water and flood risk prevention and management, various private urban consultancies in urban planning and web mapping solutions, and, multinational company CapGemini's GIS Division. He's continued building a stronger knowledge in IT technologies, open source and open data, and both web and geo standards. He does his development work with JavaScript, Pythons and PHP. His favorite libraries and tools for working are GDAL/OGR, PostGIS, QGIS, and OpenLayers, but he also enjoys using OpenStreetMap-related libraries, such as Mapnik or Osm2pgsql. He is an open source advocate, a Charter Member of The Open Source Geospatial Foundation (http://www.osgeo.org)(OSGeo). He gets involved in writing French translations for open source geospatial projects, such as MapServer and Zoo Project. With like-minded professionals, he contributes to weekly geospatial news updates at Geotribu (http://geotribu.net). He currently works as a freelance GIS consultant, providing development, consulting, and training services. More information can be found on his website at Web Geo Data Vore (http://webgeodatavore.com).
Paul Spencer is a software engineer who has worked in the field of open source geospatial software for more than 15 years. He is a strong advocate of open source development and champions its use whenever possible. Paul has architected several successful open source projects and been actively involved in many more. Paul was involved in the early design and development of OpenLayers and continues to be involved as the project evolves. Paul joined DM Solutions Group (DMSG) in 1998, bringing with him advanced software development skills and a strong understanding of the software-development process. In his time with the company, Paul has taken on a leadership role as the CTO and primary architect for DM Solutions Group's web mapping technologies and commercial solutions. Prior to joining DMSG, Paul worked for the Canadian Military, after achieving his master's degree in software engineering from The Royal Military College of Canada.
Erik Hazzard is the author of OpenLayers 2.10 Beginner's Guide, Packt Publishing. He has worked as the lead developer for a GIS-based company, has done contracting work with the design studio, Stamen, and has co-founded two start-ups. Erik is passionate about mapping, game development, and data visualization. In his free time, he enjoys writing and teaching, and can be found at http://vasir.net.
Jorge Arévalo is a computer engineer from Universidad Autónoma de Madrid, UAM. He started developing web applications with JavaScript, PHP, and Python. In 2010, he began working with PostGIS and GDAL projects, after participating in GSoC 2009, creating the PostGIS Raster GDAL driver. He also writes a blog on GIS at http://www.libregis.org. Jorge Arévalo has co-written the book, Zurb Foundation 4 Starter, Packt Publishing. He has also worked as a reviewer for the books, PostGIS 2.0 Cookbook, OpenLayers Beginner's Guide (2nd edition), Memcached, Speed Up your Web Application, and QGIS Cookbook, all by Packt Publishing.
Gagan Bansal has done B.Tech in Civil Engineering and then pursued M.Tech in Remote Sensing. He is experienced in maps application development, geospatial database design, and large-scale mapping using satellite data and aerial photographs. He is also experienced in understanding various market problems and deriving a feasible GIS solution using open source software and database. Currently, he is working with Rediff.com as a maps architect and engaged in developing applications for visualization and overlay of news, socioeconomic data, and business data on maps.
Christopher Jennison is an application developer working in Western Massachusetts with experience in GIS application development and mobile platform development. He has worked in web advertising, mobile advertising and application development, and data science and mapping applications. He has worked for HitPoint Studios, as a brand game developer, and The United States Geological Survey, as well as his own private contracts.
Arnaud Vandecasteele is a map lover and an open source / open data evangelist. After his PhD in computer science and GIS, he decided to move to Canada to conduct research on OpenStreetMap and to promote the use of Open Source GIS software. His experience with OpenLayers started from the very beginning of the library in 2006. From his website (http://geotribu.net), he wrote several tutorials to help beginners to use OpenLayers. Currently, Arnaud runs a GIS consultancy firm called Mapali (http://mapali.re/) that creates online mapping applications and provides consultancy services in the fields of web cartography and online GIS using open source software to a wide range of clients in the Indian Ocean (Réunion island, Mauritius).
For support files and downloads related to your book, please visit www.PacktPub.com.
Did you know that Packt offers eBook versions of every book published, with PDF and ePub files available? You can upgrade to the eBook version at www.PacktPub.com and as a print book customer, you are entitled to a discount on the eBook copy. Get in touch with us at <service@packtpub.com> for more details.
At www.PacktPub.com, you can also read a collection of free technical articles, sign up for a range of free newsletters and receive exclusive discounts and offers on Packt books and eBooks.
https://www2.packtpub.com/books/subscription/packtlib
Do you need instant solutions to your IT questions? PacktLib is Packt's online digital book library. Here, you can search, access, and read Packt's entire library of books.
If you have an account with Packt at www.PacktPub.com, you can use this to access PacktLib today and view 9 entirely free books. Simply use your login credentials for immediate access.
Web mapping is the process of designing, implementing, generating, and delivering maps on the Web and its products. OpenLayers is a powerful, community-driven, open source, pure JavaScript web mapping library. With this, you can easily create your own web map mashup using a myriad of map backends. Interested in knowing more about OpenLayers?
This book is going to help you learn OpenLayers from scratch. OpenLayers 3 Beginner's Guide will walk you through the OpenLayers library in the easiest and most efficient way possible. The core components of OpenLayers are covered in detail, with examples, structured so that you can easily refer back to them later.
The book starts off by showing you how to create a simple map and introduces you to some basic JavaScript programming concepts and tools. You will also find useful resources to learn more about HTML and CSS. Through the course of this book, we will review each component needed to make a map in OpenLayers 3, and you will end with a full-fledged web map application.
You will learn some context to help you understand the key role of each OpenLayers 3 component in making a map. You will also learn important mapping principles such as projections and layers. Maps require sources of data as well; so, you will see how to create your own data files and connect to backend servers for mapping. A key part of this book will also be dedicated to building a mapping application for mobile devices and its specific components.
With OpenLayers 3 Beginner's Guide, you will learn how to create your own map applications independently, without being stuck at the first stage of learning. You will acquire the information you need to develop your skills and knowledge of the OpenLayers 3 library.
Chapter 1, Getting Started with OpenLayers will introduce you to OpenLayers 3 and will help you to learn some basic mapping principles. You will see how to get ready for development in OpenLayers and create your first map.
Chapter 2, Key Concepts in OpenLayers will introduce the main components of the OpenLayers library and illustrate how they are related. We will introduce some key concepts, including events and observable properties, and learn some basic debugging techniques.
Chapter 3, Charting the Map Class will describe two of the core components, the Map and View classes, in detail. We will learn about the properties, methods, and events of both classes and apply them in practical examples.
Chapter 4, Interacting with Raster Data Source will introduce the concept of layers and focus on raster layers. We will explain the difference between tiled and untiled layers and learn how to use OpenLayers to visualize any type of image, even non-geospatial ones.
Chapter 5, Using Vector Layers will introduce vector layers and the related source, format, feature, and geometry classes. We will learn the properties, methods, and events associated with each, and how to use them to load a variety of vector data into an OpenLayers map.
Chapter 6, Styling Vector Layers will expand on our knowledge of vector layers by learning how to apply both static and dynamic styles to them. Through hands-on examples, we'll learn how to modify styles interactively in response to user interaction.
Chapter 7, Wrapping Our Heads Around Projections will cover the basic concepts behind map projections and their characteristics. We will cover projection support within OpenLayers by introducing the Proj4js library and applying it to map, vector, and raster layers.
Chapter 8, Interacting with Your Map will dive into the concept of interactions and introduce the default interactions. After covering the available interactions in detail, we will finish with an example showing how to use interactions to draw a rectangle.
Chapter 9, Taking Control of Controls will demonstrate the use of controls and introduce the default controls provided by OpenLayers. We will also review each of the controls in more detail and learn how to make a custom control.
Chapter 10, OpenLayers Goes Mobile will teach us to take advantage of mobile-specific features such as Geolocation and Device Orientation. We will also learn how to debug mobile web applications and look at some mobile-specific browser features that can be useful for geospatial applications.
Chapter 11, Creating Web Map Apps will build a complete application from scratch and learn how to use the OpenLayers build system to create a production-ready application from our code.
Appendix A, Object-oriented Programming – Introduction and Concepts covers the main concepts of Object-oriented Programming (OOP). After, we will discover how to reuse them exploring the OpenLayers API documentation with OOP in mind.
Appendix B, More details on Closure Tools and Code Optimization Techniques will cover more details on Closure Tools and code optimization techniques. This appendix introduces Closure Tools, a set of tools that OpenLayers 3 library relies on. It provides an understanding on how to use the Closure Library and Closure Compiler with a focus on compressing OpenLayers code files. We will finish with a review of styles and syntax for good coding practices.
Appendix C, Squashing Bugs with Web Debuggers provides JavaScript beginners with an in-depth review of browser developer tools. We will review Chrome Developer Tools, additional extensions and finish with debugging tools in other browsers such as IE and Firefox.
The main thing you'll need for this book is a computer and text editor. Your operating system will come with a text editor, any will do, but you will likely find that a text editor focused on developer needs will be most useful. There are many excellent developer-oriented text editors available for various operating systems, see https://github.com/showcases/text-editors and https://en.wikipedia.org/wiki/List_of_text_editors for some options. An Internet connection will be required to view the maps, and you'll also need a recent version of a modern web browser, such as Firefox, Google Chrome, Safari, Opera, or Internet Explorer (version 9 or higher).
For some advanced uses cases, you will also need Python, NodeJS, Java, and Git (a source code control management software). Installation instructions are provided for these additional tools.
No knowledge of Geographic Information Systems (GIS) is required, nor is extensive JavaScript experience. A basic understanding of JavaScript syntax and HTML/CSS will greatly aid in understanding the material, but is not required.
This book is for anyone who has an interest in using maps on their website, from hobbyists to professional web developers. OpenLayers provides a powerful, but easy-to-use, pure JavaScript and HTML (no third-party plug-ins involved) toolkit to quickly make cross-browser web maps. A basic understanding of JavaScript will be helpful, but there is no prior knowledge required to use this book. If you've never worked with maps before, this book will introduce you to some common mapping topics and gently guide you through the OpenLayers 3 library. If you're an experienced application developer, this book will also serve as a reference to the core components of OpenLayers 3.
Instructions often need some extra explanation to ensure they make sense, so they are followed with these sections:
This section explains the working of the tasks or instructions that you have just completed.
You will also find some other learning aids in the book, for example:
These are short multiple-choice questions intended to help you test your own understanding.
In this book, you will find a number of styles of text that distinguish between different kinds of information. Here are some examples of these styles, and an explanation of their meaning.
Code words in text, folder names, filenames, file extensions, pathnames, URLs, and user input are shown as follows: "You can name the folder whatever you like, but we'll refer to it as the sandbox folder."
A block of code is set as follows:
var map = new ol.Map({
target: 'map',
layers: [layer],
view: view
});When we wish to draw your attention to a particular part of a code block, the relevant lines or items are set in bold:
var map = new ol.Map({
target: 'map',
view: view,
layers: [layer],
renderer: 'dom'
});Any command-line input or output is written as follows:
weinre –boundHost <your ip address>
New terms and important words are shown in bold. Words that you see on the screen, in menus or dialog boxes for example, appear in the text like this: "You can do this in several ways but the easiest is to load your page into a web browser and look at the Network tab".
Feedback from our readers is always welcome. Let us know what you think about this book—what you liked or may have disliked. Reader feedback is important for us to develop titles that you really get the most out of.
To send us general feedback, simply send an e-mail to <feedback@packtpub.com>, and mention the book title via the subject of your message.
If there is a topic that you have expertise in and you are interested in either writing or contributing to a book, see our author guide on www.packtpub.com/authors.
Now that you are the proud owner of a Packt book, we have a number of things to help you to get the most from your purchase.
You can download the example code files for all Packt books you have purchased from your account at http://www.packtpub.com. If you purchased this book elsewhere, you can visit http://www.packtpub.com/support and register to have the files e-mailed directly to you.
We also provide you a PDF file that has color images of the screenshots/diagrams used in this book. The color images will help you better understand the changes in the output. You can download this file from: http://www.packtpub.com/sites/default/files/downloads/B02497_ColorImages.pdf
Although we have taken every care to ensure the accuracy of our content, mistakes do happen. If you find a mistake in one of our books—maybe a mistake in the text or the code—we would be grateful if you would report this to us. By doing so, you can save other readers from frustration and help us improve subsequent versions of this book. If you find any errata, please report them by visiting http://www.packtpub.com/submit-errata, selecting your book, clicking on the errata submission form link, and entering the details of your errata. Once your errata are verified, your submission will be accepted and the errata will be uploaded on our website, or added to any list of existing errata, under the Errata section of that title. Any existing errata can be viewed by selecting your title from http://www.packtpub.com/support.
Piracy of copyright material on the Internet is an ongoing problem across all media. At Packt, we take the protection of our copyright and licenses very seriously. If you come across any illegal copies of our works, in any form, on the Internet, please provide us with the location address or website name immediately so that we can pursue a remedy.
Please contact us at <copyright@packtpub.com> with a link to the suspected pirated material.
We appreciate your help in protecting our authors, and our ability to bring you valuable content.
You can contact us at <questions@packtpub.com> if you are having a problem with any aspect of the book, and we will do our best to address it.
Within the past few years, the popularity of interactive web maps has exploded. In the past, creating interactive maps was reserved for large companies or experts with lots of money. But now, with the advent of free services such as Google and Bing Maps, online mapping is easily accessible to everyone. Today, with the right tools, anyone can easily create a web map with little or even no knowledge of geography, cartography, or programming.
Web maps are expected to be fast, accurate, and easy to use. Since they are online, they are expected to be accessible from anywhere on nearly any platform. There are only a few tools that fulfill all these expectations. OpenLayers is one such tool. It's free, open source, and very powerful. Providing both novice developers and seasoned GIS professionals with a robust library, OpenLayers makes it easy to create modern, fast, and interactive web-mapping applications for desktop and mobile.
In this chapter, we will:
OpenLayers is an open source, client-side JavaScript library for making interactive web maps, viewable in nearly any web browser. Since it is a client-side library, it requires no special server-side software or settings—you can use it without even downloading anything! Originally developed by MetaCarta as a response, in part, to Google Maps, the 2.x series of the library has grown into a mature, popular framework with many passionate developers and a very helpful community. At the time of writing, this version is still actively used and maintained, but this book will focus on the latest version, which is 3.0. For people wishing to switch to OpenLayers 3, particularly people already using the OpenLayers 2 series, the main reasons to change are:
You can also add the fact that the library is already used in production, that demonstrates good performance at the Swiss federal geoportal, http://map.geo.admin.ch (see screenshot for reference ) and the OpenGeo Suite, a commercial open source based solution which already bundles the library:
OpenLayers makes creating powerful web mapping applications easy and fun. It is very simple to use—you don't even need to be a programmer to make a great map with it. It's open source, free, and has a strong community behind it. A big advantage of OpenLayers is that you can integrate it into any closed or open source application because it is released under the BSD 2-Clause license. So, if you want to dig into the internal code, or even improve it, you're encouraged to do so. Cross browser compatibility is handled for you by the Google Closure Library— but you need to have IE9+ because VML rendering (specific to IE8 and older versions) is no longer supported. Furthermore, OpenLayers 3.0 supports modern mobile, touch devices making it easy to develop for mobile technology.
OpenLayers is not tied to any proprietary technology or company, so you don't have to worry much about your application breaking with third party code (unless you break it). Although it's open source, you will get good support from the community and there are commercial support options as well. The library is recognized as well —established by the OSGeo (Open Source Geospatial Foundation), having passed through the OSGeo Incubation process, a kind of open source quality mark for geospatial projects.
You can read further about OSGeo Incubation at http://wiki.osgeo.org/wiki/Incubation_Committee
OpenLayers allows you to build entire mapping applications from the ground up, with the ability to customize every aspect of your map—layers, controls, events, and so on. You can use a multitude of different map server backends together, including a powerful vector layer. It makes creating map mashups extremely easy.
We said OpenLayers is a client-side JavaScript library, but what does this mean? The following context answers this question.
When we say client-side, we are referring to the user's computer, specifically their web browser. The only thing you need to make OpenLayers work is the OpenLayers code itself and a web browser. You can either download it and use it on your computer locally, or download nothing and simply link to the JavaScript file served on the site that hosts the OpenLayers project (http://openlayers.org). OpenLayers works on nearly all modern web browsers and can be served by any web server or your own computer. Using a modern, standard based browser such as Firefox, Google Chrome, Safari, or Opera is recommended.
When we say library, we mean that OpenLayers is a map engine that provides an API (Application Program Interface) that can be used to develop your own web maps. Instead of building a mapping application from scratch, you can use OpenLayers for the mapping part, which is maintained and developed by a bunch of brilliant people.
For example, if you'd want to write a blog, you could either write your own blog engine, or use an existing one such as WordPress or Drupal and build on top of it. Similarly, if you'd want to create a web map, you could either write your own from scratch, or use software that has been developed and tested by a group of developers with a strong community behind it.
By choosing to use OpenLayers, you do have to learn how to use the library (or else you wouldn't be reading this book), but the benefits greatly outweigh the costs. You get to use a rich, highly tested, and maintained code base, and all you have to do is learn how to use it. Hopefully, this book will help you with it.
OpenLayers is written in JavaScript, but don't fret if you don't know it very well. All you really need is some knowledge of the basic syntax, and we'll try to keep things as clear as possible in the code examples.
If you are unfamiliar with JavaScript, Mozilla provides phenomenal JavaScript documentation at https://developer.mozilla.org/en/javascript. We should also visit Eloquent JavaScript at http://eloquentjavascript.net, an online book to get started with the JavaScript language We recommend you also do some interactive exercises at Codecademy, http://codecademy.com, a website dedicated to learn JavaScript programming basics and much more.
First off, what is a web-mapping application? To put it bluntly, it's some type of Internet application that makes use of a map. This could be a site that displays the latest geo-tagged images from Flickr (we'll do this in Chapter 11, Creating Web Map Apps), a map that shows markers of locations you've traveled to, or an application that tracks invasive plant species and displays them. If it contains a map and it does something, you could argue that it is a web map application. The term can be used in a pretty broad sense.
So, where exactly does OpenLayers fit in? We know OpenLayers is a client-side mapping library, but what does that mean? Let's take a look at the following figure:
This is called the client/server model and it is, essentially, the core of how all web applications operate. In the case of a web map application, some sort of map client (for example: OpenLayers) communicates with some sort of web map server (for example: a map server using the WMS (Web Map Service) standard, an OpenStreetMap backend, or some satellite images). We've added a bit of complexity in it because the truth is that you can also rely only on client-side for web mapping applications using static content that you have pre-generated. To illustrate, you can use GeoJSON files, a JSON based format to display pins. For example, it is very useful for mobile content.
OpenLayers lives on the client-side. One of the primary tasks the client performs is to get map images from a map server. Essentially, the client asks a map server for what you want to look at. Every time you navigate or zoom around on the map, the client has to make new requests to the server—because you're asking to look at something different.
OpenLayers handles this all for you, and it is happening via AJAX (asynchronous JavaScript + XML) calls to a map server. Refer to http://en.wikipedia.org/wiki/Ajax_(programming) for further information on AJAX. To reiterate—the basic concept is that OpenLayers sends requests to a map server for map data every time you interact with the map, then OpenLayers pieces together all the returned map data (which might be images or vector data) so it looks like one big, seamless map. In Chapter 2, Key Concepts in OpenLayers, we'll cover this concept in more depth.
A map server (or map service) provides the map itself. There are a myriad of different map server backends. The examples include:
If you are unfamiliar with these terms, don't sweat it. The basic principle behind all these services is that they allow you to specify the area of the map you want to look at (by sending a request), and then the map servers send back a response containing the map image. With OpenLayers, you can choose to use as many different backends in any sort of combination as you'd like.
OpenLayers is not a web map server; it only consumes data from them. So, you will need access to some type of WMS. Don't worry about it though. Fortunately, there are a myriad of free and/or open source web map servers available that are remotely hosted or easy to set up yourself, such as MapServer. We speak a lot about web map servers but you must be aware that depending on your web-mapping application, you can use geographic data files to provide the needed data consumed by OpenLayers.
Throughout this book, we'll often use a freely available web-mapping service from http://www.openstreetmap.org/, so don't worry now about having to provide your own.
With many web map servers, you do not have to do anything to use them—just supplying a URL to them in OpenLayers is enough. OSGeo, OpenStreetMap, Google, Here Maps, and Bing Maps, for instance, provide access to their map servers (although some commercial restrictions may apply with various services in some situations).
The Google, Yahoo!, Bing, and ESRI's Mapping APIs allow you to connect with their map server backend. Their APIs also usually provide a client-side interface.
The Google Maps API, for instance, is fairly powerful. You have the ability to add markers, plot routes, and use KML data (things you can also do in OpenLayers)—but the main drawback is that your mapping application relies totally on Google. The map client and map server are provided by a third party. This is not inherently a bad thing, and for many projects, Google Maps and the others like it, are a good fit.
However, there are quite a few drawbacks such as:
Although we mentioned Google Maps API as one of the main maps, its support in OpenLayers is limited. As there are more tiles providers nowadays, it's not worth it to have code maintenance to support Google Maps API, a third party code that can break the main library, as sometimes happened earlier with the OpenLayers 2 API.
So, what's with the layers in OpenLayers? Well, OpenLayers allows you to have multiple different backend servers that your map can use. To access a web map server, you declare a layer and add it to your map with OpenLayers.
For instance, if you wanted to have a Bing Maps and an OpenStreetMap service displayed on your map, you would use OpenLayers to create a layer referencing Bing Maps and another one for OpenStreetMap, and then add them to your OpenLayers map. We'll soon see an example with an OpenStreetMap layer, so don't worry if you're a little confused.
Like layers of an onion, each layer is above and will cover up the previous one; the order that you add in the layers is important. With OpenLayers, you can arbitrarily set the overall transparency of any layer, so you are easily able to control how many layers cover each other up, and dynamically change the layer order at any time.
Most of the time, you make a distinction between base layers and non-base layers. Base layers are layers below the others and are used as a background on your maps to give general context. When you choose one base layer, the others will not be shown. On the top of base layers, you have non-base layers used to emphasize particular topics. You can also choose to use only overlay layers if you're considering that they are enough to understand the map. As a classical example, you could have a Bing map as your base layer, a layer with satellite imagery that is semi-transparent, and a vector layer, all active on your map at once. A vector layer is a powerful layer that allows for the addition of markers and various geometric objects to our maps—we'll cover it in Chapter 5, Using Vector Layers. Thus, in this example, your map would have three separate layers. We'll study in detail about layers and how to use and combine them in Chapter 4, Interacting with Raster Data Source.
The website for OpenLayers 3 is located at http://openlayers.org. Have a look at the following screenshot:
To begin, you need to download a copy of OpenLayers (or we can directly link to the library—but we'll download a local copy). You can download the compressed library as a .zip by clicking on the green button at the bottom of the release page at https://github.com/openlayers/ol3/releases/tag/v3.0.0.
We will cover the website links by following the different areas of the main web page. Let's start with the navigation bar located at the top right area:
Be aware that currently both versions of OpenLayers exist
Let's download the OpenLayers library. After you're done, you should have the OpenLayers library files set up on your computer. Perform the following steps:
v3.0.0.zip version of the OpenLayers v3.0.0. It's the green button on the bottom left of the Github release page for v3.0.0.v3.0.0 (or whatever your version is).v3.0.0 folder. Once inside, you'll see a lot of folders, but the ones we are concerned with right now are the folders named build and css, as seen in the following screenshot:ol3 folder within an assets folder contained within a new folder ol3_samples in your home directory (or C:\ on Windows). Copy the previous build folder from v3.0.0 and rename it as js into the new ol3 directory and also copy the css folder into the same ol3 folder.sandbox into the ol3_samples directory. You can name the folder whatever you like, but we'll refer to it as the sandbox folder. Your new folder structure should look similar to the following screenshot:We just installed OpenLayers 3 by copying over different pre-built, compressed JavaScript files containing the entire OpenLayers 3 library code (from the build directory) and the associated assets (style sheets). To use OpenLayers, you'll need at a minimum, the ol.js file (the other .js files will be needed during the book but are not always required) and the ol.css file. For best practice, we already gave you some tips to structure the code like separate assets, such as css and js, or separate library code from your own code.
If you open the ol.js file, you'll notice it is nearly unreadable. This is because this is a minified and obfuscated version, which basically means extra white space and unnecessary characters have been stripped out to cut down on the file size and some variables have been shortened whenever possible. While it is no longer readable, it is a bit smaller and thus requires less time to download. If you want to look at the uncompressed source code, you can view it by looking in the ol-debug.js file within the js folder of the ol3 directory.
You can, as we'll see in the last chapter of this book, build your own custom configurations of the library, including only the things you need. But for now, we'll just use the entire library. Now that we have our OpenLayers library files ready to use, let's make use of them!
The process for creating a map with OpenLayers requires, at a minimum, the following things:
ol.layer.* classol.Map class by adding a layerol.View class to set for the Map class (defining the area where the map will initially be displayed)Now, we're finally ready to create our first map!
Let's dive into OpenLayers and make a map! After you finish this section, you should have a working map, which uses a publicly available OSM server backend from the OpenStreetMap.org project. Execute the following steps:
assets directory, create a folder css, and create a new file called samples.css. Add the following code:map {
height: 500px;
width: 100%;
background-color: #b5d0d0;
}hello_openstreetmap.html and save the file in the sandbox directory. If you are using Windows, we suggest using Notepad++ in particular because you need to be sure you're editing UTF-8 encoded files. On Linux, you can use Gedit or Geany and for Mac OSX, you can use Text Wrangler (free but not open source). Do not try to edit the file in a program such as Microsoft Word, as it will not save properly. The following code will also be used as the base template code for many future examples in this book, so we'll be using it often and coming back to it a lot:<!doctype html>
<head>
<title> Hello OpenStreetMap </title>
<link rel="stylesheet" href="../assets/ol3/css/ol.css" type="text/css" />
<link rel="stylesheet" href="../assets/css/samples.css" type="text/css" />
</head>
<body>
<div id="map" class="map"></div>
<script src="../assets/ol3/js/ol.js">
</script>
<script>
var osmLayer = new ol.layer.Tile({
source: new ol.source.OSM()
});
var birmingham = ol.proj.transform([-1.81185, 52.44314], 'EPSG:4326', 'EPSG:3857');
var view = new ol.View({
center: birmingham,
zoom: 6
});
var map = new ol.Map({
target: 'map'
});
map.addLayer(osmLayer);
map.setView(view);
</script>
</body>
</html>hello_openstreetmap.html in your web browser. It can be hosted on a server or opened as a file. You should see something similar to the screenshot that follows:We just created our first map using OpenLayers! If it did not work for you for some reason, try double-checking the code and making sure all the commas and parentheses are in place. You can also open the browser debugger and look for JavaScript errors within the console. If you don't know what a console is, don't worry, we will see it soon. You can also refer to the Preface where a link to code samples used in the book is given. By default, we're given a few controls if we don't specify any. We will use the file we created as a template for many examples throughout the book, so save a copy of it so you can easily refer to it later.
The control on the left side (the navigation buttons) is called the Zoom control, which is a ol.control.Zoom object. You can click the buttons to navigate around the map, drag the map with your mouse, use the scroll wheel to zoom in, or use your keyboard's arrow keys. ol.control.Attribution is added by default. It will be populated if a layer (such as OSM) has attribution info available. This control is on the bottom right corner and gives the credits for the data you're using such as license and data producer.
We'll cover controls in greater detail in Chapter 9, Taking Control of Controls.
Now, let's take a look at the code, line by line.
<html> and <head> tag, and the extraneous code you see specifies various settings that inform your browser that this is an HTML5 compliant page. For example, we include the DOCTYPE declaration in line 1 to specify that the page conforms to standards set by the WC3. We also specify a <title> tag, which contains the title that will be displayed on the page. We also add a css stylesheet content to display correctly the zoom and attribution controls, and set the future map size to a height of 500px and a width of 100% (the width will always be at the max width depending on the browser window).This is the structure that all our code examples will follow, so this basic code template will be implicitly assumed in all examples that follow throughout the book.
<body> <div id="map" class="map"></div>
To make an OpenLayers map, we need an HTML element where the map will be displayed in. Almost always, this element will be a div. You can give it whatever ID you would like, and the ID of this HTML element is passed into the call to create the map object. You can style the <div> tag however you would like—setting the width and height to be 100 percent, for instance, if you want a full page map. We choose a class for this, also called map.
<script src="../assets/ol3/js/ol.js" type="text/javascript"></script>
This includes the OpenLayers library. The location of the file is specified by the src='../assets/ol3/js/ol.js' attribute. Here, we're using a relative path. As the hello_openstreetmap.html page is within the sandbox at the same level as the assets, we need to go outside the sandbox directory and then set the path to ol.js file . The file could either be on your computer, or another computer. Browsers can load it on any computer thanks to the relative path.
We can also use an absolute path, which means we pass in a URL where the script is located at. openlayers.org hosts the script file as well; we could use the following line of code to link to the library file directly:
<script src='http://openlayers.org/en/v3.0.0/build/ol.js></script>
Notice how the src specifies an actual URL which is an absolute path http://openlayers.org/en/v3.0.0/css/ol.css at line 5. Either way works, however, throughout the book we'll assume that you are using a relative path and have the OpenLayers library on your own computer/server. If you use the hosted OpenLayers library, you cannot be sure that it will always be available, so using a local copy is recommended.
Be aware that when browsers load a page, they load it from top to bottom. To use any DOM (Document Object Model) elements (any HTML element on your page) in JavaScript, they first have to be loaded by the browser. So, you cannot reference HTML with JavaScript before the browser sees the element. It'd be similar to trying to access a variable that hasn't yet been created. Because of this behavior, don't forget to call your JavaScript content after the <div id="map" class="map"></div>.
<script> block. We'll set up all our code inside it to create our map. Since the OpenLayers library has been included in line 13, we are able to use all the classes and functions the library contains. var osmLayer = new ol.layer.Tile({
source: new ol.source.OSM()
});In the previous three lines of code, we created a global variable called osmLayer. In JavaScript, any time we create a variable we need to place var in front of it to ensure that we don't run into scope issues (what functions can access which variables). When accessing a variable, you do not need to put var in front of it.
Since we are defining osmLayer as a variable at the global level (outside of any functions), we can access it anywhere in our code. We declare the osmLayer as an ol.layer.Tile object. It means we use an ol.layer.Tile class for creating the variable layerOsm.
The object created is also referred to as an instance of the ol.layer.Tile class. We'll talk about what this means later in the Appendix A, Object-oriented Programming – Introduction and Concepts.
Now, let's look at the right hand side of the equal sign (=): new keyword means that we are creating a new object from the class that follows it. ol.layer.Tile is the class name which we are creating an object from. Notice that something is inside the parenthesis: {source: new ol.source.OSM()}. This means we are passing one thing into the class (called an argument). Every class in OpenLayers expects different arguments to be passed into it, and some classes don't expect anything.
The ol.layer.Tile class expects one parameter following the API doc reference. Take a look at: http://openlayers.org/en/v3.0.0/apidoc/ol.layer.Tile.html. The {source: new ol.source.OSM()} is the layer options, consisting of key:value pairs (for example, {key:value} ). This is also called JavaScript Object Literal Notation, a way to create objects on the fly.
JavaScript object literal notation
In OpenLayers, we often pass in anonymous objects to classes . In JavaScript, anonymous objects are commas separated key:value pairs, and are set up in the format of {key1:value1, key2:value2}. They are, basically, objects that are created without deriving from a class. This format is also referred to as object literal notation.
When we say key1:value1, it's similar to saying key1 = value1, but we use a colon instead of an equals sign. We can also affect to a variable an object and reuse this variable instead of creating it on the line, for example:
var layer_parameters = {source: new ol.source.OSM()};
var osmLayer = new ol.layer.Tile(layer_parameters);So, the option source new ol.source.OSM() is the way to tell the characteristic of the tiles we want to retrieve such as the URL or the default attribution text, whereas ol.layer.Tile is the way to say how you ask the map image, not where it comes from.
The type of ol.source can be any from a multitude of different services, but we are using OSM here as a source. OSM (OpenStreetMap), is a crowdsourcing project focusing on creating open source map data. The main visible part of the project is the OSM world map we are using.
The arguments, like the source we can pass in for layers, are dependent on the layer class—we cover layers in detail in Chapter 3, Charting the Map Class. If you don't want to wait, you can also check out the documentation at http://openlayers.org/en/v3.0.0/apidoc/ to see what arguments different layers of classes expect.
var birmingham = ol.proj.transform([-1.81185 52.44314], 'EPSG:4326', 'EPSG:3857');
In this line of code, we take coordinates from a place, Birmingham in the UK, and we use a custom function that transforms [longitude, latitude] to the projected coordinate the map will expect in the view.
var view = new ol.View({ center: birmingham zoom: 6 });In the preceding four lines of code, we are defining a view from class ol.View. It's to use a view. Until now, we have defined what we will see, but with the view, we will define from where we are seeing it. Think of view as equivalent to a shot you might see in a cinema and where the cameraman chooses to see actors with more or less light, from far away or near, from below or above. Maps are usually 2D objects but because of new capabilities in the library, you can also have a tilted 2D view. We will not cover it because it requires advanced knowledge.
We have two options here in the JavaScript object: center and zoom.
The first one sets the center of the map with coordinates. These are not using latitude and longitude coordinates but Spherical Mercator coordinates, a common web mapping standard projection. We will explain this topic in Chapter 7, Wrapping Our Heads Around Projections.
The zoom is a way to set the level of details you get on the map when you open the web page. Change this value to understand better. The value for using the OSM layer can be between 0 and 18. The more you increase the value, the more you zoom in. If you set the value to 20, you will see that the image is always of the level 18 but the library resizes the image itself and and the image quality will be reduced.
var map = new ol.Map({ target: 'map' });We previously created a layer in order to add it to a map but this map was not already created. We have done it using the ol.Map class. The map object is the crux of our OpenLayers application— we call its functions to tell the view bound to the map to zoom to areas, fire off events, keep track of layers, and so on.
The ol.Map class expects a JavaScript object parameter. Within this object, we use one object parameter: target. You can provide another parameter renderer to choose the way the image will be displayed in the browser. It can be, DOM, Canvas, or WebGL. Don't worry about these terms, we will explain what they cover. This is not a mandatory option but we'd prefer to tell you already to be aware of this. You will learn more about this in Chapter 2, Key Concepts in OpenLayers.
The other object parameter is target. Its purpose is to set where you will attach your map in the HTML. It refers to the id of an HTML element available in your web page.
Notice, we don't include everything on one line when creating our map object—this improves readability, making it easier to see what we pass in. The only difference is that we are also adding a new line after the comma separating arguments, which doesn't affect the code (but does make it easier to read).
map.addLayer(osmLayer);
Now that we have created both the map and layer, we can add the layer to the map. In OpenLayers, every map needs to have at least one layer. The layer points to the backend, or the server side map server, as we discussed earlier.
Notice, we are calling a function of the map object. There are actually a few ways to go about adding a layer to a map object. We can use the previous code (by calling map.addLayer), where we pass in an individual layer but we can also add the layers when instantiating the ol.Map with something such as the following:
var map = new ol.Map({ target: 'map',
layers: [osmLayer]
});In this second case, you have to create your layer before the map. Most official examples use the second syntax but for learning purposes, we thought it would be better to separate map instantiation from layers addition.
map.setView(view);
This line enables you to set the view to render the image and display it at the right place you defined previously in the ol.View instance, the view variable.
</script> </body> </html>
These lines close the JavaScript block and the remaining HTML blocks.
After reviewing this first example, if the concept of object-oriented programming is unfamiliar to you, we recommend that you take some time to explore this topic. While you don't necessarily need to know OOP concepts thoroughly to use this book, understanding keywords such as class, properties, abstract class, methods, instance, constructor, or inheritance should ring a bell in your mind. If not, we advise you to visit the Appendix A, Object-oriented Programming – Introduction and Concepts.
Now, let's introduce you to the main resources for getting the most important information about OpenLayers and its ecosystem.
Our coverage of the sample code was not meant to be extremely thorough; just enough to give you an idea of how it works. We'll be covering OOP concepts in more detail throughout the remaining chapters, so if anything is a bit unclear, don't worry too much.
As OpenLayers is a library and provides functions for you, it is important to know what these functions are and what they do. There are many places to do this, but the best source is the API docs.
The API documentation is always up-to-date and contains an exhaustive description of all the classes in OpenLayers. It is usually the best and first place to go when you have a question. You can access the documentation at: http://openlayers.org/en/v3.0.0/apidoc/ for the 3.0.0 release. It contains a wealth of information. We will constantly refer to it throughout the book, so keep the link handy! Sometimes, however, the API docs may not seem clear enough, but there are plenty of other resources out there to help you. We'll cover a bit about how to find your way in API documentation in Chapter 2, Key Concepts in OpenLayers and in Appendix A, Object-oriented Programming – Introduction and Concepts.
The extension website for this book can be found at: http://openlayersbook.github.io/openlayersbook/. Current, up-to-date corrections and code fixes, along with more advanced tutorials and explanations, can be found there. You can also grab the code and more information about this book at Packt Publishing's website, located at https://www.packtpub.com/web-development/openlayers-3-beginner%E2%80%99s-guide.
The OpenLayers mailing list is an invaluable resource that lets you not only post questions, but also browse questions others have asked (and answered). There were two main OpenLayers news groups—Users and Dev for the OpenLayers 2 Version. There is a list only for OpenLayers 3 development discussions located at https://groups.google.com/forum/#!forum/ol3-dev. You may find some users' questions in the archives as it was before for both development and users questions.
Now, user questions should be only posted on http://stackoverflow.com and tagged with openlayers. OpenLayers 3 library developers will answer directly here.
When posting a question, please be as thorough as possible, stating your problem, what you have done, and the relevant source code (for example, "I have a problem with using a WMS layer. I have tried this and that, and here is what my source code looks like..."). A good guideline for asking questions in a way that will best elicit a response can be found at http://www.catb.org/~esr/faqs/smart-questions.html.
Books are great, but they're basically just a one way form of communication. If you have any questions that the book does not answer, your favorite search engine is the best place to go to. The Questions and Answers website http://gis.stackexchange.com, the young brother of StackOverflow, dedicated to GIS (Geographical Information System) can also be quite useful. But, at the end, don't forget that mailing lists and IRC are other great resources.
Sometimes, you will hit an error without understanding why you encounter it, for example related to a mobile browser's unexpected behavior. Before asking to check mailing lists or IRC, we encourage you to make a small search in the list of issues located at Github https://github.com/openlayers/ol3/issues. You can search issues by milestone, status (opened, closed, etc), or keywords.
IRC (Internet Relay Chat) is another great place to go to if you have questions about OpenLayers. IRC is used for group communication; a big chat room, essentially. If you have exhausted Google, issues' trackers, and the mailing list, IRC provides you in real time with other people interested in OpenLayers.
Generally, the people who hang out in the OpenLayers chat room are very friendly, but please try to find an answer before asking in IRC. The server is irc.freenode.net and the chat room is #openlayers. You can download an IRC client online; a good Windows one is mIRC (http://mirc.com). More information about how to use IRC can be found at http://www.mirc.com/install.html. For beginners, we recommend using Chatzilla, a Firefox Mozilla add—on http://chatzilla.hacksrus.com or CIRC, a Google Chrome add—on http://flackr.github.io/circ/.
When you've installed it, just type irc://irc.freenode.net/openlayers (for Chatzilla only) in your browser address bar, press enter, wait and you're ready to speak on OpenLayers IRC channel.
The source code repository location is hosted at GitHub. You can access the entire code repository at http://github.com/openlayers/ol3.
Feel free to download a copy and play around with it yourself. When you become an advanced user, you can submit evolutions to the official source code base and become a contributor to the library. Without going so far, it cannot hurt to download a copy of the code base and look around it yourself to figure out how it's really working!
Nowadays, some people prefer to aggregate content using RSS feeds or social networks.
Let's review how you can access alternatively to all the previous resources and more.
For the OpenLayers 3 Developers mailing list, you can use atom or RSS feed, available at https://groups.google.com/forum/#!aboutgroup/ol3-dev
When you want to get news about OpenLayers 3 development, you have to rely on Github website capabilities.
You can see:
In this chapter, we were introduced to OpenLayers and learnt a bit about it.
We saw what web map applications are and how they work. After that, we created our first map with OpenLayers, then analyzed how the code works. Then, we covered a fundamental concept, object-oriented programming, which we'll need to know about while really working with OpenLayers. Lastly, resources for help and information outside this book were provided.
Now that we have a basic handle on OpenLayers, we'll jump straight into Chapter 2, Key Concepts in OpenLayers. We will discover relationships between library core parts. Using examples, we will also review Events and Observe behaviors. It would be impossible to get an interactive map without them. Then, to finish, we will focus on basic debugging techniques. To learn more about JavaScript debugging, you can also refer to Appendix C, Squashing Bugs with Web Debuggers.
Now that we've seen the basics and made our first map with OpenLayers, let's take a step back and look at the big picture. OpenLayers is a software library based on an Object-oriented design principles, which means that it contains classes to encapsulate behavior, formal relationships between those classes, and standardized mechanisms for communication between objects. While OpenLayers contains many classes, there are just a few that form the foundation of the OpenLayers architecture. In this chapter, we will introduce these core components of the library and also two key concepts— events and observable properties—that are the basis for standardized communication between objects. Along the way, we'll use concrete examples and introduce some basic debugging techniques you can use to solve problems and explore the relationships between objects in a running application.
In this chapter, we will:
The OpenLayers library provides web developers with components useful to build web mapping applications. Following the principles of an Object-oriented design, these components are called classes. The relationship between all the classes in the OpenLayers library is part of the deliberate design, or architecture, of the library. There are two types of relationships that we, as developers using the library, need to know about: relationships between classes and inheritance between classes. We briefly talked about object-oriented programming in Chapter 1, Getting Started with OpenLayers and a more detailed discussion is included in Appendix A, Object-oriented Programming – Introduction and Concepts but for the purpose of this chapter, let's summarize the two types of relationships we are interested in:
We'll start our discussion of the key components of OpenLayers by focusing on the first of these—the relationship between classes. OpenLayers includes a lot of classes for our use, and we'll cover a lot of these in later chapters, but for now, we'll start by looking at the Map class—ol.Map.
Instances of the map class are at the center of every OpenLayers application. These objects are instances of the ol.Map class and they use instances of other classes to do their job, which is to put an interactive map onto a web page. Almost every other class in the OpenLayers is related to the Map class in some direct or indirect relationship. The following diagram illustrates the direct relationships that we are most interested in:
The preceding diagram shows the most important relationships between the Map class and other classes it uses to do its job. It tells us several important things:
view to refer to it. A view may be associated with multiple maps, however.Collection class and a layer may be associated with 0 or one Map class. The Map class has a member variable named layers that it uses to refer to this collection.Collection class and an overlay may be associated with 0 or one Map class. The Map class has a member variable named overlays that it uses to refer to this collection.ol.Collection (more on collections at the end of this chapter) and controls may be associated with 0 or one Map class. The Map class has a member variable named controls that it uses to refer to this collection.Collection class and an interaction may be associated with 0 or one Map class. The Map class has a member variable named interactions that it uses to refer to this collection.Although these are not the only relationships between the Map class and other classes, these are the ones we'll be working with the most. We've already seen some of these classes in action in the examples from the previous chapter. We'll do another example in a moment, but first let's introduce each of these new classes.
View class (ol.View) manages information about the current position of the Map class.If you are familiar with the programming concept of MVC (Model-View-Controller), be aware that the view class is not a View in the MVC sense. It does not provide the presentation layer for the map, rather it acts more like a controller (although there is not an exact parallel because OpenLayers was not designed with MVC in mind.)
Layer class (ol.layer.Base) is the base class for classes that provide data to the map to be rendered.Overlay class (ol.Overlay) is an interactive visual element like a control, but it is tied to a specific geographic position.Control class (ol.control.Control) is the base class for a group of classes that collectively provide the ability to a user to interact with the map. Controls have a visible user interface element (such as a button or a form input element) with which the user interacts.Interaction class (ol.interaction.Interaction) is the base class for a group of classes that also allow the user to interact with the map, but differ from controls in which they have no visible user interface element. For example, the DragPan interaction allows the user to click on and drag the map to pan around.Let's create a new OpenLayers application and identify the components as we go:
components.html in the sandbox directory and put in the standard HTML structure for our applications as follows:<!doctype html>
<html>
<head>
<title>OpenLayers Components</title>
<link rel="stylesheet" href="../assets/ol3/css/ol.css" type="text/css" />
<link rel="stylesheet" href="../assets/css/samples.css" type="text/css" />
</head>
<body>
<div id="map" class="map"></div>
<script src="../assets/ol3/js/ol.js"></script>
<script>
</script>
</body>
</html>layers collection:var layer = new ol.layer.Tile({
source: new ol.source.OSM()
});DragRotateAndZoom:var interaction = new ol.interaction.DragRotateAndZoom();
FullScreen:var control = new ol.control.FullScreen();
<div> tag containing our map:<div id="overlay" style="background-color: yellow; width: 20px; height: 20px; border-radius: 10px;">
var center = ol.proj.transform([-1.812, 52.443], 'EPSG:4326', 'EPSG:3857');
var overlay = new ol.Overlay({
position: center,
element: document.getElementById('overlay')
});var view = new ol.View({
center: center,
zoom: 6
});var map = new ol.Map({
target: 'map',
layers: [layer],
interactions: [interaction],
controls: [control],
overlays: [overlay],
view: view
});If you try to interact with the map, you'll notice something immediately—you can't click and drag to pan. Instead, if you hold down the Shift key while clicking and dragging, you'll get a whole new behavior. We've also lost the zoom in and out buttons at the top left corner, and the attribution icon in the bottom right corner, but there is a new button in the top-right corner. What does it do?
In the first step, we added our boilerplate HTML code for a simple OpenLayers application. This includes standard HTML tags suitable for any web page, and also includes the OpenLayers CSS and JavaScript files.
Next, we started creating instances of various OpenLayers components to use with our map. The first one was a layer that renders tiles from the OpenStreetMap tile servers. Next, we created an interaction called DragRotateAndZoom. This interaction has no visible element, but rather is triggered by holding down the Shift key while dragging the map. As the name suggests, this interaction will rotate and zoom the map in response to dragging the mouse cursor. Then we created a control called FullScreen. Again, the name gives away what it does—launches the web page into fullscreen mode. Because it is a control, it has a button that is clicked to activate its behavior. Next, we created an overlay, which displays an HTML element at a specific geographic location. Finally, we created the view, giving it the same center as the position we provided to the overlay.
The last step is to tie it all together with the Map class object by passing all our components as part of the constructor. We'll look at the Map class's constructor in more detail in Chapter 3, Charting the Map Class but for now, it's enough to know that we can provide arrays of layers, interactions, controls, and overlays as options, and the Map class will know what to do with them.
We saw that by providing our own set of interactions and controls; we changed the default behavior of an OpenLayers application. This is because the Map class has a default set of interactions and controls that it creates when they are not explicitly provided as options to the constructor. There are two ways we can restore the default behavior and add our new components as well.
The first way is to use helper functions provided by OpenLayers to obtain the collection of default interactions and default controls and extend those with our new components. We will do something like this (this example is not complete as the Map class is missing a view):
// create our interaction
var interaction = new ol.interaction.DragRotateAndZoom();
// get the default interactions and add our new one
var interactions = ol.interaction.defaults().extend([interaction]);

// create our control
var control = new ol.control.FullScreen();
// get the default controls and add our new one
var controls = ol.control.defaults().extend([control]);

// create the map and pass in the extended set of interactions and controls
var map = new ol.Map({
  interactions: interactions,
  controls: controls
});
The second method is to add them to the map after calling the constructor, for instance, (again, this example is not complete):
var interaction = new ol.interaction.DragRotateAndZoom();
var control = new ol.control.FullScreen();
var map = new ol.Map();
map.addInteraction(interaction);
map.addControl(control);
The advantage of the first method (passing constructor options) is that it gives you complete control over which interactions and controls are in use, while the second method (adding them after creating the map) has the advantage of being simpler if you want to add to the existing set of interactions and controls.
In many parts of OpenLayers, you will discover that there are multiple ways of accomplishing a given task. This is part of the design of the OpenLayers library and provides developers with the option to write code in a way that makes most sense for them.
We noted at the end of the previous example that the map wasn't working normally. We replaced the default controls and interactions and so the default behavior wasn't present any more. Let's take a moment to try to fix this. In many cases, mistakes or oversights in our code will produce unexpected results. Web developers have a number of tools available to help them diagnose and fix these problems. In this example, we'll work with the Developer Tools available in the Chrome browser. Similar tools exist for all major browsers; if you are not using Chrome, you should still be able to follow along using your browser's Developer Tools. With the previous example open in your browser, let's get started:
Using any of these methods, a new Developer Tools window will open. By default, the Developer Tools window will be docked to the current tab at the bottom. You can change this by detaching it to a separate window or moving it to one side, but for now, let's keep it at the bottom. It should look something like the following screenshot:
controls = ol.control.defaults();
This should output the value that was assigned to the variable controls, something like the following screenshot:
You can click the small triangle next to the line of output to expose properties of the object, like the following screenshot:
We can't even tell what kind of object this is! Let's fix that first.
ol.js to load the debug version ol-debug.js:<script src="../assets/ol3/js/ol-debug.js"></script>
The build process used to create production and debug versions of OpenLayers is covered in detail in Chapter 11, Creating Web Map Apps and Appendix B, More details on Closure Tools and Code Optimization Techniques.
Now, we can see that the controls variable is an instance of ol.Collection and we should be able to add each of the elements of the collection to the map. The line of output expanded, you can see the properties of the collection object.
The last entry is labeled __proto__ and has a triangle next to it. The __proto__ property is a special property that shows us an object's prototype, essentially the methods it gains from the class the object was created from. We can explore this property for methods available to be called on the object. Note that the __proto__ property may also have a __proto__ property revealing further methods inherited from other classes in the inheritance hierarchy.
addControl method to add one control at a time, so we need a way of doing this for each individual controls in the collection. Collections have a forEach method that invokes a function for each item in the collection, which sounds ideal! Let's give it a try by running the following code in the Console tab:controls.forEach(map.addControl);
Something is not right, we are getting an error. Let's investigate.
this.getControls(). Move the mouse over the this keyword and the debugger will show us what its value is. Now, we can see that this is the Window object and not a Map class object, which is why the getInteractions method is undefined! We need to provide the correct object, map, as the scope of the forEach function call by passing it as the second argument.controls.forEach(map.addControl, map);
Much better! Now, we have all our controls back.
We used the Developer tools console to execute some JavaScript and modify our running application to add the default zoom controls that were missing. Along the way, we ran into a problem and switched to the debug build of the OpenLayers library so that we could get more useful information about problems we ran into. We touched briefly on using the powerful Developer tools, including the Console and Sources panels.
There are a great many things we can do with the Developer tools, and this just touches briefly on one aspect of them. Please read Appendix C, Squashing Bugs with Web Debuggers to learn more about using the Developer tools in application development.
In the following sections, we'll look a little more closely at each of the components we've introduced so far, starting with the view class.
Based on the previous example, use the Console to add the default interactions to the running application. You can get the default interactions by calling the ol.interaction.defaults() method.
The OpenLayers view class, ol.View, represents a simple two-dimensional view of the world. It is responsible for determining where, and to some degree how, the user is looking at the world. We'll cover views in more detail at the end of Chapter 3, Charting the Map Class, but briefly, it is responsible for managing the following information:
Although you can create a map without a view, it won't display anything until a view is assigned to it. Every map must have a view in order to display any map data at all. However, a view may be shared between multiple instances of the Map class. This effectively synchronizes the center, resolution, and rotation of each of the maps. In this way, you can create two or more maps in different HTML containers on a web page, even showing different information, and have them look at the same world position. Changing the position of any of the maps (for instance, by dragging one) automatically updates the other maps at the same time! We'll see an example of this in the next chapter.
So, if the view is responsible for managing where the user is looking in the world, which component is responsible for determining what the user sees there? That's the job of layers and overlays.
A layer provides access to a source of geospatial data. There are two basic kinds of layers, that is, raster and vector layers:
Layers are not the only way to display spatial information on the map. The other way is to use an overlay. As we saw in the example earlier in this chapter, we can create instances of ol.Overlay and add them to the map at specific locations. The overlay then positions its content (an HTML element) on the map at the specified location. The HTML element can then be used like any other HTML element.
The most common use of overlays is to display spatially relevant information in a pop-up dialog in response to the mouse moving over, or clicking on a geographic feature.
In the previous example, we added an overlay but we didn't really investigate how it behaves. Let's do something a bit more interesting with overlays to illustrate what they do. In this example, we'll build an OpenLayers application that displays the latitude and longitude of the mouse position in an overlay when you click on the map:
overlay.html in the sandbox directory. Add the standard boilerplate content to get started:<!doctype html>
<html>
<head>
<title>OpenLayers Overlays</title>
<link rel="stylesheet" href="../assets/ol3/css/ol.css" type="text/css" />
<link rel="stylesheet" href="../assets/css/samples.css" type="text/css" />
</head>
<body>
<div id="map" class="map"></div>
<script src="../assets/ol3/js/ol.js"></script>
<script>
</script>
</body>
</html>var layer = new ol.layer.Tile({
source: new ol.source.OSM()
});
var center = ol.proj.transform([-1.812, 52.443], 'EPSG:4326', 'EPSG:3857');
var view = new ol.View({
center: center,
zoom: 6
});
var map = new ol.Map({
target: 'map',
layers: [layer],
view: view
});<div> element. You can change the style of the element if you wish:<div id="overlay" style="background-color: white; border-radius: 10px; border: 1px solid black; padding: 5px 10px;">
Map class:var overlay = new ol.Overlay({
element: document.getElementById('overlay'),
positioning: 'bottom-center'
});map.on('click', function(event) {
var coord = event.coordinate;
var degrees = ol.proj.transform(coord, 'EPSG:3857', 'EPSG:4326')
var hdms = ol.coordinate.toStringHDMS(degrees);
var element = overlay.getElement();
element.innerHTML = hdms;
overlay.setPosition(coord);
map.addOverlay(overlay);
});In this example, we illustrated how an overlay is positioned at a geographic location on the map, how it moves with the map to stay at that same location, and how it can be used to display information about some location.
After setting up the boilerplate HTML structure for the page, we added a raster layer with the OpenStreetMap data, a view, and a map to the application. We then created an overlay object pointing at an HTML element for content and with the positioning set to 'bottom-center', which tells OpenLayers to align the bottom, center of the HTML element with the geographic position of the overlay. This means that the overlay will appear above the location, centered on it.
The last step was to register an event handler (more on events later in this chapter) for the map's click event. When the user clicks on the map, the event handler function is called with an event object that contains coordinate (the geographic position) of the click on the map. We transform the coordinate from the map's projection into decimal degrees (longitude and latitude values) and use a helper function in the OpenLayers library to format this into degrees minutes and seconds (a standard way of representing geographic location in human readable form). We then update the content of our overlay's HTML element with this information, set the position of the overlay to the coordinate provided with the event, and add it to the map using the addOverlay method.
If some of this seems overwhelming, don't worry, we'll be covering all of this in later chapters.
As mentioned earlier, the two components that allow users to interact with the map are interactions and controls. Let's look at them in a bit more detail.
Interactions are components that allow the user to interact with the map via some direct input, usually by using the mouse (or a finger with a touch screen). Interactions have no visible user interface. The default set of interactions are:
ol.interaction.DoubleClickZoom: If you double-click the left mouse button, the map will zoom in by a factor of 2ol.interaction.DragPan: If you drag the map, it will pan as you move the mouseol.interaction.PinchRotate: On touch-enabled devices, placing two fingers on the device and rotating them in a circular motion will rotate the mapol.interaction.PinchZoom: On touch-enabled devices, placing two fingers on the device and pinching them together or spreading them apart will zoom the map out and in respectivelyol.interaction.KeyboardPan: You can use the arrow keys to pan the map in the direction of the arrowsol.interaction.KeyboardZoom: You can use the + and – keys to zoom in and outol.interaction.MouseWheelZoom: You can use the scroll wheel on a mouse to zoom the map in and outol.interaction.DragZoom: If you hold the Shift key while dragging on map, a rectangular region will be drawn and when you release the mouse button, you will zoom into that area.We will discuss interactions in detail in Chapter 8, Interacting with Your Map.
Controls are components that allow the user to modify the map state via some visible user interface element, such as a button. In the examples we've seen so far, we've seen zoom buttons in the top-left corner of the map and an attribution control in the bottom-right corner of the map. In fact, the default controls are:
ol.control.Zoom: This displays the zoom buttons in the top-left corner.ol.control.Rotate: This is a button to reset rotation to 0; by default, this is only displayed when the map's rotation is not 0.ol.control.Attribution: This displays attribution text for the layers currently visible in the map. By default, the attributions are collapsed to a single icon in the bottom-right corner and clicking the icon will show the attributions.We will discuss these controls and more in detail in Chapter 9, Taking Control of Controls.
This concludes our brief overview of the central components of an OpenLayers application. We saw that the Map class is at the center of everything and there are some key components—the view, layers, overlays, interactions, and controls—that it uses to accomplish its job of putting an interactive map onto a web page. At the beginning of this chapter, we talked about both relationships and inheritance. So far, we've only covered the relationships. In the next section, we'll show the inheritance architecture of the key components and introduce three classes that have been working behind the scenes to make everything work.
In this section, we will look at three classes in the OpenLayers library that we won't often work directly with, but which provide an enormous amount of functionality to most of the other classes in the library. The first two classes, Observable and Object, are at the base of the inheritance tree for OpenLayers—the so-called super classes that most classes inherit from. The third class, Collection, isn't actually a super class but is used as the basis for many relationships between classes in OpenLayers—we've already seen that the Map class relationships with layers, overlays, interactions, and controls are managed by instances of the Collection class.
Before we jump into the details, take a look at the inheritance diagram for the components we've already discussed:
As you can see, the Observable class, ol.Observable, is the base class for every component of OpenLayers that we've seen so far. In fact, there are very few classes in the OpenLayers library that do not inherit from the Observable class or one of its subclasses. Similarly, the Object class, ol.Object, is the base class for many classes in the library and itself is a subclass of Observable. Because the functionality contained in these two classes is so fundamental to the understanding of how OpenLayers works, we'll be relying on them for the rest of the book.
The Observable and Object classes aren't very glamorous. You can't see them in action and they don't do anything very exciting from a user's perspective. What they do though is provide two common sets of behaviour that you can expect to be able to use on almost every object you create or access through the OpenLayers library—Event management and Key-Value Observing (KVO).
An event is basically what it sounds like—something happening. Events are a fundamental part of how various components of OpenLayers—the map, layers, controls, and pretty much everything else—communicate with each other. It is often important to know when something has happened and to react to it. One type of event that is very useful is a user-generated event, such as a mouse click or touches on a mobile device's screen. We used this earlier in the chapter to display an overlay at the location of a mouse click. Knowing when the user has clicked and dragged on the Map class allows some code to react to this and move the map to simulate panning it. Other types of events are internal, such as the map being moved or data finishing loading. To continue the previous example, once the map has moved to simulate panning, another event is issued by OpenLayers to say that the map has finished moving so that other parts of OpenLayers can react by updating the user interface with the center coordinates or by loading more data.
Classes inheriting from ol.Observable (including ol.Object) get the following event related methods:
It is very important to pass the exact same listener and scope values to un() as were passed to on(). A common practice is to pass anonymous functions as arguments to functions such as on(), which takes function arguments. Because un() needs the exact same listener argument to work correctly, we can't use anonymous functions if we want to call un() later. However, we can store the key returned by on() and use it with unByKey(). Let's look at some code examples:
var map = new ol.Map({
 target: 'map',
 view: view
});
This creates a Map class object, nothing new here.
map.on( 'moveend', function() {
 console.log('move end event!');
});
Next, we will register for the moveend
event. The moveend event is triggered by the map after it has been panned or zoomed. The function we provide will be called every time the map moves. Our code will output some text to the debug console. Because we used an inline or anonymous function, we have no way to remove our function if we no longer want to receive events. Or do we?
var key = map.on('moveend', function() {
 console.log('move end event!');
});
map.unByKey(key);
This code registers for the same moveend event using an anonymous function but this time we will assign the return value to key. We can then use the value assigned to key to unregister our handler.
Let's look at another way:
function onMoveEnd(event) {
 console.log('moveend event 2');
}
map.on('moveend', onMoveEnd);
map.un('moveend', onMoveEnd);
This block declares a function called onMoveEnd() and registers it for the moveend event. The last line unregisters it. This achieves exactly the same result as the previous code; so, what's the difference? It is mostly to accommodate different coding styles and patterns. Some people prefer to write their code a certain way, or perhaps they have to follow a particular coding style guide (see Appendix B, More details on Closure Tools and Code Optimization Techniques for more information on this), and OpenLayers provides various ways to make it easier.
What about the scope parameter? This is useful for code that is written in an Object oriented style. Here is a contrived example that illustrates how it will be used:
var MyClass = function(label) {
 this.label = label;
 this.onMoveEnd = function() {
   console.log( this.label + ': moveend event');
 }
}
var obj1 = new MyClass('Object 1');
var obj2 = new MyClass('Object 2');
A simple class called MyClass is defined, which contains a single attribute, label, and a single method, onMoveEnd(). Next, two instances of this class are created with different label values. We can use the onMoveEnd() method of our instances as a function in the second parameter of the on() method. When the onMoveEnd() method is called, it will log a message to the debug console containing the value of the label attribute. Here are some examples of how this can be used:
map.on('moveend', obj1.onMoveEnd);Registering the onMoveEnd() method for the moveend event will work, but the output will be as follows:
Undefined: zoomend event
What's wrong? It turns out that this.label is not defined because the value of this is the global window object. We can correct this by passing a scope object as the third parameter to the on() function:
map.on('moveend', obj1.onMoveEnd, obj1);
map.on('moveend', obj2.onMoveEnd, obj2);
Now, the output will be what we expected:
Object 1: moveend event
Object 2: moveend event
We then need to use the scope to unregister for the events as follows:
map.un('moveend', obj1.onMoveEnd, obj1);
map.un('moveend', obj2.onMoveEnd, obj2);OpenLayers' Object class inherits from Observable and implements a software pattern called Key-Value Observing (KVO). With KVO, an object representing some data maintains a list of other objects that wish to observe it. When the data value changes, the observers are notified automatically.
The following methods are available in all OpenLayers classes, which inherit from ol.Object. Note that the Object class also contains all the methods provided by the Observable class even though they are not listed here:
The bindTo method is extremely powerful and makes many seemingly advanced tasks quite easy to accomplish. Let's set up an HTML checkbox element that we can use to control the visibility of a map layer.
<div id="map"> and the <script> tag:<input type="checkbox" id="visible" checked> Toggle Layer Visibility
This will add a new HTML element, a checkbox, to our web page and we will use this to turn our layer on and off.
var visible = new ol.dom.Input(document.getElementById('visible'));
visible.bindTo('checked', layer, 'visible');
This code creates a new instance of ol.dom.Input, an OpenLayers helper class that connects to our checkbox element. It then uses the bindTo() method to observe changes in the checked attribute and send them to the layer, specifically to the visible property.
You successfully used the bindTo() method to establish the layer as an observer of the checkbox using the ol.dom.Input helper class. We bound the visible property of our layer to the checked property of the ol.dom.Input. When the checkbox is clicked, ol.dom.Input updates the checked property and notifies observers of the checked property that it has changed. Because we bound the visible property of the layer to the checked property of the input, the layer is notified of the change and updates the visible property, which causes the layer to turn on and off.
Property binding works both ways. You can manually change the visibility of the layer using the Console in Web Inspector. Try the following and observe what happens to the checkbox:
layer.setVisible(false);
layer.setVisible(true);
You should see the checkbox change state as if you had clicked it.
Sometimes, the property value that you are sharing between two objects is not exactly what you need. For instance, you might want to synchronize two maps so that they are looking at the same center point, but at different resolutions. If we share a view between the maps, we can't have one of them at a different resolution. We could use two views and use events to manually synchronize them—and this is a perfectly valid approach—but wouldn't it be nice if we could use bindTo and just modify the resolution value a little bit? This is exactly what the object returned from bindTo allows us to do. The return value from bindTo is an object with a single function, transform, that you can invoke with two functions as arguments. The first function is used to transform the value going from the source to the target and the second is used to transform the value going to the source from the target. For instance:
var transformer = view1.bindTo(resolution', view2);
var from = function(value) {
  return value * 2;
};
var to = function(value) {
  return value / 2;
};
transformer.transform(from, to);
This example binds the resolution property of view2 (the target) to the resolution property of view1 (the source). We can capture the return value in the variable transformer, create two functions that will transform the resolution value, and call the transformer variable's transform function with our two functions. The result is that view2 parameter's resolution property will be bound to view1 parameter's property but will always have a value twice that of view1.
Most classes in the OpenLayers library have one or more KVO properties (these are specified in the library documentation) and have some special features. As we saw, the name of the property can be used as the key parameter in any of the KVO methods described earlier. Additionally, three events are triggered when the value of a property changes.
The first event is beforepropertychange and is triggered before a property will change. It provides the name of the property that will change to the listener:
layer.on('beforepropertychange', function(event) {
 console.log('layer changed in some way');
 // event.type == 'beforepropertychange'
 // event.key == '<the key that is changing>'
});
The second event is propertychange is triggered as (effectively after) the property is changed:
layer.on('propertychange', function(event) {
 console.log('layer changed in some way');
 // event.type == 'propertychange'
 // event.key == '<the key that has changed>'
});
A third event is a change event specific to the property that changed. The name of the event is derived from the property name with the prefix change:. This means that we can be notified of changes to individual properties. In our previous example of binding a layer's visibility to a checkbox, we can register to be notified of the change like this:
layer.on('change:visible', function(event) {
 console.log('layer visibility changed');
 // event.type == 'change:visible'
 // event.target == layer
});
It may seem like there are a lot of events that happen in response to a KVO property changing and you are right, there are! Each event, though, is slightly different and provides both convenient and optimal ways of responding to changes that happen to objects in OpenLayers.
In addition to events, KVO properties also have special accessor functions called setters and getters defined for them. This means that instead of using the KVO methods get(key) and set(key, value), you can use get<Property>() and set<Property>(value), where <Property> is the capitalized property name. For instance:
layer.get('visible');
layer.getVisible();
layer.set('visible', true);
layer.setVisible(true);
These methods are primarily for convenience and you can use either depending on your own preferences.
The last section for this chapter is about the OpenLayers' Collection class, ol.Collection. As mentioned, the Collection class is not a super class like Observable and Object, but it is an integral part of the relationship model. Many classes in OpenLayers make use of the Collection class to manage one-to-many relationships.
At its core, the Collection class is a JavaScript array with additional convenience methods. It also inherits directly from the Object class and inherits the functionality of both Observable and Object. This makes the Collection class extremely powerful and we will use it many times in the rest of this book.
A collection is created just like any other class, just use the new operator:
var collection = new ol.Collection();
The Collection constructor takes one optional argument, an array that is used to initially populate the collection with elements. The elements in the array can be of any type, but if you are using the collection with one of the OpenLayers API methods, the type of the values will typically be specified in the API documentation. For instance, the Map class constructor allows passing a collection of layers, interactions, controls, and overlays. In these cases, the contents of the collection must be instances of the correct type of an object. For instance, check the following code snippet:
var layer1 = new ol.layer.Tile({/*options */);
var layer2 = new ol.layer.Vector({/* options */});
var layerCollection = new ol.Collection([layer1, layer2]);
var map = new ol.Map({
  layers: layerCollection
});A Collection class, inherited from the Object class, has one observable property, length. When a collection changes (elements are added or removed), its length property is updated. This means it also emits an event, change:length, when the length property is changed.
A Collection class also inherits the functionality of the Observable class (via Object class) and emits two other events—add and remove. Registered event handler functions of both events will receive a single argument, a CollectionEvent, that has an element property with the element that was added or removed.
The Collection class has the following methods (the ones from Object and Observable classes are not included in this list, but those methods are also available):
This wraps up our overview of the key concepts in the OpenLayers library. We took a quick look at the key components of the library from two different aspects—relationships and inheritance. With the Map class as the central object of any OpenLayers application, we looked at its main relationships to other classes including views, layers, overlays, interactions, and controls. We briefly introduced each of these classes to give an overview of primary purpose. We then investigated inheritance related to these objects and reviewed the super classes that provide functionality to most classes in the OpenLayers library—the Observable and Object classes. The Observable class provides a basic event mechanism and the Object class adds observable properties with a powerful binding feature. Lastly, we looked at the Collection class. Although this isn't part of the inheritance structure, it is crucial to know how one-to-many relationships work throughout the library (including the Map class relationships with layers, overlays, interactions, and controls).
In the next chapter, we'll dig into the Map and View class in much more detail.
The Map class is, as you have probably realized by now, the core piece behind your map. The map object(s) you create is the most important thing behind your map, as without a map object you can't do anything with layers or controls. In this chapter, we'll talk about the Map class, which we've been taking for granted so far.
We will also introduce the concept of a view, which is used to change what we see in a map, and several core concepts you'll need to understand the rest of this book.
We used the Map and View classes so far in this book, without really understanding what's going on. This chapter aims to not only explain how and why we've been doing things, but will also provide thorough coverage of two core classes—the Map and View classes. Specifically, we'll look at:
Map class isMap class relates to the other classes we've discussedMap classView class to change the location displayed by the mapThe OpenLayers' Map class is the core component of OpenLayers. We use it to manage the layers, controls, interactions, and overlays. We've worked with it already by creating a map object, adding layers to it, then using its view to modify its extent. We are yet to discuss the functionality behind the Map class, the core component of our applications.
In OpenLayers, everything belongs to the Map class. The Layer, Control, and Interaction classes must be hooked up to a map if we want them to do anything. So, we need a map object to actually create a useful map—and as you might imagine, we'll see later in this chapter that it is possible to make an application that uses multiple map objects.
Let's walk through creating a simple map from the beginning. Create a new file in your text editor to get started. To make it easy, save this file in the sandbox
folder. Remember that all the samples are set up to use the version of OpenLayers we've provided in the assets folder:
<!doctype html>
<html>
  <head>
    <title> Map Examples </title>
    <link rel="stylesheet" href="../assets/ol3/ol.css" type="text/css" />
    <link rel="stylesheet" href="../assets/css/samples.css" type="text/css" />
  </head>
  <body>
    <div id="map" class="map"></div>
<script src="../assets/ol3/ol.js">
</script>
We are just setting up a standard HTML 5 web page and including our stylesheets and the OpenLayers library.
<script> block with the following code: <script>
var layer = new ol.layer.Tile({
source: new ol.source.OSM()
});
var london = ol.proj.transform([-0.12755, 51.507222],
'EPSG:4326', 'EPSG:3857');
var view = new ol.View({
center: london,
zoom: 6,
});
var map = new ol.Map({
target: 'map',
layers: [layer],
view: view
});
</script>This code should look familiar to the ones used in the previous chapters, and you'll be seeing it (with minor variations) quite a bit through the rest of this book. We create a layer that will show OSM tiles, use london as our starting point for the view and create an instance of ol.Map in our map div.
</body> </html>
map.html and open it in your web browser, you should see a familiar sight, as shown here:Let's look a little closer at how we create our map object in this block of code:
var map = new ol.Map({
target: 'map',
layers: [layer],
view: view
});We use the new operator to create an instance of the ol.Map class and pass it an object literal containing several options, namely, target, view, and layers. We've used these before in the previous examples without really explaining them or any of the other options we might want to use. Here's the full list of available options and what they do:
|
Name |
Type |
Description |
|---|---|---|
|
|
|
Controls are covered in detail in Chapter 7, Wrapping Our Heads Around Projections; so, we don't need to go in-depth here. We can define our map's controls when we create the map object by specifying them with this option, or we can add them via the |
|
|
|
The
|
|
|
|
Interactions are used by the map to handle browser events, such as the user clicking or dragging on the map. The map passes browser events to each of its interactions in sequence, allowing each to determine whether it should take action and whether it should consume (stop further processing of) the event. The order of interactions is important—if an interaction consumes a browser event, subsequent interactions will not see the event. Interactions are closely related to controls and are discussed in more detail in Chapter 8, Interacting with Your Map with controls. The default interactions, if this option is not provided, are |
|
|
|
This option indicates which HTML element will be used to receive keyboard events for interactions that use them (such as |
|
|
|
The |
|
|
|
This controls the display of the ol3 logo in the map, |
|
|
|
The overlays option defines which overlays will be added to the map initially. We will review them thoroughly in Chapter 8, Interacting with Your Map. |
|
|
|
The number of physical pixels per screen pixel, normally computed automatically. |
|
|
|
The
We'll discuss what these actually mean a little further on in this chapter. |
|
|
|
The target identifies the HTML element in which the map will be drawn on the web page. In all our examples, we pass a string value that matches the |
|
|
|
The |
By default, OpenLayers draws, or renders, the map in the browser using an HTML 5 canvas element and its associated 2D drawing context. This is known as the Canvas renderer. However, OpenLayers actually comes with three renderers. The ability to choose a different renderer for the map can be very powerful but it should also be used with care. Each renderer has some specific capabilities and limitations. In particular, only the Canvas renderer is considered stable at the time of writing this book.
The Canvas renderer draws the map's contents onto an HTML 5 canvas element (http://en.wikipedia.org/wiki/Canvas_element). The canvas element is a high-performance 2D drawing surface supported by all modern web browsers (on Internet Explorer, Canvas support starts with version 9). The canvas renderer is the most fully supported renderer in OpenLayers. It does not support some of the advanced features of the WebGL renderer, including 3D, controlling the contrast, brightness, hue and saturation of a layer, and other advanced capabilities requiring the power of WebGL.
You will most likely want to use this renderer until WebGL is more broadly supported, unless you are building an application that can target browsers that specifically support WebGL.
WebGL (http://en.wikipedia.org/wiki/WebGL) is a powerful technology that gives the web browser access to hardware-accelerated 2D and 3D graphics rendering, normally available only to desktop software, typically games. With this renderer, OpenLayers will be able to efficiently render a lot of vector and raster data simultaneously. At the time of this writing, rendering of vector data with WebGL was still in development and not yet available.
It even provides the ability to render data in 3D and give full 3D navigation. Given how fantastic all this sounds, why wouldn't you use it all the time? Unfortunately, WebGL support in a browser is dependent on two things. First, the user's computer must have a graphics card and software drivers that are capable of supporting it. Second, the web browser itself must support it. Since WebGL is a relatively new specification, only the newest versions of Google Chrome, Safari, and Firefox will enable WebGL on systems with capable hardware. Internet Explorer up to version 10 does not provide WebGL support at all, although there are third-party plugins that can be added by users to provide it. Finally, mobile browser support is very limited and varies widely at this time.
In summary, the WebGL renderer can give your application amazing performance and some cutting edge capabilities if your intended users can be relied on to have the latest web browser versions and capable hardware. It isn't suitable if you need to support older web browsers, Internet Explorer, or mobile users.
The DOM renderer draws the map's contents using HTML elements (<img> and <div> tags) and uses CSS to position them. This renderer is supported by older versions of most browsers, including Internet Explorer 8. However, it does not provide many of the capabilities enjoyed by the Canvas renderer. Of the features that it does not support, the most important is vector support covered in Chapter 6, Styling Vector Layers. The DOM renderer will also generally exhibit poorer performance.
There is some effort being undertaken by community members to provide some vector capabilities for the DOM renderer, including support for Internet Explorer 8, but in general, you will probably not want to use the DOM renderer unless you need to support older browsers that do not provide Canvas support.
Let's modify our example and add a renderer option to see what happens:
The inspector is highlighting the HTML element used to render the map. In this case, that element is the <canvas> element. This element is used for both the WebGL and Canvas renderers. Let's see what happens when we change the renderer.
var map = new ol.Map({
target: 'map',
view: view,
layers: [layer],
renderer: 'dom'
});Now, we see a lot of <img> elements. By choosing the DOM renderer, we have asked OpenLayers to use a different way of presenting the map in the browser. OpenLayers now creates a new <img> element for each map tile coming from the remote server and positions it next to the others to create the complete map.
In Chapter 2, Key Concepts in OpenLayers, we introduced the concept of observable, or KVO, properties and how they can be used. Here are the KVO properties of the Map class:
All properties on the Map class, and all other classes in OpenLayers that inherit from ol.Object, can be used with the KVO methods described previously.
In this example, we'll use the target property to move the map around in our web page:
<div> tag for the map and a <button> tag after the <input> element we added for the bindTo() example. Change the class of both <div> tags to half-map—this class tells the <div> tag to only take up to 50 percent of the width of the page. When the user clicks the button, we'll move the map between the two <div> tags:<div id="map" class="half-map"></div> <div id="map2" class="half-map"></div> <input type="checkbox" id="visible" checked> Toggle Layer Visibility <button onclick="changeTarget();">Change Target</button>
<script> element that contains our new code, right after the code we added in the bindTo() example. The function will first call map.getTarget() to get the ID of the element that the map is currently in. If the ID is map, then we set the target to map2; otherwise, we set it to map:function changeTarget() {
var target = map.getTarget();
if (target == 'map') {
map.setTarget('map2');
} else {
map.setTarget('map');
}
}When you click the button, the changeTarget() function is called. This function uses getTarget() to find out which element the map is rendered in and setTarget() to move it to the other map element.
Moving the map between two HTML elements is really a contrived example to illustrate how the methods work. A more likely use of these methods might be to show and hide the map entirely. Try changing the above example to show and hide the map, rather than moving it. Also, try using get() and set() instead of getTarget() and setTarget() methods.
The Map class, being the central organizing point for OpenLayers, provides methods for managing many aspects of the map. As there are quite a few methods, we've grouped them into some logical groups—Control methods, Interaction methods, Layer methods, Overlay methods, Rendering methods, Conversion methods, and other methods.
These methods are used to manage Controls associated with a map. Controls are covered in more detail in Chapter 9, Taking Control of Controls; so, we won't go into any detail here:
These methods are used to manage interactions associated with a map. Interactions are covered in more detail in Chapter 8, Interacting with Your Map; so, we won't go into any detail here:
The methods are used to manage layers in the map. Layers can also be managed through the layergroup property but these methods are a bit easier to use:
These methods are used to manage overlays associated with a map. Overlays are covered in more detail in Chapter 8, Interacting with Your Map; so, we won't go into any detail here:
When we programmatically change the map's view (which we'll discuss at the end of this chapter), the state of the map changes and a redraw of the map is scheduled. This means that if we change the center of the view from London to New York, the map will re-center on New York and fetch tiles for that area and the screen will be updated almost instantly. This behavior can produce a jarring effect for the user. Fortunately, the Map class provides some ways to modify how the map will change state by using the beforeRender() method and how the map will appear using the render() and renderSync() methods.
The primary use of the beforeRender() method is to add animation effects to our map's navigation. After we add a function using beforeRender(), the map will call the function and allow it to update the state of the map. This function can be used to smoothly animate any of the view's state including location, level of detail, and rotation.
While the creation of animation functions is beyond the scope of this book, their use is straightforward, and OpenLayers provides some useful ways for creating animation functions for most common scenarios. Let's indulge ourselves in a bit of fun by exploring how to create and use them.
All the following methods take a single options argument with three common parameters: start, duration, and easing.
start: This is a number, the time in milliseconds to start the animation at. If not provided, the default is to start immediately. You can use the JavaScript Date object to get the current time in milliseconds, such as var start = (new Date()).getTime();. To specify a start time in the future, just add a number of milliseconds to this number; for instance, to start an effect one second from now, use var start = (new Date()).getTime() + 1000;.duration: This is a number, the duration of the animation in milliseconds, the default is 1000 (1 second).easing: This function is an easing function. An easing function is a function that computes a smooth transition for an animation. The default is ol.easing.inAndOut, which provides a smooth acceleration into and out of an animated transition. These are the built-in easing functions:ol.easing.bounce: This adds a bounce effect to the end of a transitionol.easing.easeIn: This smoothly accelerates the start of the transitionol.easing.easeOut: This smoothly decelerates the end of the transitionol.easing.inAndOut: This smoothly accelerates the start and decelerates the end of the transitionol.easing.elastic: This is similar to the bounce effectol.easing.upAndDown: This applies the transition, and then, reverses itIn addition to the three common options, each animation function has at least one additional property you can provide. Here are the functions with a note on the additional properties that can be passed. We'll try out these functions afterwards:
As you might guess, some of the built-in controls such as the zoom controls use these animation functions to create nice effects.
The best way to understand these animation functions is to try them out. Start from the previous example:
<button onclick="doBounce(london);">Bounce To London</button> <button onclick="doBounce(rome);">Bounce To Rome</button <button onclick="doPan(london);">Pan To London</button> <button onclick="doPan(rome);">Pan To Rome</button> <button onclick="doRotate();">Rotate</button> <button onclick="doZoom(2);">Zoom Out</button> <button onclick="doZoom(0.5);">Zoom In</button>
These are regular HTML buttons that call a function when clicked. We'll add the functions in a moment.
Rome, next to the line where we defined the location of London:var rome = ol.proj.transform([12.5, 41.9], 'EPSG:4326', 'EPSG:3857');
<script> tag to handle the button clicks. Start with the doBounce() function:function doBounce(location) {
var bounce = ol.animation.bounce({
resolution: map.getView().getResolution() * 2
});
var pan = ol.animation.pan({
source: map.getView().getCenter()
});
map.beforeRender(bounce);
map.beforeRender(pan);
map.getView().setCenter(location);
}doPan() function:function doPan(location) {
var pan = ol.animation.pan({
source: map.getView().getCenter()
});
map.beforeRender(pan);
map.getView().setCenter(location);
}doRotate() function:function doRotate() {
var rotate = ol.animation.rotate({
rotation : Math.PI * 2
});
map.beforeRender(rotate);
}doZoom() function:function doZoom(factor) {
var resolution = map.getView().getResolution();
var zoom = ol.animation.zoom({
resolution: resolution
});
map.beforeRender(zoom);
map.getView().setResolution(resolution * factor);
}London and Rome.Not too bad! In a few lines of code, we managed to create some pretty impressive animation effects using ol.animation functions and the Map's beforeRender() method.
In step 3, we created the doBounce() function. This function takes a single parameter, location, which is the location that we want to bounce to. The effect we want to achieve is to smoothly zoom out from our current location and then into the new location. We called ol.animation.bounce() to create a function that implements the bounce animation effect. For this example, we provided only the resolution property and let the other properties (start, duration, and easing) take their default values. We set the resolution property to two times the current resolution of the map's view. This is equivalent to clicking the ZoomOut control (the button in the top-left corner of the map with the minus sign) once. What this does is smoothly zoom out from the current resolution to the next zoom level, and then back into the current resolution.
Next, we created a function that implements the pan animation effect. Again, we used the defaults for start, duration, and easing by not specifying them and set the source property to the current center of the map's view. We added both bounce and pan functions to the map by calling beforeRender(); then, we changed the map's view to go to the location we passed into this function.
In step 4, the doPan() function takes a single parameter, location, and smoothly pans the map to it. To do this, we called ol.animation.pan() with the map's current center for the source as we did in the doBounce() function, then we told the map's view to go to the new location.
In step 5, the doRotate() function doesn't take any parameters; we just wanted to spin the map 360 degrees. We used the ol.animation.rotate() function for this and set the rotation option to specify how much to rotate. When we add this to the map using beforeRender(), the effect happens immediately.
In OpenLayers, rotation is always specified in radians. When we think about rotation, we normally think in degrees. To convert from degrees to radians, it is useful to remember that 180 degrees = PI * radians. We don't need to know the value of PI, JavaScript provides us with the useful constant, Math.PI. The formula to convert degrees to radians is var radians = degrees * Math.PI / 180;. The inverse is var degrees = radians * 180 / Math.PI;. In our example, we wanted to rotate the map 360 degrees. Using the formula above, this becomes 2 * Math.PI, which is the value we used.
Step 6 adds the doZoom() function. It takes a single parameter, factor, which is the amount to zoom. We used ol.animation.zoom() to create our animation function using the view's current resolution as our starting point. Then, we added our animation function and told the map's view to zoom to a new resolution by multiplying the current resolution by the factor parameter. A factor of two will cause the map to zoom out to the next zoom level and a factor of 0.5 will cause the map to zoom in to the next zoom level.
Now that we've seen how the basic animations work, try modifying the animation properties in each function to see how to change its parameters and overriding the default duration, start time and easing functions. You can also try combining the animations in different ways.
When we click on a web page, the browser generates a MouseEvent that contains, among other things, the position that the click happened at. This position is in pixels and is relative to the browser window. In an OpenLayers application, we will often want to respond to the user interacting with the map and it is important to understand these events specify the position in pixels. It is common to need to determine the geographic coordinate that corresponds to this position. OpenLayers provides several methods that allow us to convert between the browser's pixel space and geographic coordinates:
The map object contains a few other methods that don't neatly fit into the previous groups; so, we've included them here for completeness:
The standard KVO events beforepropertychange and change are available, as well as one event for each of the observable properties: change:layergroup, change:size, change:target, and change:view. Review the section on KVO in Chapter 2, Key Concepts in OpenLayers if you don't remember how these events work.
In addition to the KVO related events, however, there are quite a few new events that can be triggered from a map object. As with any other event, you can register for these events using the on() and once() methods discussed earlier. We'll group these events into browser events, map events, and render events.
The Browser events are all events that are provided in response to the user interacting with the map's HTML element. The available events are:
click: This event is fired once for every discrete click on the map. If the user double-clicks on the map, this event will be fired twice. If you want to distinguish between a click and a double-click, use the singleclick event instead.dblclick: This event is fired if the user double-clicks the map.pointerdrag: This event is fired when the user moves the mouse while holding down one of the mouse buttons.pointermove: This event is fired when the user moves the mouse.singleclick: This event is fired when the user single-clicks on the map. There is a short 250 ms delay after the click event before this event is triggered to ensure that the user is not double-clicking the map.Listeners attached to the Browser events will receive an object of the ol.MapBrowserEvent type that contains the following properties:
type – This is a string, MapBrowserEvent.map: The ol.Map is a reference to the map object on which the event happened.browserEvent: The DOMEvent is a standard browser event that was originally issued by the browser. This will contain information about the event (its position and what the user did—move, click, and so on) that you'd be usually looking for.frameState: This is an object representing the current frame state of the map.There are two events that are triggered when the map state changes.
Listeners attached to the map events will receive an object of the ol.MapEvent type, which contains the following properties:
There are two events that are triggered when the map is being rendered. These can be used to programmatically alter the appearance of the rendered map image in interesting ways:
precompose: This event is triggered when the map is rendered, just before all the layers will be drawn into the rendering context.postrender: This event is triggered when the map has completed rendering all the layers into the current rendering context. This is a very interesting event as it provides an opportunity to modify the canvas (for Canvas and WebGL renderers) after the map has been rendered. We'll explore this in Chapter 6, Styling Vector Layers when we discuss vector styling.Listeners attached to the render events will receive an object of the ol.render.Event type that contains the following properties:
type: This is a MapEvent stringtarget: The ol.Map is a reference to the map object on which the event happenedvectorContext: This is a rendering API capable of drawing to the contextframeState: This is an object representing the current frame state of the mapcontext: This is the 2D context associated with the canvas (if applicable)glContext: This is a WebGL rendering context (if applicable)The map object is the central component of an OpenLayers web application. It is a central place to add and remove things such as layers and controls, and bind them all together. The remaining chapters in the book will introduce you to these other things, but one of those bits is really very closely tied to the map object, and that is the view object. The view object provides the map with the information it needs to decide what location and level of detail—or zoom level—you are looking at. A view also has a projection (which we discussed in Chapter 2, Key Concepts in OpenLayers) that determines the geospatial reference system of the map.
OpenLayers currently provides a single View class, ol.View. This class represents a simple 2D view, which can be manipulated through three key properties: center, resolution, and rotation. We will create a new instance of ol.View in the same way that we create a map object, like the following:
var view = new ol.View(ViewOptions);
We've used views in all our examples because a view is a mandatory parameter when creating a new map instance, but we haven't discussed it in detail yet. Let's dive in.
The options you can use when creating a new ol.View instance are as follows:
It is important to understand what is meant by the term resolution and how the various view options related to resolution work together.
In the context of OpenLayers, the term resolution means the number of projection units per pixel. A projection determines how the real world, which is a sphere, is represented in 2D space. The definition of a projection includes a number of things, including a 2D coordinate system and an algorithm for converting real-world locations (latitude and longitude) to and from the projection's coordinate system. The projection's coordinate system is defined in a particular set of units, such as meters, feet, or even decimal degrees. The projection's coordinate system has a bounding box defined as values in the projection's unit system. When we say projection units per pixel, we mean a value expressed in the unit system of the projection.
The most zoomed out state of the map will render the bounds of the projection into a 256 x 256 pixel tile. This is considered the maximum resolution and can be calculated as the width of the projection's bounds divided by 256. When the map is at its most zoomed in, the minimum resolution can be calculated as the width of the projection's bounds divided by the number of tiles wide times 256. We yet don't know how many tiles are required to draw the map at the most zoomed in level; so, this has to be known or computed in some way.
The most zoomed out state of the map is, by convention, called ZoomLevel 0. When a user zooms in or out, they change to the next zoom level. Zooming effectively changes the number of tiles used to represent the projection's bounds. The default zoom factor is 2, which means that zooming in to the next zoom level doubles the number of tiles in the map (in each dimension) and halves the resolution. If ZoomLevel 0 is 1 tile (wide and high), then ZoomLevel 1 is 4 tiles (2 wide and 2 high). ZoomLevel 3 is 16 tiles (4 wide and 4 high). In fact, the number of tiles required for the width and height of any zoom level can be easily calculated as numTiles = 2 ^ zoom. Each zoom level has a resolution defined by the projection's bounds divided by the zoom level's width in tiles. For any given zoom level z, the resolution can be computed as resolution = projection width / (2 ^ z). Likewise, the zoom level equivalent to any resolution can be computed by rearranging the algorithm to z = log(projection width / resolution)/log(2).
When a view is configured, it needs to know a maximum and minimum resolution and a zoom factor for determining the resolutions between the maximum and minimum for zooming. The View class provides several options that are used together to determine the resolution constraints. Since zoom level and resolution can be computed from each other, the constraints can be determined in terms of resolution (maxResolution and minResolution), zoom levels (minZoom is equivalent to maxResolution, maxZoom is equivalent to minResolution), or some combination of these. OpenLayers uses the resolution options in preference to the zoom options if both are provided.
In practice, it is usually sufficient to define just the maxZoom or minResolution because minZoom defaults to 0 (the maximum resolution computed from the projection bounds).
As with the Map class, the View class has a number of KVO properties that have accessor methods (get and set), property binding, and events as discussed earlier:
The View class has several methods in addition to its properties:
We'll wrap up this chapter with a final update to our example by adding a second map and linking the two maps together.
<div> tags; it's the HTML that looks like this:<button onclick="changeTarget();">Change Target</button>
changeTarget(), as we won't need it any more.ol.Map and put it into the map2 <div> tag. Note that there is no view option!var map2 = new ol.Map({
target: 'map2',
layers: [layer]
});view property to the other map object:map2.bindTo('view', map);With a single line of code, we bound the view property of the two maps and were able to produce a pretty interesting effect. By itself, this doesn't do much that could be considered useful but it is the basis for building some interesting functionalities such as creating an overview map or a highlight map that shows the same area as a main map but at a different level of detail.
One thing you probably noticed with the previous example is that changes from one map aren't animated in the other one. This behavior is to be expected. If you recall, we mentioned in the animation section that programmatic changes are applied instantly. Since we aren't adding animation effects with beforeRender(), the changes applied from one view to the other happen instantly and the result is sometimes quite jarring.
Use the knowledge you've gained in this chapter to adapt the previous example into something more useful. Try to make the second map respond to changes in the first map, but zoomed out three times. Remember that zooming out once is equivalent to doubling the zoom level. When the page loads, it should look like this:
When the first map is panned or zoomed, the second map should center on the same location and stay zoomed out in three levels. The second map should not have any controls or interactions—set both the controls and interactions option to new ol.Collection() to achieve this.
Let's do a series of questions to see what you understood during the chapter:
Q1. I want to start my map looking at a specific location and level of detail. Which object is responsible for this?
Q2. I want to take some action when the user pans the map. What event should I listen for?
moveendzoomendQ3. Which object files this event?
Q4. I want to update a property called center of the view object when the center property on another object obj, changes. Which class provides the bindTo() method that I'll use?
ol.Mapol.Viewol.ObjectThis brings us to the end of the Map and View classes. We covered a lot of detail in these two classes and also uncovered some of the common methods used throughout the OpenLayers library that will help us work with events and key-value observing. We tried out many of the methods in various examples.
In the next chapter, we'll dive into raster layers and discover how to add various types of raster data sources to our OpenLayers applications.
Web maps are very popular today, and are growing in popularity. After Google Maps was introduced, there was an explosion of interactive web maps. Google provides an API to interact with its mapping service, as others do now, and OpenLayers works well with most of them. Not only can we use these third-party APIs with OpenLayers, we can also mash up other layers on top of them. Those services are the most popular, but they suffer from bottleneck depending on your web mapping application. So, you need to know mainstream API and alternatives to display raster images.
In this chapter, we will learn the following:
A layer is basically a way to show multiple levels of information independent of each other. Layers are not just a mapping or cartography concept; graphic designers and digital artists make heavy use of layers.
Imagine a printed map of a city. Let's say you also have two sheets of transparent paper. One sheet has blue lines that indicate bus routes, and the other sheet contains green lines that indicate bicycle routes. Now, if you placed the transparent sheet of paper with bicycle routes on top of the map, you will see a map of the city with the bicycle routes outlined.
Putting on or taking off these transparent pieces of paper will be equivalent to turning a layer on or off. The order you place the sheets on top of each other also affects what the map will look like—if two lines intersect, you will either see the green line or the blue line on top. This is the basic concept of a layer.
OpenLayers is a JavaScript library, and as discussed earlier is built using Object Oriented Programming (OOP). When we want to actually create a layer, we will create (or instantiate) an object from an ol.layer.Layer subclass.
OpenLayers has many different ol.layer classes. The layer types are only for different kinds of data (tiles, images, and vector). Using an attached ol.source.* will allow you to connect to a different type of map server 'back end.' Each layer object is independent of other layer objects; so, doing things to one layer won't necessarily affect the other.
How many layers can I have?
The safest maximum amount of layers you can have on a map at one time depends largely on the user's machine (that is, their processing power and memory). Too many layers can also overwhelm users; many popular web maps (for example, Google and Yahoo!) contain just a few layers. We recommend that you don't use a lot of layers or limit the number of layers that you can turn on at the same time. Adding layers is cheap but making composition of the map image is expensive, particularly with Canvas renderer. If you turn on many layers at the same time, you will end up with an unusable map, whereas if only some of them are turned on, you will have good performance. You also need to be aware that using vector layers instead of raster layers is better for composition performances.
Whatever the purpose of your web map application is, you will need at least one layer to have a usable map. An OpenLayers map without any layers would be like an atlas without any maps. You need at least one layer—at least one base layer. All other layers that sit above the base layer are called overlay layers. The concept inherits from the existing OpenLayers 2 series and was seen in Chapter 1, Getting Started with OpenLayers.
A base layer is at the very bottom of the layer list, and all other layers are on top of it. This would be our printed map from the earlier example. The order of the other layers can change, but the base layer is always below the overlay layers. By default, the first layer that you add to your map acts as the base layer. You can, however, change the order of any layer on your map to act as the base layer.
You can also have multiple base layers. Although you can set more than one base layer active at a time, for visual readability, most of the time, you only use one.
Any layer that is not a base layer is called an overlay layer. Like we talked about earlier, the order that you add layers to your map is important. Every time you add a layer to the map, it is placed above the previous one.
After this reminder about layers concepts, see what's happening at the OpenLayers 3 library level inheritance to discover the main layers type.
There are two types of layers: raster and vector layers. The main differences between both are:
PNG or JPEG. They can be generated on server-side or are static. In most cases, your browser doesn't manipulate them but only consumes them.To give you an overview of layers organization at the library level, let's look at the following diagram:
When you are creating a new web mapping application, you have to make a choice between benefits and drawbacks of those layers. For raster, it's mainly that images do not overload the browser as vector layers mostly can. As you can see in the diagram, raster layers such as vector layers are derived from a common ol.layer.Layer class. This ol.layer.Layer class inherits from an ol.layer.Base class, (base in this case means common behavior between layers). This class is also inherited by an ol.layer.Group class designed to group layers to treat them as a single layer. In our case, we will focus mainly on the two raster layer classes, ol.layer.Image and ol.layer.Tile. We will also do a review of the common ol.layer.Layer methods. Moreover, you can divide raster in two categories: tiled or untiled. We will cover both types in this chapter. The ol.layer.Vector class will be covered in Chapter 5, Using Vector Layers.
All raster layers inherit from ol.layer.Layer.
The following table is the list of available properties. You can also use them with vector although it's not required in this chapter:
|
Name |
Type |
Description |
|---|---|---|
|
|
|
This property sets the layer brightness. See Wikipedia webpage (https://en.wikipedia.org/wiki/Brightness) for more information. |
|
|
| |
|
|
|
This property sets the layer hue. You can discover more about hue with the Wikipedia page, https://en.wikipedia.org/wiki/Hue. |
|
|
|
This property sets the layer opacity. Possible values are between |
|
|
|
This property sets the layer saturation. See the dedicated Wikipedia article (https://en.wikipedia.org/wiki/Colorfulness) for more. |
|
|
|
This property defines the source for the layer. Sources are a way to access a resource such as single, tiled images or geographic features. |
|
|
|
This property sets the visibility. The default value is |
|
|
|
This is the minimum resolution (inclusive) at which this layer will be visible. |
|
|
|
This is the maximum resolution (exclusive) below which this layer will be visible. |
You can use those properties to set layer properties at startup. If you need to change one of those properties after layer creation, you always have setters and getters. Getters, if you don't remember the part about JavaScript initialization, are methods of objects you can use to get properties. Setters are also methods but to set properties. The setter and getter for a property are derived from the property name. It starts with a get or set keyword followed by the property with the first letter using uppercase. For example, for opacity, the getter name is getOpacity and the setter name is setOpacity.
You also have some methods that are specific to ol.layer.Layer and not related to properties.
The following are the main methods. We will not cover methods related to events: the ol.layer.Layer inherits from ol.Object via ol.layer.Base (http://openlayers.org/en/v3.0.0/apidoc/ol.html). It's because we already explained how events works within Chapter 2, Key Concepts in OpenLayers.
Let's try to play with the simplest cases.
Follow these steps to change layer properties:
Use the example derived from the first example from Chapter 1, Getting Started with OpenLayers, also available at chapter04/2360_04_01_changing_layer_properties.html:
<!doctype html>
<html lang="en">
<head>
<title>Simple example</title>
<link rel="stylesheet" href="../assets/ol3/css/ol.css" type="text/css" />
<link rel="stylesheet" href="../assets/css/samples.css" type="text/css" />
</head>
<body>
<div id="map" class="map"></div>
<script src="../assets/ol3/ol.js" ></script>
<script>
var osmLayer = new ol.layer.Tile({
source: new ol.source.OSM(),
opacity: 0.6,
brightness: 0.2
});
var view = new ol.View({
center: ol.proj.transform([-1.8118500054456526, 52.4431409750608], 'EPSG:4326', 'EPSG:3857'),
zoom: 6
});
var map = new ol.Map({
target: 'map'
});
map.addLayer(osmLayer);
map.setView(view);
</script>
</body>
</html>ol.source.Source from the osmLayer:console.log(osmLayer.getSource());
osmLayer.setProperties({opacity: 0.4, contrast:0.6});
console.log(osmLayer.get('contrast'));
console.log(osmLayer.get('opacity')); osmLayer.setProperties({opacity: 0.7, contrast:0.3});
console.log(osmLayer.getOpacity());
console.log(osmLayer.getContrast()); osmLayer.set('opacity',1);
osmLayer.setContrast(1);
osmLayer.setBrightness(0);
osmLayer.set('myId', 'myUnique');
console.log(osmLayer.get('myId'));We reviewed how to manage main methods attached to the ol.layer.Layer subclass (remember that ol.layer.Tile inherits from it).
The interesting thing here, is that you are able to manipulate and create generic properties for all the ol.layer.Layer subclasses.
The most common operations on layers have their custom getters/setters such as getVisible() / setVisible(property), but you can replace them with the ol.layer.Layer getters/setters, get('visible')/set('visible', property). These are inherited from ol.Object, and consequently, ol.layer.Tile inherits them too. In the normal case, you use these getters/setters only for arbitrary properties we want to add, such as a name.
Another benefit you may not be aware of is that when you add new properties to a layer object, you can attach information for new applications related to layers. For example, you can set a property to reference metadata for the layer (intellectual properties, license, link to a PDF file to download, or more). Some other ways to use it are to define groups, set a unique identifier, set a display name to reuse in a custom layer manager, and set a reference to a legend resource (URL, image, and so on).
The possibilities are endless.
Now, after this short introduction to manage layer properties, we will review different raster layers and also the source property. It's mainly these elements that make the difference between raster layers in the OpenLayers 3 library.
We mentioned earlier that there are two types of raster layers: tiled and untiled.
Before sharing ideas about tiling, the first thing to do is define tiling. According to Wikipedia, https://en.wikipedia.org/wiki/Tiled_rendering, it can be considered as the process of subdividing an image by regular grid.
So, why is this needed? Again, like for Closure Tools, it's for web performances. You can review about Closure tools in more detail in Appendix B, More details on Closure Tools and Code Optimization Techniques. Raster data and layers are built from other images or from vector data. The idea here with tiles is to balance the time for data processing and the time for transferring the resource (the image) through the network. It's also because using a regular tile grid can be cached, both by the browser and by the server.
Imagine that you require a complex layer. Would you want to wait for five minutes until it renders? (Rendering is the process to generate an image from geographic sources).
The following table shows a summary of pros and cons for using tiled, untiled resources:
To summarize, if you want performance with less flexibility, choose tiled raster, and if you need fresh data and your layers are based on one or two data sources, choose untiled raster. You can also make a mix of both solutions: use tiles at some levels and untiled content at other levels. Another difference we don't really show in the table for tiles, is that you can pregenerate image tiles for an upper level (such as the country level or lower) and choose to generate tiles on the fly only for lower levels (the street level). Depending on the context, you don't choose: you have to connect to a third-party map server where the choice is restricted to the available web services / images.
The purpose of this comparison is to help you understand how to make a good decision concerning the required layers you have to choose. OpenLayers 3 is only a client-side library; however, knowledge about the principle to provide layers is a requirement to use it well. Also, you may need to host, or own, your map server to serve raster data.
If you ever need to serve your own tiles or raster data, you can take a look at the following open source software:
Geoserver: http://geoserver.org
It is a server software that allows you to serve maps and data from a variety of formats to standard clients such as web browsers and desktop GIS programs.
Mapnik: http://www.mapnik.org
It's a toolkit for rendering beautiful maps, with clean, soft feature edges provided by quality anti-aliasing graphics, intelligent label placement, and scalable, SVG symbolization. Most popularly, Mapnik is used to render the OpenStreetMap main map layers.
Mapserver: http://www.mapserver.org
It is an open source geographic data rendering engine written in C. Beyond browsing GIS data, MapServer allows you to create geographic image maps, that is, maps that can direct users to web content. Like GeoServer, it allows map publications via Open Web Standards.
Degree: http://www.deegree.org/
Degree is open source software for spatial data infrastructures and the geospatial web. It shares with GeoServer and Mapserver the ability to serve map via Open Web Standards.
We can also mention that there are map proxy applications such as MapCache http://mapserver.org/mapcache/, GeoWebCache http://geowebcache.org, or MapProxy http://mapproxy.org.
Their important purposes are creating tiles for dynamic web server, caching requested map images using GeoServer, MapServer, Mapnik, Degree, or any other map servers.
So far, we focused on the differences between tiled and untiled, but you also have some differences coming from the source property.
So, how can we define a source? What is its purpose?
Sources in OpenLayers 3 language define how and where you can access the layer. You always need a source from an ol.source subclass in order to retrieve and display layers.
Why did OpenLayers 3 development team invent this concept?
It was mainly for the organization of the code and reusability of the same principles. You gain modularity because you have only three types of layers but more sources. It enables you to decouple the type of layer you are using from the data source and the way you call it. It's simpler to manage a new source than to create a new layer by example if a new source appears.
You can see in the following diagram that ol.source.Source has three main child subclasses, ol.source.Vector, ol.source.TileSource, and ol.source.ImageSource.
They are abstract classes. It means, they work as a skeleton for all types of sources but are never directly used:
Most of the layers we are manipulating are inherited from the past.
Web-based maps are commonplace today. The catalyst for the explosive growth of web maps was the introduction of Google Maps. Web maps existed before, but they were not quick or developer friendly. In June 2005, Google released an API for Google Maps, which provided a frontend client (the role OpenLayers plays), along with an access to the backend map server via their frontend client API.
This allowed anyone to insert not just a Google Map on their site, but also allowed them to add in their own point data and manipulate the map in other ways. Google Maps grew in popularity, and other companies such as Microsoft, Yahoo, MapQuest, MapBox, Nokia, and others followed in their footsteps, creating their own web mapping APIs.
Most of them are more likely to make mashups.
The term mashup refers to an application that combines various different data sources and functionality together. A map mashup is a map that combines different layers and data. Third-party mapping APIs, such as MapQuest and Microsoft Bing Maps, allow people to more easily create these map mashups. For example, a map with an OpenStreetMap base layer overlaid with markers that track places you've traveled to can be considered a map mashup.
OpenLayers did not introduce map mashups, but it allows us to create very powerful ones with ease. Combining an OpenStreetMap layer, a WMS layer, and a vector layer is pretty simple with OpenLayers.
OpenLayers 2 had some third-party mapping APIs embedded into its core, enabling you to use its maps inside your Openlayers-based application. Nowadays, for better decoupling of OpenLayers API from third-party APIs, the OpenLayers 3 team choose to have no support for other mapping APIs that tie together tiles and an associated JavaScript API library.
Why this decision?
One of the main goals of OpenLayers 3 was to rewrite OpenLayers 2, making its API cleaner. The support for Google Maps API in OpenLayers 2 has also put a significant maintenance burden on both library and application developers, to keep up with changes of the Google Maps API. To avoid this in OpenLayers 3, the support for Google Maps using Google Maps API is nonexistent. However, Google does provide its tiles independent from their API, but only to paying customers. Fortunately, you have more alternatives to Google Maps API. We will try to show you that Bing (Microsoft) Maps (with its tiles service) or OpenStreetMap and its derived map images' data services API such as MapQuest can fill the missing provider.
Now, it's time to review all the tiled layers, in particular, to use beautiful background layers for your maps.
All tiled layers share some common properties. They inherit from the ol.source.TileImage. Those common properties are quite useful for other ol.source.* that inherit from it, for example, in some cases to put a logo or give attributions (also called credits) for the maps data and/or tiles. You have to be careful in the API docs online as these properties are considered unstable. You have to uncheck the Stable Only checkbox on the top banner. Unstable doesn't mean that you don't have to use those properties but that they may change with future OpenLayers releases. It's very useful for application developers to see what they may need to use or migrate in the future. See the following table for further information:
The most important functions are mostly those that do not start with the word tile. The tileClass, tileGrid, tileLoadFunction and tilePixelRatio exist but we choose to not cover them as they seem out of the scope for beginners; they help setting access to backend with particular tile grids. Along this book, we will sometimes refer to source as layer but it means a layer with the source adapted for a particular backend.
OpenStreetMap (OSM) is a free, Wikipedia style map of the world driven by user contributed content. You are able to use your own OSM tiles or ones provided through the OpenStreetMap servers.
Setting up an OpenStreetMap service and tiles yourself is not too difficult, but it is outside the scope of this book (visit http://switch2osm.org for more information on this). Accessing OSM with OpenLayers, however, isn't.
More information on the OpenStreetMap project can be found at http://www.openstreetmap.org. To access OpenStreetMap, only using the ol.source.OSM constructor without any options is enough. In the previous examples, we were already using this source, so we will not give you another similar example.
Though using constructor without options can be enough, you can also use other properties. The default constructor code uses the publicly available OSM tiles, but it is easy to point it at your own tiles. To do so, create the layer in this format:
var osmLayer = new ol.layer.Tile({
source: new ol.source.OSM({
url: 'http://{a-c}.tile.opencyclemap.org/cycle/{z}/{x}/{y}.png'
})
});To use this, you will have to replace http://{a-c}.tile.opencyclemap.org/cycle/ with the server hosting your OSM tiles. {z}, {x}, and {y} are variables that OpenLayers will replace with the appropriate values to reference specific map tiles.
The {a-c} parameters mean to say you can access tiles using these URLs:
http://a.tile.opencyclemap.org/cycle,
http://b.tile.opencyclemap.org/cycle,
http://c.tile.opencyclemap.org/cycle
This behavior comes from restrictions from your browser: you can't simultaneously ask images from a same domain. It can only request a certain number of resources from the same domain simultaneously, usually 2 or 4. Using subdomains is a way to bypass this limit and speed up the map displaying.
If you have different sources for tiling, it is not only to provide different URLs to access different map images. The way tiling is done depends on established standards.
For example, Stamen layers, OpenStreetMap layers, and MapQuest layers are using the same tiling convention, whereas WMTS (Web Map Tile Service) can adopt other patterns to display tiles. These patterns are set with the ol.tilegrid.TileGrid object that describe for each arbitrary zoomlevel how the tiles are split.
The rules are the following. In reality, the Earth is not a sphere, but in this case, our planet is assimilated to a sphere because we are using Spherical Mercator projection (mainly known as EPSG 900913 or EPSG 3857). Do not worry about projections at the moment, we will review them in a later chapter as it can be a difficult topic to understand.
The entire sphere is projected on a single square at the 0 level. Then, for each zoom, you increase a level and for each tile at the previous zoom, we get 4 tiles at this one.
With the preceding diagram, you will know how to access a tile covering East Europe such as Poland at the 3 level. The URL always looks like URL_TO_TILES/level_z/x_in_grid_for_level/y_for_grid_in_level.png. So, for Poland that has a zoom level 3, x equal to 4, an y to 2, the URL could be http://b.tile.openstreetmap.org/3/4/2.png or http://c.tile.openstreetmap.org/3/4/2.png to get the right tile.
This source enables your layer to consume OpenStreetMap data and customize OpenStreetMap specific properties.
The constructor is ol.source.OSM and its properties can use following options:
MapQuest was, until around 2008, the leading provider for web mapping API. With the entry of Google Maps, the leadership was lost. In 2010, the company chose to change its position concerning web mapping API, by choosing to exclusively rely on OpenStreetMap data to do the job.
Two layers are available freely. They also provide other services such as their own web mapping API. You can get further information at the Open developer part website at http://developer.mapquest.com/web/products/open/.
The MapQuest source class refers directly to the MapQuest tiles server URL.
The constructor is ol.source.MapQuest.
You are only required to use the source constructor included in an ol.layer.Tile object to add the layer. There are only two options' properties. The first one is the layer. It can take values such as osm (roads), sat (satellite), and hyb (hybride) depending on the tiles you want to display. The other property tileLoadFunction will not be covered here: it's not a common requirement for beginners and we already listed it in the ol.source.OSM. At least, you just need to know that it helps change call to tiles with rules defined in your code.
setVisible to be able to see one layer and hide it to show the other underlying layer.You will get something like the following screenshot if you center on the Statue of Liberty and use the MapQuest OSM layer:
The Stamen layers were named so after a company. To cite the OpenstreetMap wiki, Stamen (http://stamen.com) is a San Francisco design and development studio focused on data visualization and map-making. These layers extensively use OpenStreetMap data in many of their map visualizations and have provided three CC-BY OpenStreetMap tilesets: Toner, Terrain, and Watercolor. You can see how the styles look at the official demo website, http://maps.stamen.com.
Follow these steps to create a Stamen layer:
var stamenLayer = new ol.layer.Tile({
source: new ol.source.Stamen({
layer: 'toner'
})
}); var map = new ol.Map({
layers: [stamenLayer],
target: 'map',
view: new ol.View({
center: ol.proj.transform([2.35239, 48.858391], 'EPSG:4326', 'EPSG:3857'),
zoom: 12
})
});The map we've just created shows a black and white Stamen layer. You can look at other available layers for Stamen, the list is available just after the Stamen Layers' properties below.
Stamen source class refers to the beautiful tiles from Stamen. You can declare their source using the following content.
The constructor is ol.source.Stamen.
We will not review all properties, as most of them are configured by default. You can refer to the API docs at
http://openlayers.org/en/v3.0.0/apidoc/ol.source.Stamen.html.
The most important property to remember is the layer where you set the name of the available layer you want with:
new ol.source.Stamen({
layer: 'toner'
})
You will find all the available layers names derived from the three Stamen layers in the following table, their image type, and their default state. Be careful, particularly when you are using the .jpg images and the opaque property option together, the .jpg image format is unable to work with transparency. Refer to the following table for further information:
|
Name |
Extension |
opaque |
|---|---|---|
|
terrain |
|
true |
|
terrain-background |
|
true |
|
terrain-labels |
|
false |
|
terrain-lines |
|
false |
|
toner-background |
|
true |
|
toner |
|
true |
|
toner-hybrid |
|
false |
|
toner-labels |
|
false |
|
toner-lines |
|
false |
|
toner-lite |
|
true |
|
watercolor |
|
true |
Microsoft provides an interface to their mapping services as well. Their mapping service previously was referred to as Virtual Earth, but they have since rebranded it as Bing Maps. The official Microsoft documentation can be found at http://msdn.microsoft.com/en-us/library/dd877180.aspx.
Bing Maps tiles can be viewed using the official Bing Maps API, but they can also be used through an API that gives direct access to their tiles. This is what we will see now:
style property but also the key. Contrary to the previous examples, a tile access control is done and works through an account associated with a key to use in your code: var sourceBingMaps = new ol.source.BingMaps({
key: 'AibU6zHqoTPYDuNRtHPMJq557poKb9AVTIJ0NWWnNZf8LfoRRwoigHTQ0Frrsr5m',
imagerySet: 'Road',
});ol.layer.Tile layer: var bingMapsRoad = new ol.layer.Tile({
source: sourceBingMaps
}); var bingMapsAerial = new ol.layer.Tile({
source: new ol.source.BingMaps({
key: 'AibU6zHqoTPYDuNRtHPMJq557poKb9AVTIJ0NWWnNZf8LfoRRwoigHTQ0Frrsr5m',
style: 'Aerial',
})
}); var map = new ol.Map({
layers: [bingMapsRoad, bingMapsAerial],
target: 'map',
view: new ol.View({
center: ol.proj.transform([6.562783, 46.517814], 'EPSG:4326', 'EPSG:3857'),
zoom: 13
})
});To make the example work, it's required to put your file on a web server. It can be Apache, but with Python, you can simply do it in the command line in your demo file root directory:
python -mSimpleHTTPServer
Next, open your browser to http://localhost:8000/sandbox/your_file_name.html.
Another way can be to use the node index.js command (if you downloaded the samples code) and open http://localhost:3000/sandbox/your_file_name.html.
Also, you don't have the obligation to create an API key when you are on your local machine. The one used in this book works only when using localhost or the official book website at http://openlayersbook.github.io.
We just made a map using the Microsoft Bing Map tiles' API. It works similar to the OpenStreetMap tiles layers but required to be authenticated. We can communicate with Microsoft tiles API server and use different properties. Let's go over the properties, as there are some that the other third-party sources do not provide.
Bing Maps source helps you consume Bing tiles representing road and imagery in your layer.
The constructor is ol.source.BingMaps and the following table is for the options:
|
Name |
Type |
Description |
|---|---|---|
|
|
|
It is the language and the localization you want to display for your labels. The supported Culture Codes for each style are listed in the official Microsoft documentation at http://msdn.microsoft.com/en-us/library/hh441729.aspx. |
|
|
|
This is the Bing Maps API key. Get yours at http://bingmapsportal.com. |
|
|
|
This is a type of imagery. It can be |
|
|
|
The TileJSON format was invented by MapBox, another company providing OpenStreetMap related services. It relies on JSON notation.
According to the specification, TileJSON is an open standard for representing map metadata. Its main goal is to reference the name, the attribution, the server URL, the minimum and max zoom, the center, the bounds, and the scheme of the tile (for OSM, numbering go top to bottom but other tiles' systems start numbering upwards). You can see all available parameters looking at the official specification at https://github.com/mapbox/tilejson-spec.
As it is not the mainstream way to get tiles, although it's a smart way, we will not review it through an example but directly advise you to go the official demo available at http://openlayers.org/en/v3.0.0/examples/tilejson.html and look into the code.
TileJSON source permits you to display in a tiled layer custom tile. You can declare their source using the following constructor:
ol.source.TileJSON
You can also review the available properties, particularly the required URL parameter on the official API docs at http://openlayers.org/en/v3.0.0/apidoc/ol.source.TileJSON.html.
The WMTS layer is based on the WMTS standards. The specification defines it as The Web Map Tile Service described in this standard builds on earlier efforts to develop scalable, high-performance services for web-based distribution of cartographic maps.
A WMTS-enabled server application can serve map tiles of spatially referenced data using tile images with predefined content, extent, and resolution.
This type of layer is quite different from most of the previous tiled layers we've seen. WMTS layers are more customizable. You can make a request to get tiles in custom projection, you can also choose your grid without caring about the implicit rules, that each tile when you zoom it will give you four tiles, as illustrated with the following figure:
It's really not the most common tiles layer, but you can see it as the most efficient tile system for custom requirements. You can better choose your level of tiling or you can also use custom tile size. For example, for mobile, a smaller tile with 64 pixels for its side can be used instead of the standard 256 pixels size. We recommend, if you are curious, to see the official examples at http://openlayers.org/en/v3.0.0/examples/ using the WMTS keyword. We will not be covering the details here. You can learn more about the standard itself by going to the official dedicated web pages at http://www.opengeospatial.org/standards/wmts.
You also need to understand that one of its main goals was to fill the issue for fast rendering contrary to OGC WMS standard as it can be cached.
WMTS sources are complex to declare. They require more parameters than other sources because of their flexibility. For example, the ability to customize for each tile levels grid means also as a drawback, complexity.
The constructor is ol.source.WMTS. To see its options, we recommend that you visit the official API docs at http://openlayers.org/en/v3.0.0/apidoc/ol.source.WMTS.html.
The DebugTileSource source is only a way to debug tiles rendering in OpenLayers 3. It doesn't use the tile numbering from the source but the internal that OpenLayers use. We just mentioned it to be exhaustive. You use it into a ol.layer.Tile class. You can look at the demo to learn more about it at http://openlayers.org/en/v3.0.0/examples/canvas-tiles.html. It can really help you to debug special grid, for example, in WMTS.
The TileDebugTile source enables you to display numbered grids to show how tiles are regrouped in the OpenLayers Canvas rendering. Canvas is a renderer to display a map in your browser.
The constructor is ol.source.TileDebug and for the options, you should visit the official API docs at http://openlayers.org/en/v3.0.0/apidoc/ol.source.TileDebug.html.
A WMS (Web Map Service) is a standard protocol for serving georeferenced map images over the Internet that are generated by a map server. You can watch the full reference at the official OGC (Open Geospatial Consortium) website, the organization managing this standard (http://www.opengeospatial.org/standards/wms).
The two versions of WMS available are 1.1.1 and 1.3.0.
WMS is dynamic: you can generate on the fly images.
So, why do I see a reference to a tiled WMS in OpenLayers 3?
It's just a way to lower charge on server-side—when you are generating small images, the process is faster, the memory cost does not really change as the number of requests increase, but you gain the ability to cache the tiles.
But wait, so why can't we use ImageWMS with WMS if we can have the advantage of both tiled (caching) and untiled system (freshness)?
We will not directly answer this right now, but will give you the hint in the section dedicated to ImageWMS.
You can refer to the official example to see a simple example as a reference at http://openlayers.org/en/v3.0.0//examples/wms-tiled.html.
To find out what projections a WMS service supports, you can make a getCapabilities request to the server. To make this request, specify the request, service, and version properties in the URL. For example, http://suite.opengeo.org/geoserver/wms?service=WMS&version=1.1.1&request=GetCapabilities.
You also have to be cautious. Here, we use the Version 1.1.1 version call but the specification supports two versions: 1.1.1 and 1.3.0. It's recommended to use 1.3.0 nowadays, but you can meet external WMS web services using only 1.1.1. Just use the VERSION parameter in the params options.
Tiled WMS source helps you set tiled WMS calls for your layer. The constructor is ol.source.TiledWMS and the options are listed in the following table:
Contrary to most components that are useful only in a map context, this component helps you to display any arbitrary images. It's really useful when you need to display a large image and want performances associated with tiles displayed and the usual interactions of mapping such as panning and zooming.
Some use cases can be game maps, discovery of scanned historical documents such as birth certificates for genealogy, or the old maps with no referencing, meaning that they do not overlay well with existing imagery and geographical data.
To make the ol.source.Zoomify component work, you will need to preprocess a large image to create tiles.
ZoomifyImage directory from the third step and generate the tiles for the image. It can take some time, so don't worry, although the program output is not verbose:
python ZoomifyFileProcessor.py path_to_dublin_map/1797-map-of-Dublin.jpg
ol3_samples/assets/data/ directory, the created folder from path_to_dublin_map/1797-map-of-Dublin/. <script> and </script> tags.http://openlayers.org/en/v3.0.0/examples/zoomify.js in your script block.ImageProperties.xml from ol3_samples/assets/data/1797-map-of-Dublin/ file and inspect the WIDTH and HEIGHT attributes from the IMAGE_PROPERTIES xml tag.imgWidth and imgHeight.url variable to /assets/data/1797-map-of-Dublin/ and change the zoom property in the view to 1 instead of 0.If you have some difficulty, do not hesitate to retrieve the file from samples.
We just made a map using images' tiles using Zoomify source with its particular grid.
The main particular thing to understand in the sample is to set a projection definition that uses image pixel coordinates, for example:
var proj = new ol.proj.Projection({
code: 'ZOOMIFY',
units: 'pixels',
extent: [0, 0, imgWidth, imgHeight]
});We use units' pixels instead of the more usual degrees or meters and the original image width and height are used to define the extent. Then, we use pixels as extent units, instead of meters or degrees.
The component retrieves each tile as we zoom in/out. To get an overview of this behavior, we recommend that you open the Network panel and play a bit with the demo.
Now, it's time to review untiled layers.
Although there are really less image layers' sources available than a tiled one, they are also useful depending on your goal or your backend.
We will start with the image WMS layer and then cover other types.
Like the tile layer WMS already reviewed, this component is also using the WMS standard to retrieve the map, imayer. The thing that differs here is that you add a layer using an ol.layer.Image constructor instead of the now more usual ol.layer.Tile and, your ol.source is ol.source.ImageWMS instead. Next, you just have to complete the parameters like for a tiled WMS.
Now, let's see why we need to use untiled WMS.
See the two following images coming from the official example when you zoom in. The first one comes from http://openlayers.org/en/v3.0.0/examples/wms-tiled.html. See the following screenshot:
The second image, as shown here, is the untiled one from http://openlayers.org/en/v3.0.0/examples/wms-image.html:
You can see that, particularly for labels, they are duplicated. This behavior is quite simple: each tile is requested separately in a tiled WMS. Most of the time the position of the label depends on the position of the object, but here you can request it more than one time because of your tiles. In conclusion, be careful to not use tiled WMS when you are using automatic labeling in WMS or you will suffer from labels' duplications.
After this functional review, let's inspect the WMS layer ImageWMS source class properties:
The constructor is ol.source.ImageWMS. Contrary to the tiled version, you can't call multiple URLs. The options are available as follows:
After this raster overview, it's time to review a bit more on how to combine those different layers in a big mashup. We will illustrate it combining the layers based on OpenStreetMap projection, the Spherical Mercator.
Getting other layers to play nicely with these layers involve three things. These rules are also available for others projections:
Using what we've learned so far, let's make a mashup. We'll use OSM derived layers with Bing Maps layer and put at the top a WMS layer. We will also set a small layer switcher (as there is no available component in OpenLayers core code for this).
To achieve your task, combine our knowledge and just follow these instructions:
<!doctype html>
<html lang="en">
<head>
<title>Playing with various sources and layers </title>
<link rel="stylesheet" href="../assets/ol3/css/ol.css" type="text/css" />
<link rel="stylesheet" href="../assets/css/samples.css" type="text/css" />
</head>
<body>
<div id="map" class="map"></div>
<script src="../assets/ol3/ol.js" ></script>
<script>
</script>
</body>
</html><script> tag. We add together two Bing Maps layers and add to them a name using set . We will reuse this parameter later:var bingMapsAerial = new ol.layer.Tile({
source: new ol.source.BingMaps({
key: 'AlQLZ0-5yk301_ESrmNLma3LYxEKNSg7w-e_knuRfyYFtld-UFvXVs38NOulku3Q',
imagerySet: 'Aerial'
})
});
bingMapsAerial.set(
'name', 'Bings Maps Aerial'
);
var bingMapsRoad = new ol.layer.Layer({
source: new ol.source.BingMaps({
key: 'AlQLZ0-5yk301_ESrmNLma3LYxEKNSg7w-e_knuRfyYFtld-UFvXVs38NOulku3Q',
imagerySet: 'Road',
culture: 'fr-FR'
})
});
bingMapsRoad.set(
'name', 'Bings Maps Road'
);var mapQuestAerial = new ol.layer.Tile({
source: new ol.source.MapQuest({layer: 'sat'})
});
mapQuestAerial.set('name', 'MapQuest Open Aerial');topp:states layer from the URL http://demo.boundlessgeo.com/geoserver/wms and various label layers back from the WMS server. We'll also set the opacity to 0.6, that is 60 percent opaque. The projection is not specified: it comes from the view and we know that the remote layer service available has the right projection (using getCapabilities). Go ahead and create the WMS layer and add again a name:var simpleWMS = new ol.layer.Image({
opacity: 0.6,
source: new ol.source.ImageWMS({
url: 'http://demo.boundlessgeo.com/geoserver/wms',
params: {
'LAYERS': 'topp:states'
},
extent: [-13884991, -7455066, 2870341, 6338219]
})
});
simpleWMS.set('name', 'USA layer from Geoserver WMS demo');var layers = [bingMapsAerial, bingMapsRoad, mapQuestAerial, simpleWMS];
map object, add into the layers object and the view too.var map = new ol.Map({
layers: layers,
target: 'map',
view: new ol.View({
center: ol.proj.transform([-90, 40], 'EPSG:4326', 'EPSG:3857'),
zoom: 3
})
});Now, we'll create a function with a special purpose: creating an HTML label tag and also and HTML input checkbox. It will have three parameters: one for the name, one to create an id for the HTML input, and the planned place where we want to create this checkbox:
function generate_checkbox(id_checkbox, label_name, html_element) {
var checkbox = document.createElement('input');
checkbox.type = "checkbox";
checkbox.id = id_checkbox;
var label = document.createElement('label');
label.htmlFor = id_checkbox;
label.appendChild(document.createTextNode(label_name));
html_element.appendChild(checkbox);
html_element.appendChild(label);
}ol.dom.Input and bindTo but don't bother about it at the moment:for (var i = layers.length - 1; i >= 0; i--) {
var id = layers[i].get('id');
var name = layers[i].get('name');
generate_checkbox('layer_id_' + i, name, document.body);
var visible = new ol.dom.Input(document.getElementById('layer_id_' + i));
visible.bindTo('checked', layers[i], 'visible');
};We just created a map using different tiles' layers with a WMS overlay. We also create, as a bonus, a simple but dynamic layer switcher. All the layers use the map's projection, EPSG:3857, and line up with the lower aerial Bing Maps.
We choose, for learning purposes, to only use the OpenLayers library code to manage layers display but an external component to the library is also available for this goal at https://github.com/walkermatt/ol3-layerswitcher. Try it on your own and enjoy! It will be a good opportunity to learn more about ol.layer.Group, we didn't really review until now.
After revising, it's time to see another source to display the image: the ol.source.MapGuide source.
We didn't review this server, although an open source version of this server is available at http://mapguide.osgeo.org, when we saw the various servers available to provide images for the OpenLayers 3 library. We chose to not cover it in detail, because this solution is not mainstream and beginners will not be able to dive deeper in to this complex solution.
You just need to understand that this image source is unusual and is mostly used by people coming from the CAD (Computer-aided design) world because this software was released as open source by AutoDesk, the leading company for 2D/3D drawing software.
There are some quite important differences to make an equivalent map version of the Zoomify sample. Let's see how:
sandbox directory./assets/data/1797-map-of-Dublin.jpg.imgCenter variable to [imgWidth / 2, imgHeight / 2];.var crossOrigin = 'anonymous';.ol.layer.Tile with ol.layer.Image.var source = new ol.source.ImageStatic({
attributions: [
new ol.Attribution({
html: '© <a href="https://commons.wikimedia.org/wiki/File:1797-map-of-Dublin.jpg#Summary">Wikipedia Commons</a>'
})
],
url: url,
imageSize: [imgWidth, imgHeight],
projection: proj,
imageExtent: proj.getExtent()
});You changed the center for the view by using a positive value for the second value in the imgCenter variable. It's because the ol.source.ImageStatic doesn't use the same origin as the ol.source.Zoomify.
We also set as an option, attributions referencing the credits to the Wikipedia Commons image.
The most important parts for configuration for the constructor are the url, imageSize, and imageExtent.
We also reused the projection based on pixels' units to set the projection for the source. As a reminder, you can inspect the available properties for the source.
The class helps to use any image as a layer using a pixel-based projection.
Its constructor is ol.source.ImageStatic. The constructor options are as follows:
To be complete, an ultimate source to review is the ol.source.ImageCanvas.
The ImageCanvas source is already an advanced topic, which is out of this book's scope; so, we will only explain its purpose.
If you remember, the default OpenLayers 3 behavior is to generate an HTML Canvas element to display the map image.
The purpose of ol.source.ImageCanvas is to help you inject in the HTML Canvas map element any arbitrary Canvas element. It's more flexible but the main drawback is the requirement to manage conversions between map units and the canvas element you want to add.
So, if you want to go further, you will need to learn Canvas drawing and also some projection calculations. At best, you will be able to integrate Canvas produced by other libraries. You also need to understand that a Canvas element can be built from vector elements and not only from raster images. It's a silly use case compared to the ideal separation between raster and vector layers.
Its constructor is ol.source.ImageCanvas. If you need it for a special purpose, the best way is to refer to the official documentation at http://openlayers.org/en/v3.0.0/apidoc/ol.source.ImageCanvas.html.
You can see it in action with D3 (another JavaScript library to generate graphic, charts, plots, and also maps), that can produce a canvas element you can use as a layer, as demonstrated in the official example at http://openlayers.org/en/v3.0.0/examples/d3.html.
For getting started with Canvas, use the Mozilla Developer part about the HTML 5 Canvas API at https://developer.mozilla.org/en-US/docs/Web/API/Canvas_API.
In this chapter, we quickly reviewed the layer structure inheritance, focusing on raster. Then, we talked about what raster data layers are, how they work, and what benefits you can get from using different sources to display your maps. We learned how to use the Microsoft Bing Maps layer, all API depending on tiles using OpenStreetMap data. We also discussed tiling in OpenStreetMap that use Spherical Mercator and how to create a map mashup with a layer switcher, mixing various layers and sources' types together. We didn't restrict the chapter to maps as it's possible to also use images unrelated to cartography.
In the next chapter, Using Vector Layers, we will see the concept of vector layer in-depth and the OpenLayers main classes for using them. Like for raster, you will discover not only their specific sources but also the various vector data formats and how to manipulate features and geometry.
Having explored raster layers, it's time to explore the other layer type that OpenLayers supports—vector layers. In this chapter, we'll introduce the vector layer and discover how to display and interact with vector data on the fly. We'll see how we can use vector sources to load vector data in a variety of formats. Through several hands-on examples, we'll explore the Format, Feature, and Geometry classes that are the foundation of OpenLayers 3 vector support.
In this chapter, we will cover using the vector layer class, ol.layer.vector, and some related classes to display vector data. Specifically, we'll:
In OpenLayers, the vector layer is used to display vector data on top of a map and allow real-time interaction with the data. What does this mean? Basically, it means we can load raw geographic data from a variety of sources, including geospatial file formats such as KML and GeoJSON, and display that data on a map, styling the data however we see fit. For example, take a look at the map that follows:
It shows a map with a Bing satellite raster layer and a vector layer on top of it. The vector layer loads data using the OSM XML Vector source and draws it in real time with different styles based on the type and attribute of each feature (the individual points, lines, and polygons). In this example, a small subset of the OSM data has been requested and is styled by OpenLayers to highlight roads (white lines), parking lots (gray polygons), buildings (red polygons), green space (in green, of course) and the location of trees (the green dots). We'll cover vector styles in detail in Chapter 6, Styling Vector Layers.
With a raster image, what you see is what you get. If you were to look at some close up satellite imagery on your map and see a bunch of buildings clustered together, you wouldn't necessarily know any additional information about those buildings. You might not even know they are buildings. Since raster layers are made up of images, it is up to the user to interpret what they see. This isn't necessarily a bad thing, but vector layers provide much more.
With a vector layer, you can show the actual geometry of the building and attach additional information to it—such as its address, who owns it, its square footage, and so on. As we'll see later in this chapter, it's easy to put a vector layer on top of your existing raster layers and create features in a specific location. We'll also see how we can get additional information about features just by clicking or hovering our mouse over them.
We can display any type of geometric shape with the vector layer—points, lines, polygons, squares, markers, any shape you can imagine. We can use the vector layer to draw lines or polygons and then calculate the distance between them. We can draw shapes and then export the data using a variety of formats, then import that data in other programs, such as Google Earth. These are just a few basic cases though, and throughout this chapter, you'll see how powerful the vector layer can be.
Another fundamental difference is that the vector layer is a client side layer. This means that interaction with the actual vector data happens on the client side. When you display vector data, for instance, its visual representation is generated by OpenLayers in response to the rules you define in your code. Raster data looks the way it looks and you can't easily change the color of roads or decide not to display buildings. When you navigate your map, vector data is generally already available and can be displayed immediately. With raster layers, each time you zoom in or out, OpenLayers has to request more image tiles from the server and wait for them to arrive unless they are already in the browser cache.
Since, in most cases, the vector data is loaded on the client side, presentation of and interaction with the vector layer usually happens nearly instantaneously. However, there are some practical limitations. Most vector sources make a lot more data available than can be loaded and rendered in the browser. Network bandwidth, memory and processor speed all have limits and, although computers and web browsers are getting faster and more powerful all the time, there are always practical boundaries to what can be done with vector data. The OpenLayers developers have worked hard to push these boundaries and many things that were impossible to consider even two years ago are now practical—we'll highlight some best practices along the way.
In computer graphics, there are essentially two types of data: raster and vector. The majority of image files—.jpeg, .png, .gif, and other bitmap image formats—are raster images. A photograph, for example, is a raster image. A raster image is a rectangular grid—like graph paper—of color information, and each color point in an image is called a pixel. When you look at a raster image on your computer, it interprets the color information in each pixel and maps this to physical pixels on your screen. As you zoom in on a raster image, there is a point at which each pixel in the raster image can be rendered to a single physical pixel on your screen. This is referred to as the resolution of the image, the most information that the image can accurately represent. As you zoom in further, each pixel in the raster image is drawn into more than one physical pixel and the quality of the image starts to degrade—we say it is pixelated. When you zoom out, each pixel in the raster image requires only part of a physical pixel on the screen and so several adjacent raster pixels are combined to compute a color to display in the physical pixel.
A vector, on the other hand, encodes information about how to draw a particular shape. There might be many ways of representing vector shapes—a straight line can be represented as a starting point and an ending point, or a starting point, direction and distance. When you display a vector on a computer screen, it has to be converted from its encoded format into colors for physical pixels—a process called rasterization. However, because the computer has detailed instructions on how to draw the shape, it can choose a resolution that exactly matches the physical pixels of your computer display every single time it draws it, regardless of how much you zoom in or out. In fact, the same vector information can be drawn on any other screen at the appropriate resolution. For this reason, we often call vector data resolution independent.
Here is an example of how a circle appears when drawn as a vector and a raster. The left side is rendered as a vector and the right side is rendered as a raster. When the image is zoomed, the vector remains sharp and clear but the raster becomes blocky.
We'll begin by creating a basic vector layer. Start a new page using the sandbox template. We'll use some existing vector data (found in the assets/data folder of the sample code that comes with this book) that contains polygons outlining countries of the world and display it in a map:
<script> tag to create our vector layer:var vectorSource = new ol.source.GeoJSON({
projection: 'EPSG:3857',
url: '../assets/data/countries.geojson'
});
var vectorLayer = new ol.layer.vector({
source: vectorSource
});var center = ol.proj.transform([0, 0], 'EPSG:4326', 'EPSG:3857');
var view = new ol.View ({
center: center,
zoom: 1,
});map variable and add the vector layer the same way you would add any other layer:var map = new ol.Map({
target: 'map',
layers: [vectorLayer],
view: view
});Zoom in on the countries and notice how quickly the map zooms and how sharp the outlines of the countries remain.
We just demonstrated how easy it is to incorporate vector data into a map. First, we created a source, specifically one that knows how to read features in the GeoJSON format. We told the source where to find the data (its url property) and what projection we need the data to be in (The view's projection is EPSG:3857, a standard Spherical Mercator projection used in many common commercial maps such as Google and Bing. We'll discuss projections in more detail in Chapter 7, Wrapping Our Heads Around Projections). Next, we created a vector layer and provided it with the source we just created. The view object centers the map at 0 degrees latitude and longitude, and we added all of this to the map in the same way we've used in all the other examples.
Vector layers tend to be very quick, as the data can be stored entirely on the client. Interaction happens instantly, which can greatly enhance the user's experience. Which of the following would be good choices for using vector layers?
Now, before we jump into more advanced uses of the vector layer, first, let's see how it actually works.
There are five things we need to cover to understand how the vector layer works:
Recall from Chapter 3, Charting the Map Class that OpenLayers supports three separate renderer technologies, WebGL, Canvas, and DOM. When OpenLayers draws the layers in a map, it uses one of these renderers to do the actual work of drawing. The renderer requests data from the layer's source for the area being displayed, and then transforms this into the final map image. For raster layers, images are fetched from a remote server and are composited into a Canvas element (for WebGL and Canvas renderers) or <img> tags (for the DOM render). Vector layers work in the same way, but are only supported by the Canvas renderer at the time this book was written. The renderer asks the layer's source to fetch the data it needs and then applies algorithms for rendering the vector data to the Canvas element. As we mentioned earlier, the vector data is not just an image. It can contain additional information such as the coordinates of the data. This additional information can be used for styling features (which we'll cover in detail in the next chapter) or to provide interactive feedback (as we'll see in an example later in this chapter).
The vector layer, by itself, is a layer like the other layers we've discussed so far. To really get the most out of the vector layer class, we'll be working mostly with other classes. For example, to get a basic example working (like the first one in this chapter), we will make use of at least one other class—the ol.source.Source class—to read features from a particular vector format. In fact, under the hood, OpenLayers was using a format, features, geometries, and some styles for this example. All of this happens automatically for the simplest case of drawing some vector data, but in practice, it's necessary to understand how these other classes function as well to get the most out of OpenLayers.
Before we get into too much detail, let's cover the vector layer class, ol.layer.Vector, itself. It is a direct subclass of ol.layer.Layer and inherits its methods and observable properties. Refer to Chapter 2, Key Concepts in OpenLayers if you need a refresher on those methods.
The ol.layer.vector class is used to create a vector layer instance:
var layer = new ol.layer.vector(options);
The options can include all the options for ol.layer.Layer (see Chapter 4, Interacting with Raster Data Source for a refresher if necessary) plus the following additional options that are specific to a vector layer:
The vector layer class also has several methods in addition to those it inherits from ol.layer.Layer.
The vector layer class by itself isn't very useful—it relies on other classes to do all the interesting work. Let's look at the source class, ol.source.vector, and its subclasses first as it's the only thing that is absolutely needed to get a working vector layer.
The vector source class is named after its purpose—to be a source of vector features for a vector layer. It is responsible for fetching features when needed, providing them to the vector layer for rendering, and also for retrieving features based on various criteria. We won't actually use the vector source class as it is a base class for the classes we'll actually be using, such as ol.source.GeoJSON in the preceding example. The following diagram shows how the vector source classes fit together in the OpenLayers architecture:
As you can see, there are quite a few classes in the OpenLayers library that deal with vector formats. The classes that you can create new objects from are highlighted in green. We'll briefly describe each class before we get into more detail:
ol.source.Vector: This is the base class for all vector sources. It provides a common API for accessing features in a vector source.ol.source.Cluster: This source automatically groups features together when they are close to each other, and represents the group as a single feature. The cluster source uses another vector source to access features to be clustered.ol.source.FormatVector: This class provides a common API for sources that use a format for reading and writing features. You cannot create an instance of this class.ol.source.ServerVector: This source uses a loader function that can retrieve vector features on the fly from a server, for example, a WFS (Web Feature Service) server.ol.source.TileVector: This source loads vector features in batches based on a tiling scheme similar to how raster layers load image tiles.ol.source.StaticVector: This source loads vector features from a file in a specific format. It is considered static in that all the available features are read from the file when it is loaded. Although you can create an instance of this class, you will normally use one of the format-specific subclasses.ol.source.GeoJSON: This source reads a file containing features in the GeoJSON format, a standardized encoding of geographic features using JSON.ol.source.GPX: This source reads a file containing features in the GPX (GPS Exchange format), a common file format for GPS devices.ol.source.IGC: This source reads a file in the IGC (International Glider Commission) format, a standard format for recording glider flights.ol.source.KML: This source reads a file in the KML (Keyhole Markup Language), an XML-based format used in Google Maps and related products.ol.source.OSMXML: This source reads a file using the Open Street Map XML schema.ol.source.TopoJSON: This source reads a file encoded in JSON using the TopoJSON specification, an extension of GeoJSON that encodes topology information.The vector source class, ol.source.vector, not only provides a common API for all vector sources but is also be instantiated and used directly. All of its subclasses primarily deal with actually retrieving vector features, but all the useful methods for actually interacting with features once they have been processed exist in this class. You can use this class if you have an existing set of vector features or are getting features in some way not directly supported by the subclasses. Some examples might include:
The vector source constructor takes the following options:
The vector source also provides the following methods:
The vector source can trigger the following events:
There are two subclasses of the vector source, FormatVector and Cluster. The FormatVector class is the basis for many subclasses that obtain features by reading them from some specifically formatted data such as GeoJSON or KML. We'll look into these classes shortly, but first let's take a brief look at the cluster source.
The cluster source dynamically groups (or clusters) features that are near each other based on the current resolution, or zoom level, of a map's view and represents those groups as individual features. It does this by finding features within a certain distance of each other and creating a new feature to represent them. The new feature contains a reference to the original features that are represented by the clustered feature.
Creating a cluster source is the same as creating a vector source except the constructor options include two additional properties:
The cluster source may be used with any type of feature, but it is typically used with a set of point features. This example illustrates using the cluster source with some randomly generated points that are included with the sample files for this project in assets / data / cluster.geojson. We'll first show the original data, then modify the example to use the cluster source. The following are the steps:
var originalSource = new ol.source.GeoJSON({
url: '../assets/data/cluster.geojson'
});var originalLayer = new ol.layer.vector({
source: originalSource,
});layers array:var map = new ol.Map({
target: 'map',
layers: [vectorLayer, originalLayer],
view: view
});originalLayer:var clusterSource = new ol.source.Cluster({
source: originalSource
});
var clusterLayer = new ol.layer.vector({
source: clusterSource,
});originalLayer with clusterLayer in the map's layers:var map = new ol.Map({
target: 'map',
layers: [vectorLayer, clusterLayer],
view: view
});In this example, we discovered how the cluster source works. First, we created a vector layer containing about 5000 points and displayed it on the map. As we saw, it's very hard to see these points when zoomed out. Next, we added a cluster source and a new layer based on the cluster source. Now the number of points displayed on the map changes dynamically as we zoom in and out, and the number of points on the map at any one time is much more manageable.
Typically, when displaying a cluster of features, we would represent the cluster differently depending on how many features are in the cluster—perhaps by adding a text label or changing the size of the point. We'll revisit this example in the next chapter and deal with the styling options then.
The other direct subclass of the vector source is the FormatVector source. This class cannot be directly created, rather it is an abstract class that adds a single method, readFeatures, to the API of all its concrete subclasses. This means that all the other source classes provide a readFeatures method that gets features from some data structure such as a string, array, or JavaScript object. The type of the data structure is determined by the format.
A feature format is responsible for reading features from a structured format that organizes spatial features in a structured way. Each feature format is based on a recognized specification document that defines how that format represents the geospatial data it contains. The feature formats are organized into three distinct groups:
There are two JSON-based formats, GeoJSON and TopoJSON. The GeoJSON format defines a schema used to represent spatial data as JSON data. JSON looks a lot like JavaScript object literals, but it has specific rules for formatting. The main differences between JSON and JavaScript object literals are:
To find out more about the JSON format, see http://www.json.org.
A GeoJSON file may contain either a Feature or FeatureCollection. A Feature is represented in JSON as an object with three keys: type, geometry, and properties. The type is always "Feature". The geometry is an object with a type and coordinates, where the type can be one of "Point", "MultiPoint", "LineString", "MultiLineString", "Polygon", "MultiPolygon", or "GeometryCollection", and the coordinates are an array containing the coordinates in a structure dependency on the type. The properties key is an object that contains keys and values representing nonspatial data associated with the feature.
A FeatureCollection is represented as an object containing two keys: type and features. The type is always "FeatureCollection" and features is an array of GeoJSON features structured as in the preceding paragraph.
An example of a Feature looks like the following:
{
"type": "Feature",
"geometry": {
"type": "Point",
"coordinates": [125.6, 10.1]
},
"properties": {
"name": "Dinagat Islands"
}
}A FeatureCollection looks like the following:
{ "type": "FeatureCollection",
"features": [
{ "type": "Feature",
"geometry": {"type": "Point", "coordinates": [102.0, 0.5]},
"properties": {"prop0": "value0"}
},
{ "type": "Feature",
"geometry": {
"type": "LineString",
"coordinates": [ [102.0, 0.0], [103.0, 1.0], [104.0, 0.0], [105.0, 1.0] ]
},
"properties": {
"prop0": "value0",
"prop1": 0.0
}
},
{ "type": "Feature",
"geometry": {
"type": "Polygon",
"coordinates": [ [ [100.0, 0.0], [101.0, 0.0], [101.0, 1.0],[100.0, 1.0], [100.0, 0.0] ] ]
},
"properties": {
"prop0": "value0",
"prop1": {"this": "that"}
}
}
]
}As you might imagine, this structure is quite easy to use with JavaScript applications and GeoJSON is a popular format for web mapping applications. Read more about this format at http://geojson.org.
The TopoJSON format is an extension of the GeoJSON format that encodes topology. A discussion of topology is beyond the scope of this book; briefly, topology defines rules for representing spatial features in a region. The most common example of this is adjacent polygons sharing a common border. Topological rules require two adjacent polygons sharing a common boundary will share the points that define the common boundary between them such that moving one point changes the boundary of both polygons simultaneously. You can find out more about the TopoJSON format at https://github.com/mbostock/topojson.
The XML formats are based on XML, a metalanguage that describes structured content using tags denoted by the < and > signs. HTML, which we've seen many times in this book already, looks like XML, and the tags in HTML instruct a web browser how to render the page.
Most HTML is not valid XML. HTML does not follow the strict formatting rules required by XML— particularly, there are many tags in HTML that do not require a closing tag. The <img> tag is an example of this. There is a variant of HTML, called XHTML, that defines a valid XML schema for HTML. While there are some advantages to using XHTML, it has not gained widespread adoption because it is more work for developers to ensure a valid document and the perceived benefits are low.
Structured documents based on XML have a specific set of tags and a set of rules on tag content and nesting. Collectively, the tags and rules are called a schema. There are several geospatial formats based on XML and each defines a specific schema. The schema allows developers to write code to parse the spatial information out of the structured document in the same way that the GeoJSON format proscribes a specific JSON object structure.
The XML-based formats are GML, GPX, KML, OSM XML, and WFS. Let's describe each briefly:
While all the formats we've discussed so far can be represented in a plain text file, the text formats differ in that they are not based on standard representation. Rather, they define their own unique structure. There are currently two text formats supported by OpenLayers—IGC and WKT.
Now, we know something about formats, let's look at the next class in the vector source hierarchy—StaticVector. OpenLayers provides the StaticVector source and some format-specific subclasses designed to simplify loading vector features from the supported formats. They are as follows:
ol.source.GeoJSONol.source.TopoJSONol.source.GMLol.source.GPXol.source.KMLol.source.OSMXMLol.source.IGCol.source.WKTEach of these is a vector source that works in exactly the same way, the only difference between them is the format they use internally to read features.
The StaticVector source, as the name suggests, loads a set of vector features from a source that does not change. This means the features are loaded, and parsed, just once, The actual features in the source never change in response to panning or zooming. In all other respects, the StaticVector source works in the same way as the other vector sources.
You can create an instance of StaticVector directly and pass it a format and a source of data, or you can use one of the format-specific subclasses. Let's look first at creating StaticVector instance. Note that several of the options only apply for particular formats, as noted in the description.
It is worth emphasizing at this point that for all the OpenLayers formats, the data stored in files are actually text files. Loading these files in a browser will result in the data being loaded as a JavaScript string. Some libraries will automatically convert data from its text-based representation into another type of object for you. For instance, loading XML data from a text file will often give you a reference to a Document Object after it is loaded. In OpenLayers, every format supports loading data from a string value, but the string must contain data that is in the structure expected by the format.
The actual format-specific source classes generally work the same way and support only those options that make sense from the StaticVector class. However, there are some important differences that are worth noting. All the following source constructors support the attributions, logo, text, url, and urls options listed in the preceding table. For the sake of brevity, these options have been omitted from the following tables.
The two JSON formats, ol.source.GeoJSON and ol.source.TopoJSON, support the two additional constructor options. These are shown in the following table:
The GPX format constructor has no additional options, but will read data from the node and doc options.
The KML format specification requires that the geometry data for features be represented in EPSG:4326. In addition to supporting the node and doc options, the KML format supports two other options. Refer to the following table:
Time to put our new knowledge into action. There are sample files included with the book's code samples in assets / data in each of the formats discussed earlier. Try adding each of them to a map. Remember, you will need to create an appropriate source and a vector layer, and add the vector layer to the map. As with earlier examples, you should be able to use the url option to load the data without having to load and parse it yourself.
The ServerVector source requests features from a server by sending the geographic coordinates of some region it needs features for to a server. As you might imagine, there are many different ways of doing this based on what a particular server understands. Each server has its own unique language for requesting features. Many servers implement a common language based on an open standard called WFS (Web Feature Service) that can simplify the job. Even so, there are different versions and different flavours of WFS that make it difficult to support them all. To avoid this problem, OpenLayers provides a generic mechanism for requesting features for the ServerVector source; specifically it requires that you implement the loader function yourself!
Creating a loader function isn't as hard as it might sound, let's walk through a concrete example that loads features from a WFS server. In this example, we will be using the popular jQuery library to help us load data. If you are not familiar with jQuery, see http://jquery.com for more information.
<script> tag to load jQuery:<!doctype html>
<html>
<head>
<title>vector Examples</title>
<link rel="stylesheet" href="../assets/ol3/ol.css" type="text/css" />
<link rel="stylesheet" href="../assets/css/samples.css" type="text/css" />
</head>
<body>
<div id="map" class="map"></div>
<script src="../assets/ol3/ol.js" type="text/javascript"></script>
<script src="//code.jquery.com/jquery-1.11.0.min.js"></script>
<script>
var tiledRaster = new ol.layer.Tile({
source: new ol.source.OSM()
});
var center = ol.proj.transform([-72.6, 41.7], 'EPSG:4326', 'EPSG:3857');
var view = new ol.View({
center: center,
zoom: 12,
});
var map = new ol.Map({
target: 'map',
layers: [tiledRaster],
view: view
});
</script>
</body>
</html>Next, we'll need to create a style object for displaying our vectors. Don't worry too much about what this is, we'll cover it in detail in Chapter 6, Styling Vector Layers. Add this after the tiledRaster and before the center:
var fill = new ol.style.Fill({
color: 'rgba(0,0,0,0.2)'
});
var stroke = new ol.style.Stroke({
color: 'rgba(0,0,0,0.4)'
});
var circle = new ol.style.Circle({
radius: 6,
fill: fill,
stroke: stroke
});
var vectorStyle = new ol.style.Style({
fill: fill,
stroke: stroke,
image: circle
});vector_template.html and make a copy of it to use for the rest of this example. We'll be using vector_template.html as the starting point for several examples.vectorStyle object, which will handle loading features from the remote server:var vectorLoader = function(extent, resolution, projection) {
var url = 'http://demo.boundlessgeo.com/geoserver/wfs?service=WFS&' +
'version=1.1.0&request=GetFeature&typename=osm:builtup_area&' +
'outputFormat=text/javascript&format_options=callback:loadFeatures' +
'&srsname=EPSG:3857&bbox=' + extent.join(',') + ',EPSG:3857';
$.ajax({
url: url,
dataType: 'jsonp'
});
};
var loadFeatures = function(response) {
var features = vectorSource.readFeatures(response);
vectorSource.addFeatures(features);
};loadFeatures function:var vectorSource = new ol.source.ServerVector({
format: new ol.format.GeoJSON(),
loader: vectorLoader,
strategy: ol.loadingstrategy.createTile(new ol.tilegrid.XYZ({
maxZoom: 19
})),
projection: 'EPSG:3857',
});
var serverVector = new ol.layer.vector({
source: vectorSource,
style: vectorStyle
});serverVector layer to the map's layers:var map = new ol.Map({
renderer: 'canvas',
target: 'map',
layers: [tiledRaster, serverVector],
view: view
});We just created a vector layer that reads features from a remote WFS server as the map is panned and zoomed. A lot just happened, so let's review each step in detail.
In step 1, we set up a new OpenLayers application using the same structure as we've used for all the other examples so far. Nothing new here, except we've chosen a center for the map view somewhere in the north eastern United States and named our base layer tiledRaster to help differentiate it from the vector layers we will be working with.
In step 2, we created a simple vector style object to use with all our vector layers. A vector style consists of several components, in this case, we are defining the style to use for fill (polygons), stroke (lines), and image (points). The color for each is defined using the rgba() syntax, which stands for red, green, blue, and alpha (opacity). In this case, we are using a simple black color and 20 percent opacity. We'll cover styles in much more detail in the next chapter.
Step 4 is really the heart of this example. First, we defined a vectorLoader function. This function is used by ol.source.ServerVector to fetch features from a remote server. The vectorLoader function declares a URL that points to a WFS server. You might think the URL looks a bit complicated, and you are right. For now, just trust that it does the right thing, which is to ask the server for all the vector features contained within the current extent. The jQuery ajax function is used to actually trigger loading the URL. The jsonp data type tells jQuery to request the data by inserting it as a <script> tag, and the callback option in the URL identifies the function that will be executed when the <script> tag is loaded; in this case, the loadFeatures function.
The loadFeatures function takes the features provided by the server, reads them using the vector source (which has a GeoJSON format for parsing the data), and adds them to the layer.
In step 5, we combined all the previous pieces to create the source and layer objects. To define the source, we used ol.source.ServerVector and provided it with a format (GeoJSON in this case), the loader function we defined in the previous step, a loading strategy, and a projection. We'll discuss the loading strategy a bit later. Finally, we created the actual layer object using ol.layer.vector and provide it with our source and style.
After we added this to the map's layers in step 5, we can see it in action. Every time the map is panned or zoomed, the vector layer checks its source for features. The ServerVector source requests data from a remote server using a function that we provide. This gives you a lot of flexibility, but also means that you have to understand how to load data from a remote server. Fortunately, libraries such as jQuery have very good convenience methods for doing just this. The ServerVector source uses its loading strategy to decide how to divide up the requests to the server and passes the appropriate parameters to your loader function. We'll talk a bit more about loading strategies in some time. Once the features are loaded, you can parse them and add them to the source directly. The vector layer then draws the features using the provided style.
To see what happens when features are requested from the server, open Web Inspector, switch to the Network tab, and make sure All is selected, then reload the page.
You can identify the feature requests because they start with wfs?service=WFS. Click on a request to view its response. Notice how some requests have no features, and some have features. Notice how the response is formatted—it looks like a JavaScript function call to loadFeatures() with an object literal as the argument. The loadFeatures() function is the one we specified and that we implemented. This is an example of how jsonp works.
Now that we've seen it in action, let's review the constructor options for a ServerVector source:
The final vector source is TileVector. This source loads features by requesting them in batches based on a tile grid exactly the same way that the raster sources work. The job of a tile grid is to divide the world up into rows and columns and convert geographic coordinates for the current view into row and column references.
If you were following closely in the previous section, you might wonder how TileVector is different from a ServerVector configured with a loading strategy based on ol.loadingstrategy.createTile. The main differences are as follows:
TileVector source has its own loading functionality—you do not need to provide one.TileVector source uses the row, column, and zoom level rather than geographic coordinates to request features from the server.TileVector source provides convenient options for working with tile-based servers.There are several ways of producing and serving vector tiles. One way is to use a program that splits vector data up into tiles based on a particular tile grid and save the tiles to disk in a directory structure based on the zoom level, column,and row. Another way is to use a server that can split up vector data on the fly. The OpenStreetMap wiki has a page dedicated to vector tiles and related resources at http://wiki.openstreetmap.org/wiki/vector_tiles.
The use of a tile grid removes the need to implement a loader function; so, there is less work involved in setting it up. Let's see how easy it is to use the TileVector source:
serverVector layer is defined:var tiledSource = new ol.source.TileVector({
format: new ol.format.TopoJSON({
defaultProjection: 'EPSG:4326'
}),
projection: 'EPSG:3857',
tileGrid: new ol.tilegrid.XYZ({
maxZoom: 19
}),
url: 'http://{a-c}.tile.openstreetmap.us/vectiles-water-areas/{z}/{x}/{y}.topojson'
});var tiledVector = new ol.layer.vector({
source: tiledSource,
style: vectorStyle
});tiledVector layer instead of the serverVector layer:var map = new ol.Map({
renderer: 'canvas',
target: 'map',
layers: [tiledRaster, tiledVector],
view: view
});As you can see, the TileVector source is quite a bit simpler than the ServerVector source. For the TileVector, we provided a format, a projection to convert vector features into (typically, the projection used with the map's view), a tileGrid, and a url. The format specifies what format the features will be in, which tells OpenLayers how to read features from the tiles sent by the server. It also can specify the projection used for the features. In this example, the server provides files in the TopoJSON format, a variant of GeoJSON that encodes topology, in a projection of EPSG:4326 (latitude and longitude). The tileGrid tells OpenLayers how to convert geographic coordinates into rows and columns that the server will understand. You can't just use any tileGrid with any server—it's very important that the tileGrid matches what the server expects. The XYZ tile grid, however, is a very common grid used by most tile servers, both raster and vector. The url property tells OpenLayers where to request each tile from. There are some special placeholders that you can put into a url that OpenLayers will replace on the fly when requesting a specific tile:
{z}: This will be replaced by the current zoom level.{y} or {-y}: This will be replaced by the row of the tile. The {-y} option inverts the y axis, this is needed for some servers.{x}: This will be replaced by the column of the tile.After defining the source, it can be used with the vector layer in the same way the ServerVector source was used, and the layer is added to the map in the same way too.
The result is that when you load the browser, OpenLayers will request vector tiles from the server and render them using the style we defined.
To see what happens when vector tiles are requested, open Web Inspector, switch to the Network tab, and make sure All is selected, then reload the page. You will see the requests that fetch the vector tiles end with the .topojson extension:
Click on some requests and view the responses. Do you see the difference between this and the ServerVector responses? Here, the features are returned directly as a JavaScript object while in the previous example, they were wrapped in a JavaScript function call.
Look through the requests for the raster tiles they are the ones that end with .png. You should be able to find a raster tile for each vector tile because they are using the same tileGrid.
One of the side effects of using vector tiles is that vector features such as lines and polygons may cross more than one tile and will be split up into different features. If you are rendering polygons with a stroke, or lines with dashed styles, you will see some interesting effects at the edges of the tile boundaries. We can see an example of this when first loading the TileVector, in this particular case. The river that runs vertically through the center of the map has several horizontal lines in it that coincide with the tile boundaries. Line features are typically less affected and point features shouldn't be affected at all. You can use polygon features, but you will probably want to render a fill style only to avoid artifacts at the tile boundaries.
Now, we've seen it in action, let's review all the options available when using a TileVector source:
Loading static sources programmatically is very useful, but let's say you want to look at a new GeoJSON file you just found. Opening up your text editor and coding up a quick viewer is pretty easy, but it takes some time, and perhaps, you'll need to check the API documentation (or this chapter!) to recall the exact details. Wouldn't it be nice if you could just drag your new GeoJSON file onto a map and view it without writing any code? Guess what, you can!
vector_template.html file and add a DragAndDrop interaction after the vectorStyle is defined:var dragAndDrop = new ol.interaction.DragAndDrop({
formatConstructors: [
ol.format.GPX,
ol.format.GeoJSON,
ol.format.IGC,
ol.format.KML,
ol.format.TopoJSON
]
});DragAndDrop interaction will fire an event that can be used to actually add the features to the map:dragAndDrop.on('addfeatures', function(event) {
var vectorSource = new ol.source.vector({
features: event.features,
projection: event.projection
});
map.getLayers().push(new ol.layer.vector({
source: vectorSource,
style: vectorStyle
}));
view.fitExtent(vectorSource.getExtent(), map.getSize());
});<script> tag.map.addInteraction(dragAndDrop);
assets | data in your file browser and try dragging one of the vector files onto the map.With a few lines of code, we've created a pretty cool vector file viewer. Let's look at how we accomplished this.
In step 1, we created an instance of ol.interaction.DragAndDrop. This class turns the map into a drop target. When you drag a file from the operating system onto a drop target, the browser emits an ondrop event. The DragAndDrop interaction listens for this browser event and attempts to read features from the file using one of the formats. The DragAndDrop interaction allows you to customize the list of formats to be tried through the formatConstructors option. In this case, we've added all the formats.
In step 2, we add a listener for the DragAndDrop interaction's addfeatures event. This event is triggered when the interaction parses features from a file dropped on the map. The event passed to our handler gives us an array of features and the projection of the features. We take the array of features passed to the event handler and create a new vector source with the features and the projection of the features, then create a new vector layer with this source and our style and add it to the map.
The last thing to do is make sure that the map knows about our interaction, which we did in step 3.
We've been using feature objects throughout the chapter so far without really talking about the Feature class itself. We also hinted at the Geometry class, but we haven't gone into any detail so far. This section will cover both classes in a bit more detail so that you can gain a bit more confidence working with them. Don't worry—it's easy, you've already been exposed to both classes.
Before we get into the Feature class, we should go over the Geometry class, as it's used to create the actual geometry objects that make up a feature object.
Although it is perfectly valid to create features without geometries, they can't be represented on a map. Therefore, the Geometry class is, from the map's point of view, the foundation of the feature object. The Feature class uses the Geometry class to store geometry information about the feature.
However, what exactly is the Geometry class? In a nutshell, it stores geographic information in the form of one or more coordinate pairs. Remember the examples from The feature formats section of this chapter where we added features using the Format subclasses? We briefly saw geometries while reprojecting the features into the map view's projection:
for (var i = 0, ii = features.length; i < ii; ++i) {
var feature = features[i];
var geometry = feature.getGeometry();
geometry.applyTransform(transform);
}In this example, we will transform the feature's geometry from its original projection into the map view's projection so that the loaded feature will align with the raster base map correctly. This is just one part of what we can do with geometries.
When working with the Geometry class, we always use one of its subclass. What do we mean? Think about the Format classes we've used earlier in this chapter—we've talked about format but actually used subclasses of the base Format class the entire time (ol.format.GeoJSON, ol.format.KML, and so on are all subclasses of the ol.format.Format class).
We mentioned before that a geometry object stores geographic information as coordinate pairs. A coordinate pair is simply an array of two, three, or four numbers (we'll get to this in a moment) representing a single location on the earth in a given projection. You're already familiar with coordinates, it's the value that we use to set the center of a view in all of the examples. In the OpenLayers documentation, you'll see coordinates represented with the type ol.Coordinate. This looks like a classname, but really it's a type definition specifying an array of numbers representing a location. There are four different ways, called layouts, of representing a coordinate:
To get maximum performance, OpenLayers' Geometry classes store coordinates in so-called flat arrays, meaning all the values of all the coordinates are stored in a single array of numbers. Because the individual coordinates can have two, three, or four values, all the Geometry classes need to know the layout of the coordinates they are storing.
Before we cover the subclasses, let's quickly go over some of the methods available to all of the subclasses via the base Geometry class. All these methods are available to any Geometry subclass, as all the subclasses inherit from the Geometry class:
There are two direct subclasses of ol.geom.Geometry—ol.geom.SimpleGeometry and ol.geom.GeometryCollection. The GeometryCollection class, as the name suggests, treats several geometries as a single geometry object. The SimpleGeometry class is the base class for geometries we can actually use to represent specific shapes—points, lines, polygons, and so on. Let's look at the SimpleGeometry class and its subclasses first.
We don't use the SimpleGeometry class directly, but it is the base class for all the basic geometry types that OpenLayers understands. We'll look first at the methods provided by SimpleGeometry to all the subclasses, then look at the subclasses themselves:
|
Method |
Parameters |
Description |
|---|---|---|
|
|
| |
|
|
| |
|
|
|
This returns the layout (XY, XYZ, XYM, or XYZM) of the geometry. |
The Point class represents a single point, and MultiPoint is a collection of points. A Circle class is a special case of the Point class that includes a radius property. All take coordinates as the first argument to the constructor. Both Point and Circle expect a single coordinate, while MultiPoint expects an array of coordinates. A Circle takes a second argument, the radius. All take an optional final argument, the layout, which defaults to XY. Here are some examples of creating each type:
var point = new ol.geom.Point([1, 2]); var multipoint = new ol.geom.MultiPoint( [ [1,2], [2,3] ]); var circle = new ol.geom.Circle([1,2], 2);
The LineString class represents a sequence of two or more coordinates that are connected to form a line. As with MultiPoint, MultiLineString is a collection of lines. A LineString is constructed with an array of coordinates, while MultiLineString is created with an array of arrays of coordinates. Both take the layout as an optional final argument, the layout, which defaults to XY. Here are some examples of each:
var line = new ol.geom.Line([ [1, 2],[2,3],[3,4] ]); var multipoint = new ol.geom.MultiPoint([ [ [1,2],[2,3],[3,4], [ [4,5],[5,6] ] ]);
The Polygon class is composed of one or more LinearRing classes. A linear ring is a sequence of three or more coordinates that forms a closed ring, that is, the last coordinate is the same as the first coordinate. When a polygon contains multiple linear rings, the first is called the outer ring and the rest are interior rings. Interior rings define holes in the polygon. And as you might expect, a MultiPolygon is a collection of polygons. Let's see how to make a linear ring and polygon. As with the other geometry types, the layout can be specified as an optional last argument:
var linearRing = new ol.geom.LinearRing([ [1,2],[2,3],[3,4],[1,2]); var polygon = new ol.geom.Polygon([ [ [-20,-20],[-20,20],[20,20],[20,-20],[-20,-20] ] ]);
The last example only used one linear ring for the polygon. Let's use the Web Inspector's console to create a polygon and then add a linear ring to see what happens. Open the vector_template.html file in your browser and then open the Web Inspector's Console. We'll be typing the commands into the console directly and observing the result on the map.
var polygon = new ol.geom.Polygon([ [ [-20,-20],[-20,20],[20,20],[20,-20],[-20,-20] ] ]);
polygon.transform('EPSG:4326', 'EPSG:3857');var source = new ol.source.vector({
features: [new ol.Feature(polygon)],
projection: 'EPSG:4326'
});
var layer = new ol.layer.vector({
source: source,
style: vectorStyle
});map.addLayer(layer);
var linearRing = new ol.geom.LinearRing([ [-10,-10],[10,-10],[10,10],[-10,10],[-10,-10] ]);
linearRing.transform('EPSG:4326','EPSG:3857');
polygon.appendLinearRing(linearRing);We've just seen linear rings in action. When you create a polygon, the first linear ring is the outer boundary of the polygon and any other linear rings you create define holes in the outer ring.
Try the last example again, only this time add two or more linear rings to the polygon and observe what happens.
The GeometryCollection class, as the name suggests, is a collection of geometry objects. Unlike the MultiPoint, MultiLine, and MultiPolygon classes, a GeometryCollection can contain any type of geometry. You can create an instance of ol.geom.GeometryCollection by passing an array of geometries to it, for example:
var geomCollection = new ol.geom.GeometryCollection([geom1, geom2, geom3]);
Although you can use a GeometryCollection as an ol.geom.Geometry class anywhere, you can't use any of the SimpleGeometry methods on a GeometryCollection. Instead there is a separate API for accessing the geometries managed by the collection.
To complete our discussion of vector layers, we'll finish with the Feature class. We've already seen features in action—in fact, you can't display vector data without them—but we haven't really talked about what they are and what they do.
In the previous section, we explored the various OpenLayers Geometry classes. They contain the geospatial coordinates that represent a particular shape. However, to display a shape on the map, we need to work with features. When we model things in the real world and build data structures to represent their position, we also want to capture other information about them. A polygon representing the outline of a building is an interesting thing to display on a map, but when we click on it, it's pretty reasonable to expect to get some information about the building such as its address, its height, and building type (that is, commercial, industrial, or residential). These nonspatial properties of a feature can also be used to change the style of a shape on the map.
A feature combines these two concepts—the spatial location of a thing, and nonspatial properties of the thing that we are interested in.
Creating a new feature is pretty straightforward; you just need to provide a geometry object (to create a feature with no extra properties) or an object literal containing the geometry and other properties of the feature. For instance, given a point geometry, we can construct a simple feature like this:
var point = new ol.geom.Point([x, y]); var feature = new ol.Feature(point);
To create a feature with information associated with the point, we do it this way:
var feature = new ol.Feature({
geometry: point,
name: 'My Cottage'
});By convention, the geometry key is used to specify the geometry associated with the feature. It's possible, though, to use a different key and the setGeometryName() method to change this. For our purposes, we'll be doing it the default way.
We refer to this extra, nonspatial information associated with a feature as properties. The properties associated with a feature are almost completely free-form and contain any value. The geometry property is really the only exception.
You might wonder why we care about the nonspatial properties of a feature since we can create a feature without them and things work just fine. There are essentially two reasons:
We'll look at the first case—interactive information—in the last example for this chapter. We'll explore the second case in the next chapter when we look more closely at styling vector layers.
Before we jump into our last example, let's look at the methods available on a feature object. Note that Feature class is a subclass of ol.Object and inherits all the Event class and KVO properties, methods, and events. We won't include them here, but if you need a refresher jump back to Chapter 2, Key Concepts in OpenLayers for a moment.
While we are not including the ol.Object methods in this list, it is relevant and important to note that feature properties are treated as object properties. This means that you can:
feature.set(key, value)feature.get(key)feature.on('change:<key>', observerFunction), where <key> is the name of a propertyfeature.setProperties(values)One last thing before our final example—feature objects can have their own styles. Normally, styles are assigned to the vector layer and all features that are rendered as part of that layer use the layer's style. It is possible, however, to assign styles to individual features and that style will be used instead of the layer's style. Because a feature comes from a source, and a source can be used for more than one vector layer, this means that a feature without a style can be rendered differently depending on the layer's style while a feature with a style will be rendered the same way regardless of the different styles on different layers.
To wrap up our chapter on vector layers, let's combine our knowledge of layers, sources, and features and create a small application that displays the name of a country when we hover over it with the mouse:
var source = new ol.source.GeoJSON({
projection: 'EPSG:3857',
url: '../assets/data/countries.geojson'
});
var countries = new ol.layer.vector({
source: source
});
var center = ol.proj.transform([0, 0], 'EPSG:4326', 'EPSG:3857');
var view = new ol.View({
center: center,
zoom: 1,
});
var map = new ol.Map({
target: 'map',
layers: [countries],
view: view
});pointermove event provided by the map object. If you don't remember anything about map events, review Chapter 3, Charting the Map Class:map.on('pointermove', onMouseMove);onMouseMove function:function onMouseMove(browserEvent) {
var coordinate = browserEvent.coordinate;
var pixel = map.getPixelFromCoordinate(coordinate);
var el = document.getElementById('name');
el.innerHTML = '';
map.forEachFeatureAtPixel(pixel, function(feature) {
el.innerHTML += feature.get('name') + '<br>';
});
}<div> element to display the country name, just after the <div> that holds the map:<div id="name"></div>
We've just saw how easy it is to interact in real time with vector data sources.
Step 1 just created a vector layer using a static GeoJSON source and added it to the map.
In step 2, we registered for the pointermove event. Recall from Chapter 3, Charting the Map Class that the pointermove event is fired by the map whenever the mouse moves over the map, and it passes a BrowserEvent object that contains, among other things, the map coordinate of the mouse position. Next, we implemented our event handler function. It gets the coordinate from the browser event and finds all features at that coordinate in our country layer's source. If there are any features, we get the name property from the first one and display this in the <div> added in step 4. You may wonder exactly how interactions with your map work behind the scene. Don't worry! We will see them more thoroughly in Chapter 8, Interacting with Your Map.
Vector layers are extremely useful for developing interactive web mapping applications. In this chapter, we've discussed what a vector layer is and its potential limitations. We've explored the various vector data sources that OpenLayers provides, and looked in detail at features and geometries. Through a series of examples, we learned how to load dynamic data from a remote server such as a WFS server, load tiled vector data, load vector data stored in static files, even by dragging them to the map from our file browser, work with geometries and features, and dynamically interact with vector data.
We covered a lot about vector layers, but we're not done yet. It's time to take control of the presentation of our vector data; so, keep reading to learn all about how to use styles with vector layers to really make your maps pop!
By now you should be getting pretty comfortable creating simple OpenLayers maps with a combination of raster and vector data. With raster data, there is no control over presentation, as the saying goes–what you see is what you get. Vector data, on the other hand, gives you direct control over presentation details. We've already alluded to vector styles, and used them in the previous chapter. Now, it is time to take full control of how we present our vector data!
In the last chapter, you saw how powerful the vector layer can be. In this chapter, we'll go a bit deeper and talk about how to customize the appearance of the features within a vector layer. We'll explore the following:
So, what is a vector style? Quite simply, it is a set of instructions about how to draw graphic primitives—the points, lines, polygons, and text that make up our vector features. OpenLayers provides a basic default style that renders features in various shades of blue. While this is quite nice, it's probably not what you'll want to use all the time.
You've already seen an example of a basic vector style in the previous chapter. Let's review it here:
var fill = new ol.style.Fill({
color: 'rgba(0,0,0,0.2)'
});
var stroke = new ol.style.Stroke({
color: 'rgba(0,0,0,0.4)'
});
var circle = new ol.style.Circle({
radius: 6,
fill: fill,
stroke: stroke
});
var vectorStyle = new ol.style.Style({
fill: fill,
stroke: stroke,
image: circle
});This code defines specific rules for the fill, stroke, and image properties of a new ol.style.Style object. The fill and stroke rules specify a color and opacity using the RGBA (Red, Green, Blue, and Alpha) format. The circle style is a special style that draws points as circles of a specific radius with a fill and stroke property. Together, these form a style object that OpenLayers uses to determine how to draw a feature. The fill property is used for filling polygons and circles. The stroke property is used to draw the outline of polygons, lines, and circles. The image property is used for drawing points. There is also a text property that we haven't seen yet.
The vector layer's style property accepts three different ways of specifying styles:
ol.style.Styleol.style.Style instancesWe'll look at style functions in more detail in the second half of this chapter, but briefly, a style function is one that returns an array of style objects to be used for a specific feature and resolution. In combination with feature properties, a style function allows for the implementation of advanced custom styling. Before we can run, we'd better learn how to walk.
We'll start with an example that shows off most of the basic style properties. We'll start with a new HTML page setup the same way we usually start off.
sandbox template and add the standard setup for a map to the main <script> tag:var center = ol.proj.transform([0, 0], 'EPSG:4326', 'EPSG:3857');
var view = new ol.View({
center: center,
zoom: 1
});
var map = new ol.Map({
target: 'map',
view: view
});var countries = new ol.layer.Vector({
source: new ol.source.GeoJSON({
projection: 'EPSG:3857',
url: '../assets/data/countries.geojson'
})
});
var map = new ol.Map({
target: 'map',
layers: [countries],
view: view
});var timezones = new ol.layer.Vector({
source: new ol.source.KML({
projection: 'EPSG:3857',
url: '../assets/data/timezones.kml'
})
});var countryStyle = new ol.style.Style({
fill: new ol.style.Fill({
color: [203, 194, 185, 1]
}),
stroke: new ol.style.Stroke({
color: [177, 163, 148, 0.5],
width: 2
})
});
var timezoneStyle = new ol.style.Style({
stroke: new ol.style.Stroke({
color: [64, 200, 200, 0.5],
}),
text: new ol.style.Text({
font: '20px Verdana',
text: 'TZ',
fill: new ol.style.Fill({
color: [64, 64, 64, 0.75]
})
})
});style property to each of the vector layers so they know which style to use. Also, we'll need to tell the KML source not to extract the default feature styles stored in the KML document:var countries = new ol.layer.Vector({
source: new ol.source.GeoJSON({
projection: 'EPSG:3857',
url: '../assets/data/countries.geojson'
}),
style: countryStyle
});
var timezones = new ol.layer.Vector({
source: new ol.source.KML({
projection: 'EPSG:3857',
url: '../assets/data/timezones.kml',
extractStyles: false
}),
style: timezoneStyle
});With this example, we are illustrating some of the basic styling capabilities of OpenLayers. We combined two static vector sources—countries and time zones—and some simple styles to create our map.
Step 1 set up the same structure we've been using for all our examples. In step 2, we added the country data using a static GeoJSON source and added it to the map with the default styling. Next, we added the time zone data in step 4 and developed some basic styles for the two layers in step 6. The country data is composed of polygons, so we created a fill style and a stroke style for styling the country layer. The time zone data also contains polygons, but we want to see the countries underneath so we created a separate style with just the stroke and text properties for it.
The text property in this example is somewhat contrived to keep things simple. Showing the same text string for each time zone is not what we'd really want to do. Ideally, we'd display information specific to each time zone—perhaps, the name or number of hours from Greenwich Mean Time. We'll cover how to do this a bit later in the chapter though. The last thing is to assign our custom styles to the appropriate vector layer and turn off the automatic extraction of styles from the KML layer, which happened in step 7.
Now that we've reviewed how basic styles work, let's take a closer look at the style object and the properties we can assign to it. Along the way, we'll illustrate each with a specific example.
The style class, ol.style.Style, contains the drawing instructions to be used when rendering a feature. There are five properties we can use when creating a style property:
As you can see, a style is really a composite of several specific types. Including a property turns on drawing of the relevant type and excluding it turns it off. When you specify the style property for a vector layer, this replaces all the default styles; so, you don't need to override all the properties all the time—just specify the ones that are needed and the rest will not be drawn at all. For example, creating a style with just a stroke property will draw polygons with an outline and no fill:
var style = new ol.style.Style({
stroke: new ol.style.Stroke({
color: [127,127,127,1]
})
});Now, let's look at each specific property type with some examples.
The fill style—ol.style.Fill—is used to fill shapes with a solid color. The fill style is used by ol.style.Style as well as a couple of other objects we'll see shortly. It has a single property, color, of the type ol.Color that is used when drawing filled shapes.
Colors may be specified in three ways:
[0,0,0,1], white is represented as [255,255,255,1], and a semitransparent blue green is [0,255,0,0.5]."rgba(red,green,blue,alpha)", where red, green, blue, and alpha are the same as the preceding array form; for example, our semitransparent green color will be "rgba(0,255,0,0.5)".#RRGGBB, where RR is the red value, GG is the green value, and BB is the blue value. The values are a hexadecimal equivalent of the numeric values between 0 and 255, written as 00 to FF. The alpha value is assumed to be 1 in this case.These different representations are equivalent (except for the missing alpha control in hex colors) and you can use whichever is more convenient.
The stroke style— ol.style.Stroke—is used to draw lines. The line style is used by ol.style.Style as well as a couple of other objects we'll see shortly. A stroke style has the following options.
The following diagram illustrates the effect of the various values for lineJoin (top) and lineCap (bottom).
Modify the last example and try out some fill and stroke style properties. In particular, try changing the lineJoin and lineCap properties. Use a wider stroke width to see the effect it produces. Note that the lineCap style won't be apparent when drawing polygons—to see it in action, you'll need a line layer, perhaps, using the fells_loop.gpx file we saw in the previous chapter.
Here are a couple of examples:
var countryStyle = new ol.style.Style({
fill: new ol.style.Fill({
color: [0, 255, 255, 1]
}),
stroke: new ol.style.Stroke({
color: [127,127,127,1.0],
width: 10,
lineJoin: 'bevel',
})
});
var timezoneStyle = new ol.style.Style({
stroke: new ol.style.Stroke({
color: [64, 200, 200, 0.5],
lineJoin: 'round',
width: 10
})
});The image style—ol.style.Image—is used to style point data. You won't be using it directly though. Instead, there are two subclasses that you'll be using: ol.style.Icon and ol.style.Circle. Let's look at the icon style first.
The icon style displays an image at the location of a point. There are quite a few properties associated with the icon style that allow you to align the placement of the image relative to the precise geographic location being represented.
The following diagram illustrates the meaning of the origin, size, and anchor options:
As we haven't seen the Icon style before, let's build an example. As we'll need some point data for this example, the earthquake.kml file should be perfect! We'll use the following image sprite and pick the middle dot. This file is included with the code samples that come with the book; you can find it at assets/img/dots.png.
var earthquakeStyle = new ol.style.Style({
image: new ol.style.Icon({
anchor: [0.5, 0.5],
size: [52, 52],
offset: [52, 0],
opacity: 1,
scale: 0.25,
src: '../assets/img/dots.png'
})
});var earthquakes = new ol.layer.Vector({
source: new ol.source.KML({
projection: 'EPSG:3857',
url: '../assets/data/earthquakes.kml',
extractStyles: false
}),
style: earthquakeStyle
});var map = new ol.Map({
target: 'map',
layers: [countries, timezones, earthquakes],
view: view
});Using the icon style properties, we displayed an image at the location of each of the points in the earthquakes.kml file.
First, we created an icon style pointing at our sprite image and supplied values for offset, anchor, size, and scale to ensure our red dot is used. The sprite is 156 pixels wide and 52 pixels high, and each image in the sprite is 52 by 52 pixels, so we provided a size of [52,52]. An offset value of [52, 0] moved the frame of reference 52 pixels in from the left edge. The anchor position of [0.5,0.5] specified the middle of the image since the default anchor units is fraction. We can also have specified pixels for anchor units and changed our anchor position to [26, 26]. Given the density of the earthquakes, using a 52 by 52 pixel image will overwhelm the map; so, we provided a scale value of 0.25, which effectively shrunk the resulting image to 25 percent of its size, or 13 by 13 pixels.
After creating a new vector layer that used our icon style, we added it to the map.
Like the icon style, the circle style is used for point geometries. It's a much simpler object, though with only four configurable properties:
To round out our understanding of the image styles, redo the previous example using ol.style.Circle instead of ol.style.Icon as the image property of the earthquake style. Your result should look something like this (depending on what values you choose):
We saw the text style in action in the first example, and we also saw that it wasn't very useful to include a static text style—at least in that example. In general, text styles will be much more useful when the text that is displayed is derived from some property of the feature being displayed. We'll look at how to do that at the end of the chapter, so for now, let's finish up the basic style section with the properties available to text styles:
Remember, from the beginning of the chapter, that we said there were three different ways of specifying styles:
ol.style.Styleol.style.Style instancesWe've looked at the first, using ol.style.Style, in detail. The second, an array of styles, is really not much different from the first, that is, you are still dealing with the basic styles. The difference is that when you provide an array of styles, features are rendered once for each style. This means each feature is rendered more than once, which can provide some interesting effects. An example is probably the best way of illustrating this.
In this example, we'll use the country data again and draw each polygon with two styles to create a shadow effect around the continents.
countryStyle to provide a somewhat darker stroke:var countryStyle = new ol.style.Style({
fill: new ol.style.Fill({
color: [203, 194, 185, 1]
}),
stroke: new ol.style.Stroke({
color: [101, 95, 90, 1],
width: 1
}),
zIndex: 2
});var shadowStyle = new ol.style.Style({
stroke: new ol.style.Stroke({
color: [0, 0, 127, 0.15],
width: 8
}),
zIndex: 1
});var countries = new ol.layer.Vector({
source: new ol.source.GeoJSON({
projection: 'EPSG:3857',
url: '../assets/data/countries.geojson'
}),
style: [shadowStyle, countryStyle]
});By combining two styles, we achieved the desired effect. In the first step, we modified our starting style slightly to sharpen the country outline—this makes them easier to see over the shadows. In the second step, we added another style for the country layer with a wide, mostly transparent stroke and no fill. Lastly, we provided an array as the style property for our countries layer.
There is one thing you really need to be aware of when using arrays of styles—each feature is drawn once for each style. This can have dramatic performance implications when dealing with a lot of features. If you create a style array with two styles, you are effectively doubling the number of features being rendered. This will have no visible effect on a small number of simple features, but will start to have a noticeable effect when rendering lots (say hundreds of thousands) of features, or a smaller number of highly complex features.
In practice, it doesn't really double the rendering time as their efficiencies are built into OpenLayers that try to avoid expensive operations as much as possible. For example, the same effect can be achieved using two vector layers. This will be more inefficient as OpenLayers has to process the geometries twice, while they only have to be processed once when using an array of styles.
If you have been paying attention, you will have noticed that we added a zIndex property to each style in the previous example. Try removing the zIndex from both the styles and observe the result. This should give you an appreciation of what the zIndex property does. Without it, OpenLayers renders the features one at a time with their complete style, which would mean that the shadow from one country will overlap an adjacent country rather than just forming a shadow around each continent.
Now that we've seen all the basic style properties and how to combine them as arrays of styles, it's time to learn how to use them in conjunction with feature properties to achieve dynamic styles. This is actually the last of our three ways of specifying the style property—the style function.
We said at the beginning of the chapter that a style function is one that returns an array of style objects to be used for a specific feature and zoom level.
What does this mean? It's really quite straightforward, but extremely powerful. A style function is nothing more than a JavaScript function that receives two parameters—the feature being styled, and the resolution of the map's view. It is required to return an array of ol.style.Style objects when it is called. For instance, we could have written our country style example using a style function like this:
var countryStyleFunction = function(feature, resolution) {
return [countryStyle]; // the basic style we already defined
};
var countries = new ol.layer.Vector({
source: countrySource,
style: countryStyleFunction
});This example doesn't use the feature or the resolution arguments, but does illustrate how simple the concept of a style function is. In fact, when you provide a style or an array of styles as the style property of a vector layer, OpenLayers creates a style function internally that looks exactly like this.
You might be wondering if it's this simple, then how can we claim that it's extremely powerful? The power really comes when you use the feature and the resolution to dynamically create styles.
At the end of the previous chapter, we introduced the concept of feature properties and the methods used to retrieve them. Now, we can make practical use of this knowledge by using properties to create styles on the fly.
For this example, we will render the country layer by styling each country based on income level by associating its country code to income level data provided by the world bank. There are quite a few brackets; so, we've simplified it to four levels: high, medium, low, and poor. We'll draw each country in a color associated with its income level based on these brackets. Let's start from the previous example.
<script> tag, before anything else, we will define colors for the four brackets. Use any colours you like:var high = [64,196,64,1]; var mid = [108,152,64,1]; var low = [152,108,64,1]; var poor = [196,32,32,1];
var incomeLevels = {
'HIC': high, // high income
'OEC': high, // high income OECD
'NOC': high, // high income, non-OECD
'UMC': mid, // upper middle income
'MIC': mid, // middle income
'LMC': mid, // lower middle income
'LIC': low, // low income
'LMY': low, // low and middle income
'HPC': poor // heavily indebted poor country
};var defaultStyle = new ol.style.Style({
fill: new ol.style.Fill({
color: [250,250,250,1]
}),
stroke: new ol.style.Stroke({
color: [220,220,220,1],
width: 1
})
});var styleCache = {};
function styleFunction(feature, resolution) {
var level = feature.get('incomeLevel');
if (!level || !incomeLevels[level]) {
return [defaultStyle];
}
if (!styleCache[level]) {
styleCache[level] = new ol.style.Style({
fill: new ol.style.Fill({
color: incomeLevels[level]
}),
stroke: defaultStyle.stroke
});
}
return [styleCache[level]];
}var source = new ol.source.GeoJSON({
projection: 'EPSG:3857',
url: '../assets/data/countries.geojson'
});
var countries = new ol.layer.Vector({
source: source,
style: styleFunction
});var key = source.on('change', function(event) {
if (event.target.getState() == 'ready') {
source.unByKey(key);
$.ajax('../assets/data/income_levels.json').done(function(data) {
source.forEachFeature(function(feature) {
var code = feature.get('iso_a2');
if (data[code]) {
feature.set('incomeLevel', data[code]);
}
});
});
}
});Let's review what is happening in this example. We are using a standard setup for vector layers, and combining some extra data into our features dynamically. The data is used to style, or classify, the country polygons by the income level as recorded by the world bank. Some interesting things are happening in this example; so we'll look at each step and highlight what's going on.
In step 1, we created some colors to be used to fill countries that fall into one of the four income categories. The number of categories is arbitrary—you can create colors for each of the income levels, or decide to group them differently.
In step 2, we created an object that we can use to look up a color based on an income level, and in step 3, we defined a default style. It's usually good practice when dealing with data that can change to have some kind of fallback so that your code doesn't break. We'll use the default style if we can't find a income level in our lookup object.
In step 4, we created our style function. Another best practice is to reuse style objects as much as possible. Since several countries might be drawn in the same style, we created an empty object (the styleCache) to store previously created styles. The actual function comes next. When the style function is called, it gets a reference to the feature being styled and the current resolution of the view on which it is being rendered. We aren't using the resolution in this example. We are using the feature, however. The feature should have a property called incomeLevel that matches the values in our lookup tables, so we grab that value and assign it to a variable. If the income level wasn't set or if it doesn't exist in the lookup table, we'll return the default style. Otherwise, we can check to see whether the styleCache object already has a style for this income level. If it doesn't, we need to create a new style using the color from our lookup table. In this case, we are using the default style's stroke for everything, but you could easily change the stroke for each feature too. Because we've assigned the new style to the correct slot in the cache, we can then return it directly.
Note that in both cases, we return an array containing the style. This is required for a very important reason: performance! The Style functions are executed a lot of times when rendering vector features and if OpenLayers had to check the return type of each call to see if it was a style object or an array of style objects, this would add significant overhead to the rendering pipeline. For individual features, the difference is so tiny that it's probably not measurable even with the best of tools. For many features, this tiny difference adds up to a lot and it is measurable. The OpenLayers developers have put a lot of effort into this kind of detail and it shows!
In step 5, we modified the layer to use the style function we just created and defined a separate variable for the source. This was to make the next step a little easier.
In step 6, we loaded the income level data. The goal of the code in this step is to load the income data and associate it with the appropriate country feature. To do this, we need to make sure that the country features have been loaded. Once the countries are loaded, then, we need to load the income data. Then we can create a new property on each country feature with the appropriate income level. There are a few important things happening in this step, so we'll review each line:
ol.Observable and so they provide the on() method for this. Recall from Chapter 2, Key Concepts in OpenLayers, that the on() method returns a key that can be used later to deregister an event handler (using the unByKey() method)—we'll need it in just a moment. The change event on a vector source is triggered when the source changes state.unByKey() method so that the handler doesn't get called again. This is very important. A source triggers the change event when its state changes, but also when any of its features change. This means that our event handler will get called again when we add properties to the feature. Since the state of the source will already be ready, our code will try to load the income data again and will create an infinite loop.ajax() method. The data loaded from this file is passed to the function we register using done().forEachFeature() and providing a function that will be called with each feature.iso_a2 property of the feature, which is a two letter code associated with each country. The income data in our file is organized by this code so we can use this code to get the income level for each country.These eight lines of code accomplish quite a bit and combine concepts from other chapters of this book, including Chapter 2, Key Concepts in OpenLayers (event registration and deregistration) and Chapter 5, Using Vector Layers (vector layers, vector sources, and feature properties).
To round off our chapter on vector styles, let's explore combining vector styles with user interaction. In the previous chapter, we responded to the mouse moving over a country by displaying the country's name in an HTML element outside the map. We'll build on this example and take it one step further. As the mouse moves, we'll highlight the country under the mouse and draw its flag and name in the center of the country using a feature overlay. The feature overlays are something new; so, we'll need to learn something about them before we go ahead with our example though.
The FeatureOverlay class, ol.FeatureOverlay, is a special type of vector layer designed to render a small number of temporary features in a specific style. It isn't a full-fledged vector layer, but it is highly optimized for the specific case of highlighting features in a temporary way. This sounds ideal for our use case!
Creating a new feature overlay is just like creating any other class in OpenLayers, just pass some options to configure it. Here are the options that can be passed to the ol.FeatureOverlay constructor:
The FeatureOverlay class has several methods to manage its features, map, and styles as follows:
Feature overlays are pretty simple and most of what you will want to do with a feature overlay once it is configured with a style and map is manage features. Let's see how that's done!
Now we have the knowledge we need to build our final example. We will add some interactivity to our countries layer by highlighting the country under the mouse with a different style—specifically, we will:
var countries = new ol.layer.Vector({
source: new ol.source.GeoJSON({
projection: 'EPSG:3857',
url: '../assets/data/countries.geojson'
})
});
var center = ol.proj.transform([0, 0], 'EPSG:4326', 'EPSG:3857');
var view = new ol.View({
center: center,
zoom: 1,
});
var map = new ol.Map({
target: 'map',
layers: [countries],
view: view
});var baseTextStyle = {
font: '12px Calibri,sans-serif',
textAlign: 'center',
offsetY: -15,
fill: new ol.style.Fill({
color: [0,0,0,1]
}),
stroke: new ol.style.Stroke({
color: [255,255,255,0.5]
width: 4
})
};
var highlightStyle = new ol.style.Style({
stroke: new ol.style.Stroke({
color: [255,0,0,0.6],
width: 2
}),
fill: new ol.style.Fill({
color: [255,0,0,0.2]
}),
zIndex: 1
});function styleFunction(feature, resolution) {
var style;
var geom = feature.getGeometry();
if (geom.getType() == 'Point') {
var text = feature.get('text');
baseTextStyle.text = text;
var isoCode = feature.get('isoCode').toLowerCase();
style = new ol.style.Style({
text: new ol.style.Text(baseTextStyle),
image: new ol.style.Icon({
src: '../assets/img/flags/'+isoCode+'.png'
}),
zIndex: 2
});
} else {
style = highlightStyle;
}
return [style];
}var featureOverlay = new ol.FeatureOverlay({
map: map,
style: styleFunction
});pointermove event and manage the features in our feature overlay based on where the mouse is. This is a pretty big function that exercises our knowledge of geometries from the previous chapter:map.on('pointermove', function(browserEvent) {
featureOverlay.getFeatures().clear();
var coordinate = browserEvent.coordinate;
var pixel = browserEvent.pixel;
map.forEachFeatureAtPixel(pixel, function(feature, layer) {
if (!layer) {
return; // ignore features on the overlay
}
var geometry = feature.getGeometry();
var point;
switch (geometry.getType()) {
case 'MultiPolygon':
var poly = geometry.getPolygons().reduce(function(left, right) {
return left.getArea() > right.getArea() ? left : right;
});
point = poly.getInteriorPoint().getCoordinates();
break;
case 'Polygon':
point = geometry.getInteriorPoint().getCoordinates();
break;
default:
point = geometry.getClosestPoint(coordinate);
}
textFeature = new ol.Feature({
geometry: new ol.geom.Point(point),
text: feature.get('name'),
isoCode: feature.get('iso_a2').toLowerCase()
});
featureOverlay.addFeature(textFeature);
featureOverlay.addFeature(feature);
});
}As you can see, feature overlays make it very simple to create an interactive experience with vector layers. There are a few new concepts in this example, as well as some old ones, so let's review the code step by step.
Step 1 should be pretty familiar to you now—we are creating a vector layer with a GeoJSON source, and adding it to a map with a view centered on 0,0.
In step 2, we set up some styles for our feature overlay to use. There are two styles—one for text and one for polygon highlighting. Notice that the baseTextStyle is an object literal, not a new instance of ol.style.Text. When you create an instance of ol.style.Text, the text to be drawn needs to be passed to that object and you can't change the text after it has been created. The style function allows us to create text styles with the text of the current feature, but we'll need to specify the other options. Since all labels will share the other text options, we can set them up once and just refer to them later in the style function. The options we've specified here are to center align the text, offset it up by 15 pixels (recall that a positive offsetY moves the text down), and provide a fill and stroke color. For the text, the stroke is rendered around the outside of each character so we set a wide, semitransparent stroke to make the text stand out from the map beneath it.
The highlightStyle is straightforward— a fill and stroke style for the highlighted polygon.
The style function needs to be defined before we can use it to create the feature overlay, so in step 3, we defined it. Recall that the style function receives the feature being rendered as the first argument. We drew two types of features, points, and polygons, with two different styles. So, the first thing we did was get the feature's geometry and check to see whether it was a point. If it is a point, we create a new text style and a new icon style specific to the current feature. We got the feature's text property and combined it with the baseTextStyle object to create the text style. Next, we got the isoCode property and used it to create a URL to the flag for the country (the flag icons are conveniently named using the two-letter ISO country code) for a new icon style. Then, we created a new style object for the current feature. If the feature is a polygon, it's much simpler—all we need to do is return the highlightStyle object. Finally, we returned an array containing the style (recall that style functions are required to return arrays for performance reasons).
Step 4, by comparison, was very short! We created a new feature overlay and configured it with the map object and style function. It's really the style function, and step 5, that do all the work.
Step 5 added a handler for the map's pointermove event; so, we could find the feature closest to the mouse and add it to the feature overlay. We actually wanted to highlight two features— the polygon itself and a point at the center of the polygon. It turns out that getting this center point is a bit tricky. Let's review the code carefully.
Line 1 of code in the handler clears any existing features in the feature overlay. It is much easier to retrieve the collection and clear it than to remove individual features in our case.
The browserEvent object provides us with the map coordinate and pixel that the event happened at. We used the pixel location with ol.Map classes forEachFeatureAtPixel function on the next line to retrieve all features at that location from our vector layer. This function invokes a callback function for every feature at the pixel location, providing both the feature and the layer that the feature was found on. The layer parameter may be null if the feature was found on a FeatureOverlay.
Inside our callback function, we tested first to see if the feature was actually on a layer before proceeding. Then we needed to find both the geometry and the center point of the geometry. If all the country features were polygons, we could simply call getInteriorPoint() to retrieve the center and we would be done. Unfortunately, we didn't know what type of features we were dealing with—some of the features in the country data were actually MultiPolygons, and we needed to handle them differently. The switch statement chooses a path based on the type of the feature. Let's look at each case separately.
The first case was for MultiPolygon. As the name suggests, a MultiPolygon class contains multiple polygons (a country and some islands perhaps) and there isn't a convenient way to determine the center of a group of polygons. Instead, a MultiPolygon class has several centers, one for each of its constituent polygons. The getInteriorPoints() method returns the center points for us. We only really wanted a single label though. One way is to get all the interior points and use the first one. The problem with this approach is that there is no particular order to the polygons, and it looks odd to label some random island off the coast rather than the major landmass of a given country. To get around this, we wanted our label to appear at the center of the largest polygon. To get the largest polygon, we first got the array of polygons and then reduced that array to a single value with a function that compared two polygons based on their area. The reduce method is a standard method of JavaScript arrays. Once we've found the largest polygon, we can ask for its interior point.
The second case is for polygon, and was much simpler— we just needed the interior point of the polygon and we were done!
The final case was the default case. While it isn't strictly needed, it is good practice to include a default case in switch statements. The getClosestPoint() method is available on all geometry types and is a safe fallback for our default case.
Now that we had a point coordinate at the best location we could determine for the feature under the mouse, we created a new Feature and provided the point geometry for its location. We also added two properties—text (that we displayed at the point) and isoCode (that we will use to find the flag icon for the country).
Finally, we added both features to the feature overlay so that when the map is next rendered, the country under the mouse will be highlighted in red and display the flag and country name at the center.
This concludes our chapter on styling vector layers. OpenLayers' styling capabilities are quite simple to implement, but can be incredibly powerful. The basic styles are easy to set up and give you a lot of flexibility in styling your vector features. More complex styling is readily implemented through the use of a style function by allowing you to create basic styles tailored to a specific feature and current zoom level of the map. The building blocks—basic styles and the style function—are simple, but the combination of them allows you to create highly custom cartographic representations for your vector data.
In the next chapter, we will dig into projections and discover how to use them to display both vector and raster layers in different projections.
When you look at a map, you are looking at a two-dimensional representation of a 3D object (the Earth). Because we are, essentially, 'losing' a dimension when we create a map, no map is a perfect representation of the Earth. All maps have some distortion.
The distortion depends on what projection (a method of representing the earth's surface on a two dimensional plane) you use. In this chapter, we'll talk more about what projections are, why they're important, and how we can use them in OpenLayers. We'll also cover some other fundamental geographic principles that will help make it easier to better understand OpenLayers.
In this chapter, we will cover the following topics:
Let's get started!
No maps of the earth are truly perfect representations; all maps have some distortion. The reason for this, is because they are attempting to represent a 3D object (an ellipsoid: the Earth) in two dimensions (a plane: the map itself).
A projection is a representation of the entire, or parts of a surface of a 3D sphere (or more precisely, an ellipsoid) on a 2D plane (or other types of geometry).
Every map has some sort of projection—it is an inherent attribute of maps. Imagine unpeeling an orange and then flattening the peel out. Some kind of distortion will occur, and if you try to fully fit the peel into a square or rectangle (like a flat, two-dimensional map), you'd have a very hard time.
To get the peel to fit perfectly onto a flat square or rectangle, you can try to stretch out certain parts of the peel or cut some pieces of the peel off and rearrange them. The same sort of idea applies while trying to create a map.
There are literally an infinite amount of possible map projections; an unlimited number of ways to represent a three-dimensional surface in two dimensions, but none of them are totally distortion free.
So, if there are so many different map projections, how do we decide on which one to use? Is there a best one? The answer is no. The 'best' projection to use depends on the context in which you use your map, what you're looking at, and what characteristics you wish to preserve.
As a two-dimensional representation is not without distortion, each projection makes a trade off between some characteristics. As we lose a dimension when projecting the earth onto a map, we must make some sort of trade off between the characteristics we want to preserve. There are numerous characteristics, but for now, let's focus on three of them.
Area refers to the size of features on the map. Projections that preserve area are known as equal-area projections (also known as equiareal, equivalent, or homolographic). A projection preserves area if, for example, a meter measured at different places on the map covers the same area. Because area remains the same, angles, scales, and shapes are distorted. This is what an equal area projected map may look like:
Here, we use Tissot indicatrix with EPSG:3410 NSIDC EASE-Grid Global, where the EPSG code helps define all existing projections. We will cover EPSG in detail, later in this chapter.
Without going into technical details, Tissot indicatrix is a way to display map projections deformation visually. In a perfect projection, we will keep area, distance, and shape, with circles with equal area and equal distance.
As you see, with this equal-area projection, we have circle and ellipse shapes but areas remain the same.
Scale is the ratio of the map's distance to the actual distance (for example, one centimeter on the map may be equal to one hundred actual meters). All map projections show scale incorrectly at some areas throughout the map; no map can show the same scale throughout the map. There are parts of the map, however, where scale remains correct—the placement of these locations mitigates scale errors elsewhere. The deformation of scale also depends on the area being mapped. Projections are referred to as equidistant if they contain true scale between a point and every other point on the map.
An example to illustrate can be the EPSG:32662 projection known as Plate Carree.
Here, we keep the distance between the center of the ellipse/circle. We overlay on top of the image of a grid so that you can better evaluate distance.
Maps that preserve shape are known as conformal or orthomorphic. Shape means that relative angles to all points on a map are correct. Most maps that show the entire earth are conformal, such as the Mercator projection (used by Google Earth and other common web maps). Depending on the specific projection, areas throughout the map are generally distorted but may be correct in certain places. Also, a map that is conformal cannot be equal-area.
To illustrate shape preservations, let's see the following example using EPSG code 3395 (WGS 84 - World Mercator), where all circles stay circles wherever they are:
Projections have numerous other characteristics, such as bearing, distance, and direction. The key concept to take away here is that all projections preserve some characteristics at the expense of others. For instance, a map that preserves shape cannot completely preserve area.
There is no perfect map projection. The usefulness of a projection depends on the context the map is being used in. A particular projection may excel at a certain task, for example, navigation, but can be a poor choice for other purposes. For example, when we do thematic mapping and respect representations rules, colors are related to areas of countries. When we look at a world thematic map with a wrong projection, our eyes see a country bigger than the others, whereas because of projections, this country can, in reality, have a calculated area identical to countries represented with a smaller size.
The following figure overlays an area preserving projection (Robinson) on top of a Spherical Mercator to show the difference and why it matters:
One of the simple ways to convince you that each projection has a reason to exist is to visit the OpenLayers 3 website examples.
We will compare the scale line example, http://openlayers.org/en/v3.0.0/examples/scale-, with the tiled WMS with the custom projection example, http://openlayers.org/en/v3.0.0/examples/wms-custom-proj.html.
Your instructions until now are:
Projections are projected onto a geometric surface, three of the most common ones being a plane, cone, or cylinder.
Imagine a cylinder being wrapped around the earth, with the center of the cylinder's circumference touching the equator. Now, the earth is projected onto the surface of this cylinder, and if you cut the cylinder from top to bottom vertically and unwrap it and lay it flat, you'd have a regular cylindrical projection:
The Mercator projection is just one of these types of projections. If you've never worked with projections before, there is a good chance that most of the maps you've seen were in this projection.
Because of its nature, there is heavy distortion near the ends of the poles. Looking at the previous screenshot, you can see that the cells get progressively larger, the closer you get to the North and South poles. For example, Greenland looks larger than South America, but in reality, it is about the size of Mexico. For illustrating this problem visually, you can compare countries overlapping with http://overlapmaps.com. If area distortion is important in your map, you might consider using an equal area projection, as we mentioned earlier.
More information about projections can be found at the USGS (US Geological Survey) website at http://pubs.er.usgs.gov/publication/pp1395, where you can download the reference book Map Projections: A Working Manual (U.S. Geological Survey Professional Paper 1395), John P. Snyder, 1987, 397 pages.
As we mentioned, there are literally an infinite number of possible projections. So, it makes sense that there should be some universally agreed upon classification system that keeps track of projection information. There are many different classification systems, but OpenLayers uses EPSG codes. EPSG refers to the European Petroleum Survey Group, a scientific organization involved in oil exploration, which in 2005 was taken over by the OGP (International Association of Oil and Gas Producers).
For the purpose of OpenLayers, EPSG codes are referred to as EPSG:4326.
The numbers (4326, in this case) after EPSG: refer to the projection identification number. It uses the familiar longitude/latitude coordinate system, with coordinates that range from -180° to 180° (longitude) and -90° to 90° (latitude).
Let's create a basic map using a different projection. Using the usual code from Chapter 1, Getting Started with OpenLayers, recreate your map object the following way. We'll be specifying the projection property, along with the center and zoom properties. The projection we will use is EPSG:4326, a projection used for world data. Usually, when you don't specify a projection, the default projection in OpenLayers is EPSG:3857 (historically, called EPSG:900913), used by Google Maps and other third-party APIs such as Bing Maps or OpenStreetMap.
var blueMarbleLayer = new ol.layer.Tile({
source: new ol.source.TileWMS({
url: 'http://maps.boundlessgeo.com/geowebcache/service/wms',
params: {
'TILED' : true,
'VERSION': '1.1.1',
'LAYERS': 'bluemarble',
'FORMAT': 'image/jpeg'
}
})
});var view = new ol.view({
projection: 'EPSG:4326',
center: [-1.81185, 52.44314],
zoom: 6
});var map = new ol.Map({
target: 'map'
});map.addLayer(blueMarbleLayer); map.setView(view);
chapter7_ex1.html. You should see something like the following:We just created a map with the EPSG:4326 projection. The process to use another projection is really similar to all previous examples in the book.
One of the main differences is the backend server. It can provide a layer projected in another projection from the default one in OpenLayers 3 library. In our case, it's the source URL, http://maps.boundlessgeo.com/geowebcache/service/wms, from the blueMarbleLayer layer object that permits this.
The other difference is at the view level. In the constructor, we set a new property: projection that refers to wanted EPSG code and we also directly use coordinates from the projection to set the center on our map.
Apart from the code, you'll notice that the example looks quite different from the maps we've made so far. This is because of its projection.
OpenLayers supports any projection, but if you want to use a projection other than EPSG:3857, you must specify this option in the view projection. The default value is EPSG:3857.
If you do not specify this option, the default value is used (most of the other maps so far, have been using the default values).
You can pass to the projection a string with EPSG:yourcode, but you can also give it an ol.proj.Projection object. You can define it manually but most of the time, you will retrieve it from a preconfigured projection setting. We will only cover how to define it when you are using Proj4js, a JavaScript library dedicated to manage projections. As a beginner will not need to work with use cases without EPSG codes. Be careful, as OpenLayers only supports EPSG:4326 and EPSG:3857 (both with a few aliases) out-of-the-box.
Longitude and latitude are two terms most people are familiar with, though they have limited geographic knowledge or get confused by the two. Let's take a look at the following screenshot and then go over these two terms:
Latitude lines are imaginary lines parallel to the equator, aptly known also as parallels of latitude. Latitude is divided into 90 degrees, or 90 spaces (or cells), above and below the equator. -90° is the South Pole, 0° would be the Equator, and 90° is the North Pole.
Each space, or cell, (from 42° to 43°, for example) is further divided into 60 minutes and each minute is further divided into 60 seconds. The minutes and seconds terminology has little to do with time. In the context of mapping, they are just terms used for precision. The size of a degree of latitude is constant (if calculation bot is based on projected distance). Because they measure 'north to south', OpenLayers considers the y coordinate to be the latitude.
Longitude lines are perpendicular to the lines of latitude. All lines of longitude, also known as meridians of longitude, intersect at the North Pole and South Pole, and unlike latitude, the length of each longitude line is the same. Longitude is divided into 360 degrees, or spaces. Similar to latitude, each space is also divided into 60 minutes, and each minute is divided into 60 seconds. For EPSG:4326, -180 to 0 measures west of the Greenwich meridian, whereas 0 to 180 measures east of Greenwich.
As the space between longitude lines gets smaller, the closer you get to the poles, the size of a degree of longitude changes (when not relying on projected distance). The closer you are to the poles, the lesser time it will take you to walk around the Earth.
With latitude, it makes sense to use the equator as 0°, but with longitude, there is no spot better than to start the 0° mark at. So, while this spot is really arbitrary, the Observatory of Greenwich, England, is today universally considered to be 0° longitude. Because longitude measures east and west, OpenLayers considers the x coordinate to be longitude.
Let's take a look at a couple of examples on coordinates from our previous maps:
map.getView().getCenter();
Depending on where you have panned, your output should read something like the following:
[9397474.0038099,3595597.9798909]
map.getView().getCenter();
You should see something like the following:
[-72.8125, 19.6875]
ol.coordinate.toStringHDMS([-72.8125, 19.6875]);
We just took a look at the longitude and latitude values for the center of the map in two different maps with different projections. When we call map.getView().getCenter(), we get back an ol.Coordinate object, in fact, an array of x, y values.
In the first map, the max extent of the map was between -20037508.342789244 meters and 20037508.342789244 meters for x, and between -20037508.342789244 meters and 20037508.342789244 meters for y.
These are the values used by the EPSG:3857, and it is an x and y type of Cartesian coordinate system. The values for x and y change in the second map because they are not in the same projection (they are in EPSG:4326). So, x are between -180° and 180° and y between -90° and 90°.
The x and y means longitude and latitude, respectively in EPSG:4326 and easting and northing in EPSG:3857. To understand definition of easting and northing, go to the Wikipedia dedicated page, https://en.wikipedia.org/wiki/Easting_and_northing.
So far, we've been talking about the abstract idea of a projection. Let's dive into OpenLayer's ol.proj namespace functions and the associated class ol.proj.Projection class, which is what we use to actually handle projections. The ol.proj.Projection class relies on internal code, managing the most used projection in the web mapping world: the EPSG:4326 projection (also named WGS 84) and the EPSG:3857 projection, also known as EPSG:900913 (using leetspeak, it means Google, the first company relying on this exact projection), and also, alternatively named WGS 84 Spherical Mercator. For reference, you can have the full history of the second projection at http://wiki.openstreetmap.org/wiki/EPSG:3857
For other use case such as custom projections, OpenLayers, for convenience, supports an external library called Proj4js, which can be found at http://proj4js.org. First, we'll talk about what we can do without the Proj4js library, and then talk about what we can do with it.
In truth, whenever you load your web mapping application, you have already instantiated the default projections, EPSG:4326 and EPSG:3857.
You only need to access ol.proj.Projection by typing the following line of code:
ol.proj.get('EPSG:3857')In ol.proj.get, you can use a projectionCode, a string for identifying the WKID (Well Known Identifier) for the projection, such as an EPSG code in the form of EPSG:4326.
When creating a map and loading a particular projection, you will only require to declare Proj4js-specific definition and use OpenLayers built-in functions to use them. This string, such as EPSG:4326, is also known as an SRS (Spatial Reference System) code. When passing in a code, like we've done with all our examples so far, ol.proj.get() will automatically create a projection object, as long as the projection definition is known to Proj4js.
The projection class (the list is available at http://openlayers.org/en/v3.0.0/apidoc/ol.proj.Projection.html) has a number of methods, including the following:
Transforming a point means you take a coordinate in one projection and turn it into a coordinate of another projection. This operation is also called reprojection. The term reprojection is also applied when deforming a raster image from one projection to another. Apart from transforming EPSG:4326 to EPSG:3857 and vice versa, OpenLayers does not provide support for transforming other projections out-of-the-box. To do transforms with other projections, you can include Proj4js (which can be found at http://proj4js.org) or provide your own transforms and register them with OpenLayers. You may be wondering why. The main reason is to not maintain projections in the core library when we can keep it outside, in a well-maintained library. The other goal, is to avoid increasing the overall library size. There are thousands of projections, whereas most projects only require some of them. The gain is not worth the drawback.
In most scenarios, it is the job of the backend map server to handle projection transformations. Often, it's useful or faster to do it on the client-side (such as in the case of vector layer coordinate transformations) because we don't need to call server-side again for transformation or because we don't control the server-side like for external web services. Let's take a look at how to transform EPSG:4326 to EPSG:3857 with OpenLayers.
Proj4js is not necessary for this example, as transforming between these two projections is possible without proj4js. Try the following steps:
var proj_4326 = ol.proj.get('EPSG:4326');
var proj_3857 = ol.proj.get('EPSG:3857');var point_to_transform = [-79, 42];
EPSG:4326 (our source proj_4326 projection object) to EPSG:3857 (our destination proj_3857 projection object):var myTransformedPoint = ol.proj.transform(point_to_transform, proj_4326, proj_3857);
console.log(myTransformedPoint); console.log(myTransformedPoint[0], myTransformedPoint[1]);
[-8794239.7714444, 5160979.4433314] -8794239.7714444 5160979.443 3314
We just transformed a point in the EPSG:4326 projection to a point in the EPSG:3857 projection. Let's take a closer look at the transform method we called on the point_to_transform object:
ol.proj.transform(point_to_transform, 'EPSG:4326', 'EPSG:3857');
This will transform the original point from the EPSG:4326 projection to the EPSG:3857 projection. Notice, we are calling the function directly from an ol.Coordinate array. The ol.proj.transform() function's definition is as follows:
In this case, our source projection is in EPSG:4326, and our destination projection is in EPSG:3857. Keep in mind however, that EPSG:4326 and EPSG:3857 are the only two projections you can do transforms on with OpenLayers out-of-the-box.
When creating a map, all the raster layers (image-based layers; nearly every layer except the vector and image layer) must be in the same projection as the map. It's possible to do projection transformations with coordinates and the vector layer, but once OpenLayers gets back an image from a map server, it cannot reproject the image itself (that's something the map server has to do).
The Proj4js library allows you to transform the coordinates from one coordinate system into another coordinate system. The Proj4js website is http://proj4js.org. By just including the Proj4js library on your page (like you do with OpenLayers), you can do more transforms within OpenLayers. Note that Proj4js also only ships with only a few codes. Definitions need to be added for all others.
The site http://epsg.io contains Proj4js definitions for most of the EPSG codes. When you are using data from foreign countries, you need to know the most common used projections. For this, go to the ProjFinder website, http://projfinder.com, and guess projections for unknown places.
Ideally, you should be using the same projection throughout your map, but there are times when you may want to display the coordinates in a different projection—such as with a vector layer. Let's take a look at how to set up the Proj4js library.
This step is similar to the way we set up the now usual template for OpenLayers 3.
proj4.js file into a new assets/proj4js directory at the root code directory.<head> section of your code before the OpenLayers 3 library inclusion code:<script src="../assets/proj4js/proj4.js"> </script>
var test_proj = proj4('EPSG:4326');
console.log(test_proj);
Object {forward: function, inverse: function, oProj: Projection}
We just included the Proj4js library and tested to see if it worked. If you received an error when you attempted to call proj4('EPSG:4326'), it means that the location of the proj4.js file was wrong. Ensure that the path in the <script> tag correctly references the JavaScript file.
Proj4js custom projections are required, particularly when you are using data at the local level and you want to use your country official projection(s) or you depend on external data sources such as web services.
Now that the Proj4js library is included, you can do transforms with more projections, the same way we did in the previous example. Except EPSG:3857, EPSG:4326, and EPSG:4269, there are no projections defined; however, you are able to define them yourself. For example, for France, the main official EPSG code is as follows:
proj4.defs("EPSG:2154","+proj=lcc +lat_1=49 +lat_2=44 +lat_0=46.5 +lon_0=3 +x_0=700000 +y_0=6600000 +ellps=GRS80 +towgs84=0,0,0,0,0,0,0 +units=m +no_defs");After this, you'd be able to use EPSG:2154 for projection transformations just like you were able to use EPSG:4326 and EPSG:3857 from the earlier examples.
A more complete list of projections (containing Proj4js definitions for nearly any EPSG code) can be found at http://epsg.io.
To get projection definitions, you can copy them from http://epsg.io or also load them from the URL. For example, adding the proj4.js script after the <script src="http://epsg.io/2154.js"></script>. The URL pattern to retrieve the definition is http://epsg.io/xxx.js where xxx is the EPSG code you want to use.
When you are using custom projections in OpenLayers 3, you need to declare the projection, as described earlier. Use ol.proj.get to retrieve its definition and define the projection extent. For this, reuse the http://epsg.io site.
When you want to declare a custom projection, you must create an object, such as the preceding one, when you start your JavaScript code:
var projection = ol.proj.get('EPSG:2154');
projection.setExtent([-378305.81, 6093283.21, 1212610.74, 7186901.68]);You will then be able to use the usual ol.proj.transform function with this new projection.
Sometimes, in another context for example, to provide parameters to web services it can be necessary to convert extent between projections. Let's inspect how to do this operation.
Until now, we only see how to do reprojection using points coordinates but how can we do it for extent?
console.log(extent);
ol.proj.transformExtent(extent, 'EPSG:21781', 'EPSG:4326');
We reused the function behind the ol.proj.transform function without knowledge.
The ol.proj.transformExtent method expects an extent as a first parameter, as a second parameter, it needs the origin projection, and as a third parameter, it's the destination projection. We declared that we use as input the extent; as origin, EPSG:2181; and as destination, EPSG:4326. At the internal OpenLayers 3 library level, the function loops on the extent and transforms each coordinate.
With this function, if we need to get a bounding box in EPSG:4326 from local projections, it will really help.
If you remember Chapter 4, Interacting with Raster Data Source, we introduced you to the tiled and untiled raster. Most tiled rasters do not serve in a foreign projection, for example, a non-Spherical Mercator projection, but contrary to most cases, WMS sources can be served and consume using custom projections.
In this part, we will see how to display the WMS image coming from the authority responsible for geology maps in France, the BRGM (equivalent to USGS to simplify):
ol3.js file.<script> tag and declare the additional projection for local projection, in this case, Lambert 93, an official projection for France:proj4.defs("EPSG:2154","+proj=lcc +lat_1=49 +lat_2=44 +lat_0=46.5 +lon_0=3 +x_0=700000 +y_0=6600000 +ellps=GRS80 +towgs84=0,0,0,0,0,0,0 +units=m +no_defs");var extent = [-378305.81, 6093283.21, 1212610.74, 7186901.68];var projection = ol.proj.get('EPSG:2154');projection.setExtent(extent);
EPSG:2154, the EPSG code for Lambert 93:var layers = [new ol.layer.Image({
source: new ol.source.ImageWMS({
url: 'http://geoservices.brgm.fr/geologie',
attributions: [new ol.Attribution({
html: '© ' +
'BRGM (French USGS equivalent)'
})
params: {
'LAYERS': 'SCAN_F_GEOL1M',
'VERSION': '1.1.1'
},
extent: extent
})
})var map = new ol.Map({
layers: layers,
target: 'map',
view: new ol.view({
projection: projection,
center: [495520.187986, 6587896.855407],
zoom: 2
})
});We reused the custom projection by first declaring the Proj4js projection declaration and its extent. We recommend that you visit the website http://epsg.io to better understand how to get the extent and the meaning of the second parameter in from the proj4.defs function.
Then, we used our raster WMS knowledge to create the layer. Analyzing the network can be useful to remind you about the relationship between the WMS source layer declaration and the backend web server delivering the image. You can look in particular at getCapabilities, to inspect the available projections and the layers name you may change, if you want to play with the sample. The most important part to understand is to set the projection in the map view projection parameter. How can we deduce this? We understood that because in all the code, we never set any projection at the layer or source level. We should mention that Proj4js is not needed for maps, as long as they do not need any client-side transforms.
Using our example, a minimal case can be achieved replacing previous projection declarations by only declaring a projection, with units and code parameters like below:
var projection = new ol.proj.Projection({
code: 'EPSG:2154',
units: 'm'
});When someone reviews someone else job, it seems to be quite easy but reusing the same method for your own case is not the same, and will help you to really understand it.
So, we will ask you to complete a simple job:
getCapabilities operation to get a layer's name or projections available for the data. If you don't find public web services using local projections for your country, to complete the assessment, explore other countries local projections web services.Never forget to inspect the Network panel to help you if you encounter web services issues. You may also need to use the DOM renderer within the map; it helps you to inspect the url call. With the default canvas renderer, images are assembled in the background and you can't get the WMS URL that can help you.
To find the open data portals, the main entry for America is https://www.data.gov. For Europe, you should visit http://publicdata.eu. For a worldwide overview, go at http://datacatalogs.org, a website for A Comprehensive List of Open Data Catalogs from Around the World. To grasp the state of OpenData in your country, you can visit Global Open Data Index at http://global.census.okfn.org. It's a website maintained by the community to make surveys about each country's open data initiative. The focus is mainly on the type of open data datasets available.
After inspecting how to work with custom projection using raster layers, it's time to see vector reprojection. We already reviewed how to manipulate vector but not explaining further how to manage vector projections. Let's see a bit about them.
When you draw in OpenLayers, you draw in local projections' features. Then, if you need, for example, to exchange data source with a third party, sometimes you need to make reprojections. It's useful to know how to consume data and reproject them or on the contrary, export them. It's what we will see here:
sandbox directory.var projection declaration, add a new GeoJSON source, a vector source:var countriesSource = new ol.source.GeoJSON({
projection: 'EPSG:2154',
url: '../assets/data/nutsv9_lea.geojson'
});console.log statements:countriesSource.once('change', function(evt) {
if (this.getState() == 'ready') {
console.log(this.getFeatures()[0].getGeometry().getCoordinates());
console.log(this.getFeatures()[0].getGeometry().clone().transform('EPSG:2154','EPSG:4326').getCoordinates());
}
});countriesSource as the source. You will normally write something like the following:var layers = [
new ol.layer.Image({
}),
new ol.layer.Vector({
source: countriesSource
})
];var bbox = new ol.layer.Vector({
source: new ol.source.GeoJSON()
})
map.addLayer(bbox);featureCollection inline. It's recommended by the GeoJSON specifications to have coordinates using EPSG:4326:var geojson = {
"type": "FeatureCollection",
"features": [
{
"type": "Feature",
"properties": {},
"geometry": {
"type": "Polygon",
"coordinates": [
[[-0.944824, 46.134170], [-0.944824, 48.312428],
[4.438477, 48.312428], [4.438477, 46.134170],
[-0.944824, 46.134170]
]
]
}
}
]
}ol.format.GeoJSON with defaultDataProjection:var format = new ol.format.GeoJSON({
defaultDataProjection: 'EPSG:4326'
})bbox layer:var features = format.readFeatures(geojson, {
dataProjection : 'EPSG:4326',
featureProjection: 'EPSG:2154'
});
bbox.getSource().addFeatures(features);console.log statements to help inspect the result, but also see how you can use writeFeatures and reproject.console.log(features);
console.log(
format.writeFeatures(features, {
dataProjection : 'EPSG:4326',
featureProjection: 'EPSG:2154'
})
);We first set a source by defining its target projection. You might not remember but when you consume GeoJSON, the data default projection is supposed to be EPSG:4326, but our previous map example relies on EPSG:2154, a local projection. By setting this parameter, we are able to tell our application to make a reprojection from EPSG:4326 to EPSG:2154.
How can we be sure it works? You just need to inspect your GeoJSON file and see the coordinates. For EPSG:4326, the approximate values are mostly less than a hundred degrees, whereas with EPSG, the units are meters and expressed with thousands of meters.
For this purpose, we already set a listener with countriesSource.once('change', function(evt) { to inspect the features values. We checked before firing the console.log statements that the GeoJSON was ready to use getState. Then, we tried to inspect the coordinates that the layer vector source contained. As you can see, we chained methods to write a shorter code. We requested all the features with the getFeatures method; the 0 index is to select only the first feature in the array. By reusing this feature, we got geometry with getGeometry, and on this geometry, we retrieved the coordinates.
With a second console.log, we started like the previous statement, but we cloned the geometry. It's because we wanted to keep the values in the original feature intact. The API documentation mentions about the ol.geom.Geometry transform method that it transforms a geometry from one coordinate reference system to another, modifies the geometry in place. If you do not want the geometry modified in place, first clone() it and then use this function on the clone.
If you extend both returned arrays in the console, you will see that the transformation to EPSG:2154 was already stored in the features, and by transforming again, we were able to get the EPSG:4326 original values.
For the rectangle box in the new layer, we choose another way to manipulate projections with vector. We choose to use an empty source within a new vector layer.
The goal was to show you that when you need to add features using the addFeatures method from the ol.source.GeoJSON vector source, you need to reproject features using an object ol.format. Here, we used ol.format.GeoJSON, but it could have been ol.format.WKT. As long as the type of format accepts dataProjection and featureProjection as options in the readFeatures, you can make reprojections.
The important part to keep in mind is the role of the ol.format.GeoJSON methods, readFeatures and writeFeatures and their options.
When you use readFeatures, you reproject from EPSG:4326 to EPSG:2154, and when you use writeFeatures, you reproject from EPSG:2154 to EPSG:4326.
At the code level, when you use readFeatures, you need to provide a string or a GeoJSON object with options and when you write them, it must be Array.<ol.Feature> with options. An excerpt from the document will help to understand those options (common to readFeatures and writeFeatures), as follows:
We also need to mention that for simplicity, we used readFeatures and writeFeatures, but for only one feature (when outside a GeoJSON FeatureCollection), you have to use the readFeature and writeFeature methods (note the singular in the methods' names). Refer to the complete API documentation for more at http://openlayers.org/en/v3.0.0/apidoc/ol.format.GeoJSON.html.
After this review, it's up to you to imagine how you can play with features from the source and also how to manage projections in other formats in various use cases, as we mainly focus for demonstration on GeoJSON.
Q1. Give some reasons why you might want to use a projection other than EPSG:3857?
Q2. Which areas will not be best suited for displaying the EPSG:3857 projection?
Q3. You need to get your local country EPSG code, where do you need to go to be efficient?
In this chapter, we talked about projections. We covered what they are and the various different types of projections. Longitude, latitude, and other geographic concepts were also discussed. While we just scratched the surface of these pretty complex topics, you should have enough fundamental information to understand how to use projections.
We also talked about the ol.proj.Projection
class and the namespace ol.proj associated for coordinates' manipulation, along with how to transform coordinates and use the Proj4js library. You'll often work with data in coordinate systems other than EPSG:4326, and knowing how to work with and transform data in other projections is important. Because Proj4js alone is not useful without OpenLayers 3, we also reviewed the different use cases for managing projections in a layer context, depending on the main layer type, for example, vector or raster. It can be useful to know reprojection in vector when you want to manage projections in the various ol.format classes we already discovered in Chapter 5, Using Vector Layers.
Now, after reviewing how projections work, it's time to review how interactions components work. Without even being aware, we already use them but never really highlighted them until now. When you pan the map for instance, you are already using interactions. Let's dive into the next chapter, Interacting With Your Map.
This chapter's goal is to review main interactions in OpenLayers 3. Interactions are components that manage relations between mouse or keyboard actions and the map. They do not rely on HTML elements like buttons.
What are the main interactions? It's the most asked function for end users, such as interactions with events on the map to retrieve map or layers information or to create new information with a drawing. You can, for example, click on a polygon representing a property and find out who owns the place and since when. All such information is called attributes. Along this chapter, we will see how to use main interaction-related components, in particular for querying, drawing, and modifying geographical features. Then, we will see the default interactions at both the functional and code levels. We will end by reviewing the remaining interactions.
In this chapter, we will cover:
Let's get started by reviewing the part related to conversion and selection of vector formats.
Selection is mainly achieved through vector layers. So, a small introduction to data conversion can be useful.
In this section, we want to introduce you to the creation of static data in a particular vector, which is required in most cases where there is a need to click on your map to get information.
Let's see how you can provide vector data to our OpenLayers 3 library. We will not explain again how to work with vectors here—just how to provide them.
If you remember, we told you in Chapter 1, Getting Started with OpenLayers, in the section Anatomy of a web-mapping application, that the OpenLayers 3 library can consume dynamic vector data or static. The main difference resides in the fact that data is dynamically provided on demand. At the end of it all, OpenLayers consumes the same formats.
As a reminder for vector layers, the main following formats are supported:
You can go further by reviewing the content from Chapter 5, Using Vector Layers, and inspecting all ol.format.* available following the API documentation at http://openlayers.org/en/v3.0.0/apidoc/ol.format.html. You should not forget some formats can be abstract classes for other formats.
We have chosen to focus only on GeoJSON and KML: they are the most used formats for static files. As long as your applications do not use large amount of data, it's one of the most practical solutions. But most of the time, we don't have data directly available in those formats: a large percentage of geographic data production and manipulation is done using desktop mapping software that does not use those formats as a primary storage solution.
To understand why, let's see a context where you start to make your own examples. In this case, you have three main choices to have data:
From a programmer's point of view, GIS (Geographical Information System) is software to manage geographical datasets and make maps. We really chose to restrict the definition to keep it simple. That's why we encourage you to learn further by starting with the GIS Wikipedia page http://en.wikipedia.org/wiki/Geographic_information_system and also try out searches through search engines on the topic.
GIS was first used for desktop applications. With the growth of the Web, the GIS world extended to the Internet. The main problems to fill the gap between desktop-oriented geographic data and web geographic data were:
The second is also partly broken with open data, but lots of open data datasets always use GIS Desktop formats like the shapefile. We will not explain this format but demonstrate by an example of how you can do some data conversion.
To find open data portals, the main entry for America is https://www.data.gov.
For Europe, you should visit http://publicdata.eu.
For a worldwide overview, go at http://datacatalogs.org, a website for A Comprehensive List of Open Data Catalogs from Around the World.
To grasp the state of OpenData in your country, you can visit the Global Open Data Index at http://global.census.okfn.org. It's a website maintained by the community to make surveys about each country's open data initiative. The focus is mainly about the type of open data datasets available.
For illustration purposes, we will use data coming from the Geographical Information System at the Commission (GISCO), a Eurostat (an European commission organism) service which promotes and stimulates the use of GIS within the European Statistical System and the Commission. We chose to use the Nomenclature of Units for Territorial Statistics (NUTS), the main administrative units within Europe. Perform these steps to achieve the objective outlined in this paragraph:
ZIP file. After that, click on the Submit button. The following screenshot is the result of these two steps:shp file name NUTSV9_LEAC.shp. You will also see in the page center an Overview Map.ZIP file mygeodata.json. Here's how the screen will look upon performing these steps:NUTSV9_LEAC.json. Rename it now to nutsv9_lea.geojson. Our application will use it later.We saw how we can use an external online website to have a first approach of geographical data conversion without installing specific software on your machine. You also saw that you only review a small part of the possibilities of the online tool to make conversion.
After this small conclusion, let's work more on the topic of data.
Remember that we introduced open data portals during the chapter and GIS files formats in particular in Chapter 5, Using Vector Layers. To revise and go a bit further, perform the following tasks:
Data conversion tips
We chose to introduce you to an on-line application to make GIS data conversion. Imagine that you need to filter a large dataset and the upload size is big; you may need to use a local application for this. We advise you to do it with QGIS at http://qgis.org, an open source desktop software where you can view the geographical dataset itself in a GUI. If you prefer the command line, you'd better use GDAL (Geospatial Data Abstraction Library), a tool to make GIS data conversion, available at http://gdal.org.
You should also visit the website http://www.mapshaper.org. Contrary to the reviewed use case, the goal of MapShaper is to simplify the data in order to get a lighter dataset, in particular to gain time when loading. Do not hesitate because most of the time, you don't need a high level of precision!
With this example, you will also be able to learn some useful things that you will learn more deeply in Chapter 6, Styling Vector Layers. Perform the following steps to do just that:
2360_08_01_simple_select.html and put it in the sandbox directory.assets folder, and put the file nutsv9_lea.geojson there, or download it also from the support site. python -m SimpleHTTPServer because of Ajax's same-origin policy requirements.http://localhost:8000/2360_08_01_simple_select.html if you use the Python server) to click on the blue features. Use the Shift key, and select more than one feature to get a result that might look like the following screensot:Let's have a look at the code used in this task.
First, we declared the usual raster layer as the background with the following code:
var raster = new ol.layer.Tile({
source: new ol.source.MapQuest({layer: 'sat'})
});Then, we started to declare the style that is applied when we select one or more features. It's exactly like the usual styling.
Later, when selecting with the ol.interaction.Select, we will reuse this style. Here's how we declare the style:
var selectEuropa = new ol.style.Style({
stroke: new ol.style.Stroke({
color: '#ff0000',
width: 2
})
});This part is dedicated to preparing styling for the vector layer when there is no selection; it's the blue stroke you see in the preceding screenshot:
var defaultEuropa = new ol.style.Style({
stroke: new ol.style.Stroke({
color: '#0000ff',
width: 2
})
});Next, we started to declare the vector layer and its source ol.source.GeoJSON, where we mentioned the projection of the map and the GeoJSON file we produced in the previous part of the chapter. We lowered the GeoJSON file and renamed the extension nutsv9_lea.geojson. We added into the style property in ol.layer.Vector an ol.style.Style class that uses your previous defaultEuropa, as follows:
var vectorEuropa = new ol.layer.Vector({
id: 'europa',
source: new ol.source.GeoJSON({
projection: 'EPSG:3857',
url: '../assets/data/nutsv9_lea.geojson'
}),
style: defaultEuropa
});We also needed to declare the interaction constructor to make the selection, or our style for selection will never work.
The way to do it is to instantiate it with:
var selectInteraction = new ol.interaction.Select({
condition: ol.events.condition.singleClick,
toggleCondition: ol.interaction.condition.shiftKeyOnly,
layers: function (layer) {
return layer.get('id') == 'europa';
}
});When you are in a complex map, you have more than one layer. Using the option layers is the way to say the click will only query information from layers that match the condition. You use a function to do this filtering. You can also use an array of layers, but it's less powerful. So, if you click in a place where a feature with layer id is 'europa', it will apply the right style. The condition variable is a static variable you can choose when you want to change behavior for select. By default, it's the single click that triggers the selection, but it can also be, for example, the Alt + click that can do it if you wish. It's also the same for toggleCondition. The purpose of this property is to set the condition when you want to toggle selection. In this case, we just use the default condition for learning purposes.
Then, we do the usual operations: declare the center, the view, and the map, then add to the map the layers, and set the view for the map, as follows:
var london = ol.proj.transform([-0.12755, 51.507222], 'EPSG:4326', 'EPSG:3857');
var view = new ol.View({
center: london,
zoom: 6
});
var map = new ol.Map({
target: 'map'
});
map.addLayer(raster);
map.addLayer(vectorEuropa);
map.setView(view);At the end of it all, we finished by adding the ol.interaction.Select object, as follows:
map.getInteractions().extend([selectInteraction]);
An alternative syntax to get the same result can be done by adding it in the interactions property of the ol.Map constructor, as follows:
var map = new ol.Map({
interactions: ol.interaction.defaults().extend([selectInteraction]),
target: 'map'
});After this first introduction, let's do another useful example to learn how to manage multi-selection or make a selection with points instead of polygons.
Now, let's reuse the previous example and discover more.
2360_08_01_simple_select.html in a new file called 2360_08_02_select_options.html.vectorEuropa declaration, add the following JavaScript code to create the vector layer for points. A new dataset, a GeoJSON file france_4326.geojson, is available on the book's webpage:var defaultFrancePoints = new ol.style.Style({
image: new ol.style.Circle({
fill: new ol.style.Fill({
color: 'blue'
}),
stroke: new ol.style.Stroke({
color: '#ffcc00'
}),
radius: 8
})
});
var selectFrancePoints = new ol.style.Style({
image: new ol.style.Circle({
fill: new ol.style.Fill({
color: '#ff0000'
}),
stroke: new ol.style.Stroke({
color: '#ffccff'
}),
radius: 16
})
});
var vectorFrancePoints = new ol.layer.Vector({
id: 'france',
source: new ol.source.GeoJSON({
projection: 'EPSG:3857',
url: '../assets/data/france_4326.geojson'
}),
style: defaultFrancePoints
});selectInteraction declaration, as follows:var selectInteraction = new ol.interaction.Select({
layers: function(layer) {
return layer.get('selectable') == true;
}
});vectorEuropa, add the new vector layer, as follows:map.addLayer(vectorFrancePoints);
selectable to be more meaningful, as follows:vectorEuropa.set('selectable', true);
vectorFrancePoints.set('selectable', true);We will not review all the code, but focus only on important points.
In the new block that declares the vectorFrancePoints layer, we just reviewed the vector point styling. Using the ol.style.Circle component, we set in style with the key image.
We kept the logic of the styles in order to keep the behavior for the selection: rules as reminders are applied if conditions they contain are met, whereas the style in ol.layer.Vector is the default style for the vector layers.
In the selectInteraction declaration, we changed the property that helps match our layers. Previously, we were matching using id with the value europa, and now, we are matching if a property selectable is true. But, as we do not declare initially in the layers some properties, we set them by adding a selectable property to both layers.
After you've seen everything you have to know about the ol.interaction.Select component, it's time to try to go further to really acquire knowledge by yourself about this part of the library.
For this, reuse the previous example and improve it using the following instructions:
linestrings. It can be SHP, KML, or GeoJSON. If required, transform the format to be able to consume it with the OpenLayers 3 library.styles you have to use to style the linestrings layer.ol.dom.Input to be able to play on selectability.Until now, we have only focused on the ol.interaction.Select component. Its main goals are to be able to highlight information by making a symbolization change and get information from the geographic features, for example.
But how can you also return information from the layers on your map and show them? That what we will see in the next part.
If you remember the description of layers, two main layers types are vector and raster. Some layers with specific ol.source accept methods to access geographic features in your map. The map queries each of the specified layers for this information, but not all layers support this. Only layers that support querying for geographic features will return results.
Without going deep into explanation, think that for the vector, you are querying the features near the point where you've done the click. Whereas for raster, you ask a remote resource to get a position on the image and extrapolate from this position the features of the image.
We will first review how to work with a vector source and then with raster sources. Do not worry if you don't already understand everything: we will review some concepts in the chapters dedicated to layers in particular.
So, we will see first how to get features from vectors, then explore how to do it from the method associated with raster, and try to discover where they differ.
Let's try with another example to discover more about the forEachFeatureAtPixel method. It should remind you about the last sample from Chapter 5, Using Vector Layers. To complete the task, check the following steps:
2360_08_01_simple_select.html in a new HTML file 2360_08_03_foreachfeatureatpixel.html.ol.js JavaScript file reference with ol-debug.js.map.on('click' , function(evt) {
var pixel = evt.pixel;
console.log(evt);
console.log(pixel);});console.log statements, and add the following code just after the line var pixel = evt.pixel;displayFeatureInfo(pixel);.displayFeatureInfo before the map.on( code:var displayFeatureInfo = function(pixel) {
var features = [];
map.forEachFeatureAtPixel(pixel, function(feature, layer) {
features.push(feature);
});
console.log(features);};console.log with this code:var container = document.getElementById('information');
if (features.length > 0) {
var info = [];
for (var i = 0, ii = features.length; i < ii; ++i) {
info.push(features[i].get('N3NM'));
}
container.innerHTML = info.join(', ') || '(unknown)';
} else {
container.innerHTML = ' ';
}<div id="information"></div>
First, with console.log, we tried to see the event content and also get the pixel position with an array of x, y, where we click. Next, we made a call to the function that relies on a map.forEachFeatureAtPixel function. Its purpose is to get back every feature under the click using the pixel position from the event where we want to see the return you get from the callback in success property and also restrict the action on the vectorEuropa layer.
We also saw that the return contained the ol.Feature object, and because of this, we chose to play to try if the return was empty or not. As a click can send back more than one feature, we used a loop to push the features property N3NM information in an array. Depending on this, we have the choice to display or not the name of the NUTS region with the attribute N3NM in a DOM element in the screenshot FR717 Savoie.
After this review, we know how to retrieve and manipulate information from vector layers. You understand that the method map.forEachFeatureAtPixel within displayFeatureInfo sends back ol.Feature. You can manipulate to retrieve geometry or attributes from the layers you click on.
There is another way to retrieve information when clicking, and it's with the WMS getGetFeatureInfoUrl method. In which circumstances should we use it, and why does it exist?
The title can be unclear if you don't already have some basics.
For this, we will start by reviewing the Open Geospatial Consortium (OGC) Web Map Services (WMS) standard.
Let's begin with the basics of WMS, and later, we will come back to the main topic.
For this, we will reuse two excerpts from the Geoserver documentation (a server-side component that can work with the OpenLayers 3 library).
The first one summarizes what WMS is:
"The OGC Web Map Service (WMS) specification defines an HTTP interface for requesting georeferenced map images from a server."
The second one, a table, gives you the type of requests the WMS standard can perform:
In this list of possible operations, the most common operation is GetMap, an operation that send back an image to display in a client, JavaScript or desktop.
But you also see GetFeatureInfo, an optional operation for WMS.
Here, when you read, the point is that it's not the client side that manages returned features, but the server side. The purpose here is to have less load on the client side: managing a lot of features in the client side is mainly a pain, in particular if you use DOM.
The idea is to send the information to a server and retrieve the minimum and really light result. The result can be an HTML, a GML, raw text or depending on your server, also a GeoJSON. To illustrate, type into your browser the following URL:
You will see an HTML table with information from the point where we clicked on: INFO_FORMAT= text/html. It is the way to say we want an HTML format return.
As a conclusion, just retain at the moment that when you choose to use the OpenLayers getGetFeatureInfoUrl method, you are supposed to use it with WMS layers.
Now, you have enough knowledge, let's go back to the main topic.
Let's start with a new example:
2360_08_01_simple_select.html to reuse it as a model in 2360_08_04_getgetfeatureinfourl.html.ol.js file the HTML content that follows:<script src="http://code.jquery.com/jquery-1.11.0.min.js"></script>
<script> </script>. Next, add the following code into the same block:var wms_layer = new ol.layer.Tile({
source: new ol.source.TileWMS({
url: 'http://demo.opengeo.org/geoserver/wms',
params: {'LAYERS': 'ne:ne'}
})
});
var view = new ol.View({
center: [0, 0],
zoom: 1
});
var map = new ol.Map({
layers: [wms_layer],
target: 'map',
view: view
});
var viewProjection = view.getProjection();
var viewResolution = view.getResolution();
map.on('click', function(evt) {
var container = document.getElementById('information');
var url = wms_layer.getSource().getGetFeatureInfoUrl(
evt.coordinate, viewResolution, viewProjection,
{'INFO_FORMAT': 'text/javascript',
'propertyName': 'formal_en'});
if (url) {
var parser = new ol.format.GeoJSON();
$.ajax({
url: url,
dataType: 'jsonp',
jsonpCallback: 'parseResponse'
}).then(function(response) {
var result = parser.readFeatures(response);
if (result.length) {
var info =[];
for (var i = 0, ii = result.length; i < ii; ++i) {
info.push(result[i].get('formal_en'));
}
container.innerHTML = info.join(', ');
} else {
container.innerHTML = ' ';
}
});
}
});We started by creating a tiled WMS layer, a raster type layer. Next, we created the view and the map. Then we got parameters from the view required later in the code—the resolution and the projection—and we got the DOM element information reference where we will display our click result. The most important part happens in the declaration map.on('click', function(evt) {, means wherever you click in the map, the code within the block is executed.
In this block, we declared an url variable to call the WMS web service. Its result was provided by a function generated from a WMS source using also the coordinates of the click, the resolution, the projection, and the query parameters.
The coordinates were provided by the click. The query parameters defined the returned type expected from the web service. In this case, we wanted the JSONP return encapsulating GeoJSON (JSONP) using 'INFO_FORMAT': 'text/javascript'. They also help to select only the properties we want from the web service ('propertyName': 'formal_en').
You can discover more by setting a breakpoint, and when clicking on the map, copying the URL string, and then, opening it in a new browser window to inspect.
Then, we declared an ol.format.GeoJSON object called parser, a component designed to understand the returned GeoJSON content from the Ajax call just after.
The Ajax call was done using a jQuery function $.ajax({...}).then(function(response) {, hence the jQuery script addition previously. The url parameter is not enough to manage JSONP. We need to custom the Ajax call to manage JSONP. JSONP allows remote calls to resources external to your website without encountering any issues with Ajax same origin policy (see the Wikipedia web page about the subject https://en.wikipedia.org/wiki/Same-origin_policy).
The code in the block reuses the received content and adds it as a JavaScript object in the result variable. This new object, an array, is manipulated to retrieve the text data United States of America and displays it in the container DOM element.
It's recommended also that you see in the network panel what happens every time you click on the map. The following screenshot is a depiction of the network panel:
The important thing here is you rely on a web service able to provide a raster map based on a standard, and you are also able to get remotely the features below the place where you click. The main advantage here is to have less coupling between your server code and your JavaScript code. However, on the other side, you can suffer from latency (time to receive the response from the URL call). Up until now, every piece of information returned was always displayed in a DOM element outside of the map. How can we display it on the top of the map as a pop-up?
That's what we will see in the next part mainly based on ol.Overlay, a component we already use in the Chapter 2, Key Concepts in OpenLayers.
To add a pop-up, you can rely exclusively on HTML and CSS, but the OpenLayers 3 library bundles a component to help you to display information in a pop-up.
You will find below the reference for this component called ol.Overlay. Only a light review will be done here because some examples will follow to illustrate.
The object is instantiated with a constructor such as:
var yourOverlay = new ol.Overlay({
element:document.getElementById('yourOverlayElement')
})Because ol.Overlay inherits from ol.Object, we only describe here the methods related to the object itself.
You can check out the complete ol.Overlay API documentation at http://openlayers.org/en/v3.0.0/apidoc/ol.Overlay.html.
After this small component review, we will first see the simplest case for using ol.Overlay with a static example where the information is not coming from any query but only from a DOM element.
To illustrate the simplest use case for ol.Overlay, let's perform the following steps:
2360_08_01_simple_select.html, we always used in the chapter, in a new file 2360_08_05_simple_overlay.html. You can also check the code at the Packt code book URL.assets/css/samples.css this code:#popup {
background: red;
}<div id="map" class="map"></div> with <div id="map" class="map">, as follows:<div id="popup"><b>OpenLayers 3 Code Sprint</b> <i>Humanities A3</i></div> </div>
var popup = new ol.Overlay({
element: document.getElementById('popup')
});
var osmLayer = new ol.layer.Tile({
source: new ol.source.OSM()
});
var ol3_sprint_location = ol.proj.transform([-1.20472, 52.93646], 'EPSG:4326', 'EPSG:3857');
var view = new ol.View({
center: ol3_sprint_location,
zoom: 16
});
var map = new ol.Map({
target: 'map'
});
map.addLayer(osmLayer);
map.setView(view);
map.addOverlay(popup);
popup.setPosition(ol3_sprint_location);Let's review the code to understand the way ol.Overlay works.
First, we defined a new ol.Overlay with the following:
var popup = new ol.Overlay({
element: document.getElementById('popup')
});The element property in the object literal option of the constructor has to reference an HTML element.
Here, we reference the HTML text <b>OpenLayers 3 Code Sprint</b> <i>Humanities A3</i> located in a <div> tag with an id value of popup.
Next, we performed the usual steps, such as creating layers, creating map, adding the layers, and setting the view, as follows:
var osmLayer = new ol.layer.Tile({
...
...
map.setView(view);Just after this block, we added the ol.Overlay object to the map in order to declare that we are using an overlay:
map.addOverlay(popup);
Instead of adding overlays after the preceding map, you can also use the option in the ol.Map constructor, as shown in the following sample:
var map = new ol.Map({
target: 'map',
overlays: [popup]
});The following line was to set the position of the DOM element by matching coordinates and image position:
popup.setPosition(ol3_sprint_location);
The name overlay implies also that there is something at the top of something else. To understand, just see the screenshot of the Chrome Developers Tools Elements panel, as follows:
As you see, the pop-up is included in a div tag, also contained in a div tag with class ol-overlaycontainer situated after the canvas element (where the map is drawn).
Now, let's assemble our knowledge with overlay and map feature methods.
In this case, we will reuse just the previous example as a model.
2360_08_06_layer_overlay.html.<b>OpenLayers 3 Code Sprint</b> <i>Humanities A3</i> from the HTML.osmLayer declaration, add the following code, where we are reusing again the vectorEuropa layer with the styles:var selectEuropa = new ol.style.Style({
stroke: new ol.style.Stroke({
color: '#ff0000',
width: 2
})
});
var defaultEuropa = new ol.style.Style({
stroke: new ol.style.Stroke({
color: '#0000ff',
width: 2
})
});
var vectorEuropa = new ol.layer.Vector({
id: 'europa',
source: new ol.source.GeoJSON({
projection: 'EPSG:3857',
url: '../assets/data/nutsv9_lea.geojson'
}),
style: defaultEuropa
});ol.interaction.Select component, as shown in the following code.var selectInteraction = new ol.interaction.Select({
layers: function (layer) {
return layer.get('id') == 'europa';
}
});map.addLayer(osmLayer);, add to the map the following new layer:map.addLayer(vectorEuropa);
map.addOverlay(popup);, add the code that follows:function pickRandomProperty() {
var prefix = ['bottom', 'center', 'top'];
var randPrefix = prefix[Math.floor(Math.random() * prefix.length)];
var suffix = ['left', 'center', 'right'];
var randSuffix = suffix[Math.floor(Math.random() * suffix.length)];
return randPrefix + '-' + randSuffix;
}
var container = document.getElementById('popup');
var displayFeatureInfo = function(pixel, coordinate) {
var features = [];
map.forEachFeatureAtPixel(pixel, function(feature, layer) {
features.push(feature);
});
if (features.length > 0) {
var info = [];
for (var i = 0, ii = features.length; i < ii; ++i) {
info.push(features[i].get('N3NM'));
}
container.innerHTML = info.join(', ') || '(unknown)';
var randomPositioning = pickRandomProperty();
popup.setPositioning(randomPositioning);
popup.setPosition(coordinate);
} else {
container.innerHTML = ' ';
}
};
map.on('click', function(evt) {
var coordinate = evt.coordinate;
displayFeatureInfo(evt.pixel, coordinate);
});First, we added to the previous example the vector EuropaLayer in order to have areas easier to click on. It's because areas cover the entire map contrary to points where you need accurate clicking.
Next, we declared a function pickRandomProperty in order to generate a random string, fitting positioning parameters expected by the ol.Overlay component for a small demonstration purpose.
Then, we declared a modified displayFeatureInfo function reusing most of the code from 2360_08_03_foreachfeatureatpixel.html, where we set the positioning and the position. The position requires coordinates, so we added a second argument to displayFeatureInfo.
For positioning, we chose to display the content by changing the pop-up position randomly. This position is relative to the click event; to get this result, we reused the function pickRandomProperty, as follows:
var randomPositioning = pickRandomProperty(); popup.setPositioning(randomPositioning);
We also used the setter on the pop-up element in order to change its position according to the retrieved click coordinates, as follows:
popup.setPosition(coordinate);
We finished with the now quite usual block to add a click event to the map map.on('click', function(evt), but we retrieved the coordinates also and not only the pixel position to reuse the function displayFeatureInfo.
Now, you will learn to make dynamic use of ol.Overlay. You are also able to put a pop-up on your map using your geographic features.
You can try by yourself some experiments by following instructions given in the next section.
In order to go further, we advise you to do some exercises with ol.Overlay.
Your new assignment can be the following:
setTimeout() function to stop displaying the pop-up after some time. You can see a reference about setTimeout at https://developer.mozilla.org/en-US/docs/Web/API/WindowTimers.setTimeout. A short article at http://davidwalsh.name/javascript-debounce-function will also help you to understand why it can be useful.Interactions can happen not only with selecting and displaying information from your map. It's also possible, for example, to create new features by drawing points, lines, or polygons. You can also update features. We will mainly focus on geometric representations because the built-in functionalities in OpenLayers 3 are mainly dedicated for this.
To be able to do a basic save, we have developed a server-side script based on Node.js, a software platform for scalable server-side and networking applications. For the client side, the code will be more classical.
index.js and package.json files from the code from upcoming_url and put them in the ol3_samples directory.ol3_samples folder path, as follows:npm install
features.geojson into ol3_samples/assets/data/.index.js and opening http://localhost:3000/features.geojson. You should see something like the following:{type: "FeatureCollection", features: [ ]}2360_08_07_create_new_content.html in the usual sandbox folder by copying 2360_08_01_simple_select.html.<div> tag for the map and a form to enable you to choose future drawing types (point, line string, and polygon) with the following code:<div id="map" class="map">
</div>
<form class="form-inline">
<label>Geometry type </label>
<select id="type">
<option value="Point">Point</option>
<option value="LineString">LineString</option>
<option value="Polygon">Polygon</option>
</select>
</form>
<script src="../assets/ol3/ol.js"></script>
<script src="http://code.jquery.com/jquery-1.11.0.min.js"></script><script> without forgetting to close it at the end, and copy the following code into it:var raster = new ol.layer.Tile({
source: new ol.source.MapQuest({layer: 'sat'})
});
var source = new ol.source.GeoJSON({
url: '/features.geojson'
});
var vector = new ol.layer.Vector({
id: 'vector',
source: source,
style: new ol.style.Style({
fill: new ol.style.Fill({
color: 'rgba(255, 255, 255, 0.2)'
}),
stroke: new ol.style.Stroke({
color: '#ffcc33',
width: 2
}),
image: new ol.style.Circle({
radius: 7,
fill: new ol.style.Fill({
color: '#ffcc33'
})
})
})
});
var map = new ol.Map({
layers: [raster, vector],
target: 'map',
view: new ol.View({
center: [-11000000, 4600000],
zoom: 4
})
});http://localhost:3000/sandbox/2360_08_07_create_new_content.html to see the definitive sample look.var typeSelect = document.getElementById('type');
function addInteraction() {
draw = new ol.interaction.Draw({
source: source,
type: typeSelect.value
});
map.addInteraction(draw);
}
typeSelect.onchange = function(e) {
map.removeInteraction(draw);
addInteraction();
};
addInteraction();componentReload on the page to see that you can draw but there is no persistency.addInteraction function, copy the following code:draw.on('drawend',
function(evt) {
console.log(evt.feature);
var parser = new ol.format.GeoJSON();
var features = source.getFeatures();
var featuresGeoJSON = parser.writeFeatures(features);
$.ajax({
url: '/features.geojson',
type: 'POST',
data: featuresGeoJSON
}).then(function(response) {
console.log(response);
});
},
this);We created a map that uses a drawing component.
Each time you choose a Geometry type, it removes the ol.interaction.Draw component and adds again a new one using the code in typeSelect.onchange.
In the called function, the key feature is the drawend event bound to the draw component. Each time the user finishes drawing, it fires an event that send a feature.
In our case, we chose to get features from the source as GeoJSON using ol.format.GeoJSON and send them via an Ajax post call.
Depending on your backend, or for client storage, you can change what you want to send. The sample sends all features using a GeoJSON format, but you can customize the URL call, change the format to let's say GML, or only send the added feature and not all the features.
For this last case, you can see the log returned from console.log(evt.feature);.
The assignment will be quite simple because the component at the time of writing needs some refining. It's possible to edit content but there are no events to catch at the end of modification: we will be unable to save the modified features. We will cover the client as is.
2360_08_01_simple_select.html as 2360_08_08_modify.html.var london, add the following code:var modify = new ol.interaction.Modify({
features: selectInteraction.getFeatures()
});map.getInteractions().extend([selectInteraction]); with the following code:map.getInteractions().extend([selectInteraction, modify]);
var selected_features = selectInteraction.getFeatures();
selected_features.on('add', function(event) {
var feature = event.element;
feature.on('change', function(event){
event.target.getGeometry().getCoordinates());
});
});We saw in this sample how to use ol.interaction.Modify here using the modify component. We also saw that it requires ol.interaction.Select. To be able to listen to change, there is no available method on ol.interaction.Modify to directly know the modification to the features. You have to listen to changes on features with selected_features.on('add', function(event) {.
To make this behavior really more obvious, we also used a console.log statement, so when using the browser console debugger, you are able to follow the call when a feature is modified.
After reviewing, drawing, and modifying features, it's time to deepen our interactions knowledge: preferring a practical approach, we only scratched the surface (their definitions) until now.
Until now, we never inspected relations between interactions. So, it's time to examine ol.interaction.* classes. All the classes inherit from ol.interaction.Interaction, but compared to controls, it's less simple; you also have subclasses.
See the following diagram to grasp the relationships between the different interaction classes:
An inspection of the above schema shows that every ol.interaction component inherits from ol.interaction.Interaction. In some cases, when an interaction uses a mouse, pen, or touchscreen, it will need to inherit from ol.interaction.Pointer, which deals with this use case.
You can also note with the schema that interactions are tied to touch events for mobile, mouse events like click or drag, mouse events with the mouse wheel, and the keyboard. You can combine them depending on the expected behaviors. Luckily, by default, you can deal with them with ease. Let's see how. After this, we will explore different ways to make more customizations.
Most of the time, you don't really need to deal with interaction behaviors, but sometimes knowing how to manage them is a requirement.
You have two choices for simple cases:
var map = new ol.Map({
...
controls:[],
interactions:[],
...
});Consider that you need most default behaviors, but you don't need all of them. In this case, you will have to use the ol.interaction.defaults function.
As mentioned previously, the best and simplest way to handle interactions is by reusing the ol.interaction.defaults function, as follows.
Let's review the properties you can set in the options:
Let's deactivate zoom and pan with the keyboard and also the rotate when doing Alt + Shift + mouse drag.
For this, do the following:
<div id="map" class="map"></div> the attribute tabIndex with a value 0 to make it focusable.keyboard option to false in the interactions property of the ol.Map object.altShiftDragRotate option. Try different actions with the left, right, up, and down arrows or with the plus and minus keys.Here you just saw an example to deactivate some default behaviors.
By changing keyboard options to false, we make the application unable to respond to keyboard interaction with pan and zoom.
After reviewing the ol.interaction.defaults function itself, you also learn that each map already embedded nine ol.interaction by default, and for keyboard, the switch works for all keyboard interactions.
Let's see exactly what each of those interactions does at the functional level more than at the code level. We already introduced them in Chapter 2, Key Concepts in OpenLayers, so you should not be lost.
ol.interaction.DoubleClickZoom: This interaction allows users to zoom by double-clicking. You can set the duration to change animation time and delta when you want to change the zoom delta.ol.interaction.DragPan: It allows to you to pan by dragging the map. You can set panning behavior by setting the kinetic property.ol.interaction.DragRotate: This interaction makes the map rotate when you combine both the Alt and Shift keys together to rotate the map image. You can change it by changing the condition property.ol.interaction.DragZoom: It enables you to draw a temporary rectangle when pressing the Shift key with the keyboard. Then, this rectangle is used to zoom on the selected region of the rectangle. You can change the condition for the behavior with a condition, but you can also choose a style when drawing. The most interesting part in this component, other than its behavior, is that it inherits from ol.interaction.DragBox. It means that we will be able to reuse the drawing rectangle behavior for other purposes and not only for zooming like here. Later in the chapter, we shall see how.ol.interaction.PinchRotate: On mobile devices, one of the main interactions is the pinch. In the OpenLayers 3 library's case, it is supported by default. The name itself is enough to understand that this component has a behavior similar to DragZoom, but when pinching. You can set the threshold property if your application requires to change sensitivity for rotating the map.ol.interaction.PinchZoom: As the previous component, it relies on the pinch but in order to zoom. It's like when you are browsing on mobile, but instead of getting only a lens effect, you really make a zoom in your map. You change the animation duration, setting the same duration property in the component.ol.interaction.KeyboardPan: Its role is to manage map browsing using only the keyboard. It needs to make the map focusable by adding a tabIndex attribute at your map div level. To get the focus for the map, you need to use the tab key. Then, panning can be controlled using the up, down, left, and right keys. The option pixelDelta enables you to set the translation in pixels when pushing on the keys. By default, it value is 128 pixels. It is also possible to set the now usual condition property.ol.interaction.KeyboardZoom: Its goal is similar to the previous component except that it applies when you use the keys plus and minus instead. This interaction can be set just as for DoubleClickZoom with the delta property and also the condition too.ol.interaction.MouseWheelZoom: As its name implies, this interaction is related to the use of the mouse wheel to zoom in or zoom out. The only custom behavior you can set for this interaction is the duration of the animation by default to 250 milliseconds.After this more verbose part, it's time to see the missing interactions.
We will first look at ol.interaction.DragRotateAndZoom, and then we will move on to the others.
These other interactions were sometimes used along the book chapters, but we did not always explain them completely; it was impossible with all the other concepts that required explanation at the time.
Let's follow the component's self-explaining name to try out it behaviour :
ol.interaction.defaults sample.interactions block in the ol.Map object as follows:var map = new ol.Map({
...
interactions: ol.interaction.defaults({
shiftDragZoom: false
}).extend([new ol.interaction.DragRotateAndZoom()]),
...
});First, as it can conflict with ol.interaction.DragRotateAndZoom, we deactivated the shiftDragZoom interaction by setting it to false. We chose this option, but it was also possible to change the key to activate the function using the condition property.
You also saw the now-common pattern to add interactions to existing default interaction using an array within the extend block. Practically, you also learned how to use the behavior.
Now, let's jump to the next interaction.
This interaction, according to the official documentation API, is for handling input of vector data by drag and drop. We already saw an example of using this in Chapter 5, Using Vector Layers.
The only additional thing that you can add is that when you drop the file after dragging it, when the event is triggered, you can get not only the features or their projection (experimental), but you can also get the filename. It can be useful, for example, to give a name to the layer, imagining we use the component together with a layer tree.
How did we deduce that it was also possible to retrieve this information? We did this simply by inspecting the API at http://openlayers.org/en/v3.0.0/apidoc/ol.interaction.DragAndDrop.html. It mentions the function signature when an event is fired, as follows:
addfeatures(ol.interaction.DragAndDropEvent).You can see that ol.interaction.DragAndDropEvent is involved. If you inspect its API definition, you will see and not be really surprised to discover members are features, files, and projections.
Just as a quick reminder, here are the DragAndDrop options (experimental):
|
Name |
Type |
Description |
|---|---|---|
|
|
|
These are the format constructors. |
|
|
|
This is the target projection. By default, the map's view's projection is used. |
Now, let's continue with another interaction implying always a drag-related event.
The official documentation describes this interaction as:
"Allowing the user to zoom the map by clicking and dragging on the map, normally combined with an ol.events.condition that limits it to when the Shift key is held down."
When reviewing ol.interaction.DragBox and seeing that it's the base class for ol.interaction.DragZoom, we already give you some hints for other use cases based on the same logic. It can be to select features based on a rectangular selection, to draw a rectangle, or to use it as a bounding box to generate and draw other shapes, such as ellipsoids and circles.
Let's look at how you can, for example, get the drawn rectangle as a GeoJSON string, where you've done a selection. Here, we suppose you are working on your desktop as mouse interaction is not available with mobile devices.
After introducing the goal, we should do the following:
osm_default and map variables.ol.interaction.DragBox, as follows:var dragBoxInteraction = new ol.interaction.DragBox({
condition: ol.events.condition.shiftKeyOnly,
style: new ol.style.Style({
stroke: new ol.style.Stroke({
color: 'red',
width: 2
})
})
});DragRotateAndZoom, deactivate DragZoom, and add the new interaction in the interactions parameter within ol.Map, as follows:interactions: ol.interaction.defaults({
shiftDragZoom: false
}).extend([dragBoxInteraction]),dragBoxInteraction and map declarations:dragBoxInteraction.on('boxend', function(e) {
var format = new ol.format.GeoJSON();
var geom = e.target.getGeometry();
geom.transform('EPSG:3857', 'EPSG:4326');
var feature = new ol.Feature({
geometry: geom
});
var obj = format.writeFeatures([feature]);
console.log(JSON.stringify(obj));
});In the first part, you should be able to draw the rectangle, but no events fired then like with the DragZoom for example. We chose to play with all the available options.
We set the condition to be able to activate the behavior only with the Shift key using ol.events.condition.shiftKeyOnly and changed the style to make a red border with 1 pixel's width.
We added the new interaction but disabled the other, which also uses ol.events.condition.shiftKeyOnly.
Finally, we reused the event listener to catch when the rectangle drawing ends with boxend.
Within this event, we manipulated the returned geometry ol.geometry.Polygon to change it projection and reuse it into ol.Feature. By providing this feature with the writeFeatures method of a new ol.format.GeoJSON, we were able to make the GeoJSON object and converted it into a string.
As a reminder, in the following table, you will find the expected optional parameters (and experimental) for the interaction:
|
Name |
Type |
Description |
|---|---|---|
|
|
|
This is a function that takes |
|
|
|
This is a style for the box. |
After this last assignment for the book, it's time for revision.
Let's look at a few questions to see what we understood during the chapter:
Q1. In a context where we want to query a WMS, what components and methods would be required for this?
ol.Map.ol.layer.Tile.ol.source.ImageWMS.ol.layer.Vector.ol.source.TileWMS.Q2. What will happen if we use the addCondition property value ol.interaction.condition.onlyAltKey to build ol.interaction.Select?
Q3. We want to make a style change. When selecting, what type is required in the option style of ol.layer.Vector?
ol.style.Style.ol.style.Stroke.ol.style.Fill.ol.style.Style.Q4. What is(are) the condition(s) not present by default in the available conditions when using interactions :
ol.events.condition.neverShift.ol.events.condition.never.ol.events.condition.shiftAlways.ol.events.condition.noModifierKey.ol.events.condition.shiftKeyOnly.In this chapter, we discovered more about the way to query information from your map. Compared to a paper map, interactive feedback from a map is one of the most powerful features you can expect. We hope following our guidance was not too tough.
Starting with data manipulation, you learned more about the complex world of GIS. Next, we discovered about the dedicated components to select and query maps. Afterwards, with a pop-up, we inspected how to nearly reproduce the Push Pins map (you can always reproduce it as an additional task).
We created and modified our own geographical data instead of consuming existing data.
Inspecting the default interactions, we helped to explain some hidden interactions, requiring key and mouse combinations. We didn't restrict our inspection to default interactions: we saw all interactions except the one concerning mobile devices like PinchZoom or PinchRotate as we will review them in Chapter 10, OpenLayers Goes Mobile.
Now, we will dive into controls. Controls are quite similar to interactions, but they depend on the DOM element. We will look at all the available controls in the coming chapter. This chapter will also help you to understand not only the purpose, but also the ways of creating custom controls.
So far, we've taken for granted that we will zoom in/out when clicking on plus or minus buttons. We haven't discussed much about what actually is behind the map interaction when you use buttons. The ol.control namespace contains numerous classes that make our maps interactive, in particular to configure behavior on your map. There are many built-in controls, each with their own unique functions. You can easily customize them with a CSS style or other parameters. Contrary to interactions, controls depend on DOM elements and not keyboard and mouse input only.
In this chapter, we'll cover the following topics:
ol.control classes and their organizationControls allow us to interact with our map. They also allow us to display extra information, such as displaying a scale bar with the ol.control.ScaleLine control. Before, in the previous generation of OpenLayers, version 2.x, some controls did not have a visual appearance. Nowadays, those elements, which do not rely on a DOM element, are called interactions like for example, touch interactions on mobiles. You can have as many controls on your map as you'd like. There are even some cases where you may not want any controls—such as embedding an unmovable map in a page, or showing a static map for printing.
There are two methods for adding controls to a map:
ol.control.* objects when you instantiate the map object.addControl(), method passing in a single control object. If you need to pass more than one control, just loop using an array of control objects, using the same addControl().When you create your map, three control objects are added automatically. These three controls are as follows:
ol.control.Attribution: This is responsible for displaying credits for producers of map data sources or tiles providers like for OpenStreetMap. By default, the control is located in the bottom-right corner.ol.control.Zoom: This is responsible for showing the plus and minus buttons in the top-left corner. Those buttons when clicking help to do a zoom in for plus and a zoom out for minus.ol.control.Rotate: This is responsible for resetting the map rotation to 0.Since these controls are added without us explicitly adding them, how do we choose to not include them? The simplest way is to pass an empty array or null to the control's property when instantiating the map. Another way to change default controls is to explicitly set the options for each of them to true or false when you call the ol.controls.defaults function in the controls property of the ol.Map object.
Let's review this use case before going further.
Follow these steps to start manipulating the default controls:
<!doctype html>
<html>
<head>
<title>Default controls</title>
<link rel="stylesheet" href="../assets/ol3/css/ol.css" type="text/css">
<link rel="stylesheet" href="../assets/css/samples.css" type="text/css" />
</head>
<body>
<div id="map" class="map"></div>
<script src="../assets/ol3/ol.js"></script>
<script>
</script>
</body>
</html><script> </script> add the declaration to the map:var osm_default = new ol.layer.Tile({
source: new ol.source.OSM()
});
var map = new ol.Map({
layers: [osm_default],
target: 'map',
view: new ol.View({
center: ol.proj.transform([-1.81185, 52.443141], 'EPSG:4326', 'EPSG:3857'),
zoom: 6 })
});python -m SimpleHTTPServer or node index.js (if you are using the code from the book samples) because some sources are sensitive to the URL context (or you will get a blank map).ol.control.defaults to cancel all default controls parameters in the map constructor. See the following code to understand this:var map = new ol.Map({ layers: [osm_default],
controls: ol.control.defaults({
zoom: false,
attribution: false,
rotate: false
}),
});Let's examine the interesting part of the code:
controls: ol.control.defaults({
zoom: false,
attribution: false,
rotate: false
})To manage default controls, we must use a parameter in the ol.control.defaults function. This first parameter is an object that contains a key referring to the default controls. You can set their value to false to disable the corresponding control.
This object also supports other keys to set options for each default controls. These keys are attributionOptions, rotateOptions, and zoomControlOptions. We mentioned them here but we will see them later when reviewing each control individually.
The following table, an excerpt from the API documentation of ol.control.defaults, summarizes these properties:
After this long introduction to manipulation of controls, let's review all of them step by step. You can refer to the following diagram for a quick overview of the class hierarchy:
As you can see, all ol.control.* classes inherit from ol.control.Control.
So, first let's see this ol.control.Control.
The ol.control.Control is the parent class of all the available controls. It inherits from ol.Object, an abstract class that also inherits from ol.Observable, a convenient class to provide and manage listeners.
This object is responsible for the common options that all controls contain. All controls inherit from ol.control.Control, and it's exactly the same for the options. To understand its properties, just review how a control can be described.
"A control is a DOM element related to the map and that can be attached to an existing DOM element."
If you refer to the following table. The DOM element is the element property, the place that contains the look for the control. The target property is the place where you add the element into the DOM.
Never forget that it is useful to know ol.control.Control to understand its subclasses, but you never directly use it. You reuse this class only if you need to create your own control but it's not the time for this. First, we need to study controls provided by the Openlayers 3 library, which will be explained in the following sections.
The ol.control.Attribution control is not very new. We are already using it implicitly since we used the ol.layer.OSM class in Chapter 1, Getting Started with OpenLayers.
These are the options concerning the ol.control.Attribution control.
You can see all properties you can set for the control. You should be aware that those properties are considered as experimental in the OpenLayers 3 release.
We will discover the way to customize it in the following section.
Attributions, as a reminder, are the way to mention credits for layers sources that reference source of the tiles and/or data. The ol.control.Attribution control is dedicated for this.
ol.control.defaults options in the controls property of the map, and also set logo options to false at the ol.Map level:logo: false
controls: ol.control.defaults({
attributionOptions: {
},
}),attributionOptions to the following content and reload the page:attributionOptions: {
className: 'myCustomClass'
},myCustomClass to try to understand the effect of the className option in attributionOptions.attributionOptions:attributionOptions: {
className: 'myCustomClass',
target: document.getElementById('myattribution'),
},<div id="map" class="map"> </div>the following content:<br/> <div id="myattribution"></div>
We first introduced you to the className property. This enables you to change the default class name for the control. Then, you can customize your control with CSS according to this new class name. You may have noticed that, in the first case, you were unable to see the content in the browser, but only in the debugger because the element was always attached to the map element with its child, the <div class="ol-viewport" ...> tag.
With the second case, we showed you the purpose of the target property: you can tell the control where you want to attach the control. So, you need to use a DOM selector such as document.getElementById('myattribution').
With this action, you might have seen that the control is now well separated from the <div id="map" class="map"></div> HTML.
It is now easy to customize as per your wish and you can display credits outside of the map: it can be useful when you use a lot of layers and don't want to display too much information.
The ol.control.Zoom control displays a plus and minus element to zoom in and zoom out. It is one of the default controls.
The zoom options are similar to both previous controls but we also have some other properties such as a delta property. The other specific properties are only to change text for the control or when the mouse hovers them.
We will not cover those options as they are quite straightforward to understand but advise you to play with it within the context of OpenStreetMap. If you remember, OpenStreetMap behavior for tiles in Chapter 1, Getting Started with OpenLayers (each zoom multiply zoom by 2), you will also remember how to play with the delta property. For each click on the control, your delta is 1. Change this property to a value, either 2 or 4, and try to click on the plus (+) and minus (-) buttons and see the change.
You can find the properties list for the control as follows:
The ol.control.Rotate control is not really obvious to understand. As OpenLayers 3 targets mobile browsers or applications, it can be useful to reset the rotation when you choose to make an interactive map that relies on the compass from your device. Sometimes, you want to reset the north direction for readability for end users. In fact, this control is a default one.
You can make it appear by reopening the previous example, then click and drag while pressing down both Shift and Alt keys. You will see a result like the following:
Let me remind you that you will find the options available to customize the Rotate control:
You can play around with these options; for example, you can always display North with an arrow like for paper maps with autoHide. It's also possible, if your application is not targeting English-speaking users, to change the tipLabel.
With this control, you can easily switch to the fullscreen mode that relies on HTML5. Also, for this reason, it will work better with a modern browser that supports this feature, such as Google Chrome, Firefox, and so on. Typing Esc will take you out from this mode.
This is the first control we've reviewed that is a not a default one. If you need it, you can use the ol.Collection returned by the ol.control.defaults method and with it the ol.Collection extend method, add the control using an array to the collection, when instantiating ol.Map with the bare minimum (no options):
controls: ol.control.defaults().extend([new ol.control.FullScreen()]),
As a reminder, supposing map is the ol.Map object name, you can also add the control with the following line:
map.addControl(new ol.control.FullScreen());
These FullScreen are options for the FullScreen control. Except for the keys property that depends on latest support in browsers and tipLabel to set the tip text on the button, the properties are the usual ones, the ones inherited from ol.control.Control. All are considered as experimental.
The ol.control.MousePosition control helps you to determine the coordinates where your mouse is pointing on the map.
One way to do this is by instantiating the element with the syntax that follows:
controls: ol.control.defaults().extend( [
new ol.control.MousePosition({
key: value,
...
})
]),The object into the control constructor is optional.
The MousePosition options are the available properties you pass to the control ol.control.MousePosition. They help customize the behavior of the control such as coordinates formatting or units.
We will review these options with an example.
Follow these steps to get started with the mouse position behavior:
myposition such as <div id="myposition"></div>.var mousePosition = new ol.control.MousePosition({
coordinateFormat: ol.coordinate.createStringXY(2),
projection: 'EPSG:4326',
target: document.getElementById('myposition'),
undefinedHTML: ' '
});map.addControl(mousePosition);
assets/css/samples.css:#myposition > .ol-mouse-position {
position: relative;
margin-left: 20px;
font-size: 30px;
}Here, we choose to use most of the options of the controls.
The first one, coordinateFormat, accepts an ol.CoordinateFormatType. It simply means that when you retrieve the coordinates, you may want to change them to Degrees Minutes Seconds notation or you may want to change the precision you display in the HTML file.
The two relevant options to set here are:
Be careful to not set ol.coordinate.toStringHDMS() instead; it's a bit surprising, but you need to use the class itself.
The projection option helps you choose the coordinates you want. You may have forgotten but each projection has a defined unit system (and subunits). For example, the EPSG:4326 projection returns units in a decimal degree. It's what you see in the bottom of the previous image. The undefinedHTML option just sets what you want to display when you are not hovering over the map. You can confirm availability by searching in the Chrome debugger Elements panel, the string in precedent example.
The target option and the CSS part were only to remind you of previous use cases.
We've never really insist until now, but you can also set the parameters after controls creation. In fact, for each property, you always have a setter and a getter.
Just open your browser with the example, type in the console the following line, and hover over the map to understand:
mousePosition.setProjection(ol.proj.get('EPSG:3857'))As you see, you can really explore the methods available in the ol.control.MousePosition control. We really encourage you to play in the console using auto completion: you will see that you can really find useful things that may remind you of other examples. You should also focus on the Fires: part of the API documentation at http://openlayers.org/en/v3.0.0/apidoc/ol.control.MousePosition.html because it will help you to apply your events knowledge in the context of controls and here, the mousePosition control.
If you remember, we already introduced you to this control in the Chapter 7, Wrapping Our Heads Around Projections at a functional level.
The purpose of ol.control.ScaleLine is to show a scale line bar to give people an overview of scale and distance. Be aware that it is only useful for projection that keeps distances.
You just need to add it to the map with something such as map.addControl(new ol.control.ScaleLine()) if you don't use the options.
The following is the options list you can set for the scale line control:
Although this book is about introducing the OpenLayers 3 library, we suppose that if you are reading this, it also means you want to understand what you are doing. So, let's give you some tasks to do by yourself:
minWidth property to a value you want in pixels.ol.control.ScaleLineUnits description is available in the following content). When you want to display your map legend using others units, you need to know the available units. You can find them using the table that follows, extracted from the ol.control.ScaleLineUnits type definitions in the OpenLayers 3 API:|
Name |
Type |
Default |
|---|---|---|
|
degrees |
|
This property returns the the string degrees required for internal library units changes. Check out Wikipedia to learn more on this unit (decimal degree) at http://en.wikipedia.org/wiki/Decimal_degrees. |
|
imperial |
|
This property is similar to previous property but returns the string imperial. Check out Wikipedia to learn more about the unit at http://en.wikipedia.org/wiki/Imperial_units. |
|
nautical |
|
This property is similar to the previous property but returns the string nautical. It refers to nautical miles. Check out Wikipedia for more information at http://en.wikipedia.org/wiki/Nautical_mile. |
|
metric |
|
This property is similar to the previous property, but returns the string metric that refers to metre or meter. Check out Wikipedia for an history at http://en.wikipedia.org/wiki/Metre. |
|
us |
|
This property is similar to the previous property but returns the string US. It refers to US units. Check out Wikipedia for more information at http://en.wikipedia.org/wiki/United_States_customary_units. |
target property or both of themThe ol.control.ZoomSlider control helps you to see your zoom levels using a slider. We advise you to go to the official example at http://openlayers.org/en/v3.0.0/examples/zoomslider.html because it's well illustrated for CSS styling. You can display the slider horizontally or vertically for the example illustrated in the following screenshot:
The following content presents the available options/properties in ol.control.ZoomSlider.
|
Name |
Type |
Description |
|---|---|---|
|
|
| |
|
|
| |
|
|
|
You can manage and try to better understand resolutions by using the getResolution() function at the view level (with map.getView()).
The ol.control.ZoomToExtent control permits you to create a button to go to a particular extent.
In a real context, it may help you to get a map with a zoom on a country, and using this control, you will be able to zoom directly on a particular city. In another case, you may want to go back to the initial extent of your map, and this control is also a way to address this requirement.
In order to learn better, let's try another example:
map.getView().getZoom() and map.getView().getCenter().zoomToExtentControl:var zoomToExtentControl = new ol.control.ZoomToExtent({
extent: [-11243808.051695308, 4406397.202710291, -4561377.290892059, 6852382.107835932]
});map instantiation:addControl(zoomToExtentControl);
var controls = map.getControls();
var attributionControl;
controls.forEach(function (el){
if (el instanceof ol.control.Attribution) {
attributionControl = el;
}
})ol.control.Attribution control using the reference you retrieve and supposing map reference the ol.Map instance.map.removeControl(attributionControl);
Here, we've just seen an example to learn how to manage the ol.control.ZoomToExtent control. The most interesting part is related to the code that enables you to find your control reference without having an object control reference. For this, we use the instanceof JavaScript function.
Now, we also know how to list controls for a map using the map.getControls() function, and also loop through it using the forEach method from ol.Collection.
Finally, we discovered how to remove a control when for any reason, we needed to delete it afterward with the map.removeControl() function. You also have to understand that for learning purposes we don't check everything. For example, imagine there were more than one ol.control.Attribution control. A good exercise can be to change code to manage this case.
These properties set the options for the ol.control.ZoomToExtent control.
Now, we got an overview of controls, let's see how to make our own ones, for specific purposes.
You may wonder "why do we need to learn that?"
Some points to explain this requirement are:
Let's see how we can do it.
Let's get started. Contrary to most examples, it will need more code than usual. So, to keep things simple, we will explain how to build the sample by retrieving the various code files instead of inlining it. After these operations, we will focus on the important parts of the code to understand them:
css class with the export-geojson string from assets/css/samples.css and copy paste them in your own samples.css file. Next, retrieve a new JavaScript file from https://github.com/eligrey/FileSaver.js/blob/master/FileSaver.js into a new subdirectory, assets/js.features.geojson file from assets/data/features.geojson, within the book samples.chapter09/2360OS_09_06_custom_control.html.index.js, open your browser, and draw something. Push on the new button named G just below the minus plus buttons and you can download a file.We will just highlight the most important parts.
At a functional level, we reused ol.interaction.Draw with the possibility to switch between drawing points, lines, and polygons. We removed the server-side dependency for saving the efforts for the same.
Instead we introduced a new component, app.generateGeoJSONControl, with the following snippet:
controls: ol.control.defaults().extend(new app.generateGeoJSONControl({source: source})
]),This component reuses the declared ol.source.GeoJSON vector source used to get a GeoJSON content with the source: source option.
This new control is created by declaring a namespace with:
window.app = {};
var app = window.app;Then, we declared the function with app.generateGeoJSONControl = function(opt_options) { and directly prepared to get opt_options with the following line of code:
var options = opt_options || {};
We made an anchor DOM element, then a temporary variable with var this_ = this; to be able to keep the scope for the getGeoJSON function.
Within this named function, we stopped a default behavior to not get the URL changed and started to manipulate the features from the source to transform them to a GeoJSON string. With a new download function, we made it possible to save the text content in a file.
This declaration is not the call; so, we needed to bind the function to event click and touchstart for desktop and mobiles experiences on the anchor DOM element with:
anchor.addEventListener('click', getGeoJSON, false);
anchor.addEventListener('touchstart', getGeoJSON, false);Near the end, we added a new <div> tag and appended anchor as a child.
We made an interesting statement by using a call function from ol.control.Control:
ol.control.Control.call(this, {
element: element,
target: options.target
});It enables us to reuse the option from the parent control and to set them, for example, target and element, the newly created <div> tag.
Making a call was just to call the function of the parent class; so, after the end of the app.generateGeoJSONControl function, we explicitly used a special declaration ol.inherits to apply the ol.control.Control parent methods and properties to our custom class:
ol.inherits(app.generateGeoJSONControl, ol.control.Control);
Q1. You need to stop the zoom in / zoom out behavior on the map. In the ol.Map object, what do you need to change in the options and why?
Q2. If you want to use panning on your map, what do you need to change in ol.Map?
Q3. Assuming I have made my own control named mycustomControl and I declare the following within ol.Map:
controls: ol.control.defaults().extend([
mycustomControl({source: source})
])What will happen and why?
In this chapter, we discovered more about the controls. Up untill now, we've used it without really understanding their purpose—what can they do for us?
Firstly, we organized our thoughts using inheritance schema. In fact, it's more complicated, but for a beginner book, it was quite enough. We didn't go too deep; we used and reviewed existing components but didn't focus a lot on creating new ones. You don't really need to use augmented controls in most cases. When you need to make a new control, don't hesitate to review the behavior from the various interaction: it's simple to combine them with buttons.
After this review of how to use controls with your map using the available components from API, it's time to dive into OpenLayers support for mobile. You will learn how OpenLayers touch events work but also how to reuse device geolocation and orientation. Using the mobile context, we will review some HTML 5 features that can help with improving application experiences. This overview will cover web mapping sites such as native applications for mobiles.
The rise in popularity of mobile devices—smart phones and tablets—has changed the landscape of web development. Now, users expect our websites and applications to work on their mobile devices' smaller screens, respond to touchscreen interfaces and know where they are via integrated GPS. OpenLayers 3 provides some great features targeting mobile platforms, and we will highlight those in this chapter. But, developing mobile-friendly web applications has its challenges too, so we'll look at how to debug web applications on mobile devices and at some strategies to use when mobile devices lose their network connections.
In this chapter, we will cover the following topics:
One of the biggest differences between desktop and mobile web applications is how we interact with an application. On a desktop or laptop computer, we have a keyboard and a mouse or trackpad, and we point and click or click and drag things. On mobile devices though, there is no keyboard and no mouse pointer. Instead, we use our fingers, and we do things like touch, drag, and tap. We can also do more complicated things, such as pinching two fingers together or rotating two fingers, and we usually expect this to do something in an application. In mapping applications on touch devices, for instance, we might expect that dragging a finger will pan the map and pinching two fingers will zoom in or out.
OpenLayers provides touch support for us in the form of interactions—recall that we talked about interactions in Chapter 8, Interacting with Your Map. The touch-specific interactions are as follows:
ol.interaction.DragPan: This pans the map in response to one or more fingers being dragged across the screenol.interaction.PinchRotate: This rotates the map in response to two fingers twisting in a circular motion on the screenol.interaction.PinchZoom: This zooms the map in or out in response to two fingers pinching in or out on the screenThese interactions are created by default and enabled on devices that support touch events. Let's see them in action!
Because we'll view the examples in this chapter on a mobile device with a browser that does not have direct access to your development machine, we'll need to serve them through a web server and access them using the HTTP protocol. Your computer also needs to be connected to the same Local Area Network (LAN) as your mobile device.
We've already been using a web server with the samples using the URL http://localhost/. This URL uses the name localhost, a special name that tells the web browser to connect to the local machine. This is great for your desktop browser, but it isn't going to work for our mobile device. You'll need to find the IP address of your computer on the LAN.
On Windows, open a command prompt (cmd.exe) and type ipconfig.
You should see something like the following screenshot:
The ipconfig command will output some information about your network connections; the actual output will be different depending on your setup and how you are connected to the network, but you are looking for the marked line in the following screenshot:
Write down the IP address for future reference.
On OSX, you can find your IP address from System Preferences. Perform the following steps to find your IP address:
On Linux, open a terminal window and use the ifconfig command to get your IP address. If you are connecting using WIFI, type:
ifconfig wlanO
If you are connecting using Ethernet (cable), type:
ifconfig ethO
You will see output like the following screenshot:
You should see the IP address between inet addr and Bcast.
Before we continue, let's make sure that the IP address is correct. Replace localhost in your browser address bar with your IP address, and make sure that the page loads the same way. For instance, if you determined that your IP address is 192.168.0.1, then the URL would start with http://192.168.0.1/. Next, open the web browser on your mobile device and enter the same test URL. You should see that page opens in your mobile device's web browser.
If you are having problems with this step, make sure that WIFI is enabled on your mobile device and that it is connecting to the same network as your development machine.
Now, we are ready to test our new setup with a fully mobile-capable OpenLayers application. As you'll see in the following steps, there's nothing special you need to do with OpenLayers itself to work in a mobile environment:
mobile.html:<!doctype html>
<html>
<head>
<title>Mobile Example</title>
<meta name="viewport" content="width=device-width, initial-scale=1.0, maximum-scale=1.0, user-scalable=no">
<link rel="stylesheet" href="../assets/ol3/ol.css" type="text/css" />
<link rel="stylesheet" href="../assets/css/samples.css" type="text/css" />
</head>
<body>
<div id="map" class="full-map"></div>
<script src="../assets/ol3/ol.js"></script>
  <script>
    var layer = new ol.layer.Tile({
  source: new ol.source.OSM()
});
var london = ol.proj.transform([-0.12755, 51.507222],
'EPSG:4326', 'EPSG:3857');
var view = new ol.View({
  center: london,
  zoom: 6,
});
var map = new ol.Map({
  target: 'map',
  layers: [layer],
  view: view
});
</script>
</body>
</html>We created an example very similar to the ones we've been using in previous chapters and, just by loading it on a mobile device, we get new capabilities from OpenLayers' default touch interactions. We can now pinch to zoom in and out, move two fingers in a circular motion to rotate the map, and touch drag the map to pan around.
We made a couple of small changes to the example we used in previous chapters though, so let's highlight the differences. In the <head> section, we've added a <meta> tag. The <meta> tag provides information to the web browser rendering the page, its name indicates the type of information it is providing, and its content is the information or data we want to inform the browser about. In this case, we've used the viewport <meta> tag to provide some information that mobile web browsers can use to modify how a user interacts with the web page in a mobile browser. Let's break down the content and explain what it's doing, as follows:
<meta name="viewport" content="width=device-width, initial-scale=1.0, maximum-scale=1.0, user-scalable=no">
The content is a series of comma-separated key-value pairs formatted as key=value. The width key indicates how wide the browser's viewport should be. It can be set to a specific number of pixels or to a predefined value device-width, which indicates that the viewport should be 100 percent wide. The initial-scale and maximum-scale keys constrain the mobile browser viewport scale factor, which would allow rendering a page more zoomed-in than its default. Setting the user-scalable key to no disables zooming the web page in response to the user performing a pinch gesture. We want the pinch gesture to zoom the map, not the whole page. We've also changed the class name used on the HTML element that contains the map from map to full-map. This changes the map element to take up 100 percent of the width and the height of the browser viewport.
The remainder of the example is exactly the same as in previous chapters. In fact, you can load this example in your normal web browser, and it should function in exactly the same way as many of the other examples, the only difference being that the map will fill your browser window.
So, we get touch support in our web mapping application without really having to do anything at all. But just supporting touch events isn't that exciting. Let's explore what else OpenLayers has to offer on mobile devices, starting with finding our location.
OpenLayers provides us with the ol.Geolocation class, which can be used to find the current location of the user and to track changes in location over time. This class accesses information provided by web browsers through the HTML 5 Geolocation API.
Before we go any further, it's important to discuss the technology behind the Geolocation API a little bit to understand its limitations. The location of a device can be determined by several methods. Typically, we think of the location as being determined by a Global Positioning System (GPS), but in practice, the location of a device can be determined by several means, including the following:
A mobile device can use any of these techniques to determine its location, and the owner of the device can choose to turn any or all of these methods off, perhaps for privacy reasons or to conserve battery power.
Let's add another resource to our page, so that we can access some nice icons. In the past, we might have done this by creating images for each of the icons we wanted and then adding <img> tags. We are going to try a different approach this time using an iconic font called Font Awesome. We'll discuss why after the example; for now, just follow these steps:
<link> tag to the <head> tag of your HTML document, just after the link to ol.css:<link href="//netdna.bootstrapcdn.com/font-awesome/3.2.1/css/font-awesome.css" rel="stylesheet">
<style> section inside the <head> tag:<style>
.marker {
position: absolute;
width: 24px;
height: 24px;
font-size: 24px;
}
</style><div> tag just after the map <div> tag:<div class="map"></div> <div id="location" class="marker icon-flag"></div>
<script> tag, after all the other code:var marker = new ol.Overlay({
element: document.getElementById('location')
});
map.addOverlay(marker);
var geolocation = new ol.Geolocation({
tracking: true
});
geolocation.bindTo('projection', view);
geolocation.bindTo('position', marker);Step 1 adds a link to a stylesheet that defines an iconic font, which we'll discuss in more detail in just a moment. In step 2, we created a new CSS class called marker that we can add to the HTML elements we want to be displayed as markers on the map. This class sets the width and height of the element to be 24 pixels and also the font size, as we are using an iconic font for our marker images. In step 3, we added the HTML element we want to use as our marker. We gave it an ID of location, so that we could refer to it later and added both marker and icon-flag to the class. The marker class makes the element a specific size, and the icon-flag class indicates which icon to use from our iconic font. In step 4, the new code we added creates a new ol.Overlay attached to our marker element and adds it to the map. Then, we create an instance of ol.Geolocation and tell it we want to track location updates. Then, we bind the projection property of the geolocation object to the view's projection and position properties to the marker. The geolocation object will now automatically convert location updates into the correct projection for our view and move our marker overlay to our current location.
Iconic fonts are just like any other font, except that the characters in the font are designed as pictures instead of letters. Like text in a web page, the icons in a font are easily resizable and adapt to different resolution displays automatically. Mobile devices such as the iPhone 4 and later sport retina displays have a high pixel density. Normal images on retina devices end up looking blocky. Icon fonts are automatically rendered at a higher resolution on retina devices and are crisp and clear.
FontAwesome (http://fortawesome.github.io/Font-Awesome/) is a popular iconic font (at the time of writing this) and is easy to use in any web application, just by including a single <link> tag and then using icon-specific class names. We'll use a couple more Font Awesome icons in later examples, but if you are interested in what icons are available, visit their site and take a look around.
Font Awesome isn't the only choice for an icon font, and there are many tools on the Web to help you make your own icon fonts from existing vector art.
Now that we've seen ol.Geolocation in action, let's take a look at its full capabilities.
When creating an instance of ol.Geolocation, you can provide the following optional properties to control its initial behavior:
The Geolocation class inherits from ol.Object and has the following key-value observing (KVO) properties (recall that we discussed KVO in Chapter 2, Key Concepts in OpenLayers):
Many new computers, and especially mobile phones and tablets, provide hardware support to track their orientation. The HTML 5 specification defines the DeviceOrientation API to expose this information. Just as with the Geolocation API, OpenLayers provides the ol.DeviceOrientation class to make it easier to work with this API in a stable, cross-browser compatible way.
Device orientation refers to the orientation of the mobile device relative to a common starting point. A device's orientation is then reported as angles of rotation from this common reference orientation. For mobile devices, the reference orientation is defined as the phone lying face up on a table with the top of the phone pointing north. For computers, it is the same, except the screen is open at 90 degrees. This represents the zero state, and all angles are reported relative to this state.
Device orientation is reported as three angles—alpha, beta, and gamma—relative to the starting orientation along the three planar axes X, Y, and Z. The X axis runs from the left edge to the right edge through the middle of the device. Similarly, the Y axis runs from the bottom to the top of the device through the middle. The Z axis runs from the back to the front through the middle. In the starting position, the X axis points to the right, the Y axis points away from you, and the Z axis points straight up from the device lying flat, as shown in the following screenshot:
In practice, this allows us to respond to the user turning and tilting the device. The most useful property is the value of alpha, which lets us figure out where the compass heading the device is pointing at. Let's see this in action!
In this example, we'll display an icon at the user's location, use values from the DeviceOrientation API to create a simple compass, and by rotating it, show which way is north. Perform the following steps to achieve what's been set out in this paragraph:
<div id="location" class="marker icon-arrow-up"></div>
var deviceOrientation = new ol.DeviceOrientation({
tracking: true
});
deviceOrientation.on('change:heading', onChangeHeading);
function onChangeHeading(event) {
var heading = event.target.getHeading();
var el = document.getElementById('location');
el.style['-webkit-transform'] = 'rotate('+heading+'rad)';
el.style['transform'] = 'rotate('+heading+'rad)';
});Let's walk through the code and see what it does. First, we create a new instance of OpenLayers' helper class ol.DeviceOrientation and indicate we would like to receive orientation updates, as follows.
var deviceOrientation = new ol.DeviceOrientation({
tracking: true
});Next, we register a function to receive updates to the heading property, and it will be passed an event object that has the information we need, as follows.
deviceOrientation.on('change:heading', onChangeHeading);The function that receives the orientation update event does several things. First, we get the value of the heading property (in radians) from the event target.
var heading = event.target.getHeading();
We mentioned before that the value of alpha is used to figure out the compass heading. Not all devices support reporting of the device orientation in the same way. In particular, WebKit on iOS reports an alpha value that is computed from where the device is pointing when tracking is turned on instead of from north. OpenLayers provides a special property, heading, which reports the true angle from north and standardizes this across different devices behind the scenes.
Next, we obtain a reference to the HTML element that contains our arrow. We gave it an ID to make this easier, as follows.
var el = document.getElementById('location');Finally, we use CSS to rotate the arrow relative to north so that it's pointing in the direction our phone is pointing. The CSS3 transform property can apply a number of transformation functions to an element (see https://developer.mozilla.org/en-US/docs/Web/CSS/transform); in this case, we've selected the rotate function. We set the angle we want to rotate and specify that the value is in radians, since that is the unit that OpenLayers reports angles in. The following is the code to accomplish this:
el.style['-webkit-transform'] = 'rotate('+heading+'rad)';
el.style['transform'] = 'rotate('+heading+'rad)';We set this property twice to accommodate Safari and Chrome, which still only support the vendor-specific prefixed version of the property name.
Here is the complete API for the DeviceOrientation class.
When creating an instance of ol.DeviceOrientation, there is only one option currently available, which is as follows:
The DeviceOrientation class inherits from ol.Object and has the following KVO properties.
Mobile web browsers offer some exciting capabilities for our web applications, especially for map applications! But they offer some challenges too. We've seen in Chapter 2, Key Concepts in OpenLayers, that web developers have powerful tools like Chrome Developer Tools at their disposal for debugging web applications. But it's not that easy on mobile devices, where these tools don't exist. Fortunately, there is an answer! In this section, we'll cover techniques for debugging web applications on each of iOS and Android, as well as another tool that isn't device-specific.
The simplest way to debug web applications on iOS is to enable remote debugging with Safari on your Mac. If you don't have a Mac, skip ahead to the Debugging on Anything section.
We just enabled some pretty powerful debugging capabilities for our mobile application development. In the first step, we turned on the Web Inspector option that lets us access debug information for the current web browser process in Safari. In the second step, we enabled the Developer menu for Safari on a Mac computer. Finally, when we connect an iOS device to a Mac computer with a USB cable, we can use Safari's web debugging capabilities with the mobile Safari browser.
Depending on your version of Safari, Web Inspector might appear differently. In any case, Web Inspector has basically the same capabilities as those of Chrome Developer Tools, which were introduced in Chapter 2, Key Concepts in OpenLayers, and you have full access to inspect the HTML created for your application, change CSS styles dynamically, run JavaScript code, and view logfiles.
If you have an Android device, you can debug your web applications using the ADB Chrome extension and the Chrome DevTools introduced in Chapter 2, Key Concepts in OpenLayers. There are quite a few steps to get it all working, but it's worth it when you need it! So, here goes:
Phew! First, we made sure that we installed Chrome for Android on the device and the latest version of Chrome on our computer. Next, we installed ADB Chrome Extension for Chrome. Then, we allowed USB debugging on the device. Finally, we launched ADB Chrome Extension to see it in action. You can now debug your mobile web application running on your device with the Chrome Developer Tools.
It is also possible to debug using Firefox on Android; see https://developer.mozilla.org/en-US/docs/Tools/Remote_Debugging/Firefox_for_Android for more information.
Native debugging on mobile is great once you get it working, but what do you do when you don't have a USB cable with you, you have an iPhone but not a Mac, or you want to debug on some other device? There's a solution, of course, and the solution is to use WEINRE (WEb INspector REmote), an open source package that gives you an almost native debugging capability for mobile devices.
WEINRE is part of the Apache Cordova project (http://cordova.apache.org/) and was pioneered by Patrick Mueller. We will talk about Apache Cordova in the next section.
Using WEINRE involves combining three separate components, as follows:
The debug client and the debug server run on our development computer and the debug target runs on the mobile device.
To activate the debug target, we will need to add some JavaScript code, provided by the debug server, into the web page.
WEINRE is a Node.js application and is published as an NPM package. We've already talked about using Node.js and NPM to run a small server for editing features in Chapter 8, Interacting with Your Map. To install WEINRE then, all we need to do is open a command prompt and run the following command:
npm install –g weinre
This is how the command prompt would look when we run the preceding command. This command instructs NPM to install the WEINRE package globally, which will make the weinre command available to you.
To start WEINRE, we need to use the IP address of the development machine—see the beginning of this chapter if you don't remember it. Open a command prompt and run the following command:
weinre –boundHost <your ip address>
This is how the command prompt would look when we run the preceding command. The boundHost option allows the debug target's JavaScript to be loaded in a page on another machine, such as our mobile device. There are several other command-line options that you can supply to the weinre command; for the most part, you don't need them, but you can read about them in the WEINRE documentation at http://people.apache.org/~pmuellr/weinre/docs/latest/Running.html.
WEINRE starts a debug server and reports the URL at which the debug server page can be accessed. Copy this URL and open it in a web browser. The following is how the page will look when these actions have been performed:
This page has the information and links we need to get started with debugging our mobile web application. The first section, Access Points, contains links to the debug client user interface and documentation. The second section, Target Demos, gives you some quick links to try out WEINRE debugging right away. Try them if you like. The third section contains the link to the JavaScript we will need to add to our mobile web page to activate the debug target code. Let's go ahead with this now.
Open the mobile example page in a code editor. Copy the <script> tag from the following example in the target script section, and paste it into the example page just after the <title> tag, as follows:
<title>Mobile Examples</title> <script src="http://192.168.209.8:8081/target/target-script-min.js#anonymous"></script>
Now, for the big finale—load the mobile example on your mobile device, and then click on the link to open the debug client on your desktop machine. After that, this is how your screen will look:
The Remote tab shows the debug target connected and some other information. You can now click on the Elements, Resources, Network, Timeline, and Console tab. Click on the Elements tab to show the Elements panel. This is how your screen will look after performing these actions:
You can use the Elements panel just like Chrome Developer Tools and explore the DOM. Note that it can take a few moments for WEINRE to respond with information, so be patient and wait for it to appear.
The Resources panel shows WebSQL databases and data stored in the local storage and session storage. The Network panel shows XML HTTP requests issued after the page has loaded. Unlike Chrome Developer Tools, it can't capture the assets loaded by the page itself.
The Timeline panel can be used to display timing information about events and to track user-triggered events. Using this panel is beyond the scope of this book, but if you are interested, then check out the WEINRE documentation.
The last tab, Console, displays the JavaScript log and provides a command line for executing arbitrary JavaScript in your web page. Try typing the following command into the console and hit Enter:
alert('test');Your screen will look like this when the preceding command has been entered.
You should see an alert pop up on your mobile device, as shown in the following screenshot:
The Console tab also shows log messages, and we can filter by message types (Errors, Warnings, and Logs). Some log messages are generated by the browser itself, typically when an error happens, and we can use WEINRE to see if errors are happening. We can also programmatically send messages to log in our code using methods of the global console object that are available in all web browsers.
WEINRE isn't as complete as native debugging with iOS and Android, but it can certainly help out at a pinch.
One of the great challenges in delivering content to the mobile web is that mobile devices can easily be disconnected from the Internet. As users move around, they go in and out of range of WIFI and cellular networks, and the state of their network connection can change frequently. Native applications on mobile devices solve this problem by being installed on the device. Many native applications also cache content for offline use and are designed to handle the transient nature of mobile network connections. Web browsers, including mobile web browsers, typically cache web page content to help pages load faster. While this can help mobile web applications quite a bit, the cache managed by the web browser is unreliable, can be cleared by user settings, and might not keep critical content for your application. The cache also doesn't provide a mechanism to store generated data and stores only assets required to load a web page.
In this section, we will introduce three technologies that can help you with taking a web application offline:
The HTML 5 ApplicationCache interface is designed to help address the unreliable nature of web browser caches by allowing a developer to control how content is cached for offline use. The ApplicationCache interface provides us with the following benefits:
ApplicationCache is not displaced by new content in the normal browser cache, so it is much more reliableIf you are thinking Sounds great, lets get me some of that, read on!
Taking advantage of the ApplicationCache interface is actually very simple, and there are three steps we need to take:
A MANIFEST file is a plain text file that you can create in any text editor. The easiest way to describe its content is by example, so let's take a look at a MANIFEST file and then describe it in detail:
CACHE MANIFEST # version 2 CACHE:index.htmlscripts/app.jscss/styles.cssimages/logo.png NETWORK:login.php FALLBACK:images/large/ images/offline.jpg*.html /offline.html SETTINGS:prefer-online
The first line is mandatory; it must contain the specific text CACHE MANIFEST.
The second line is a comment. Comments are any line starting with a # character. One important characteristic of ApplicationCache is that the browser will usually not replace cached content with an updated version from the server unless the MANIFEST file changes or the prefer-online setting is specified. It is a common convention to include a comment near the top of the MANIFEST file, indicating a date or version number. When content is updated, the date or version in the MANIFEST file can also be updated, which will trigger the browser to download changed content. The third line declares the CACHE section. The CACHE section explicitly declares URLs that will be stored in the ApplicationCache. This line can be optional. If it is omitted, any files after the first line will be considered part of the CACHE section up to the start of any other section. The following lines up to the NETWORK line define files, by URL, that are to be cached. Wildcards are not allowed in the CACHE section. Do not include the MANIFEST file in the list of files to be cached, or it will be very difficult for users to get updates. URLs can be relative or absolute and might point to resources on domains other than that of the page being loaded. Check the following line, for example:
CACHE: http://another.server.com/logo.png
Next, comes the NETWORK section. This section contains a whitelist of resources that the browser will not cache (unless explicitly declared in the cache section), and which it is permitted to access when online. In this example, the browser can access login.php when online, and the results of loading that page will not be cached. This section is typically used to identify URLs that are part of a server API or content that cannot be used if it is out of date. URLs cannot contain wildcards, but a single wildcard character is allowed on a line by itself to indicate that any URL can be loaded. Check the following line for example:
NETWORK: *
The FALLBACK section defines alternate resources to be used if a particular resource is not available. Wildcards and path matching are allowed in this section. The first line of the FALLBACK section shows how you would display the image from images/offline.jpg for any image in the images/large path that is unavailable. In the next line, we specify that any HTML page that cannot be accessed should use offline.html instead. URL prefixes are allowed (a path to a folder for instance), but the wildcard character * is not permitted. Also, only URLs in the same domain as the web page can be listed in this section. As of writing this book, only one value is permitted in the final SETTINGS section, the prefer-online setting. If this is present in the SETTINGS section, then the browser will attempt to access the server version of resources before using the cached version.
Note the following rules for a MANIFEST file:
CACHE MANIFEST.# character is considered a comment.# character is a valid component of a URL.CACHE section up to the start of one of the other sections. Thus the CACHE: line is not strictly needed.CACHE, NETWORK, FALLBACK, and SETTINGS. A section is started by putting the section name followed by the : character.In order to trigger the use of an ApplicationCache MANIFEST file, you must include a reference to the MANIFEST file in your web page. This is done as an attribute of the <html> tag, as follows:
<html manifest="/myapp.appcache">
The value of the attribute is the URL to your MANIFEST file. Although the MANIFEST file can have any extension, it is standard practice to use .appcache as the file extension, and we recommend you follow this practice. The MANIFEST file must be delivered by a web server with mime-type of text/cache-manifest. The instructions for configuring a web server to serve particular files with a particular mime-type vary depending on the particular web server in use. Please consult the documentation for your web server to determine the best way to accomplish this.
Let's take the MANIFEST file out for a spin with our mobile example. The first thing we need to do is decide which resources we want to be included in our application cache and which we want to be excluded. Our application is pretty simple, so we won't need to exclude anything. So, here's what we will do:
myapp.appcache next to your example's HTML file.The first six lines are files requested directly by our application, and the remainder are map tiles loaded from the OpenStreetMap server. We'll explicitly cache the first six in our example.
CACHE MANIFEST # version 1 CACHE: 2360OS_10_04_appcache.html ../assets/ol3/ol.css ../assets/css/samples.css ../assets/css/font-awesome.css ../assets/ol3/ol.js ../assets/font/fontawesome-webfont.woff?v=3.2.1 NETWORK: *
<html> tag, as follows:<html lang="en" manifest="myapp.appcache">
We created an application cache MANIFEST file for our application, so it can load our application even when it has no network connection. The CACHE section contains the files we are explicitly using in our application. The NETWORK section contains the wildcard character to allow our application to access any URLs when we are online so that we can get map tiles. Now, when the mobile device is offline (it has no network connection), the application can still be loaded correctly.
Unfortunately, if you pan or zoom, you will start to see some blank spots. These are map tiles that are not cached by our browser. On the first load, you should see any map tiles that were loaded while we were online (in step 5). Any tiles you accessed prior to going offline might be available in the normal browser cache until it is cleared or they are displaced by newer content.
In summary, the ApplicationCache interface provides an easy and convenient mechanism to ensure content is available offline and to speed up loading of any web application by explicitly caching content in the browser for online and offline use. Unfortunately, for mapping applications, it doesn't solve the problem of accessing remote servers, including map tile sources, while offline. The next section, on HTML5 Storage, discusses part of the solution, and the final section, on Apache Cordova, provides another alternative.
Mobile web applications are a fast-growing market. Users with mobile devices expect access to all content on their mobile devices. While mobile web applications provide a great user experience in most cases, they often fall short of so-called native applications because they do not have access to convenient offline storage, capabilities of the physical device such as the camera, and data available to other applications, such as the user's contact list. Short of building a native application, there doesn't seem to be a way to access the full capabilities of mobile devices. But, do we really want to recode our great web application into native code for iOS, Android, Blackberry, Windows Mobile, and whatever other devices our users might have?
It turns out that we don't have to. On every major mobile platform, the web browser is also available as a component that can be embedded into a native application. This one fact means that it is possible to create native applications whose entire user interface is a web page and still have access to all the native functionality of the device. Doing this on every platform that you might want to support probably seems like a daunting task even if you know anything about coding native applications—or perhaps especially if you do!
Open source to the rescue again! Apache Cordova, a fantastic project of the Apache Foundation, provides the framework to create native applications from mobile web applications with almost no need to know anything about native development—and it works on all major mobile platforms. Not only will Cordova provide you with the tools to wrap your web application up into a native application, it also exposes the most common native capabilities to your web application, including:
Unfortunately, we can't cover using Apache Cordova in any detail in this book—there simply isn't enough room; it's enough material for an entire book by itself! If you need access to more than the web browser can provide on mobile devices though, we highly recommend that you check out the Apache Cordova website at http://cordova.apache.org/, where you will find lots of great information and starter projects to get you going on each platform.
Let's bring together what we've learned by expanding our application to track our movement over time and display it on the map. Recall that we covered vector features in Chapters 6, Styling Vector Layers, and Chapter 5, Using Vector Layers. So, here's what we will do:
<script> tag:var trackStyle = new ol.style.Style({
stroke: new ol.style.Stroke({
color: 'rgba(0,0,255,1.0)',
width: 3,
lineCap: 'round'
})
});
var trackFeature = new ol.Feature({
geometry: new ol.geom.LineString([])
});
var trackLayer = new ol.layer.Vector({
source: new ol.source.Vector({
features: [trackFeature]
}),
style: trackStyle
});trackLayer to the map, so add it to the array of layers where we create the map, as follows:var map = new ol.Map({
target: 'map',
layers: [layer, trackLayer],
view: view
});trackFeature as we move by modifying what happens when the geolocation object's position changes, as follows:geolocation.on('change:position', function() {
var coordinate = geolocation.getPosition();
view.setCenter(coordinate);
trackFeature.getGeometry().appendCoordinate(coordinate);
});We just created a very simple tracking application that follows our location and renders a line on the map to show where we've been. In step 1, we created a few new objects based on our knowledge of vector layers and features from Chapters 6, Styling Vector Layers, and Chapter 5, Using Vector Layers. First, we created a style object that draws our line in blue. Next, we created a feature object containing a LineString geometry to record our movements in. Lastly, we created a vector layer with a source that references our track feature using our style for blue lines. In step 2, we added the layer to the map. In step 3, we updated the geometry of the track feature by appending the latest position update coordinate to its LineString geometry.
Q1. Which OpenLayers class provides access to a mobile device's location?
ol.GeoLocation.ol.View.ol.DeviceOrientation.Q2. Which OpenLayers class tells you which direction your mobile device is pointing in?
ol.GeoLocation.ol.View.ol.DeviceOrientation.Q3. Which OpenLayers class would you use to center the map on your current location?
ol.GeoLocation.ol.View.ol.DeviceOrientation.This brings us to the end of this chapter. We've seen that OpenLayers is basically mobile-ready out-of-the-box, and there's really not much we need to do to make it work in a mobile web browser. The GeoLocation and DeviceOrientation classes provide access to some useful information in a mobile environment, including our position, speed, altitude, and direction of travel, and we saw these in action. We can even tell which direction our device is pointing in. We've learned how to debug mobile applications and how to prepare them for working offline. We wrapped up with an example that records our movement over time using vector layers and features.
In the next and final chapter, we will be building a complete application from scratch using everything we've learned so far. We'll also be introducing the OpenLayers build tools and learning how to create a production-ready application.
By now, we've covered all the parts of OpenLayers that are essential for making our own web map application. So far, we've been focusing on how to use the various different parts of OpenLayers. In this chapter, we'll put together those pieces that we've learned and demonstrate how to create an actual web map application with OpenLayers.
While we won't be introducing many new things in this chapter, we will put them together in ways we haven't before. Throughout this chapter, we'll:
In this chapter, we'll be developing a web map application that loads in data from a third-party source (Flickr). The examples have been structured with iterative development in mind. What this means is that you start small and make many changes, gradually building up your web map from nothing into something useful. Iterative development is an important, popular, and effective way to develop applications. The core idea is that you create something simple, get it working, and then improve it. You can figure out more quickly what does and doesn't work by improving on, and learning from, the previous iterations.
Another strategy we'll make use of is modular programming. What this means, essentially, is that we try to keep things as discrete (or modular) as possible. By doing so, once we know a component works, we don't have to worry about it later.
Because OpenLayers is so flexible, it's easy to make third-party software and data work with our maps. Sharing geospatial data is becoming more popular, with services such as Flickr and Twitter freely offering geospatially embedded data. Being able to visualize data often helps us to understand it. Using OpenLayers, we can place geospatial data (say, Twitter posts or Flickr images) on a map and get a clearer picture about the data.
Many popular sites provide an API (Application Programmer Interface) that allows programmers to interact with their data. For instance, both Flickr and Twitter provide APIs that enable developers to view recent updates (photo uploads and tweets). These APIs (but not all APIs) let us get geospatial data that we can use with OpenLayers. Flickr provides some very easy-to-use methods to retrieve data with associated geographic information; so, we'll focus this chapter on building a web-mapping application around Flickr.
You can find out more about APIs and what they support at various websites, a good one is http://www.programmableweb.com.
While Flickr provides a very robust developer API, we'll only interface with Flickr via URL calls that provide access to feeds. Feeds provide information about data, and we can get different kinds of feeds (for example, a specific user's feed or the feed for all users combined). It's really quite easy to do; we just make a call to a URL and specify certain parameters. The base URL we'll call is http://api.flickr.com/services/feeds/geo/?format=kml. The format parameter can be a number of values—KML, JSON, RSS, SQL, and so on. We'll be using KML and JSON in this chapter. When calling this URL, a file in the format you ask for will be returned that contains information about the latest photos uploaded that have geographic information associated with them (that's what geo in the URL is for).
Flickr's API documentation can be found at http://www.flickr.com/services/api/. More information about the Flickr feeds can be found at http://www.flickr.com/services/feeds/.
We can refine the data that is returned by adding additional parameters to the URL. You can specify a user's ID via the ID key, a group via the g key, and tags via the tags key. You can also specify other things, such as a certain coordinate and radius—for now, we'll just be focusing on the tags key.
Let's create a web map application that will pull in data from Flickr and display it on a map. This will allow us to see, geographically, from where photos were submitted. We can, for example, search for bird photos and get an idea where some particular bird species might be common (or at least, commonly photographed and uploaded to Flickr).
The application will provide a search box to enter tags and refresh the map based on them, and allow you to click on points on the map to view the photo and details about it.
We'll break down the development of this application into small steps:
Okay, we've got a goal in mind and broken it down into some manageable steps—we'll start simple and improve in increments until we reach our goal. Let's get started.
The first step in our application will require us to get data from Flickr. We'll request some data and save it locally.
bird as a tag. Open up this URL in your web browser, and you should be able to download it as a KML file from http://api.flickr.com/services/feeds/geo/?format=kml&tags=bird.flickr_data.kml and place it in your map directory.style tags—if we want, we can directly apply the styles from the file to our map (as we'll see soon).We just downloaded the latest images in the KML format that contained a tag called bird. When you call the URL and pass in a tag, Flickr will return to you the latest images uploaded that have some geographic information associated with them. You may be wondering why we downloaded the KML file. If you remember from Chapter 5, Using Vector Layers, we can just create a vector layer and point to the Flickr URL, instead of a local file. Doing this adds complexity, however, because Flickr does not support Cross Origin Resource Sharing. When we download the KML file, we can access it directly. When we're in the development mode, we want to keep things as easy as possible to debug and fix. Once we get the code working to load the KML file we downloaded (in the next example), we don't need to worry about it anymore. When we develop our application and find bugs or errors with it, we don't have to spend much time tracking them down. We get the static file working, and we move on to the next task. We don't have to worry about the Flickr API going down, our requests not completing, or other things—we can focus on other parts. Once we get more parts of our application working, then we'll switch to using the dynamic URL. For now, let's use the static file.
With the data from Flickr from the previous example, we have enough to get started. We'll create our simple application with an OSM base layer and a vector layer filled with the Flickr data on top of it:
flickr.html. We'll use the familiar structure. Also, we'll start with ol-debug.js and optimize it later:<!doctype html>
<html>
<head>
<title>Flickr App</title>
<link rel="stylesheet" href="../assets/ol3/css/ol.css" type="text/css">
<link rel="stylesheet" href="../assets/css/samples.css" type="text/css">
</head>
<body>
<div id="map" class="map"></div>
<script src="../assets/ol3/js/ol-debug.js></script>
<script>
</script>
</body>
</html><script> tag. Adjust the URL property to point to where you saved your file:var flickrSource = new ol.source.KML({
url: '../assets/data/flickr_data.kml',
projection: 'EPSG:3857'
});
var flickrLayer = new ol.layer.Vector({
source: flickrSource
});var layer = new ol.layer.Tile({
source: new ol.source.OSM()
});var center = ol.proj.transform([0,0], 'EPSG:4326', 'EPSG:3857');
var view = new ol.View({
center: center,
zoom: 1
});
var map = new ol.Map({
target: 'map',
layers: [layer, flickrLayer],
view: view
});The automatic styles provided in the KML file make it a little difficult to see the photos, especially when we are zoomed out—the thumbnails of the photos are just too large. It'll be nice to make the thumbnails of the photos smaller, but we don't have any control over the default style provided with the KML file. However, we should be able to replace the default styles with our own and achieve the effect we want.
We'll accomplish this in two steps. First, we'll replace the default style with a simple one, and then, we'll develop a new style to display smaller thumbnails:
extractStyles: false to its options:var flickrSource = new ol.source.KML({
url: '../assets/data/flickr_data.kml',
projection: 'EPSG:3857',
extractStyles: false
});function flickrStyle(feature) {
var style = new ol.style.Style({
image: new ol.style.Circle({
radius: 6,
stroke: new ol.style.Stroke({
color: 'white',
width: 2
}),
fill: new ol.style.Fill({
color: 'green'
})
})
});
return [style];
}assets folder, yours will look different if you downloaded new data:Great, we've replaced the automatic style extracted from the KML file with a simple one driven by a style function. Our style function returns an array containing our simple circle style. If you have been paying attention, you should have noticed that our style function is not at all efficient—we are creating a new copy of exactly the same style for every single feature! Don't worry though, this is a temporary state that we'll fix shortly by generating a unique style for each feature, based on its photo and we'll add caching when we do.
We can use OpenLayer's icon style to display an image, we just need the URL to the photo. We can use the JavaScript console to take a quick look at what data is associated with each feature, so that we can figure out where the URL is stored. With the previous example running in your browser, open the JavaScript console and type the following commands:
var feature = flickrSource.getFeatures()[0]; feature.getProperties();
This gets the first feature from the vector source and displays its properties, which should show you something like the following screenshot:
Well, that wasn't as useful as we'd hoped. The URL to the photo is not there, so what's happening? It turns out that the KML format includes style information and OpenLayers is smart enough to extract that information and automatically generate style functions for the features. Unfortunately, OpenLayers is also hiding all the extra information about the feature that we need. We need a different solution.
We mentioned earlier that the Flickr feed API supports more than just the KML format. It also supports a variety of RSS versions and JSON. That sounds promising; let's see if we can do better with the JSON version. Refer to the following steps:
flickrSource, with a generic vector source. Reload the page and make sure that everything still works. You should see the base map but no features (we'll add them shortly):var flickrSource = new ol.source.Vector();
json. Load the following URL in your browser and save the result to a new file called flickr_data.json:jsonFlickrFeed (on the first line, this means that it is intended to be loaded as JSONP).JSONP, or JSON with Padding, is a technique for loading JSON data from a remote server that avoids the restrictions of the same-origin policy. See http://en.wikipedia.org/wiki/JSONP for a good description of why and how JSONP works. For now, it is sufficient to know that JSONP will invoke a callback function and pass the data to it.
The next few lines appear to be metadata about the response—a title, description, date, and so on. What comes next seems to be what we want—an array of objects that represent photos, complete with links to photos and geographic locations. Perfect!
ajax method to do this:$.ajax({
url: '../assets/data/flickr_data.json',
dataType: 'jsonp',
jsonpCallback: 'jsonFlickrFeed',
success: successHandler
});successHandler function to process the data into features and add them to the map:function successHandler(data) {
var transform = ol.proj.getTransform('EPSG:4326', 'EPSG:3857');
data.items.forEach(function(item) {
var feature = new ol.Feature(item);
feature.set('url', item.media.m);
var coordinate = transform([parseFloat(item.longitude), parseFloat(item.latitude)]);
var geometry = new ol.geom.Point(coordinate);
feature.setGeometry(geometry);
flickrSource.addFeature(feature);
});
}var feature = flickrSource.getFeatures()[0]; feature.getProperties();
Allowing for different features in the new data file, the application should look exactly the same as before. The only difference is, we are now using JSON data instead of KML. Let's review how we changed from KML to JSON.
The JSON data is not in a format that is directly usable by OpenLayers; so, we need to do most of the work that a format-specific source would do for us. The first step was to remove the KML source and replace it with a generic vector source, into which we can insert the features as we get them. The next step is to load the data. We've chosen to use jQuery's ajax function to do this. The ajax function needs a URL to load from, a function to call when the data is loaded (successHandler) and a configuration to help it understand that the data is in the JSONP format:
dataType: 'jsonp'
And, that it uses a specific callback function name:
jsonpCallback: 'jsonFlickrFeed'
The final step is to interpret the data once it is loaded and create the features we need. We do this inside successHandler by first creating transform that will convert coordinates from latitude and longitude into the projection we are using for the map's view:
var transform = ol.proj.getTransform('EPSG:4326', 'EPSG:3857');Then, we loop over all the items and turn each one into a feature. Each item is an object literal containing all the information we need for positioning and styling the photo. We create a new feature object and pass it this information, so that we can access it later for styling purposes:
var feature = new ol.Feature(item);
From looking at the properties of each photo, we see that the URL to the photo is stored in the media attribute under a key called m. This will be inconvenient to work with later; so, we create a new property called url with the value we want:
feature.set('url', item.media.m);We need to create a new geometry object to represent the feature's location using the latitude and longitude of the photo (remembering to also transform the coordinates into the view's projection) and set it as the geometry of the feature:
var coordinate = transform([parseFloat(item.longitude), parseFloat(item.latitude)]); var geometry = new ol.geom.Point(coordinate); feature.setGeometry(geometry);
Finally, we added the feature to our vector source:
flickrSource.addFeature(feature);
Now that we've got that sorted out, we should be able to create a thumbnail style for our photos reasonably easily:
var cache = {};flickrStyle function and replace it with the following:function flickrStyle(feature) {
var url = feature.get('url');
if (!cache[url]) {
cache[url] = new ol.style.Style({
image: new ol.style.Icon({
scale: 0.10,
src: url
})
});
}
return [cache[url]];
}We just updated our style function to return a more suitable style. In the first step, we created an object to act as a cache for our styles, so that we don't create them multiple times (that's inefficient!), and in the second, we updated our style function to create a new icon style for the feature, if one isn't in the cache already. Our icon style takes care of scaling the image to 10 percent of its original size so that it's not too big for the map area.
So far, we've accessed data from Flickr, saved it to a file, added it to our map and created a simple photo thumbnail style. This is pretty cool, but we really haven't done much other than just load in the data, from an OpenLayers's point of view. It's useful, but we really haven't created a full-featured web application just yet. So, let's focus on how to build a more useful web-mapping application. To do this, we'll basically need to do two general things:
Let's focus on the first part, and then change the data source after we develop some interactivity.
We need to decide what interactivity we'd like to provide to make our application interactive for our users. We'd like our users to be able to click on a photo and see relevant information. For this, we can use the select interaction. What should happen when we select a feature? We'll want to show information about the feature we clicked on, and that information is the Flickr photo itself and any associated attributes. So, let's keep things for now and show the photo's information below the map when a feature is selected.
So, let's go ahead and add a select interaction to our application:
select interaction. We'll add events soon, but for now, let's just create the control and add it to the map and then activate it. Add this at the end of the main <script> tag after all the other code:var select = new ol.interaction.Select({
layers: [flickrLayer]
});
map.addInteraction(select);style option that allows us to do this. We'll create a new function to return a selected style by making a copy of our flickrStyle function and cache object, using a larger scale value, and using the new style function with the select interaction:var selectedCache = {};
function selectedStyle(feature) {
var url = feature.get('url');
if (!selectedCache[url]) {
selectedCache[url] = new ol.style.Style({
image: new ol.style.Icon({
scale: 0.50,
src: url
})
});
}
return [selectedCache[url]];
});
var select = new ol.interaction.Select({
layers: [vectorLayer],
style: selectedStyle
});We just added some interactivity to our map. Let's recap how we did this.
The first step, was to add a select interaction to the map, configured to select features from our vector layer:
var select = new ol.interaction.Select({
layers: [flickrLayer]
});
map.addInteraction(select);The default selection style wasn't appropriate; so, we added a new function for styling selected features. We created a new cache object for selected styles, so that we could use the URL as the value for caching, and the style we used was the same thumbnail style but with a larger photo.
We've duplicated the style code, which was easy to do and doesn't really introduce any problems in the runtime efficiency of our code. However, duplicated code can cause maintenance problems in real applications and some effort should be made to avoid obviously duplicate code. Try refactoring the style-related code to eliminate duplication as much as possible. You'll still need separate functions for the select interaction and the vector layer, but the code inside each layer looks like a candidate for moving into a new consolidated function that takes scale as a parameter.
The next step is to display some information about photos when they are selected. To do this, we'll need to listen for an event on the select interaction's collection of selected features and retrieve the features that were selected. Our plan is to have some photo information display when we select features:
<div> tag that will appear below the map. In your HTML code, add the following line after the map's <div> tag:<div id='photo_info ></div>
var selectedFeatures = select.getFeatures();
add event. For now, let's put the URL of the selected photo into our photo_info <div> tag:selectedFeatures.on('add', function(event) {
var feature = event.target.item(0);
var url = feature.get('url');
$('#photo-info').html(url);
});photo_info <div> tag:selectedFeatures.on('remove', function(event) {
$('#photo-info').empty();
});We used the select interaction to respond to the user selecting photos. While there is no direct way to do this, we can use the add and remove events of the collection returned by getFeatures to update our photo_info div with some information about the selected photo.
Earlier, we revealed what information is available for each feature by running the following code in the JavaScript console:
var feature = flickrSource.getFeatures()[0]; feature.getProperties();
And, we saw the following in the console:
We can see that each feature has some interesting information we might want to display:
author and author_id: These are useful for identifying the Flickr user that took the photo.date_taken and published: These contain the date that the photo was taken and the date it was published to Flickr.description: This is a pregenerated HTML string that contains useful information about the photo including the user's description, if available.link: This takes you to the actual Flickr page for the photo.tags: This is a space-separated list of tags associated with the photo.title: This was provided by the user that uploaded the photo.The description property seems like a great thing to display. It's nicely formatted and includes some interesting information for some photos. Unfortunately, all that nice formatting only shows up if we insert the description as HTML into our page. Injecting untrusted HTML into a page, without first sanitizing it, makes your application prone to XSS (Cross-site scripting) attacks, a technique for injecting and executing unauthorized JavaScript into web pages. You should never inject HTML from an untrusted source into a web page. Even though it might seem safe to trust Flickr, we'll be prudent and avoid the description property by creating our own description from other information available.
We need a programmatic way to display the information about our photos in the web page. This means taking data about the selected features and creating HTML elements for them. For the purpose of this chapter, we'll create an HTML template and populate it with data from the feature. While there are many different approaches and libraries for implementing HTML templates, our needs are simple; so, we'll do it without depending on another library.
We'll need several HTML elements to display each piece of information, and a way to specify where in the elements we want to put what information. We could write the template as a JavaScript string, but then we couldn't put line breaks into the HTML and it will be difficult to read in the code. Instead, we'll use the same technique that most templating libraries use—a <script> tag with the id and type attributes set to something other than text/javascript. We'll explain how it works later. We'll use brace brackets { and } around key words to indicate where we want to place specific information.
<body> tag, by convention, they are usually added after everything else and just before the </body> tag at the end:<script type="text/html" id="photo-template">
<a href="{link}" target="_blank" title="Click to open photo in new tab" style="float:left; "><img src="{url}"></a><br>
<p>Ta ken by <a href="http://www.flickr.com/people/{author_id}" target="_blank" title="Click to view author details in new tab">{author}</a> on {date_taken} at lat: {latitude} lon: {longitude}</p><br>
<p>Tagged in <b>{tags}</b></p>
</script>function photoContent(feature) {
var content = $('#photo-template').html();
var keys = ['author','author_id','date_taken','latitude','longitude','link',
'url','tags','title'];
for (var i=0; i<keys.length; i++) {
var key = keys[i];
var value = feature.get(key);
content = content.replace('{'+key+'}',value);
}
return content;
}selectedFeatures.on('add', function(event) {
var feature = event.target.item(0);
var content = photoContent(feature);
$('#photo-info').append(content);
});We just built a simple templating system that lets us put feature properties into an HTML template and injected the results into the page to show information about each feature in the selected cluster. Let's review each step in detail.
In the first step, we created our HTML template by putting the HTML code we want to display for each photograph into a <script> tag. This probably sounds strange, but it is a technique used by many template libraries. The <script> tag has a type attribute that tells the browser how to interpret its content. When we are writing JavaScript, the value of the type attribute is text/javascript. If the type attribute is not specified, all browsers will assume that the type is just this—text/javascript. However, if the type is set to something else that the browser does not recognize, such as text/html, then the browser will ignore both the tag and its contents. It is still in the DOM, however, and we can retrieve its content using jQuery's html() method, just as we will with any other HTML element. This allows us to write readable HTML that can be accessed programmatically, without having to worry about it showing up in the web page.
The template content is self-explanatory. We used an anchor tag around the image and some <p> tags for extra information about the author and keywords that the photo was tagged with. We placed brace brackets around a keyword in each place we wanted to insert some information dynamically from a feature property. To keep it simple, the keywords will match the feature property names. Thus, the following line in the template will get replacements for {link} and {url} from the current feature:
<a href="{link}" target="_blank" title="Click to open photo in new tab"><img src="{url}"></a><br>In the second step, we added a function that generates HTML content for a given feature by replacing placeholders in the template with actual values. The first step is to get the content of the template as a string, for which we use jQuery's html() method:
var content = $('#photo-template').html();Next, we have an array of the property names we want to process replacements for.
var keys = ['author','author_id','date_taken','latitude','longitude','link','url','tags','title'];
For each of these, we get the value of the previous property from the feature:
for (var i=0; i<keys.length; i++) {
var key = keys[i];
var value = feature.get(key);Finally, we replaced the placeholder (the key wrapped in brace brackets) with the value and when all replacements were done, we returned the resulting string:
content = content.replace('{'+key+'}',value);
}
return content;In the last step, we made use of our function to get HTML for the selected feature and added it to the page:
$('$photo_info').append(content);The data we've loaded (flickr_data.json) is from a third-party source, but it's only fresh up to the point that we download it. Our application will load the data in real time when the page is loaded. Now that everything is functional with static data, its time to get dynamic and load data in real time.
In this exercise, we'll change our code to fetch the data from Flickr when the page loads, rather than using a previously downloaded file. As you'll see, this is quite straightforward.
$.ajax function and load data directly from the live feed rather than our static file. Go ahead and modify the URL:$.ajax({
url: 'http://api.flickr.com/services/feeds/geo/?format=json&tags=bird',
dataType: 'jsonp',
jsonpCallback: 'jsonFlickrFeed',
success: successHandler
});Showing bird pictures from around the world is nice—but what about giving users the ability to show a photo with any tag they want? That's what we'll do next. So far, we've created a map that lets users interact with Flickr data. As far as we're concerned, we're more or less done with the interaction part. Now, we'll focus on changing the data source part. Currently, we're only asking for photos with the bird tag, but we want to allow that to be any tag.
An important concept in application development is to keep things modular. This basically means that we try to write out applications in such a way that we can take out, and put in, different parts without drastically changing the rest of our code. In this case, we will leave the interaction part of our code alone (what we've done so far at least) and focus mainly on the code that retrieves data.
What needs to happen? Well, let's think this through. We want the user to be able to specify any tag they want. We want to allow multiple tags. This means we'll need to change the URL that the $.ajax function is loading, but only after the user specifies some tags. We'll want to create a function to wrap the $.ajax call and come up with a way to change the URL based on the selected tags. We'll also need to deal with removing existing features when the tags change.
So, we know we need to allow a variable that specifies the tags parameter in the URL to be based on user input. We'll need to create an input box that will allow the user to specify tags. We'll also have a submit button that will, when clicked, call a function that updates the $.ajax method's URL with the specified parameters.
Let's add some more interaction to our map now. We'll add an input box that will change the requested Flickr data based on the user's input:
<div id="search" style="position: absolute; top: 10px; right: 10px; padding: 5px; background-color: rgba(255,255,255,0.5);"> <input type="text" placeholder="Search photos by tag(s)" style="width: 200px"> <button type="button">Search</button> </div>
$.ajax call with a function that will get called when the button is clicked. This function will do three things. First, it will clear the existing features from the map. Next, it will clear any selected photo info. Finally, it will request new data from Flickr with the appropriate tags:function loadFlickrFeed(tags) {
selectedFeatures.clear();
flickrSource.clear();
$('#photo-info').empty();
$.ajax({
url: 'http://api.flickr.com/services/feeds/geo',
data: {
format: 'json',
tags: tags
},
dataType: 'jsonp',
jsonpCallback: 'jsonFlickrFeed',
success: successHandler
});
}loadFlickrFeed function:$(document).on('click', '#search button', function() {
var value = $('#search input').val();
var tags = value.split(' ').join(',');
loadFlickrFeed(tags);
});loadFlickrFeed function will get called and refresh the vector layer. Try typing in various tags (or multiple tags separated by a comma) and hitting the button:We just updated our Flickr application to allow user input that affects what data is shown. We did this in a sort of modular way—we didn't have to change any of the previous code we wrote. Instead, we just created a function that clears the existing features and loads new ones based on the selected tags. Now that we've written an application, let's talk a little bit about how to deploy it.
What does it mean to deploy an OpenLayers (or any other) application? Basically, deploying something means that we're switching from a development mode to a production mode; we're releasing something for the rest of the world to see.
The production application should be as fast and bug free as possible. As we want the production version to be accessed as quickly as possible, this will often include removing things we used in the development environment and tweaking the production environment to better handle a lot of users. This also means using files that are as small in size as possible. While fully optimizing a web application is beyond the scope of this book, there are a couple of things we can do with OpenLayers to help optimize our JavaScript file size: create a custom build of OpenLayers and compile our code with the OpenLayers code.
There are many other things we should do to better prepare our production environment, such as using caching, as well as combining and minimizing our website's assets. These, and other practices, are outside the scope of this book, but further information can be found at http://en.wikipedia.org/wiki/Web_performance_optimization#Best_practices.
OpenLayers provides an easy way to create a custom build of the library to include in your page that contains only the things you need. Throughout this book, we've been including a file called ol.js (or ol-debug.js), a file that contains all the functionality (classes, functions, and so on) that OpenLayers provides. So far, this has been great—we've been developing up to this point, so we want to be sure that we have access to all the classes that we may use.
Well, the ol.js file we've been using is around 391 KB, and the debug version is 3.5 MB! Both are quite large files to load, especially since they contain only JavaScript code. Even though large file sizes aren't as much of an issue as they were years ago, when everyone was on slower connections, a large JavaScript file in a production environment is something we want to avoid if at all possible. This is especially true for mobile environments, where users pay for data plans and data speeds can be highly variable.
We want all our files in a production environment to be as small as they can absolutely be. This will allow users to download the files faster (since there is less to download), which decreases the page's loading time (saves on bandwidth expenses). Faster page loads (even if the speed is only perceived) will greatly enhance the user's experience. Fortunately, we can greatly reduce the size of the OpenLayers library file with a build tool provided by OpenLayers.
To optimize your application code for production, there are two approaches you can take:
The following table shows the advantages and disadvantages of each approach:
|
Approach |
Advantages |
Disadvantages |
|---|---|---|
|
Combined compilation | ||
|
OpenLayers and application code separate |
|
Before going further, you will need to follow the installation process for Python, Java, and Node following the guide in Appendix B, More details on Closure Tools and Code Optimization Techniques. These tools are required to create custom builds of OpenLayers.
The standard release archive for OpenLayers does not contain the build tools we require. Additionally, the build tools provided with OpenLayers work only with code cloned from a Git repository. The instructions for this book are designed for version 3.0.0 of OpenLayers. To make sure that you are using the correct version, you can check out the v3.0.0 branch of the repository using the following command:
git checkout -b v3.0.0
If you have already run the OpenLayers build tools on a version other than v3.0.0, it is recommended to remove the build and node_modules folders and start again.
We'll briefly cover how the closure compiler works to optimize your code, as we will need to understand it a little bit to use it properly. More detailed information can be found in Appendix B, More details on Closure Tools and Code Optimization Techniques.
The closure compiler optimizes code by applying a series of transformations to your code. Covering all of these is the topic for a whole book in itself, but for our purposes it does three basic things:
When the compiler rewrites your code, it will attempt to use language features that reduce the overall size of your code and execute more efficiently. This can include the following:
Generally, these changes are safe and do not change the logic or functionality of your code. They simply take advantage of language features to fit your code into less space.
The compiler will also attempt to remove the so-called dead code. Dead code is any function that the compiler determines will not be called by the application. It is sometimes difficult for the compiler to automatically determine what code your application will use, especially if you are creating a separate build. In these cases, we need to tell the compiler what things we need to keep even though they might be considered dead code. This is generally done in two ways depending on our strategy. If we are creating a combined build, the compiler can generally determine what functions we will need automatically, but it doesn't know what files to include in the first place. To help the compiler, we add code to register these dependencies. If we are creating a separate build, the compiler doesn't have our code to analyze; so, we have to use a different technique. In this case, we will provide an explicit list of functions to keep in the compiled library.
We will cover both techniques shortly.
The final compiler technique we need to discuss is the renaming strategy. Generally, when we are writing code, we use descriptive names for functions and variables. This makes code much more readable to ourselves and others, and it's much easier to remember names that mean something when writing our code. However, these long names take up space—1 byte per character—and when they are used repeatedly, it can really add up. The JavaScript engine in a browser doesn't really care about our descriptive names though. A name like X1 is just as good as GeoJSONParser, and as long as it is used in the right places, we can save 11 bytes for every use of GeoJSONParser by replacing it with X1. Using short names is not practical for application developers, but it is something that can be done really well by a compiler.
Unfortunately, this is one of the biggest gotchas of using the Closure Compiler. It renames objects, functions, and properties very aggressively and makes them effectively unusable by external code. There are two main problems we need to be aware of concerning this renaming.
When creating a standalone build of OpenLayers, we need to make sure that the objects, functions, and parameters we need are not renamed. This is done using exports, which will be covered later in this chapter.
When creating a combined build of OpenLayers with our application code, we no longer have to worry about exports because our use of the OpenLayers objects, functions, and properties will be taken into consideration by the compiler and renamed appropriately. However, if we use other third-party libraries (for instance, jQuery), the closure compiler does not know about them and will rename our use of their objects, functions, and properties. There are two things we can do to tackle the second problem. First, we can provide special JavaScript files, called externs, which define the objects, functions, and properties of external libraries. The compiler can then correctly avoid renaming parts of our code that we need to preserve. The second, is to use string values in key places, because the compiler will never rename a string value. This technique relies on the ability for JavaScript code to reference object properties using array-like syntax. For instance, if we have a property name on an object foo, normally, we would reference it like the following:
foo.name = 'test';
The compiler might rewrite this code like the following:
XB.XC='test';
If foo is an object coming from some external library that relies on name, our code may break in unusual ways. To prevent this, we can use the array-like notation with a string value to avoid renaming:
foo['name'] = 'test';
We'll see an example of this in our next example.
Exports and externs are quite similar. The first is for choosing the library code you want to expose the third-party code, whereas the second, is to stop the default renaming behavior for the third-party code. To fully grasp the difference, you should refer to the official topic on Do Not Use Externs Instead of Exports! at https://developers.google.com/closure/compiler/docs/api-tutorial3#no.
There are a few steps we need to take to create a combined build. These are as follows:
<script> tag that contains all the JavaScript code into a file and save it as flickr_combined.js. You can, of course, call it something different but the remainder of this example will refer to it by this name. If you choose a different name, make sure to change all the references appropriately.<script> tag to load flickr_combined.js and everything should work as before. If you want to try this, go ahead but remember to remove the script tag afterwards. We won't be using flickr_combined.js directly.goog.require statements to our JavaScript file. Let's go ahead and do that now. Add the following at the top of your flickr_combined.js file:goog.require('ol.Feature');
goog.require('ol.geom.Point');
goog.require('ol.interaction.Select');
goog.require('ol.layer.Tile');
goog.require('ol.layer.Vector');
goog.require('ol.Map');
goog.require('ol.proj');
goog.require('ol.source.OSM');
goog.require('ol.source.Vector');
goog.require('ol.style.Icon');
goog.require('ol.View');If you are using the ol-debug.js build of OpenLayers, then this change will continue to work. If you are using ol.js, however, it will not work as the goog namespace is not exported in the optimized build of OpenLayers.
The OpenLayers build tool runs inside the OpenLayers directory. The easiest way for OpenLayers to find your code is to copy it into the ol3 directory. Go ahead and copy flickr_combined.js into the ol3/build directory now.
flickr_combined.json file within the ol3/build directory and give it the following content. We'll go over the parts of this file afterwards:{
"exports": [],
"src": ["src/**/*.js", "build/flickr_combined.js "],
"compile": {
"externs": [
"externs/closure-compiler.js",
"externs/geojson.js",
"externs/jquery-1.7.js",
"externs/oli.js",
"externs/olx.js",
"externs/proj4js.js",
"externs/vbarray.js"
],
"define": [
"goog.dom.ASSUME_STANDARDS_MODE=true",
"goog.DEBUG=false"
],
"jscomp_error": [
"accessControls",
"ambiguousFunctionDecl",
"checkEventfulObjectDisposal",
"checkRegExp",
"checkStructDictInheritance",
"checkTypes",
"checkVars",
"const",
"constantProperty",
"deprecated",
"duplicateMessage",
"es3",
"es5Strict",
"externsValidation",
"fileoverviewTags",
"globalThis",
"internetExplorerChecks",
"invalidCasts",
"misplacedTypeAnnotation",
"missingGetCssName",
"missingProperties",
"missingProvide",
"missingRequire",
"missingReturn",
"newCheckTypes",
"nonStandardJsDocs",
"suspiciousCode",
"strictModuleDepCheck",
"typeInvalidation",
"undefinedNames",
"undefinedVars",
"unknownDefines",
"uselessCode",
"visibility"
],
"extra_annotation_name": [
"api", "observable"
],
"compilation_level": "ADVANCED",
"output_wrapper": "// OpenLayers 3. See http://ol3.js.org/\n(function(){%output%})();",
"use_types_for_optimization": true,
"manage_closure_dependencies": true
}
}ol3 directory. Execute the following command:node tasks/build.js build/flickr_combined.json build/flickr_combined.built.jsgit status
flickr_combined.built.js back into the working directory of your application code.<script> tag that loads the ol-debug.js script to point to the new JavaScript file, for instance:<script src="flickr_combined.built.js"></script>
We created a custom build of OpenLayers combined with our application code using the provided build tools. We'll review the steps but first, let's take a look at the resulting file sizes:
|
Files Used |
Net Size | |
|---|---|---|
|
Before (debug build) |
|
3.3 MB |
|
Before (optimized build) |
|
385.7 KB |
|
After |
|
153 KB |
As you can see, our final built file is less than half the size of the full OpenLayers build. Okay, now let's review how we did it.
For the OpenLayers build tools to work, they need our application's JavaScript and a configuration file. We first extracted the JavaScript from our HTML into a separate file, then added some extra lines of code to help the Closure compiler understand what parts of OpenLayers we use by adding goog.require statements. Figuring out what you are using from OpenLayers can be a bit tricky in larger applications, but using searching for ol. (that's ol followed by a period) will identify the correct things.
The next step, was to create a configuration file for the build tool. This configuration file is written in the JSON format, which looks a lot like JavaScript. The configuration file has several parts to it:
exports: This identifies specific objects and methods in the OpenLayers library that should not be renamed when creating an optimized build. We'll see how this works in the next example, but for this example, we left it empty because we are combining our application code with OpenLayers.src: This identifies all the source JavaScript files that the compiler should consider when creating the optimized build. We say consider because not all the code will be included in the output. In our configuration file, we can specify the path to the OpenLayers source files (src/**/*.js) and our application file (build/flickr_combined.js).compile: This contains directives specific to the Closure compiler. Modifying this section requires advanced knowledge of the Closure compiler and we won't be covering it in this book. It is normally sufficient just to copy this section to each new configuration file that you create. The one exception is the externs array. The externs array identifies files that contain type hints for the closure compiler. If you are using a third-party library in your application code, you will need to provide an externs file for that library to prevent the compiler from renaming function and property names in your code. For instance, we are using jQuery with our application and have included the jQuery-1.7.js externs file provided with OpenLayers. Externs for other libraries can be found at https://github.com/google/closure-compiler/tree/master/contrib/externs.With our application code prepared and a configuration file, we then run the command-line build tool providing it the name of the configuration file and the name of the JavaScript file to create:
node tasks/build.js build/flicker_combined.json build/flickr_combined.built.js
We then copied the resulting file, flickr_combined.built.js, back into our application folder and updated the script tag to load this file instead of ol-debug.js. The net result is an impressive drop in file size and the elimination of one JavaScript file to load.
In large applications, it is not uncommon to have your JavaScript code separated out into different files based on some logical breakdown of the code. OpenLayers, for instance, has 330 separate JavaScript files. When you have a lot of different files, the net effect of combining them all into a single file is much more apparent to the user.
While the combined build creates a single JavaScript file that contains both OpenLayers library code and your application code, a separate build creates a single JavaScript file that contains just the OpenLayers code required by your application. The main difference with this approach is that we will not use goog.require to tell the compiler what parts of OpenLayers we want to use. Instead, we will use the exports property of the configuration file. The other difference, is that we will not include our application source file in the src configuration.
Unlike before, we don't need to move our application code into a separate file. Unless you kept a copy of the application from before the previous example, however, we'll need to fix up our HTML file a little bit for this example. This example assumes you are starting with the previous example:
flickr_combined.js and call it flickr_separate.js. As always, you may use a different name but make sure it is consistent! You might also want to make a copy of your HTML file and use it for the rest of this example.flickr_separate.js and remove all the goog.require statements from the beginning of the file.<script> tag to load flickr_separate.js after the <script> tag that loads the combined build file:<script src="flickr_separate.js"></script>
flickr_separate.json in the OpenLayers build directory. Give it the following content:{
"exports": ["ol.Map",
"ol.Map#*",
"ol.View",
"ol.animation.*",
"ol.control.*",
"ol.layer.Tile",
"ol.proj.*",
"ol.source.OSM",
"ol.source.Vector",
"ol.source.Vector#getFeatures",
"ol.source.Vector#addFeature",
"ol.source.Vector#removeFeature",
"ol.layer.Vector",
"ol.interaction.Select",
"ol.interaction.Select#getFeatures",
"ol.interaction.Select#on",
"ol.Observable#on",
"ol.Feature",
"ol.Feature#get",
"ol.Feature#set",
"ol.geom.Point",
"ol.style.Style",
"ol.style.Fill",
"ol.style.Stroke",
"ol.style.Circle",
"ol.style.Text",
"ol.style.Icon"
],
"src": ["src/**/*.js"],
"compile": {
"externs": [
"externs/bingmaps.js",
"externs/bootstrap.js",
"externs/closure-compiler.js",
"externs/example.js",
"externs/geojson.js",
"externs/jquery-1.7.js",
"externs/oli.js",
"externs/olx.js",
"externs/proj4js.js",
"externs/tilejson.js",
"externs/topojson.js",
"externs/vbarray.js"
],
"define": [
"goog.dom.ASSUME_STANDARDS_MODE=true",
"goog.DEBUG=false"
],
"jscomp_error": [
"accessControls",
"ambiguousFunctionDecl",
"checkEventfulObjectDisposal",
"checkRegExp",
"checkStructDictInheritance",
"checkTypes",
"checkVars",
"const",
"constantProperty",
"deprecated",
"duplicateMessage",
"es3",
"externsValidation",
"fileoverviewTags",
"globalThis",
"internetExplorerChecks",
"invalidCasts",
"misplacedTypeAnnotation",
"missingGetCssName",
"missingProperties",
"missingProvide",
"missingRequire",
"missingReturn",
"newCheckTypes",
"nonStandardJsDocs",
"suspiciousCode",
"strictModuleDepCheck",
"typeInvalidation",
"undefinedNames",
"undefinedVars",
"unknownDefines",
"uselessCode",
"visibility"
],
"extra_annotation_name": [
"api", "observable"
],
"jscomp_off": [
"es5Strict"
],
"compilation_level": "ADVANCED",
"output_wrapper": "// OpenLayers 3. See http://ol3.js.org/\n(function(){%output%})();",
"use_types_for_optimization": true,
"manage_closure_dependencies": true
}
}ol3 directory, as we did before:node tasks/build.js build/flickr_separate.json build/flickr_separate.ol.js
flickr_separate.ol.js back to your application folder next to flickr_separate.js.flickr_combined.js to point to this new file:<script src="flickr_separate.ol.js"></script>
We just created a custom build of the OpenLayers library that contains only the code we need, and which exports only the things we actually use. The resulting library is a little bit larger—177.5 KB vs 156.5 KB—because the compiler is preserving the names of the objects, functions, and properties that we have exported. Let's review these steps.
First, we adapted our previous example and modified a copy of our application code to remove the goog.require statements. Those won't be needed for the compiler, and in fact, won't work with our custom build because the goog namespace is not exported.
Next, we created a new configuration file for the compiler. You probably noticed that it's nearly identical to the one from the previous example. In fact, there are two differences and they are very important. First, we removed our application source from the build by removing it from the src property. Second, we explicitly listed the names of objects and functions we want exported in the exports section.
Populating exports is really the trickiest part of creating a separate build. As with the combined build, a search of your code for ol. will identify all the main classes that you are referencing and these can be included directly in the exports array. However, exporting a class does not automatically export any of its properties or methods. We also need to know what methods we call on all objects that are exported. In some cases, we don't actually call any methods on the objects we created, but in other cases, we do. Finding these methods is a bit more time consuming as it requires manually reading the code.
When adding a method name to the exports list, we write it with the object name first, a # symbol, and then the method name, for instance see the following:
ol.Map#getSize
It is also possible to export all methods of an object by using * instead of a method name after the # symbol. While this is quick and easy, it will produce much larger builds than necessary in most cases.
You've reached the end of the book! In this chapter, we built a simple web map application that grabs Flickr data based on user input. We covered some development concepts throughout the chapter, such as attempting to keep our code modular. We learned how to interact with other third-party APIs, and built an application from the ground up. Lastly, we talked about deployment and learned how to use the OpenLayers build script. Now that you've finished reading this book (I hope you've enjoyed it), you should be able to go out and make your own impressive web maps!
When you need to make a custom map using the OpenLayers 3 library, you need to grasp the common programming sentences and vocabularies.
Why? It's because OpenLayers relies on JavaScript, a programming language based on object-oriented programming (OOP). Knowledge about OOP is shared amongst programmers. Without this knowledge, it will be difficult to talk about programming issues, for example, on a forum.
We will see that behind complex words lie simple concepts. In fact, everyone uses OOP concepts on a daily basis but without being aware of it.
In this appendix, we will cover:
Let's talk about how object-oriented programming works from a theoretical and technical level.
Object-oriented programming is a programming paradigm. It added a new way to manage code by using the concept of object as opposed to procedural programming where code follow the reading order. By using OOP, you gain reusability of code. The main gain is related to encapsulation or separation of concern. Each object has his own life.
To understand object orientation, let's take a simple example—animals. Your cat is a class. If you have four cats, you have four objects of type cat. Each of them has different properties name, age and sex values. A cat can move. In OOP terms, move is a method of the class cat.
Let's review some questions that can help you understand keywords and concepts we will implicitly use.
An object can be considered a thing that can perform actions and has properties. The action defines the object's behavior. For instance, the cat can jump. Your cat's age is eight so the property value is 8.
In pure OOP terms, an object is an instance of a class.
In an OpenLayers context, imagine you want a side-by-side map where you prepared a div with id attribute equal to map1 and another one for the id attribute with the value map2. You will use the JavaScript new operator to declare two instances of the ol.Map class like following:
var map1 = new ol.Map({ target: 'map1'});
var map2 = new ol.Map({ target: 'map2'});An instance means that each object based on the class has it own properties values.
In our example, the target property is different for the map1 and map2 objects.
A class can be considered as an extensible program-code-template.
When you already know OOP, you use the word class to declare it but in JavaScript, the class is known as a function. Also, functions are used as constructors.
The following excerpt from OpenLayers illustrates how a class looks:
ol.Map = function(options) {
}We also recommend you inspect the full ol.Map class at http://openlayers.org/en/v3.0.0/apidoc/map.js.html after reviewing the following information box to discover on your own the class methods and properties.
We will abusively use classes to describe object-oriented programming but the truth is that JavaScript is based on prototypes and not classes. We chose to simplify the explanation as more people understand OOP based on classes. The main goal is to explain inheritance in particular. To learn the difference. we recommend going to https://developer.mozilla.org/en-US/docs/Web/JavaScript/Guide/Details_of_the_Object_Model for more.
To instantiate an object, you need to use the new keyword on a JavaScript function.
For example, when using new ol.Map(), the function ol.Map is called the constructor. It's the function you use with the new keyword to create an object. You can give options to the constructor.
There are other ways to create an object but to keep thing simple, we chose to restrict our explanation to the most common way when using the OpenLayers library. If you want to go further, go to https://developer.mozilla.org/en-US/docs/Web/JavaScript/Guide/Working_with_Objects.
Inheritance is the ability of a new class to be created, from an existing class by extending it. With this, you use the DRY (Don't repeat Yourself) principle. For example, you can reuse method or properties from a parent class. Don't sweat, it's time to explain!
Imagine after describing your cat, you also want to describe your dog in OOP.
Cats and dogs are not the same but they share some characteristics like their name, their sex or their age or they ability to move. However, a cat can jump from windows whereas a dog can't. We don't want to maintain two classes because they have common properties. You can achieve this by using a new class called animal. It can be represented like the following diagram:
In your code, instead of declaring every common property and method twice, you declare that your Cat class inherits from the Animal class, so you can reuse properties and methods from the parent class. Cat and Dog are subclasses of the Animal class. You can also says that the Cat class extends the Animal class.
Why do you think it's useful to review this abstract concept?
It's because you need to figure out the relations between OpenLayers 3 library components. The library heavily uses inheritance and for creating your own components, it's a requirement.
It's a class you use to define properties for other class that need to inherit it properties and / or methods but you never directly instantiate this class. The animal can be considered as an abstract class. However, in OpenLayers, the ol.source.XYZ isn't an abstract class, although ol.source.OSM is its child class.
Namespace helps you to organize your code by grouping it logically, and also by separating variables from the global.
You can declare a namespace with something like below:
var app = {
main: ""
}or
var app = {};
app.main = {};The ol.* classes in the API documentation illustrate the namespace purpose http://openlayers.org/en/v3.0.0/apidoc/.
Methods are actions you can use within the object. Getters and setters are special types of methods. A setter's purpose is to set property within the object, whereas a getter is to get property from the object.
In OpenLayers, most classes inherit from the ol.Object class. This class is fundamental for using setters and getters within the library. The excerpt from the official documentation is quite clear about them:
"Classes that inherit from this have predefined properties, to which you can add your own. The pre-defined properties are listed in this documentation as Observable Properties, and have their own accessors; for example,
ol.Maphas atargetproperty, accessed withgetTarget()and changed withsetTarget(). However, not all properties are settable. There are also general-purpose accessors,get()andset(). For example,get('target')is equivalent togetTarget()."
Let's have a look at the API and understand how it uses the OOP concepts.
After reviewing the most important principles, let's inspect the API to sort out how to analyze it with OOP concepts.
For this, we will reuse the ol.source.XYZ API documentation, http://openlayers.org/en/v3.0.0/apidoc/ol.source.XYZ.html. First, let's start with the content on top of the page.
The illustration above is self-explanatory. You should follow the link for the constructor function, the subclasses to inspect properties, and methods subclasses inherits and discover provided properties and methods from ol.source.TileImage.
Using the following screenshot, you will be able understand inheritance:
Looking at the screenshot, we are able to figure out most of the inheritance. We deduced the exact class inheritance by hovering over the inherited keyword with the mouse to see the URL that gives us a hint about it.
Within the previous screenshot, for readability, we had to remove the full ol.source.XYZ class description. If we include and follow all the available methods, the relationships between ol.source.XYZ class methods and properties and their parent and child classes, the result will be as follows:
For a more complete abstract about object-oriented programming, check out https://en.wikipedia.org/wiki/Object-oriented_programming.
For a review concerning JavaScript object-oriented programming, head on to https://developer.mozilla.org/en-US/docs/Web/JavaScript/Introduction_to_Object-Oriented_JavaScript.
Closure Tools are a set of utilities used for web development. It is mainly supported by Google, but is open source under the Apache License Version 2.0, a well-established permissive license. The name Closure Tools hides under it a lot of subtools, which will make your life as an apprentice developer easier. It includes a JavaScript optimizer, a JavaScript library, a templating library, a style checker and style fixer, and at last, a stylesheet language. Just to illustrate how powerful this set can be, think that most Google JavaScript applications, such as Gmail or Google Maps, use these components.
Why are we introducing you to these tools?
The OpenLayers 3 library itself depends on the Closure Library, the JavaScript library attached to Closure Tools. Its main goal is to leverage cross-browser support. You also know you can write your application in pure JavaScript.
However, you can also consider Closure for advanced uses like creating your own component such as controls and buttons with special behavior inherited from an existing OpenLayers component. You will also get some useful UI components. It is also a good toolset to achieve better file compression when you want an efficient web mapping application, using the Closure Compiler, another utility from the Closure Tools bundle.
We will not review all Closure Tools but only the most useful. Specifically, we will cover the following topics:
If you have ever done a bit of web development, and in particular, JavaScript, you must have heard about jQuery, the most popular JavaScript library with more than 50 percent of the worldwide websites using it. To not reinvent the wheel, the OpenLayers development team chose Closure Library rather than jQuery. Why was this decision made? For a better understanding, you need a bit of history of the Web.
In the olden days, there wasn't a lot of JavaScript. All applications were created using simple HTML and CSS. There was dynamic content when reloading a full page using a server-side such as PHP or Java. However, people wanted a smoother web navigation experience. With the way AJAX works it was possible, as illustrated in the following figure, and people began to focus more and more on the client-side:
The main two problems associated with this evolution are:
When you are at home, you don't really suffer from bandwidth restriction, but in other cases, you will always suffer from high latency. If you are planning to work on mobile support with limited bandwidth, high latency, and a browser with limited memory, it can be a pain.
A good part of the solution lies in compression.
You have three levels of compression available for JavaScript, depending on technology:
For performance, the last method will work the best, and the Closure Library is the only JavaScript library able to work this way, when combined with Closure Compiler.
Closure Tools, in particular, Closure Library and Closure Compiler are among the best tools to deal with this case.
Although both tools are tightly related, we will review the most useful functions related to Google Closure Library and later explain how to use Closure Compiler to optimize code.
Although we can download the library on our computer, to remain simple, we will use a remote JavaScript library version.
<!DOCTYPE html>
<html>
<head>
<title>Dom manipulation</title>
<script src='https://rawgit.com/google/closure-library/master/closure/goog/base.js'></script>
<script>
goog.require('goog.dom');
</script>
</head>
<body>
<ul id="my_layers_list">
<li>My first layer</li>
<li>My second layer</li>
<li>My third layer</li>
<li>My background or base layer</li>
</ul>
<script>
var my_layers_list = goog.dom.getElement('my_layers_list');
var myTitle = goog.dom.createDom('h1');
var myText = goog.dom.createTextNode("My simple layers list");
goog.dom.append(myTitle, myText);
goog.dom.insertSiblingBefore(myTitle, my_layers_list);
</script>
</body>
</html>In order to understand the code, let's review the lines related to the Google Library:
<script src='https://rawgit.com/google/closure-library/master/closure/goog/base.js'> </script>
Load the library base from a remote file. The code hosted on Github, needs to use a third-party website https://rawgit.com to be able to serve the .js files:
goog.require('goog.dom'); This line is the way to say make available the function from goog.dom namespace of the library. If you forget this call, every function call starting with goog.dom will fail. This call adds a call to <script src='https://rawgit.com/google/closure-library/master/closure/goog/base.js'> and must be separated in a dedicated <script> tag.
The goal here is to load only required functions and to keep your JavaScript clean with namespacing. Namespace enables separation of functions based on a common name. The chosen namespace for the Google Library is goog, so every function based on the library will start with goog. In this case, the goog.dom namespace is created. To discover the available functions in the namespace, you can use your JavaScript debugger and type goog.dom var my_layers_list = goog.dom.getElement('my_layers_list');. This line selects from DOM the element with an attribute ID, 'my_layer_lists'.
var myTitle = goog.dom.createDom('h1'); creates an <h1> tag in an HTML fragment, an element separated from the DOM, which you plan to add later to the web page DOM:
var myText = goog.dom.createTextNode("My simple layers list");The following code line adds a text node, the visible element in HTML you will see in a web page.
goog.dom.append(myTitle, myText);
Add the text node to the <h1> tag. That is, the two previous floating elements <h1> </h1> and My simple layers list became: <h1>My simple layers list</h1>
goog.dom.insertSiblingBefore(myTitle, my_layers_list);
Add the combined fragment to the DOM: it will be visible in your browser. We choose to use the insertSiblingBefore method. Its purpose is to add a fragment in the DOM before a reference DOM element. So, the text with <h1> tags will appear before the list.
With this example, we have reviewed a small subset of the goog.dom functions.
You will need them, for example, for interactivity like displaying an element with a color change, or for having an application that reacts to a click of a button.
Google library is an ever evolving JavaScript library
In a real context, outside experimentations such as the first Closure Library code example, you will need to retrieve it using an SCM (Source Code Management) software. Its goal is to follow every change in the code. It is one of the most useful tools for developers. The one you need is called Git. Don't worry about it at the moment, we will need it in the Installing the OpenLayers development environment section. For now, just remember the URL to get the code from https://github.com/google/closure-library
To give you an overview of the most useful functions, we have mentioned below some statistics on the most used namespaces and sub-namespaces' functions in the OpenLayers 3 library. We also chose to keep the functions at the first level such as goog.require(. You can make the distinction between functions and namespaces with the open parenthesis. We also ordered the list in the following table:
|
Namespace and sub-namespaces |
Numbers of occurrences |
|---|---|
|
|
1436 |
|
|
812 |
|
|
765 |
|
|
349 |
|
|
295 |
|
|
289 |
|
|
196 |
|
|
168 |
|
|
136 |
|
|
113 |
|
|
100 |
|
|
81 |
|
|
72 |
|
|
68 |
|
|
39 |
|
|
35 |
|
|
22 |
|
|
21 |
|
|
14 |
|
|
13 |
|
|
12 |
|
|
11 |
|
|
9 |
|
|
5 |
|
|
4 |
|
|
3 |
|
|
2 |
|
|
1 |
Let's talk about goog.require and goog.provide. The Google Library, and hence the OpenLayers internal code, manages dependencies using these two declarations. In a file, goog.require helps declaring required functions needed in the application code, whereas the goog.provide is the opposite: it permits declaring that some functions are within a file. These declarations combined with Closure Compiler usage help solve dependencies between the various library files and also with the application code. Reusing these dependencies will enable combining code for production.
Other important functions are goog.inherits and goog.base: you will find them to apply inheritance concepts already evoked in Appendix A, Object-oriented Programming – Introduction and Concepts.
With previous functions, you might think that some functions not at the top of the list are not useful, but you shouldn't. In fact, we invite you to review them because the code for the core of a JavaScript library differs from the code application to use it. In particular, look at goog.userAgent functions or goog.style.
To have an overview of the available functions, the recommended way is to visit the official website, https://developers.google.com/closure/library/, to review the API, http://docs.closure-library.googlecode.com/git/index.html. For samples, look at the available demos you have to use at https://github.com/google/closure-library/tree/master/closure/goog/demos/. It's a great complementary help to the API, in particular to get an overview of the goog.ui components.
Next, let's head to an example to make your own component using Closure Library.
When a component is not available, you will have to write some application code or for reuse purpose, make your own. In this section, we will first review some of the concepts of JavaScript applied with Google Closure Library. After this, we will see one of the official sample code to understand how to use the library to create your own customized component.
Let's start with the inheritance. It should ring a bell; otherwise, you should review Appendix A, Object-oriented Programming – Introduction and Concepts. This example will be enough to introduce you to other key concepts of the library:
<!DOCTYPE html>
<html>
<head>
<title>Inheritance</title>
<script src='https://rawgit.com/google/closure-library/master/closure/goog/base.js'></script>
</head>
<body>
<script>
//Parent Class
goog.provide('myNamespace.layer.Layer');
/**
* @constructor
*/
myNamespace.layer.Layer = function (options) {
this.color_ = options.color || 'grey';
}
myNamespace.layer.Layer.prototype.getColor = function () {
return this.color_;
}
//Sub Class
goog.provide('myNamespace.layer.Vector');
/**
* @constructor
* @extends {myNamespace.layer.Layer}
*/
myNamespace.layer.Vector = function (options) {
goog.base(this, options);
if (options.style) {
this.style_ = options.style;
}
}
goog.inherits(myNamespace.layer.Vector, myNamespace.layer.Layer);
//Create a new instance of Vector layer and call to method from parent class.
var myVector = new myNamespace.layer.Vector({
color: 'white',
style: 'myStyle'
});
console.log(myVector.getColor());
</script>
</body>
</html>Launch it in your browser with the debugger, like Google Developer Tools, opened.
Let's review the code for the main lines:
<script src='http://closure-library.googlecode.com/svn/trunk/closure/goog/base.js'> </script>
This inserts the call to Closure Library:
goog.provide('myNamespace.layer.Layer');This declares the parent namespace (and class) with goog.provide:
/**
* @constructor
*/
myNamespace.layer.Layer = function (options) {
this.color_ = options.color || 'grey';
}This declares the parent constructor:
myNamespace.layer.Layer.prototype.getColor = function () {
return this.color_;
}This adds a method to the prototype of the object:
goog.provide('myNamespace.layer.Vector');This declares the children's namespace (and class) with goog.provide:
/**
* @constructor
* @extends {myNamespace.layer.Layer}
*/
myNamespace.layer.Vector = function (options) {
goog.base(this, options);
if (options.style) {
this.style_ = options.style;
}
}This declares the children's constructor and specifies who the parent is, in comments with @extends.
In the function, goog.base(this, options); can be replaced with myNamespace.layer.Layer.call(this, options); for a pure JavaScript alternative. It says to call the options from the current constructor:
goog.inherits(myNamespace.layer.Vector, myNamespace.layer.Layer);
This makes myNamespace.layer.Vector inherit from its parent myNamespace.layer.Layer.
var myVector = new myNamespace.layer.Vector({
color: 'white',
style: 'myStyle'
});
console.log(myVector.getColor());This instantiates myNamespace.layer.Vector with options and makes a console call to get the method call to the parent class in order to retrieve the color.
Until now, we mainly covered Closure Library, but this knowledge can be reused in OpenLayers. You will see that OpenLayers application code can really look like Closure Library.
To see the similarity between Closure Library and OpenLayers application code, we will review inheritance in a real OpenLayers context. So, we will ask you to review an official example available at http://openlayers.org/en/v3.0.0/examples/custom-controls.html.
It will also be a good opportunity to review inheritance knowledge from Chapter 2, Key Concepts in OpenLayers; Chapter 9, Taking Control of Controls and Appendix A, Object-oriented Programming – Introduction and Concepts.
This example contains the following JavaScript content:
/**
* Define a namespace for the application.
*/
window.app = {};
var app = window.app;
//
// Define rotate to north control.
//
/**
* @constructor
* @extends {ol.control.Control}
* @param {Object=} opt_options Control options.
*/
app.RotateNorthControl = function(opt_options) {
var options = opt_options || {};
var anchor = document.createElement('a');
anchor.href = '#rotate-north';
anchor.innerHTML = 'N';
var this_ = this;
var handleRotateNorth = function(e) {
// prevent #rotate-north anchor from getting appended to the url
e.preventDefault();
this_.getMap().getView().setRotation(0);
};
anchor.addEventListener('click', handleRotateNorth, false);
anchor.addEventListener('touchstart', handleRotateNorth, false);
var element = document.createElement('div');
element.className = 'rotate-north ol-unselectable';
element.appendChild(anchor);
ol.control.Control.call(this, {
element: element,
target: options.target
});
};
ol.inherits(app.RotateNorthControl, ol.control.Control);
//
// Create map, giving it a rotate to north control.
//
var map = new ol.Map({
controls: ol.control.defaults({
attributionOptions: /** @type {olx.control.AttributionOptions} */ ({
collapsible: false
})
}).extend([
new app.RotateNorthControl()
]),
layers: [
new ol.layer.Tile({
source: new ol.source.OSM()
})
],
renderer: exampleNS.getRendererFromQueryString(),
target: 'map',
view: new ol.View({
center: [0, 0],
zoom: 2,
rotation: 1
})
});These questions are for improvement:
RotateNorthControl component?ol.inherits is an alias to goog.inherits)?Until now, we focused on Closure Library. However, as we mentioned at the start of this chapter, for performance, we need to use Closure Compiler as well. It is time to do it!
The more we can learn without installing tools the better it is to lower the learning entry. So, we will use the Closure Compiler online tool. Go to the official URL, http://closure-compiler.appspot.com and you will get the following screenshot:
To display the ability of the Closure Compiler to compress files, we will ask you to try it online. Perform the following actions:
// ADD YOUR CODE HERE section in the left-hand text area.The results you get from your experiment are as follows:
|
Compression level |
Original size |
Original gzipped size |
Save percentage |
Compiled size |
Compiled gzipped size |
Save gzipped percentage |
|---|---|---|---|---|---|---|
|
WHITESPACE |
940 bytes |
391 bytes |
45.21% |
515 bytes |
238 bytes |
39.13% |
|
SIMPLE |
940 bytes |
391 bytes |
52.77% |
444 bytes |
224 bytes |
42.71% |
|
ADVANCED |
940 bytes |
391 bytes |
85.74% |
160 bytes |
141 bytes |
66.75% |
Let's take a look at the results of the different optimizations mode to compare:
goog.provide("myNamespace.layer.Layer");myNamespace.layer.Layer=function(options){this.color_=options.color||"grey"};myNamespace.layer.Layer.prototype.getColor=function(){return this.color_};goog.provide("myNamespace.layer.Vector");myNamespace.layer.Vector=function(options){goog.base(this,options);if(options.style)this.style_=options.style};goog.inherits(myNamespace.layer.Vector,myNamespace.layer.Layer);var myVector=new myNamespace.layer.Vector({color:"white",style:"myStyle"});console.log(myVector.getColor());As you can see, everything is preserved. You only made the code compact by removing white space.
var myNamespace={layer:{}};myNamespace.layer.Layer=function(a){this.color_=a.color||"grey"};myNamespace.layer.Layer.prototype.getColor=function(){return this.color_};myNamespace.layer.Vector=function(a){myNamespace.layer.Layer.call(this,a);a.style&&(this.style_=a.style)};goog.inherits(myNamespace.layer.Vector,myNamespace.layer.Layer);var myVector=new myNamespace.layer.Vector({color:"white",style:"myStyle"});console.log(myVector.getColor());As you can see the compiler has done a substituting job by replacing all the goog functions. The only remaining namespaced function is goog.inherits. The function arguments are also renamed. It remains quite readable. If you replace the JavaScript from the example with this one, you can always call in your console the function with their original names.
function b(a){this.a=a.color||"grey"}function c(a){b.call(this,a);a.style&&(this.c=a.style)}goog.b(c,b);console.log((new c({color:"white",style:"myStyle"})).a);As you can see in this case, most of the code is renamed. The code in itself will have the same behavior but you can't call it with the original functions you wrote.
The ADVANCED way of doing it is the more efficient way to compress, but it requires extra work as compared to the SIMPLE mode. In particular, you need to add extra comments to be able to run the compiler. We gave you a working example, but removed the text @constructor on the sample code and run again the ADVANCED mode and observe. Because of this mode when you are using foreign code such as an external library, you have to mention preserve this code from renaming. For this, you have to declare what we call externs. If you don't have available externs with the library you are using, your code will fail to execute correctly.
Do not worry at the moment! The OpenLayers tools we will review already support jQuery externs, for example. We recommend that you go to the dedicated web pages from Google because it's an advanced feature (https://developers.google.com/closure/compiler/docs/api-tutorial3) and because we will review later how to solve it in the OpenLayers 3 context. You can also solve the problem using only the SIMPLE mode but you will lose a part of the gain of Closure Tools.
We will now see the application of what we learned so far in OpenLayers.
When you choose to release your application online and you need performance for your web mapping applications, you need to perform certain steps.
Closure Compiler enables you to do so at the JavaScript level. In the OpenLayers project, some tools facilitate the use of Closure Compiler.
These tools, such as Closure Compiler, depend on three languages: Python, Java, and Node. We will quickly review the install process to run it.
We will review how to install the environment on the different operating systems. We will start with Python. Then, we will install NodeJS. Next, we will do a Java installation and we will end with other tools such as Git installing.
Closure Compiler requires 2.x series of Python. You can install it using the following instructions for Microsoft Windows and Linux. For Mac OSX, Python is already bundled.
Go to http://www.python.org/downloads/ and follow these steps:
Click on the link referring to the latest Python 2.x series (2.7.9 at writing time). Next, click Download on the Windows x86 MSI Installer or Windows X86-64 MSI Installer, depending of your Microsoft Windows architecture.
;C:\Python27;C:\Python27\Scripts.You need to open a command line as superuser:
On a RedHat-based OS:
yum install python python-setuptools
On Ubuntu/Debian OS:
apt-get install python python-setuptools
On every OS, open a command line (for MS-DOS, go to open Command Prompt or Bash for Linux/Mac OSX) and type:
python –-version
It will echo something such as Python 2.7.5.
For all OS, you must install pip, a packet manager for Python.
Download it at https://bootstrap.pypa.io/get-pip.py and then execute the following code line:
python get-pip.py
It's quite easy. We will not rely on external packages but only official binaries. Check out the official website at http://nodejs.org/download/.
Just download the binary, and then execute the installer. Nowadays, except if you have an old Windows XP, you should download the 64 bit Windows Installer (.msi).
Instructions are for both RedHat-based OS and Ubuntu/Debian OS.
su or by adding sudo:
mkdir /opt/node && chmod -R 777 /opt/node/
/opt/node directory.~/.profile file the following:
export PATH=$PATH:/opt/node/bin
We have assumed you started from scratch. You may already have Java installed. Mostly, it will be the JRE (Java Runtime Environment). JRE is enough to execute Java, but we can also use the developer-oriented JDK (Java Development Kit).
Before downloading a new JRE, try to see if you already have Java installed. For this, open a command prompt and type the following:
java -version
If the feedback is not something like java version "1.7.0_xx", you should consider installing the JRE. The returned version must be 1.7.0_xx (xx is the exact version) and it should not be 1.6.0_xx or 1.8.0.xx. At the writing time, the version was 1.7.0_72.
Independent of the OS, head to http://www.oracle.com/technetwork/java/javase/downloads for downloading the file you require to have Java JRE (Java Runtime Environment).
As there are many links, you will find the following screenshot with the mouse indicating the link to follow:
After download, run the installer and set the PATH, as for Python.
Here, you will need to add a new system environment variable called JAVA_HOME with the value C:\Program Files\Java\jrexxx or C:\Program Files(x86)\Java\jrexxx, depending on your architecture (32 or 64 bit). You will follow the same recipe described to change PATH in Python but instead of editing an existing variable, you will add it.
After, add at the end of the PATH environment ;%JAVA_HOME%\bin.
On a RedHat-based OS:
Retrieve the RPM from the URL retrieved by following the screenshot JRE Download button and perform the following command as superuser (depending on your java version):
rpm -ivh jre-7u72-linux-x64.rpm
On an Ubuntu/Debian OS, get the tar.gz Linux file instead of the RPM file:
tar xvzf jre-7u72-linux-x64.tar.gz mv jre1.7.0_72 /opt/ && chmod -R 777 /opt/jre1.7.0_72
In ~/.profile, add the following content at the end of the file:
export JAVA_HOME=/opt/jre1.7.0_72 export PATH=$PATH:$JAVA_HOME/bin
In the information box about Closure Library, we mentioned an SCM called Git. Now, it's time for installation. Let's see how it works on a different OS.
Head to the msysGit project, https://msysgit.github.io, download the installer by clicking on the Download link and execute it.
After installation, add to the PATH, as for Python, the string; C:\msysgit\bin\;C:\msysgit\bin\mingw\bin
yum install git-core
On an Ubuntu/Debian OS:
apt-get install gitMac OSX
Go to the Mac installer website, http://code.google.com/p/git-osx-installer, and install it.
Now that you have Git, you can install other tools.
Now, everything is ready! So, let's start to use the Closure Compiler to better understand how to optimize your code to display faster maps. We will review how to use the OpenLayers development workflow to make your custom application.
We will inspect reusing the workflow for developing the OpenLayers core library to run the official examples. For this purpose, start with the following step:
git clone https://github.com/openlayers/ol3.git cd ol3 git checkout v3.0.0
npm install sudo pip install -r requirements.txt
build.cmd checkdeps or ./build.py checkdeps on Linux / Mac OSX. It will return if dependencies are solved to proceed to the next step.build.cmd build.cmd host-examples build.cmd serve
./build.py ./build.py host-examples ./build.py serve
You may need an offline API, if for example, you're working in public transportation or without a network connection. To generate it, execute the ./build.py apidoc or build.cmd apidoc. Then, open it with http://localhost:3000/build/hosted/HEAD/apidoc/. You can also get it directly from the v3.0.0.zip file, downloaded from Chapter 1, Getting Started with OpenLayers.
http://localhost:3000/examples/ and open Google Chrome Developers Tools. You will see the examples like the one you get on the official website that follows:http://localhost:3000/build/hosted/HEAD/examples/attributions.html.?mode=whitespace or ?mode=simple, or ?mode=raw.We serve files on a small web server. In the first case, the loader.js file retrieves the dependencies and adds for each required files the script tag with the src attribute. In the second case, we chose to open the hosted files, the ones you get when you browse the official website, http://openlayers.org.
In the second case, depending on the provided values for the mode parameter, we will load different files for the OpenLayers 3 library:
<script> tag. This does not run the Compiler, so no checks are performed.SIMPLE_OPTIMIZATIONS enabled. Without an option in the URL, this loads the JavaScript as compiled with ADVANCED_OPTIMIZATIONS enabled.Hey! These options look familiar, where did we see them?
Remember that we had mentioned to you that OpenLayers tools are using Closure Compiler. Let's see how OpenLayers takes benefits from it.
When you changed examples with the raw mode, you may have noticed (in particular by filtering the script in the Network panel) that the loaded files number greatly differs from the URL without it. What can make this difference? Let's see some practical uses to understand.
We waited until now to review the removal of the unused code feature related to Google Closure Compiler.
As we already said, when you switch between examples, you load different files. How does it work?
Open your browser Network panel. Open the URL for one of the official examples and add ?mode=raw.
Then, in the console, type console.log(paths.length);.
Just compare the length between the examples. If your example in the URL is animation.html, inspect also the animation-require.js files, you will see that there are some lines beginning with goog.require('...'). The loader gets the name from the file via loader?id=examplename, and with the goog.require indications from examplename-require.js, Closure Compiler generates the list of files to load for the example.
When Compiler does not find the required goog.require statements, it excludes the files and the resulting build file is smaller. On mobile applications, it is invaluable. Just be careful to not break your application, for example, if you forget to add a statement.
When you run ./build.py or build.cmd, you have something such as 2014-12-10 18:41:23,358 build/ol.js: node tasks/build.js config/ol.json build/ol.js. We will reuse the beginning command to compile the ol.js file again and play with the Closure Compiler builder included in the OpenLayers 3 toolkit. The ol.json file is used to provide parameters to Closure Compiler to make the build and ol.js is the output result.
To build, you have two choices:
.js lightened buildAt the moment, you have a shared JSON file for all examples in config/examples-all.json. We will reuse it.
We will reuse the animation sample, from the local OpenLayers installation, to try out both ways of building code:
animation.html and animation.js files from the examples folder into animation-exports.html and animation-exports.js.config/ol-animation-exports.json inspired by the config/examples-all.json with the following content:{
"exports": ["ol.Map",
"ol.Map#*",
"ol.View",
"ol.animation.*",
"ol.control.*",
"ol.layer.Tile",
"ol.proj.*",
"ol.source.OSM"
],
"src": ["src/**/*.js"],
"compile": {
"externs": [
"externs/bingmaps.js",
"externs/bootstrap.js",
"externs/closure-compiler.js",
"externs/example.js",
"externs/geojson.js",
"externs/jquery-1.7.js",
"externs/oli.js",
"externs/olx.js",
"externs/proj4js.js",
"externs/tilejson.js",
"externs/topojson.js",
"externs/vbarray.js"
],
"define": [
"goog.dom.ASSUME_STANDARDS_MODE=true",
"goog.DEBUG=false"
],
"jscomp_error": [
"accessControls",
"ambiguousFunctionDecl",
"checkEventfulObjectDisposal",
"checkRegExp",
"checkStructDictInheritance",
"checkTypes",
"checkVars",
"const",
"constantProperty",
"deprecated",
"duplicateMessage",
"es3",
"externsValidation",
"fileoverviewTags",
"globalThis",
"internetExplorerChecks",
"invalidCasts",
"misplacedTypeAnnotation",
"missingGetCssName",
"missingProperties",
"missingProvide",
"missingRequire",
"missingReturn",
"newCheckTypes",
"nonStandardJsDocs",
"suspiciousCode",
"strictModuleDepCheck",
"typeInvalidation",
"undefinedNames",
"undefinedVars",
"unknownDefines",
"uselessCode",
"visibility"
],
"extra_annotation_name": [
"api", "observable"
],
"jscomp_off": [
"es5Strict"
],
"compilation_level": "ADVANCED",
"output_wrapper": "// OpenLayers 3. See http://ol3.js.org/\n(function(){%output%})();",
"use_types_for_optimization": true
}
}animation-exports.js file, remove the goog.require statements.animation-exports.html, change the script src attribute from loader.js?id=animation to ../build/ol-animation-exports.js and add a new script reference with <script src="animation-exports.js"></script>.ol-animation-exports.js file from the root ol3 folder using the following command:
node tasks/build.js config/ol-animation-exports.json build/ol-animation-exports.js
./build.py serve or build.cmd serve and open your browser at http://localhost:3000/examples/animation-exports.html.animation.html and animation.js from the examples folder into animation-combined.html and animation-combined.js.<script src="jquery.min.js"></script>
<script src="../build/ol-animation-combined.js"></script>config/ol-animation-exports.json into config/ol-animation-combined.json.[] and add at the end of the array, contained in the src value, the .js files declaration to get a result like the following:"src": [
"src/**/*.js",
"examples/animation-combined.js"
]examples/animation-combined.js file the code from resources/example-behaviour.js.externs/example.js, from the config/ol-animation-combined.json file.
node tasks/build.js config/ol-animation-combined.json build/ol-animation-combined.js
http://localhost:3000/examples/animation-exports.htmlUntil now, to facilitate learning, we used code for samples within the HTML. For compressing code, firstly, you need to have all your JavaScript code in a separate .js file.
In the first case, we used exports in the ADVANCED mode. At the functional level, exporting means that you want to stop obfuscating variables, for example, renaming variables and properties to shorter ones. The advantage of this, is that you can use code from outside the library, in a third-party JavaScript file. It can help you, for example, in designing a subset of the OpenLayers 3 library for specific use cases or making your own library based on the OpenLayers 3 and a custom code augmenting the default.
At the code level, to know what we want to export, we reuse the content from goog.require statements in the example. These statements are deduced from the code namespaces and constructors . If you limit yourself to these statements to declare exports, when compiling and executing code, you will get some errors stating undefined in the browser debugger console. Mostly, it means you protect the constructor but you didn't choose some functions to protect. To protect from variable renaming, you will need to use the * character. It's what we have done with ol.Map#* or ol.proj.*.
In the ol.Map#* case, we said that we wanted to protect all functions from ol.Map.prototype to be renamed by using the # character. In the ol.proj.* use case, we just protected the all ol.transform namespace.
For externs, we will not go in to the details of how they work, but you just have to understand that it's a way to protect code from other libraries to be renamed by Closure Compiler by declaring their variables' and functions' signatures.
If we review the other parameters in the first JSON file, the most important ones are:
src: This helps define where your compiler has to search for code when managing dependencies. Those dependencies are declared by declarations in code.compilation_level: This can be set to ADVANCED, WHITESPACE_ONLY, or SIMPLE. We chose to look at the ADVANCED case, because once we have understood how to work with the advanced option, the others can be worked on easily.use_types_for_optimization. In fact, it highlights the importance of comments also known as annotations. We will start by quoting the official Closure Compiler documentation:"The Closure Compiler can use data type information about JavaScript variables to provide enhanced optimization and warnings. JavaScript, however, has no way to declare types. Because JavaScript has no syntax for declaring the type of a variable, you must use comments in the code to specify the data type."
From this, we can deduce that you can use Closure Compiler without always using comments but comments can help you catch errors using variables type checking based on comments (based on a standard called JSDoc).
It's also useful, because when Closure compiler uses the ADVANCED mode, the compiler renames variables to decrease the build size and annotations act as hints for the tool. Moreover, the commenting code is anyways a good practice to maintain code: do not hesitate to use them. Navigate to the official Closure Compiler documentation (https://developers.google.com/closure/compiler/docs/js-for-compiler) to see the exact grammar.
Another good tip related to annotations is the fact that adding an annotation @api (specific to OpenLayers) is the way to export a function when you use OpenLayers 3 default build system.
For instance, you can add @api to ol.Ellipsoid and ol.Ellipsoid.prototype.vincentyDistance in the file src/ol/ellipsoid/ellipsoid.js (for reference, see src/ol/map.js line 160). Then, launch node tasks/build.js config/ol.json build/ol.js and reuse the generated ol.js instead of the usual one. You will see that you can use, in your application code, the following code:
var ellipsoid_wgs84 = new ol.Ellipsoid(6378137, 1/298.257223563); var distance_ol3_vincenty = ellipsoid_wgs84.vincentyDistance([5, 34], [12, 56])
We will not inspect all the other parameters, because it's mostly not required to understand their meanings. If you would like to read further about them, we recommend that you go to the API and to the readme file about tasks that document most parameters at https://github.com/openlayers/ol3/blob/v3.0.0/tasks/readme.md.
If we dive into the case where we build everything together, the essential part is the inclusion of the build/ol-animation-combined.js file in the src array parameter.
As we removed the script tag calling resources/example-behaviour.js from animation-combined.html, we had to combine resources/example-behaviour.js with examples/animation-combined.js files. It's because adding a file into src array is not enough. You need goog.require into the file to be combined with the main OpenLayers 3 library code.
With the inclusion of resources/example-behaviour.js, the other important part was to remove the externs/example.js line, in order to unprotect the exampleNS namespace, so that we can rename it.
You should also note that in both reviewed case, compression can be achieved because of already mentioned goog.require and goog.provide. At the code level, they allow you to create a dependencies tree to gather each required function and variable within OpenLayers core library code source files.
If you inspect the size of the resulting files, you will see that although we have more content in the ol-animation-combined.js file than ol-animation-exports.js, the first one weighs 190Ko (65Ko manually gzip compressed), whereas the second size is 212Ko (71Ko manually gzip compressed).
The conclusion is that compiling everything together is the best solution to gain size in your code.
Now, try to reuse this knowledge in your own OpenLayers samples build.
Now that you have all the basic knowledge about OpenLayers toolkit to compress code, try and apply it your own project.
To improve your skills, you can perform the same task we did in the previous Time for action section, but using a different example. You can use the JSON files from the build/examples because they may help you to solve building dependencies. Be careful, if you rely only on those files, it will not work the expected way if you use the export method or you change JavaScript calls in samples HTML files.
To try it out.
You have to change the paths in samples, and then test them by interacting with your samples; it may work when they are loading, but they will fail later when clicking and panning.
Remember we told you that without externs, you can't use external libraries in the ADVANCED mode? We recommend you comment out or remove externs, to see what will happen if we don't use them. In particular, try to remove jQuery externs, and try to build the examples from Time for action.
What do you see? If you don't have any ideas, you can see that externs' keywords refers to some JavaScript files. If you need, for example, to use a library such as Underscore (another JavaScript Library to use more functional programming), just copy the externs, add your path to the JSON file, say, "../externs/underscore.js", and after this, you are ready to use your library in the Closure Compiler ADVANCED mode.
To find out about externs, go to this Closure Compiler web page: https://github.com/google/closure-compiler/wiki/Externs-For-Common-Libraries
If you require another less common library, find it using a search engine or by generating it with this tool: http://blog.dotnetwise.com/2009/11/closure-compiler-externs-extractor.html
In the worst case, you will be stuck and will only be able to use the SIMPLE mode or to use the exports method, building a minimum Openlayers core library.
Q1. When using the OpenLayers 3 toolkit, your code is not working in the ADVANCED compilation mode, although it's perfectly fine in the SIMPLE mode, what can be the cause (multiple choices accepted)?
goog.requiregoog.inheritsgoog functions in your custom codeNow, we have seen mainly an underlying way to compress the JavaScript code; we will introduce you to syntax and styles in JavaScript code. When you start to write more than ten lines of code, it starts to become an obligation!
Syntax and styles are the way to keep your code clean and to share it. You can always do dirty work, but for maintainability of long term, it is a must to enforce some rules.
For this, we rely on Closure Linter, one of the Closure tools. It also requires Python to run. We already installed it with pip install -r requirements; so, let's see how to use it. Later, we will see some alternatives.
We will retrieve one file from the previous OpenLayers library Version 2.12.
For this, download the file Map.js from https://raw.github.com/openlayers/openlayers/release-2.12/lib/OpenLayers/Map.js.
Type the following command:
gjslint Map.js
You will get 605 errors with messages like below:
----- FILE : /home/thomas/Map.js ----- Line 1, E:0001: Extra space at end of line Line 7, E:0200: Invalid JsDoc tag: requires Line 266, E:0131: Single-quoted string preferred over double-quoted string. Line 982, E:0120: Binary operator should go on previous line "+" Line 1106, E:0002: Missing space before "(" Line 1131, E:0002: Missing space after "function" Line 1089, E:0110: Line too long (83 characters). Found 605 errors, including 0 new errors, in 1 files (0 files OK).
Some of the errors reported by GJsLint may be auto-fixable using the fixjsstyle script. Please double-check any changes it makes and report any bugs. The script can be run by executing:
fixjsstyle Map.js
So now, make a copy of the Map.js file to save it in an eventual case where the fixer would suffer from a bug. Then, execute the following recommended line:
fixjsstyle Map.js
You will see:
fixjsstyle Map.js Fixed 582 errors in /home/thomas/Map.js WARNING: Line 1089 of /home/thomas/Map.js is now longer than 80 characters.
Relaunch the gjslint again:
gjslint Map.js
You now have only 23 errors. Really good compared to the previous 605 errors. You can ignore, in this case, errors like:
Be aware, that you can use options to comply more or less to the language but can't customize everything. You are also encouraged to play with the options. To discover them, execute the following command:
gjslint -–help
For example, try the --strict options that check also your file indentation and you get 1867 errors or use the recursive option -r to apply check on a every JavaScript files in a directory.
We use a practical approach, but to understand the adopted code style, we invite you to go to the Google JavaScript Guide at http://google-styleguide.googlecode.com/svn/trunk/javascriptguide.xml, in particular, if you don't want to fix all your code at the end of your project.
We gave you some information about the raw use of the Linter, but like for other cases, you already can check your code in the default OpenLayers development environment. Just launch ./build.py lint or build.cmd lint, depending on your OS.
Although syntax and styles are considered as good practices. Good practices are not rules; you choose to respect them more or less. Never forget that consistency is important, particularly when you need to share your code with other people. We reviewed how to do it with Closure Linter but this is not the only way. Let's broaden your vision.
It is always easier to use the same tools for all your JavaScript, but we advise that you be curious about other JavaScript coding styles for improving your knowledge and choose the coding style that fits you.
We recommend that you not only look at https://github.com/rwldrn/idiomatic.js but also at big library projects.
For example, check out the following links:
To enforce your own coding style and share it, the most valuables tools are as follows:
Although those tools are interesting, the errors you receive when using them on your files are not always clear. So, we advise that you look at http://jslinterrors.com.
In this appendix, we learned a lot about the Closure Tools. It is always important to understand how things work to be able to track why your code is not working. Without this review, when using, for example, the ADVANCED mode, you will stay stuck and end up keeping the default file for production. If you do so, you are losing partly the OpenLayers 3 philosophy: this version is a rewrite to have a better API and to get performances.
In the first part of the appendix, we learned why performance is important. Next, we saw how to reuse Closure Library or how to overload default OpenLayers 3 components. We then inspected how to practically use Closure Compiler itself in the OpenLayers development context.
Finally, we introduced you to some tools to improve your overall code quality. In this case, only remember this citation from idiomatic.js:
"All code in any code-base should look like a single person typed it, no matter how many people contributed."
OpenLayers is, at a fundamental level, not doing anything that is conceptually too hard to grasp. It gets map data from a server, and puts them together. From a technical level, however, there is a lot of work going on, and it might seem magical how it all works together so well.
Fortunately, there are many tools to dispel any potential magical thinking we might have and show us how OpenLayers is working behind the scenes. Google Chrome Developer Tools, the included debugger in Google Chrome browser, is one such great tool. Speeding up development time, viewing network communication, and squashing bugs are just a few things that Chrome Developer Tools, and other web development tools, do that make them hard to live without.
To really use OpenLayers effectively and to its full potential, we need to understand how it works. In this appendix, we'll try our best to do just that, by using web development tools to examine OpenLayers' inner workings. By doing so, we'll accomplish two things. First, we'll become familiar with these tools, which will significantly help us when developing our maps. Secondly, and more importantly for now, we'll gain a better understanding of how OpenLayers works.
We'll do another tour about plugins and functions that can improve your experience in Chrome Developers Tools and can help you develop your OpenLayers debugging skills. To finish, the last topic will be how to work with other browsers when debugging. You may not be aware, but Google Chrome and its Developers Tools is around one-third of the browser market.
In this chapter, we'll cover the following topics:
Chrome Developer Tools, also called Chrome DevTools, is the built-in debugger included in Google Chrome browser, a free cross-platform browser. Other modern- and standards-based browsers, such as Mozilla's Firefox, Apple's Safari, Opera, and Microsoft Internet Explorer (8+) also work well for debugging web-based applications and sites.
Chrome DevTools and other web development tools make the web development process much easier and quicker. What do we mean by this? With these tools, we can change anything on our site on the fly without editing or saving any files. We can type in JavaScript code with a command-line interface and execute it immediately. We can view all the requests that our web page sends to servers, along with the server's reply. For example, if our map isn't able to get back map images from the server, we can examine the requests our page is making and find out if we have any typos or haven't set up our map layer properly.
Using these tools makes it a lot easier to develop not only an OpenLayers mapping application, but any web application, and makes it easier to fix any bugs we encounter in the process. The choice to use Google Chrome as the first tool for debugging instead of other debuggers is motivated by its large support for mobile testing, the best built-in tools for debugging at the time of this writing, its support for all OS (Windows, Mac, Linux) and some others features. We'll focus mainly on Google Chrome in this chapter and refer back to it throughout the book. Other tools such as Mozilla's Firefox, Internet Explorer (8+), and Apple's Safari's developer tools work just as well (although some functionality may vary).
To discover this tool, firstly, Google Chrome browser needs to be installed.
So, go to its dedicated download area at http://www.google.com/chrome/ and install it. Depending of your OS, the format for installing the software will be an .exe, a .dmg, a .deb or an .rpm file.
After the Chrome installation, let's open Chrome DevTools:
After clicking on the panel activation, the browser windows has been split to display a panel.
An alternative way to open this panel is to right-click in a web page and to click on Inspect.
You can also find the keyboards shortcut for this at https://developers.google.com/chrome-developer-tools/docs/shortcuts.
Now, let's take a look at what the tool looks like after its activation:
The top row starts with a Page Inspector icon and Toogle device mode icon, which is useful for mobiles. Then, multiple panels with textual descriptions such as Elements or Network provide specific functionality (they look and act similar to tabs, but the technical term is panels). The upper row end on the right has a Show Console icon, a Settings icon, a Detached/attached debugger icon and a close button. The position of the icons may change over time as Google Developer Tools is updated; but general functionalities should remain (more or less) the same.
The following content will cover the top row icons from left to right, excluding panels.
In this section, we will see each button in the Chrome Developer Developer Tools to review the available functions you can perform with the debugger.
The top row set of controls is called panels; each panel provides a different type of function. The panels act like tabs (the two terms can be used interchangeably), but Chrome Developer Tools refers to them as panels in the documentation. Let's go over each panel, since they are, essentially, what makes up Chrome DevTools. We will not go over these panels from left to right, but instead we will look at the most important ones for beginners first.
The Elements panel provides not just a display of the HTML source code, but also the ability to quickly edit any HTML element and its associated style. It allows users to add, remove, and move HTML elements, edit HTML attributes, and change nearly anything about the page without having to save any files. It also can track when attributes or elements are created, changed, or removed. This helps to make web development much easier and faster.
Chrome DevTools automatically builds a tree structure from HTML code, giving the ability to expand and hide each HTML tag. It is important to note that the code you see in the HTML panel is a generated HTML code—the code in the panel may not be exactly the same as the page's source code (because the browser is interpreting the HTML to be able to show a page content).
Here is what the Elements tab looks like when Chrome DevTools is opened while viewing a web page:
On the left-hand side, Chrome DevTools shows the HTML of the page. It's possible to right-click on any tag and do various things—such as copying the HTML to the clipboard, deleting the element, changing the tag attributes, and more.
On the right-hand side, the associated style information for the selected element is displayed. Properties can be added or modified and will instantly appear on the page, like in the preceding capture image example (at http://www.w3.org/Style/Examples/011/firstcss.en.html), with the div element with id attribute value to language
. Looking at the CSS on the right-hand side, there is a definition for the language id but only font-size and font-style properties are defined. We also see that some other styles are coming from the body element parent. The <div> tag inherits from body the color #333333 or the font-family properties.
If you are unfamiliar with HTML or CSS, the WebPlatform site is a great resource. For more information on HTML, visit http://docs.webplatform.org/wiki/html, and for CSS, visit http://docs.webplatform..
What does this mean? Well, Chrome DevTools lists all inherited style information, and parent element styles propagate down to all their child elements (each child has all its parent's styles, unless the child overrides a style, which doesn't happen in this example).
By double-clicking on pretty much anything in the HTML or CSS list, you can quickly change values and names. Any change you make will immediately show up on the page, which makes it very easy to change style in real time and see how the page is affected without having to edit and save any files.
When you're playing with CSS, you can disable a property with a left click on the left part of the CSS property. You can try this on font-size to see visual change. For CSS, when the code really inherits from a lot of properties, we advise you to go to sub-panel Computed on the right part of Elements panel. You get the summary overview for each property. Play around with it a bit—if you mess anything up, you can just reload the page in Chrome.
When editing pages with Google Chrome Developer Tools, any changes you make will disappear when you refresh the page. You are not editing the actual web server's files with Google Chrome Developer Tools—instead, you are editing a copy that is on your computer that only you can see when you make changes to it. So, if you make changes and want them to be saved, you'll have to edit your actual source code.
In fact, one way to directly edit and save content within Google Chrome Developer Tools is to rely on the Workspace ability we already have evocated when clicking in the Settings icon. Check out the official Chrome Developer browser documentation at https://developer.chrome.com/devtools/docs/workspaces.
Until now, we focused on the right part of panel elements. Let's see how to manipulate and inspect DOM elements in the left Elements window.
Reusing knowledge about OpenLayers renderers from Chapter 3, Charting the Map Class and OpenStreetMap from Chapter 4, Interacting with Raster Data Source, let's review how to manipulate the DOM and changing OpenStreetMap tiles sources on the fly.
So, let's start with the official OpenLayers example from http://openlayers.org/en/v3.0.0/examples/simple.html using Page inspector.
Open the file and at the end of the URL you get from your browser add ?renderer=dom
img tags, right-click on Edit attributes, as illustrated in the following screenshot:src attribute. So, replace its value with http://tile.stamen.com/toner/2/2/1.png and see the result. In the Elements panel, the img (for the image tag) src attribute contains http://b.tile.openstreetmap.org/2/2/1.png. If you remember, URL can be separated in two parts. The first part, http://b.tile.openstreetmap.org/, (called base URL), will change when the second part, 2/2/1.png, will change according to images you hover on. Here, we only change the first part.We saw how to modify attributes of HTML elements using the Page Inspector on images. You also saw the correspondence between highlight on the web page and code content in the Elements panel when hovering over. You also rediscovered some different OpenStreetMap backgrounds.
Chrome DevTools's Network panel is a tool we often use throughout this book. It basically provides a way for us to monitor a network activity by viewing all the requests and responses the web page is making. In addition to the initial page load network activity, we are also able to monitor all of the asynchronous JavaScript requests that are made by the web page. Without AJAX, we will have to refresh our entire page any time we want to do anything with our OpenLayers map. So, for example, every time you zoom in, OpenLayers makes a series of requests to the map server to get new map images, and the map server's response is a new map image that OpenLayers then displays. This request/response method is handled via AJAX; without it, we would have to refresh the entire page after every request.
See Appendix B, More details on Closure Tools and Code Optimization Techniques, where a small web history and a diagram covers AJAX.
The Network panel allows us to see the URL that is being requested, the GET or POST parameters, the server's status response, the type of resource requested, the size of the response, and the time it took to complete the request. Let's take a look at what the Network panel looks like for the example from the previous official example used when reviewing Elements panel:
Before we talk about the requests being made, take a look at the buttons above the lists of requests—the first one is dedicated to Record Network Log and the second Clear helps you remove the list of network calls. Then, you can activate Filter, which displays a submenu to filter by resources types for example, Documents, Stylesheets, Images, but also by the type of requests such as XHR or WebSockets. The Filter icon also activates a full text search box. The fourth icon is Use small resource rows. The two checkboxes are available, Preserve Log will cause the list of requests to persist, or not get deleted, on page reloads, while Disable cache will not allow you to use cache. For better performances, some assets such as scripts or images can be kept in your browser memory to speed your browsing experience when you visit the same website again. The drawback is when you debug, you can use an outdated file.
Now, let's break down the actual request list.
The request list shows us all the requests the page makes. Each URL in the previous screenshot is a URL that OpenLayers is making a request to. By clicking on each request, we can see more information about the request, including the full request URL and the response. When we are in the Headers sub-tab, we get a Request URL, Request Method, and Status Code, and after we get all details of Request Headers and Response Headers. The Request URL tab gives all the parameters. The Response tab provides us with the server's response to our request:
Take a look again at the list—when we look at the first image in the screenshot, the row has the name 1.png. The method, GET in this case, specifies that the request type is GET, which basically means we are embedding variables inside the URL itself, with optional key=value pairs, separated by an & sign.
When we mouse over a URL, we can see more of it; we see the full URL, which may contain a bunch of variables in the key=value&key=value&.... format. In our case, we only have a full URL like http://c.tile.openstreetmap.org/2/1/1.png when hovering.
As we saw in all OpenStreetMap examples through the book, we didn't need parameters. If you remember in Chapter 1, Getting Started with OpenLayers, we told you that OpenLayers consumes cartographic data; some can come from dynamic web mapping server, others from pregenerated data. Our example relies on pregenerated data so that there are no parameters added contrary, for instance, to a WMS data source.
The Sources panel is very powerful. It enables you to view and edit JavaScript and CSS files loaded from the web page. You are not restricted to only view all the JavaScript code associated with the page in this panel; you can use it to do real-time code debugging. You can set watch expressions, view the stack, set breakpoints, and so on. If these terms are foreign, don't worry, we will review some of them.
For example, we want to quickly talk about enabling Pause on exceptions. With this option enabled, Chrome DevTools will stop the web page whenever a JavaScript error is encountered. This makes it very easy to quickly pinpoint where your page is blowing up at. To enable it, simply click on the Pause on exceptions button icon (be careful, it's not the same as an Pause Script Execution icon).
Keep note of this when you enable it. We've been frustrated more than once when developing because we forgot that it had been enabled. When it is enabled, the button isn't gray, as demonstrated with the icon:
Another tip in this panel, is the ability to unminify JavaScript. It's really useful to track errors. You can open a web page with a compressed JavaScript file. If you click on the icon with open/close brackets called Pretty Print, you will see the difference.
You are maybe wondering why we spoke so much about this panel. When you start to make complex web mapping applications, this panel is the best way to analyze how an application works. When you're developing or reusing an already existing code, you can already guess the behavior of the code, but you can't confirm it. The key feature of the debugger is to make this confirmation. Let's see an example of how you can use it.
Breakpoints help you understand available variables and their values, one at a time in your code, and see when the code is executed. Let's see how.
As we didn't have space to cover such a large topic, we chose to let you discover the basic parts using the official tutorial. So head to it and review it at https://developers.google.com/chrome-developer-tools/docs/javascript-debugging. Now after this review, open the example for Chapter 1, Getting Started with OpenLayers, with Chrome Developer Tools opened with the Sources panel. Change the ol.js reference to ol-debug.js (more readable).
Set breakpoints in the HTML page at var osmLayer, var map, map.addLayer, and map.setView. Check the following steps:
osmLayer, map, map.getLayers(), map.getLayers().getArray() , map.getView() and map.getView().getCenter().var osmLayer.When we began by introducing the library in Chapter 1, Getting Started with OpenLayers, we described every step to create a basic map. With this example, we are able to follow the flow of your code with Chrome Developer Tools. First, all the variables we defined in the Watch Expressions were empty, as seen in the screenshot at step 3.
With the declaration of var osmLayer, the part of figure After var osmLayer... showed us an ol.layer.Tile object was created.
Then, we created a map in the After var map... part. The result is that map variable was assigned an instance of ol.Map. With this ol.Map creation, ol.Collection was created for layers, but there were no layers: map.getlayers().getArray() as a length equal to 0. Moreover, a view was also added in the map but didn't have a center in this step; map.getView() stopped to be empty and was replaced with an ol.View instance.
Then, by adding the layer in the After map.addLayer part, we saw that the map had a layer added: the previous map.getlayers().getArray() was using osmLayer: its length is 1.
At the end, the same process happened for the map view. The Map class with the map.setView method gained the view parameters, and so, map.getView().getCenter() returned an array with coordinates.
This detailed description was a good way to show that we can find how the code works by following the code execution, instead of blindly searching where things happen or only deducing by reading code. When you have enough coding experience, the solution to only follow the code without using a debugger can be better to get a full code overview, but as a beginner, it's not the best solution and you should focus only on small code parts.
We hope with this demonstration, you appreciated discovering one of the main web debuggers features.
After this JavaScript escape, let's return to the CSS topic. Remember we said that we can also edit the CSS content in the Sources panel. Contrary to the Elements panel, we have the option to edit any CSS document associated with the page, not just the style of a selected element. We don't need to not talk much about this panel. We'll give you an accelerated overview for using it in OpenLayers.
What we are customizing are the controls introduced in Chapter 9, Taking Control of Controls. It's time to try it: practicing things on your own will improve your comprehension. For this, we will reuse the OpenStreetMap example from Chapter 1, Getting Started with OpenLayers, and customize the position for zoom buttons and map copyrights.
ol.css file and use the Format button to make it more readable as this file is a .css minified file on one line..ol-zoom class in the ol.css file.left : 0.5em; parameter with right : 0.5em; to make changes to zoom buttons..ol-attribution:not(.ol-collapsed).rgba(255,255,255,0.8);, to rgba(255,0,0,.4);.In the previous example, you played with HTML content. Here, the focus was to cover how you can change the style on the fly. We set the position of the zoom control to the top right and we also changed the background for attribution when you open the attributions collapsible block (credits to maps data and tiles) to red with an opacity change. We encourage you to perform more tests on your own to assimilate the way the panel works.
If you are a web designer working on the code or a web developer requiring to make some designs, we advise you to play a lot with this powerful panel. It can greatly speed up your development time when you master it. If you are always editing CSS in your browser, you should consider looking into the Workspace functionality we've already talked about.
The Chrome DevTools Console panel is where we'll spend most of our time. It acts as a powerful JavaScript command line, or interpreter, which means we can type in JavaScript code and execute it right away—no need to save or edit any files. We can also inspect values when we are stopped at a breakpoint in the Sources panel and want to inspect the context at this time.
Another thing that makes this panel so useful is that we can interact directly with the DOM (Document Object Model)—any HTML element on the web page, including any existing JavaScript code the page contains. So, this means we're able to interact with our OpenLayers map on the fly, issuing command and testing code to instantly see what works and what doesn't. As you can imagine, this saves a ton of time!
You can choose and type in the console on one line or multi-lines. To use multi-lines, type Shift + Enter to return without executing code.
When you need to discover the structure of an object, the Console panel is a very valuable tool, especially when you want to take a peek at JavaScript components. Assuming we are looking at a page that includes OpenLayers, we can quickly see all of OpenLayer's classes, functions, and so on. It is not a replacement for the API docs, but serves as a good, quick way to view such information.
It looks like the screenshot that follows:
With it, you have a classification of all types of resources. You get all resources depending on frames such as the images, CSS, and HTML files. It is a good way to know what your web page loads.
You also can see all persistent storage. Persistent storage are Web SQL, IndexedDB, Local Storage, Session Storage, and Cookies. Although they might not mean much to you, they provide features, not directly related to OpenLayers, can be useful as they are HTML5 features. We invite you to discover their purpose by visiting http://html5demos.com.
With this various storage, you can keep information for customizing users' experiences. For example, you can use them to customize the language for a web application, store the zoom level for a displayed map, and so on.
To complete and end this panel description, the last thing we need to inspect is the Application Cache. It is the most useful function for our book in Chapter 10, OpenLayers Goes Mobile. It helps you inspect the data cached using the MANIFEST file.
These three panels are not really useful for beginners. They target advanced developers mainly for performances purposes:
If you want more information about these panels, visit the official documentation of Chrome DevTools at https://developers.google.com/chrome-developer-tools/.
Each panel serves a certain purpose and all of Google Chrome DevTools' panels are extremely useful, but throughout this book, we will be mainly focusing on the following panels:
These four panels are the ones that we should use the most throughout this book. We can occasionally come back to the other panels, but we don't need to spend a whole lot of time with them. However, before we conclude this chapter, let's get a bit more familiar with the Console panel, since we will need it in most of our chapters.
We talked a bit about what the console panel is—essentially, a JavaScript command line. We can execute any JavaScript code we want, and interact with any page element. There are two primary components to the Console panel—the console log area and the input area.
The console log area will display information about any errors, along with displaying any code that is entered. The input area allows us to either enter a single line of code or multiple lines of code.
Before we start using the console with our maps, let's get familiar with the console by executing some JavaScript code.
We will do some basic JavaScript coding via the Chrome DevTools console; specifically, just calling a built-in the alert() function to display an alert.
alert('Packt publishing loves open source. You want to write? See http://authors.packtpub.com');alert box pop-up with the text 'Packt publishing loves open source. You want to write? See http://authors.packtpub.com' (or whatever string you passed into the alert function). After the code is executed, it will appear in the log above the input line:We've just executed some JavaScript code without having to edit and save any files. Although we did a simple alert, we are really not limited by what we can do. Anything that we can save in a JavaScript file, we can also enter in the Console.
You'll also notice that the same code that we typed in appeared in the log area. We'll also get an error message if any errors occur in the code—go ahead and try it! Instead of typing alert('My alert'); type something like fakealert('Boom');. This will give you a reference error, since nowhere is the fakealert()function defined —alert(); on the contrary, it is a built-in function, so we can call it from any page.
That's pretty much all there is to it! The rest just builds on these principles. Let's go ahead and do just one more thing, something that is slightly more involved, before jumping into manipulating an OpenLayers page.
We will introduce object literals and get acclimated with how to manipulate them now, so that we can better work with the OpenLayers code:
var my_parameters = {zoom: false, attribution: false, otherControl: 'myslider'};
console.log(my_parameters);{zoom: false, attribution: false; otherControl: 'mySlider'}. In this case, the object is not complex but when the object is more complex, you will see an arrow before the object, and if you click on it, it will show all the information about the object you just created.console.log(my_parameters.otherControl);
We just created what is called in JavaScript an anonymous object, or object literal. We previously discussed that objects are created from classes, in Appendix A, Object-oriented Programming – Introduction and Concepts and in JavaScript, we need to use the new keyword to instantiate an object from a function. However, here, you can see that there is no new keyword!
The key concept here is that we are just creating a single object that does not derive from a class. Since object literals (anonymous objects) do not derive from a class, it is, essentially, an empty object. It contains only what we explicitly defined. The value associated with a key can be almost anything—a string, integer, function, array, or even another object literal.
We encountered object literals in Chapter 1, Getting Started with OpenLayers —they were the {key:value} pairs used to define the parameters and options of our layer and objects. The only difference is that we did not assign a variable to them; we simply passed them in when we created our layer object.
Object literals are extremely useful for a variety of tasks, and it is a great way to package information in an easy-to-use form. They are in the form of {key:value, key2:value2}. We can access any property of an object literal by using dot notation, in the form of my_object_literal.key. The key, like before, is the key part of the key:value pair. In the preceding code, we call console.log(my_parameters.otherControl); and the value of the key opacity is displayed in the console's log area. You will also encounter an alternative notation and brackets notation, to retrieve the same information. This form is quite useful because you can concatenate values keys in your object.
Using console.log(my_parameters['other' + 'Cont' + 'rol']); will do the same as the previous console.log call. It allows to loop on objects with a key that can change whereas the dot notation does not allow this.
console.log(): The Chrome DevTools function console.log() is a function that will, essentially, display what you pass into it in the console log. You can pass in variables, strings, objects, anything, and it will display in the log. It comes in handy often, so getting familiar with it is a good idea.
We use object literals frequently when making our maps—so if they don't make much sense yet, don't worry. The basic idea to grasp, and the primary way we will use them, is that they are essentially key:value pairs. Before we end this chapter, let's do a quick example where we interact with an OpenLayers map using the Console panel.
We'll use the map we created in Chapter 1, Getting Started with OpenLayers, to do this example, interacting with our OpenLayers map by calling various functions of the map.
../assets/ol3/js/ol.js to ../assets/ol3/js/ol-debug.js and open the file in Chrome. Enable Chrome DevTools and go to the Console panel. If you like, you can take a look at the Network panel and view the network activity to see the requests your page is making.console.log(map);
Take note of the function names, as we'll be using them.
map.getView().setCenter([0, 0]); map.getView().calculateExtent(map.getSize());
map.getView().setResolution(2000); map.getView().calculateExtent(map.getSize())
console.log(map.getSize()); console.log(map.getViewport());
console.log(map); then clicking on the output in the log area). Try playing around with different functions and attributes the map object has. To access the functions, you just need to type in map.function();.map.key, where key would be something like keyHandler_ (so the full code would be map.keyHandler_). Be aware that values with underscore at the end are private when using the compressed ol.js file (it's a naming convention in the library code).We just executed some functions of our map and accessed some properties of it. All we have to do is call our object, map, followed by a period, then a function or property it owns. Using this dot notation (for example, map.getSize();), we can access any property or function of the map object.
We also saw how the Console panel comes in handy, and took a look at functions that we can call, which the map object owns. Any function listed there can be called via map.functionname();, but some functions require parameters to be passed in or they will not work. However, where can we go to figure out more information about the functions and what they require?
Try to call different functions that you see listed in the Console tab when typing in the window. Many functions will not work unless you pass certain arguments into them, but don't be afraid of errors! Poke around the various functions and properties and try to interact with them using the Console tab like in the preceding example.
The API documentation for the Map class, which our map object derives from (and thus, inherits all the functions and properties of the class) provides more detailed explanations of the properties, functions, and what we can do with them. They can be found at http://openlayers.org/en/v3.0.0/apidoc/. Even though Chrome DevTools is a great resource to quickly interact with code and learn from it, the API docs present an extra level of information that Chrome DevTools cannot necessarily provide. Do not hesitate to visit them at http://openlayers.org/en/v3.0.0/examples/.
Chrome DevTools is evolving rapidly and many new capabilities are being added all the time. Make sure you read the official documentation at https://developer.chrome.com/devtools/index and check back periodically to see what's new.
Although it's more related to programming than web mapping, it's recommended to increase your abilities at using web debuggers.
Chrome DevTools by default offers the main functions to develop and debug with OpenLayers, but to be more efficient, it's really required to use extensions. Extensions are additions to Chrome browser or to the Developer Tools to add or augment default software functions. You can find most of them at http://www.google.com/intl/en/chrome/webstore/extensions.html.
We'll review some of them.
Usually you're consuming web services providing JSON (JavaScript Object Notation) when you're doing mashups. To illustrate why the add-on is useful, we will use a geocoder service, such as Nominatim, to retrieve position for a postal code. A geocoder is a tool to match addresses with geographic coordinates.
For example, typing http://nominatim.openstreetmap.org/search?q=35+Livery+Street+Birmingham&format=json&limit=1 in Chrome will send you the following screenshot:
With the extension, you will directly get an indented content, collapsible.
So what is the difference? When it's required to correctly reuse data, we must understand received data and with this plugin, the return content is human readable! Furthermore, OpenLayers can consume GeoJSON, a subset JSON notation dedicated to maps data.
Download it at https://chrome.google.com/webstore/detail/jsonview/chklaanhfefbnpoihckbnefhakgolnmc.
When you are making a custom UI, you always have to try different colors.
You can also retrieve a color you like from another website or an image. In this situation, you will not want to always go back and forth between a graphic tool such as Gimp or Photoshop and your browser. So in this case, you can install ColorZilla. How is this related to OpenLayers? When you want to make customize controls elements, this is an invaluable tool. Go to http://www.colorzilla.com/chrome/ to retrieve it. It's also a plugin available for Firefox.
If you really want to improve your skills for using Chrome Developer Tools, you should visit Code School tutorial at https://www.codeschool.com/courses/discover-devtools. Use also the videos available in the official documentation at https://developers.google.com/chrome-developer-tools/docs/videos.
Visit the Secrets of the Browser Developer Tools website, http://devtoolsecrets.com. It covers all browsers!
During all this chapter, we introduced you to Chrome DevTools. It's one of the most powerful tools for debugging JavaScript applications, but it is important to see the reality of the web market. Just look on this graphic below from StatCounter GlobalStats, http://gs.statcounter.com, that provide statistics from more than 3 million websites.
As you see, there exists more than one web browser, and Internet Explorer with Firefox together represents a bit less than 50 percent of the market. It means that your web mapping application must be compliant to those other browsers. Moreover, you have to deal with different versions for the same browser family.
Although OpenLayers itself works really well with all browsers, your own code will not always do it.
Because of this, we'll review some tools to debug in Internet Explorer and Mozilla Firefox. We will describe equivalence between Chrome DevTools panels and browsers-specific debuggers.
Before Internet Explorer 8, there wasn't any debugger built-in. The previous version of OpenLayers library (the 2.x series) was covering old IE versions such as IE 6, 7. OpenLayers 3 supports IE 9+.
Although the IE debugger is considered less powerful than other browsers debuggers, it is valuable tool in particular because of the step-by-step debug.
The following screenshot of IE 9 debugger shows that most panels are similar to Chrome Developer Tools:
The HTML panel is like the Elements panel, and the CSS and Scripts panels do the same job that the Sources panel in Chrome DevTools does.
The Console and Network panels are quite similar to the ones in Chrome Developer Tools.
In addition, for better performance, for example, to evaluate and improve your JavaScript execution time, a profiler can be found in the Profiles panel but doesn't provide as much functions as its Chrome equivalent.
With IE, each version of the browser debugger gains panels. So, it would be better to review versions differences using the official Microsoft developer website at http://msdn.microsoft.com/en-us/library/ie/.
Like for IE, this part will be dedicated to describe equivalence between Chrome DevTools and Firebug, an extension to Firefox. Although Mozilla Firefox has a built-in debugger included nowadays, Firebug remains the best tool on Mozilla to debug web maps and sites at the time of this writing.
We advise that you install it by visiting the official site at https://getfirebug.com/.
Now, it's time to make the comparison again.
In this case, the Console panel with the DOM panel in Firebug provides the same functionality that Chrome Developer Tools Console panel gives.
The HTML panel is equivalent to the Elements panel.
The CSS and Script panels combined together give you Sources panel functions.
The Timeline, Profiles, and Audits panels are specific to Chrome Developer Tools.
Most of the extensions for Firebug are listed at https://getfirebug.com/wiki/index.php/Firebug_Extensions.
Those extensions help to close the gap between default Chrome Developer and Firefox with only FireBug.
You can also find Mozilla Firefox add-on that do not always depend on FireBug. The official place to get them is https://addons.mozilla.org.
If you need one extension, you will have to install Acebug: https://addons.mozilla.org/en-us/firefox/addon/acebug/.
When you are learning and in particular doing JavaSript test directly in the browser, it behaves like an advanced text editor. Its main goal is to bring new features to Firebug's multi-lines command.
This add-on does the following:
Moreover, the Resources panel that you get with AceBug in Firebug combined with Cookies panel provides similar experience to the Resources panel in Chrome DevTools.
More and more efforts have been done on the built-in Firefox Developers Tools, it starts widening the gap with Firebug debugging functions. Sometimes, it exposes more advanced capabilities than Firebug. You can take a look at it main dedicated page at https://developer.mozilla.org/en-US/docs/Tools.
Learning process goes through repetitions. So, go back to the previous Console panel examples of the chapter and retry them in Mozilla Firefox. Take your time to see differences with Chrome Developer Tools behaviors. After those tests, go to your first OpenLayers example and type ol in the Console panel and click on it to browse like if you were in the Chrome Developer Tools Console tab. We also recommend that you play with autocompletion. Don't hesitate to experiment until you feel confident.
Q1. What panel(s) will you use if you wanted to execute JavaScript code?
Q2. You want to make some changes in CSS styles; what panel(s) can be used?
Q3. Using the sample from Chapter 1, Getting Started with OpenLayers, when you inspect the map object with console.log, what methods are available?
map.getView().map.getLayers().map.getLayer().map.getInteraction().In this appendix, we learned more about how OpenLayers works but before anything, we learned more on how to use Chrome DevTools.
We then took a look at the panels that Chrome DevTools provides and what they are used for. Afterwards, we spent time with the Console panel—something you'll be making extensive use of throughout this book (and when you're developing your own web maps). Then, we reviewed how to improve default Chrome DevTools. Finally, we covered basically main other web debuggers with cross-browsers support in mind.
This appendix aimed to provide some fundamental knowledge of web development tools for getting into both OpenLayers and general web development. Web development tools, such as Chrome DevTools, are one of the biggest assets in our toolkit. They speed up development time, help us identify bugs, interact with our code better, and much more.