Table of Contents for
OpenLayers 3 : Beginner's Guide
 OpenLayers 3 : Beginner's Guide
Published by
Packt Publishing, 2015
OpenLayers 3 : Beginner's Guide
Published by
Packt Publishing, 2015
- Cover
- Table of Contents
- OpenLayers 3 Beginner's Guide
- OpenLayers 3 Beginner's Guide
- Credits
- About the Authors
- About the Reviewers
- www.PacktPub.com
- Preface
- What you need for this book
- Who this book is for
- Sections
- Time for action – heading
- Conventions
- Reader feedback
- Customer support
- 1. Getting Started with OpenLayers
- Advantages of using OpenLayers
- What, technically, is OpenLayers?
- Anatomy of a web mapping application
- Connecting to Google, Bing Maps, and other mapping APIs
- Time for action – downloading OpenLayers
- Time for action – creating your first map
- Where to go for help
- OpenLayers issues
- OpenLayers source code repository
- Getting live news from RSS and social networks
- Summary
- 2. Key Concepts in OpenLayers
- Time for action – creating a map
- Time for action – using the JavaScript console
- Time for action – overlaying information
- OpenLayers' super classes
- Key-Value Observing with the Object class
- Time for action – using bindTo
- Working with collections
- Summary
- 3. Charting the Map Class
- Time for action – creating a map
- Map renderers
- Time for action – rendering a masterpiece
- Map properties
- Time for action – target practice
- Map methods
- Time for action – creating animated maps
- Events
- Views
- Time for action – linking two views
- Summary
- 4. Interacting with Raster Data Source
- Layers in OpenLayers 3
- Common operations on layers
- Time for action – changing layer properties
- Tiled versus untiled layers
- Types of raster sources
- Tiled images' layers and their sources
- Time for action – creating a Stamen layer
- Time for action – creating a Bing Maps layer
- Time for action – creating tiles and adding Zoomify layer
- Image layers and their sources
- Using Spherical Mercator raster data with other layers
- Time For action – playing with various sources and layers together
- Time For action – applying Zoomify sample knowledge to a single raw image
- Summary
- 5. Using Vector Layers
- Time for action – creating a vector layer
- How the vector layer works
- The vector layer class
- Vector sources
- Time for action – using the cluster source
- Time for action – creating a loader function
- Time for action – working with the TileVector source
- Time for action – a drag and drop viewer for vector files
- Features and geometries
- Time for action – geometries in action
- Time for action – interacting with features
- Summary
- 6. Styling Vector Layers
- Time for action – basic styling
- The style class
- Time for action – using the icon style
- Have a go hero – using the circle style
- Multiple styles
- Time for action – using multiple styles
- Style functions
- Time for action – using properties to style features
- Interactive styles
- Time for action – creating interactive styles
- Summary
- 7. Wrapping Our Heads Around Projections
- Time for action – using different projection codes
- Time for action – determining coordinates
- OpenLayers projection class
- Transforming coordinates
- Time for action – coordinate transforms
- Time for action – setting up Proj4js.org
- Time for action – reprojecting extent
- Time for action – using custom projection with WMS sources
- Time for action – reprojecting geometries in vector layers
- Summary
- 8. Interacting with Your Map
- Time for action – converting your local or national authorities data into web mapping formats
- Time for action – testing the use cases for ol.interaction.Select
- Time for action – more options with ol.interaction.Select
- Introducing methods to get information from your map
- Time for action – understanding the forEachFeatureAtPixel method
- Time for action – understanding the getGetFeatureInfoUrl method
- Adding a pop-up on your map
- Time for action – introducing ol.Overlay with a static example
- Time for action – using ol.Overlay dynamically with layers information
- Time for action – using ol.interaction.Draw to share new information on the Web
- Time for action – using ol.interaction.Modify to update drawing
- Understanding interactions and their architecture
- Time for action – configuring default interactions
- Discovering the other interactions
- Time for action – using ol.interaction.DragRotateAndZoom
- Time for action – making rectangle export to GeoJSON with ol.interaction.DragBox
- Summary
- 9. Taking Control of Controls
- Adding controls to your map
- Time for action – starting with the default controls
- Controls overview
- Time for action – changing the default attribution styles
- Time for action – finding your mouse position
- Time for action – configuring ZoomToExtent and manipulate controls
- Creating a custom control
- Time for action – extending ol.control.Control to make your own control
- Summary
- 10. OpenLayers Goes Mobile
- Using a web server
- Time for action – go mobile!
- The Geolocation class
- Time for action – location, location, location
- The DeviceOrientation class
- Time for action – a sense of direction
- Debugging mobile web applications
- Debugging on iOS
- Debugging on Android
- Going offline
- Time for action – MANIFEST destiny
- Going native with web applications
- Time for action – track me
- Summary
- 11. Creating Web Map Apps
- Using geospatial data from Flickr
- Time for action – getting Flickr data
- A simple application
- Time for Action – adding data to your map
- Styling the features
- Time for action – creating a style function
- Creating a thumbnail style
- Time for action – switching to JSON data
- Time for action – creating a thumbnail style
- Turning our example into an application
- Time for action – adding the select interaction
- Time for action – handling selection events
- Time for action – displaying photo information
- Using real time data
- Time for action – getting dynamic data
- Wrapping up the application
- Time for action – adding dynamic tags to your map
- Deploying an application
- Creating custom builds
- Creating a combined build
- Time for action – creating a combined build
- Creating a separate build
- Time for action – creating a separate build
- Summary
- A. Object-oriented Programming – Introduction and Concepts
- Going further
- B. More details on Closure Tools and Code Optimization Techniques
- Introducing Closure Library, yet another JavaScript library
- Time for action – first steps with Closure Library
- Making custom build for optimizing performance
- Time for action – playing with Closure Compiler
- Applying your knowledge to the OpenLayers case
- Time for action - running official examples with the internal OpenLayers toolkit
- Time for action - building your custom OpenLayers library
- Syntax and styles
- Time for action – using Closure Linter to fix JavaScript
- Summary
- C. Squashing Bugs with Web Debuggers
- Time for action – opening Chrome Developer Tools
- Explaining Chrome Developer debugging controls
- Time for action – using DOM manipulation with OpenStreetMap map images
- Time for action – using breakpoints to explore your code
- Time for action – playing with zoom button and map copyrights
- Using the Console panel
- Time for action – executing code in the Console
- Time for action – creating object literals
- Time for action – interacting with a map
- Improving Chrome and Developer Tools with extensions
- Debugging in other browsers
- Summary
- D. Pop Quiz Answers
- Chapter 5, Using Vector Layers
- Chapter 7, Wrapping Our Heads Around Projections
- Chapter 8, Interacting with Your Map
- Chapter 9, Taking Control of Controls
- Chapter 10, OpenLayers Goes Mobile
- Appendix B, More details on Closure Tools and Code Optimization Techniques
- Appendix C, Squashing Bugs with Web Debuggers
- Index
The cluster source may be used with any type of feature, but it is typically used with a set of point features. This example illustrates using the cluster source with some randomly generated points that are included with the sample files for this project in assets / data / cluster.geojson. We'll first show the original data, then modify the example to use the cluster source. The following are the steps:
- Starting from the previous example, we will add a new vector source that loads the sample data:
var originalSource = new ol.source.GeoJSON({ url: '../assets/data/cluster.geojson' }); - Next, we will create a cluster source to cluster these features:
var originalLayer = new ol.layer.vector({ source: originalSource, }); - Then, add the new layer to the map's
layersarray:var map = new ol.Map({ target: 'map', layers: [vectorLayer, originalLayer], view: view }); - Load this in your browser and take a look:
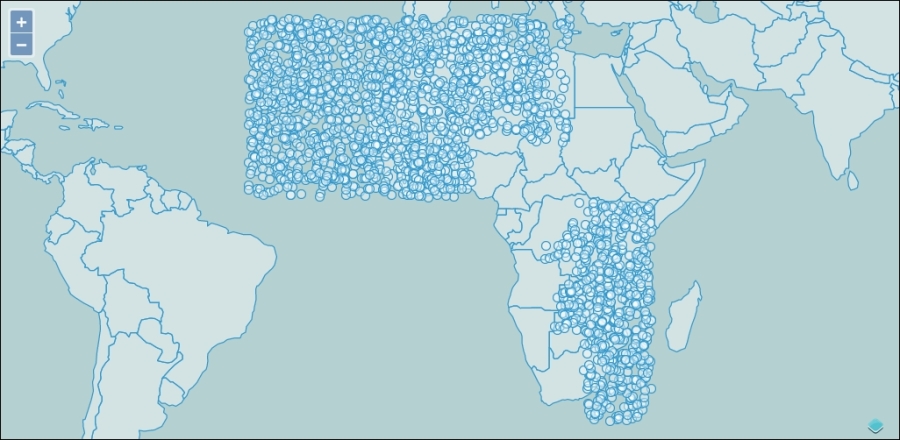
- That's a lot of points—about 5000 actually. If these represented real data, it will be very hard to see individual points until we zoom way in. Now, let's see what the cluster source does with these features. Create a new source and layer after the
originalLayer:var clusterSource = new ol.source.Cluster({ source: originalSource }); var clusterLayer = new ol.layer.vector({ source: clusterSource, }); - And replace
originalLayerwithclusterLayerin the map's layers:var map = new ol.Map({ target: 'map', layers: [vectorLayer, clusterLayer], view: view }); - Reload to see the effect of the cluster source. Try zooming in and out.
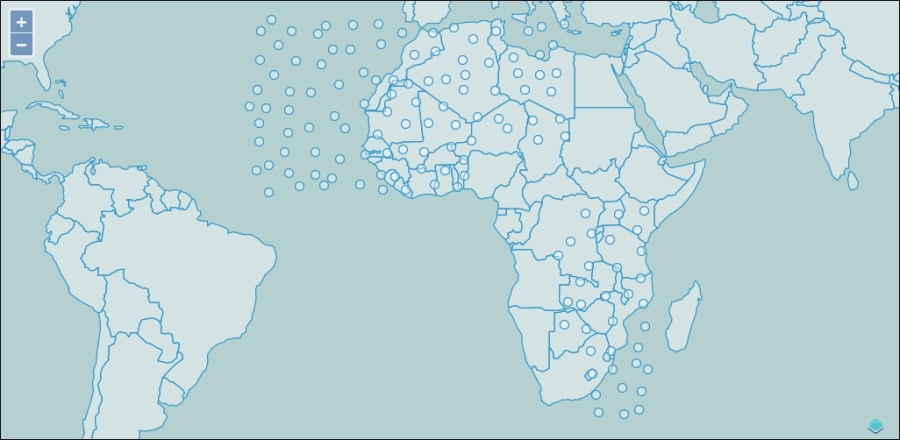
In this example, we discovered how the cluster source works. First, we created a vector layer containing about 5000 points and displayed it on the map. As we saw, it's very hard to see these points when zoomed out. Next, we added a cluster source and a new layer based on the cluster source. Now the number of points displayed on the map changes dynamically as we zoom in and out, and the number of points on the map at any one time is much more manageable.
Typically, when displaying a cluster of features, we would represent the cluster differently depending on how many features are in the cluster—perhaps by adding a text label or changing the size of the point. We'll revisit this example in the next chapter and deal with the styling options then.
The other direct subclass of the vector source is the FormatVector source. This class cannot be directly created, rather it is an abstract class that adds a single method, readFeatures, to the API of all its concrete subclasses. This means that all the other source classes provide a readFeatures method that gets features from some data structure such as a string, array, or JavaScript object. The type of the data structure is determined by the format.
A feature format is responsible for reading features from a structured format that organizes spatial features in a structured way. Each feature format is based on a recognized specification document that defines how that format represents the geospatial data it contains. The feature formats are organized into three distinct groups:
There are two JSON-based formats, GeoJSON and TopoJSON. The GeoJSON format defines a schema used to represent spatial data as JSON data. JSON looks a lot like JavaScript object literals, but it has specific rules for formatting. The main differences between JSON and JavaScript object literals are:
- JSON strings, including object property keys, must be wrapped with the double quote character
- Property values in JSON may only be JSON objects, arrays, strings, numbers, and Boolean values
- JSON may only contain one top-level thing and it must be either an object or an array
To find out more about the JSON format, see http://www.json.org.
A GeoJSON file may contain either a Feature or FeatureCollection. A Feature is represented in JSON as an object with three keys: type, geometry, and properties. The type is always "Feature". The geometry is an object with a type and coordinates, where the type can be one of "Point", "MultiPoint", "LineString", "MultiLineString", "Polygon", "MultiPolygon", or "GeometryCollection", and the coordinates are an array containing the coordinates in a structure dependency on the type. The properties key is an object that contains keys and values representing nonspatial data associated with the feature.
A FeatureCollection is represented as an object containing two keys: type and features. The type is always "FeatureCollection" and features is an array of GeoJSON features structured as in the preceding paragraph.
An example of a Feature looks like the following:
{
  "type": "Feature",
  "geometry": {
    "type": "Point",
    "coordinates": [125.6, 10.1]
  },
  "properties": {
    "name": "Dinagat Islands"
  }
}
A FeatureCollection looks like the following:
{ "type": "FeatureCollection",
  "features": [
  { "type": "Feature",
    "geometry": {"type": "Point", "coordinates": [102.0, 0.5]},
    "properties": {"prop0": "value0"}
  },
  { "type": "Feature",
    "geometry": {
      "type": "LineString",
      "coordinates": [ [102.0, 0.0], [103.0, 1.0], [104.0, 0.0], [105.0, 1.0] ]
    },
    "properties": {
      "prop0": "value0",
      "prop1": 0.0
    }
  },
  { "type": "Feature",
    "geometry": {
      "type": "Polygon",
      "coordinates": [ [ [100.0, 0.0], [101.0, 0.0], [101.0, 1.0],[100.0, 1.0], [100.0, 0.0] ] ]
    },
    "properties": {
      "prop0": "value0",
      "prop1": {"this": "that"}
    }
  }
  ]
}
As you might imagine, this structure is quite easy to use with JavaScript applications and GeoJSON is a popular format for web mapping applications. Read more about this format at http://geojson.org.
The TopoJSON format is an extension of the GeoJSON format that encodes topology. A discussion of topology is beyond the scope of this book; briefly, topology defines rules for representing spatial features in a region. The most common example of this is adjacent polygons sharing a common border. Topological rules require two adjacent polygons sharing a common boundary will share the points that define the common boundary between them such that moving one point changes the boundary of both polygons simultaneously. You can find out more about the TopoJSON format at https://github.com/mbostock/topojson.
The XML formats are based on XML, a metalanguage that describes structured content using tags denoted by the < and > signs. HTML, which we've seen many times in this book already, looks like XML, and the tags in HTML instruct a web browser how to render the page.
Note
Most HTML is not valid XML. HTML does not follow the strict formatting rules required by XML— particularly, there are many tags in HTML that do not require a closing tag. The <img> tag is an example of this. There is a variant of HTML, called XHTML, that defines a valid XML schema for HTML. While there are some advantages to using XHTML, it has not gained widespread adoption because it is more work for developers to ensure a valid document and the perceived benefits are low.
Structured documents based on XML have a specific set of tags and a set of rules on tag content and nesting. Collectively, the tags and rules are called a schema. There are several geospatial formats based on XML and each defines a specific schema. The schema allows developers to write code to parse the spatial information out of the structured document in the same way that the GeoJSON format proscribes a specific JSON object structure.
The XML-based formats are GML, GPX, KML, OSM XML, and WFS. Let's describe each briefly:
- GML (Geography Markup Language): This is based on a standard published by the Open Geospatial Consortium. This standard was developed in collaboration with many companies that were interested in developing a standard format for describing geospatial information to facilitate exchange of data between different proprietary and open source systems. While GML is very expressive and represents a wide range of geospatial data, it is also quite complicated to support consuming GML as there are several versions and vendor-specific extensions to the schema.
- GPX (GPS Exchange Format): This is a schema supported by many GPS vendors as a common format for representing data generated by GPS devices. Its primary purpose is to describe routes, tracks, and waypoints in a vendor-neutral way. In addition to geographic locations, it can store time, speed, and elevation data.
- KML (Keyhole Markup Language): This was popularized by Google as the format for representing spatial data rendered in Google Earth. It is less expressive than GML, but contains additional information about how to view the data it represents.
- OSM XML (OpenStreetMap XML): This schema is used for representing the core data structures in the OpenStreetMap system, particularly nodes, ways, and relations.
While all the formats we've discussed so far can be represented in a plain text file, the text formats differ in that they are not based on standard representation. Rather, they define their own unique structure. There are currently two text formats supported by OpenLayers—IGC and WKT.
- ICG (International Gliding Commission): This format is a specification produced for recording glider flight information. Unless you are part of the gliding community, you probably won't have much need for this format. It is part of OpenLayers, partly because someone had an interest in it and contributed the code, and partly as an example of implementing support for text-based formats. There is an sample IGC file included in assets/data if you are interested.
- WKT (Well Known Text): This is a standard first developed by the Open Geospatial Consortium. It has since been expanded and included in ISO (International Standards Organisation) 13249-3:2011. The WKT format is well supported by many open source and commercial GIS applications.
Now, we know something about formats, let's look at the next class in the vector source hierarchy—StaticVector. OpenLayers provides the StaticVector source and some format-specific subclasses designed to simplify loading vector features from the supported formats. They are as follows:
ol.source.GeoJSONol.source.TopoJSONol.source.GMLol.source.GPXol.source.KMLol.source.OSMXMLol.source.IGCol.source.WKT
Each of these is a vector source that works in exactly the same way, the only difference between them is the format they use internally to read features.
The StaticVector source, as the name suggests, loads a set of vector features from a source that does not change. This means the features are loaded, and parsed, just once, The actual features in the source never change in response to panning or zooming. In all other respects, the StaticVector source works in the same way as the other vector sources.
You can create an instance of StaticVector directly and pass it a format and a source of data, or you can use one of the format-specific subclasses. Let's look first at creating StaticVector instance. Note that several of the options only apply for particular formats, as noted in the description.
Note
It is worth emphasizing at this point that for all the OpenLayers formats, the data stored in files are actually text files. Loading these files in a browser will result in the data being loaded as a JavaScript string. Some libraries will automatically convert data from its text-based representation into another type of object for you. For instance, loading XML data from a text file will often give you a reference to a Document Object after it is loaded. In OpenLayers, every format supports loading data from a string value, but the string must contain data that is in the structure expected by the format.
The actual format-specific source classes generally work the same way and support only those options that make sense from the StaticVector class. However, there are some important differences that are worth noting. All the following source constructors support the attributions, logo, text, url, and urls options listed in the preceding table. For the sake of brevity, these options have been omitted from the following tables.
The two JSON formats, ol.source.GeoJSON and ol.source.TopoJSON, support the two additional constructor options. These are shown in the following table:
The GPX format constructor has no additional options, but will read data from the node and doc options.
The KML format specification requires that the geometry data for features be represented in EPSG:4326. In addition to supporting the node and doc options, the KML format supports two other options. Refer to the following table:
Time to put our new knowledge into action. There are sample files included with the book's code samples in assets / data in each of the formats discussed earlier. Try adding each of them to a map. Remember, you will need to create an appropriate source and a vector layer, and add the vector layer to the map. As with earlier examples, you should be able to use the url option to load the data without having to load and parse it yourself.
The ServerVector source requests features from a server by sending the geographic coordinates of some region it needs features for to a server. As you might imagine, there are many different ways of doing this based on what a particular server understands. Each server has its own unique language for requesting features. Many servers implement a common language based on an open standard called WFS (Web Feature Service) that can simplify the job. Even so, there are different versions and different flavours of WFS that make it difficult to support them all. To avoid this problem, OpenLayers provides a generic mechanism for requesting features for the ServerVector source; specifically it requires that you implement the loader function yourself!