Table of Contents for
OpenLayers 3 : Beginner's Guide
 OpenLayers 3 : Beginner's Guide
Published by
Packt Publishing, 2015
OpenLayers 3 : Beginner's Guide
Published by
Packt Publishing, 2015
- Cover
- Table of Contents
- OpenLayers 3 Beginner's Guide
- OpenLayers 3 Beginner's Guide
- Credits
- About the Authors
- About the Reviewers
- www.PacktPub.com
- Preface
- What you need for this book
- Who this book is for
- Sections
- Time for action – heading
- Conventions
- Reader feedback
- Customer support
- 1. Getting Started with OpenLayers
- Advantages of using OpenLayers
- What, technically, is OpenLayers?
- Anatomy of a web mapping application
- Connecting to Google, Bing Maps, and other mapping APIs
- Time for action – downloading OpenLayers
- Time for action – creating your first map
- Where to go for help
- OpenLayers issues
- OpenLayers source code repository
- Getting live news from RSS and social networks
- Summary
- 2. Key Concepts in OpenLayers
- Time for action – creating a map
- Time for action – using the JavaScript console
- Time for action – overlaying information
- OpenLayers' super classes
- Key-Value Observing with the Object class
- Time for action – using bindTo
- Working with collections
- Summary
- 3. Charting the Map Class
- Time for action – creating a map
- Map renderers
- Time for action – rendering a masterpiece
- Map properties
- Time for action – target practice
- Map methods
- Time for action – creating animated maps
- Events
- Views
- Time for action – linking two views
- Summary
- 4. Interacting with Raster Data Source
- Layers in OpenLayers 3
- Common operations on layers
- Time for action – changing layer properties
- Tiled versus untiled layers
- Types of raster sources
- Tiled images' layers and their sources
- Time for action – creating a Stamen layer
- Time for action – creating a Bing Maps layer
- Time for action – creating tiles and adding Zoomify layer
- Image layers and their sources
- Using Spherical Mercator raster data with other layers
- Time For action – playing with various sources and layers together
- Time For action – applying Zoomify sample knowledge to a single raw image
- Summary
- 5. Using Vector Layers
- Time for action – creating a vector layer
- How the vector layer works
- The vector layer class
- Vector sources
- Time for action – using the cluster source
- Time for action – creating a loader function
- Time for action – working with the TileVector source
- Time for action – a drag and drop viewer for vector files
- Features and geometries
- Time for action – geometries in action
- Time for action – interacting with features
- Summary
- 6. Styling Vector Layers
- Time for action – basic styling
- The style class
- Time for action – using the icon style
- Have a go hero – using the circle style
- Multiple styles
- Time for action – using multiple styles
- Style functions
- Time for action – using properties to style features
- Interactive styles
- Time for action – creating interactive styles
- Summary
- 7. Wrapping Our Heads Around Projections
- Time for action – using different projection codes
- Time for action – determining coordinates
- OpenLayers projection class
- Transforming coordinates
- Time for action – coordinate transforms
- Time for action – setting up Proj4js.org
- Time for action – reprojecting extent
- Time for action – using custom projection with WMS sources
- Time for action – reprojecting geometries in vector layers
- Summary
- 8. Interacting with Your Map
- Time for action – converting your local or national authorities data into web mapping formats
- Time for action – testing the use cases for ol.interaction.Select
- Time for action – more options with ol.interaction.Select
- Introducing methods to get information from your map
- Time for action – understanding the forEachFeatureAtPixel method
- Time for action – understanding the getGetFeatureInfoUrl method
- Adding a pop-up on your map
- Time for action – introducing ol.Overlay with a static example
- Time for action – using ol.Overlay dynamically with layers information
- Time for action – using ol.interaction.Draw to share new information on the Web
- Time for action – using ol.interaction.Modify to update drawing
- Understanding interactions and their architecture
- Time for action – configuring default interactions
- Discovering the other interactions
- Time for action – using ol.interaction.DragRotateAndZoom
- Time for action – making rectangle export to GeoJSON with ol.interaction.DragBox
- Summary
- 9. Taking Control of Controls
- Adding controls to your map
- Time for action – starting with the default controls
- Controls overview
- Time for action – changing the default attribution styles
- Time for action – finding your mouse position
- Time for action – configuring ZoomToExtent and manipulate controls
- Creating a custom control
- Time for action – extending ol.control.Control to make your own control
- Summary
- 10. OpenLayers Goes Mobile
- Using a web server
- Time for action – go mobile!
- The Geolocation class
- Time for action – location, location, location
- The DeviceOrientation class
- Time for action – a sense of direction
- Debugging mobile web applications
- Debugging on iOS
- Debugging on Android
- Going offline
- Time for action – MANIFEST destiny
- Going native with web applications
- Time for action – track me
- Summary
- 11. Creating Web Map Apps
- Using geospatial data from Flickr
- Time for action – getting Flickr data
- A simple application
- Time for Action – adding data to your map
- Styling the features
- Time for action – creating a style function
- Creating a thumbnail style
- Time for action – switching to JSON data
- Time for action – creating a thumbnail style
- Turning our example into an application
- Time for action – adding the select interaction
- Time for action – handling selection events
- Time for action – displaying photo information
- Using real time data
- Time for action – getting dynamic data
- Wrapping up the application
- Time for action – adding dynamic tags to your map
- Deploying an application
- Creating custom builds
- Creating a combined build
- Time for action – creating a combined build
- Creating a separate build
- Time for action – creating a separate build
- Summary
- A. Object-oriented Programming – Introduction and Concepts
- Going further
- B. More details on Closure Tools and Code Optimization Techniques
- Introducing Closure Library, yet another JavaScript library
- Time for action – first steps with Closure Library
- Making custom build for optimizing performance
- Time for action – playing with Closure Compiler
- Applying your knowledge to the OpenLayers case
- Time for action - running official examples with the internal OpenLayers toolkit
- Time for action - building your custom OpenLayers library
- Syntax and styles
- Time for action – using Closure Linter to fix JavaScript
- Summary
- C. Squashing Bugs with Web Debuggers
- Time for action – opening Chrome Developer Tools
- Explaining Chrome Developer debugging controls
- Time for action – using DOM manipulation with OpenStreetMap map images
- Time for action – using breakpoints to explore your code
- Time for action – playing with zoom button and map copyrights
- Using the Console panel
- Time for action – executing code in the Console
- Time for action – creating object literals
- Time for action – interacting with a map
- Improving Chrome and Developer Tools with extensions
- Debugging in other browsers
- Summary
- D. Pop Quiz Answers
- Chapter 5, Using Vector Layers
- Chapter 7, Wrapping Our Heads Around Projections
- Chapter 8, Interacting with Your Map
- Chapter 9, Taking Control of Controls
- Chapter 10, OpenLayers Goes Mobile
- Appendix B, More details on Closure Tools and Code Optimization Techniques
- Appendix C, Squashing Bugs with Web Debuggers
- Index
Now we have the knowledge we need to build our final example. We will add some interactivity to our countries layer by highlighting the country under the mouse with a different style—specifically, we will:
- Draw the highlighted country with a red outline and semitransparent fill
- Draw an icon at the center of the highlighted country representing its flag
- Draw the country's name next to the flag
- First, we'll need a new file. Let's start again with the basic country vector layer:
var countries = new ol.layer.Vector({ source: new ol.source.GeoJSON({ projection: 'EPSG:3857', url: '../assets/data/countries.geojson' }) }); var center = ol.proj.transform([0, 0], 'EPSG:4326', 'EPSG:3857'); var view = new ol.View({ center: center, zoom: 1, }); var map = new ol.Map({ target: 'map', layers: [countries], view: view }); - Next, we'll set up some styles for our highlighted features. This code can go right after the map is defined. Don't worry if you don't remember what everything does—we'll review the code at the end:
var baseTextStyle = { font: '12px Calibri,sans-serif', textAlign: 'center', offsetY: -15, fill: new ol.style.Fill({ color: [0,0,0,1] }), stroke: new ol.style.Stroke({ color: [255,255,255,0.5] width: 4 }) }; var highlightStyle = new ol.style.Style({ stroke: new ol.style.Stroke({ color: [255,0,0,0.6], width: 2 }), fill: new ol.style.Fill({ color: [255,0,0,0.2] }), zIndex: 1 }); - We'll be using a style function with our feature overlay because we need to dynamically create styles for the feature being rendered:
function styleFunction(feature, resolution) { var style; var geom = feature.getGeometry(); if (geom.getType() == 'Point') { var text = feature.get('text'); baseTextStyle.text = text; var isoCode = feature.get('isoCode').toLowerCase(); style = new ol.style.Style({ text: new ol.style.Text(baseTextStyle), image: new ol.style.Icon({ src: '../assets/img/flags/'+isoCode+'.png' }), zIndex: 2 }); } else { style = highlightStyle; } return [style]; } - We also need to create the feature overlay itself. It's pretty straightforward as the style function is doing all the work for us:
var featureOverlay = new ol.FeatureOverlay({ map: map, style: styleFunction }); - Finally, the interactive part. We'll add a handler for the map's
pointermoveevent and manage the features in our feature overlay based on where the mouse is. This is a pretty big function that exercises our knowledge of geometries from the previous chapter:map.on('pointermove', function(browserEvent) { featureOverlay.getFeatures().clear(); var coordinate = browserEvent.coordinate; var pixel = browserEvent.pixel; map.forEachFeatureAtPixel(pixel, function(feature, layer) { if (!layer) { return; // ignore features on the overlay } var geometry = feature.getGeometry(); var point; switch (geometry.getType()) { case 'MultiPolygon': var poly = geometry.getPolygons().reduce(function(left, right) { return left.getArea() > right.getArea() ? left : right; }); point = poly.getInteriorPoint().getCoordinates(); break; case 'Polygon': point = geometry.getInteriorPoint().getCoordinates(); break; default: point = geometry.getClosestPoint(coordinate); } textFeature = new ol.Feature({ geometry: new ol.geom.Point(point), text: feature.get('name'), isoCode: feature.get('iso_a2').toLowerCase() }); featureOverlay.addFeature(textFeature); featureOverlay.addFeature(feature); }); } - Load this in your browser and try it out! You should see something like the following screenshot when you move the mouse over a country:
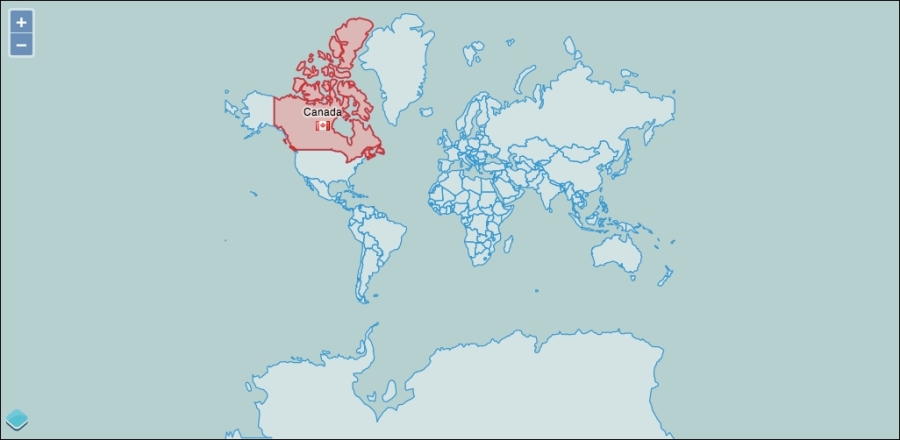
As you can see, feature overlays make it very simple to create an interactive experience with vector layers. There are a few new concepts in this example, as well as some old ones, so let's review the code step by step.
Step 1 should be pretty familiar to you now—we are creating a vector layer with a GeoJSON source, and adding it to a map with a view centered on 0,0.
In step 2, we set up some styles for our feature overlay to use. There are two styles—one for text and one for polygon highlighting. Notice that the baseTextStyle is an object literal, not a new instance of ol.style.Text. When you create an instance of ol.style.Text, the text to be drawn needs to be passed to that object and you can't change the text after it has been created. The style function allows us to create text styles with the text of the current feature, but we'll need to specify the other options. Since all labels will share the other text options, we can set them up once and just refer to them later in the style function. The options we've specified here are to center align the text, offset it up by 15 pixels (recall that a positive offsetY moves the text down), and provide a fill and stroke color. For the text, the stroke is rendered around the outside of each character so we set a wide, semitransparent stroke to make the text stand out from the map beneath it.
The highlightStyle is straightforward— a fill and stroke style for the highlighted polygon.
The style function needs to be defined before we can use it to create the feature overlay, so in step 3, we defined it. Recall that the style function receives the feature being rendered as the first argument. We drew two types of features, points, and polygons, with two different styles. So, the first thing we did was get the feature's geometry and check to see whether it was a point. If it is a point, we create a new text style and a new icon style specific to the current feature. We got the feature's text property and combined it with the baseTextStyle object to create the text style. Next, we got the isoCode property and used it to create a URL to the flag for the country (the flag icons are conveniently named using the two-letter ISO country code) for a new icon style. Then, we created a new style object for the current feature. If the feature is a polygon, it's much simpler—all we need to do is return the highlightStyle object. Finally, we returned an array containing the style (recall that style functions are required to return arrays for performance reasons).
Step 4, by comparison, was very short! We created a new feature overlay and configured it with the map object and style function. It's really the style function, and step 5, that do all the work.
Step 5 added a handler for the map's pointermove event; so, we could find the feature closest to the mouse and add it to the feature overlay. We actually wanted to highlight two features— the polygon itself and a point at the center of the polygon. It turns out that getting this center point is a bit tricky. Let's review the code carefully.
Line 1 of code in the handler clears any existing features in the feature overlay. It is much easier to retrieve the collection and clear it than to remove individual features in our case.
The browserEvent object provides us with the map coordinate and pixel that the event happened at. We used the pixel location with ol.Map classes forEachFeatureAtPixel function on the next line to retrieve all features at that location from our vector layer. This function invokes a callback function for every feature at the pixel location, providing both the feature and the layer that the feature was found on. The layer parameter may be null if the feature was found on a FeatureOverlay.
Inside our callback function, we tested first to see if the feature was actually on a layer before proceeding. Then we needed to find both the geometry and the center point of the geometry. If all the country features were polygons, we could simply call getInteriorPoint() to retrieve the center and we would be done. Unfortunately, we didn't know what type of features we were dealing with—some of the features in the country data were actually MultiPolygons, and we needed to handle them differently. The switch statement chooses a path based on the type of the feature. Let's look at each case separately.
The first case was for MultiPolygon. As the name suggests, a MultiPolygon class contains multiple polygons (a country and some islands perhaps) and there isn't a convenient way to determine the center of a group of polygons. Instead, a MultiPolygon class has several centers, one for each of its constituent polygons. The getInteriorPoints() method returns the center points for us. We only really wanted a single label though. One way is to get all the interior points and use the first one. The problem with this approach is that there is no particular order to the polygons, and it looks odd to label some random island off the coast rather than the major landmass of a given country. To get around this, we wanted our label to appear at the center of the largest polygon. To get the largest polygon, we first got the array of polygons and then reduced that array to a single value with a function that compared two polygons based on their area. The reduce method is a standard method of JavaScript arrays. Once we've found the largest polygon, we can ask for its interior point.
The second case is for polygon, and was much simpler— we just needed the interior point of the polygon and we were done!
The final case was the default case. While it isn't strictly needed, it is good practice to include a default case in switch statements. The getClosestPoint() method is available on all geometry types and is a safe fallback for our default case.
Now that we had a point coordinate at the best location we could determine for the feature under the mouse, we created a new Feature and provided the point geometry for its location. We also added two properties—text (that we displayed at the point) and isoCode (that we will use to find the flag icon for the country).
Finally, we added both features to the feature overlay so that when the map is next rendered, the country under the mouse will be highlighted in red and display the flag and country name at the center.