Table of Contents for
OpenLayers 3 : Beginner's Guide
 OpenLayers 3 : Beginner's Guide
Published by
Packt Publishing, 2015
OpenLayers 3 : Beginner's Guide
Published by
Packt Publishing, 2015
- Cover
- Table of Contents
- OpenLayers 3 Beginner's Guide
- OpenLayers 3 Beginner's Guide
- Credits
- About the Authors
- About the Reviewers
- www.PacktPub.com
- Preface
- What you need for this book
- Who this book is for
- Sections
- Time for action – heading
- Conventions
- Reader feedback
- Customer support
- 1. Getting Started with OpenLayers
- Advantages of using OpenLayers
- What, technically, is OpenLayers?
- Anatomy of a web mapping application
- Connecting to Google, Bing Maps, and other mapping APIs
- Time for action – downloading OpenLayers
- Time for action – creating your first map
- Where to go for help
- OpenLayers issues
- OpenLayers source code repository
- Getting live news from RSS and social networks
- Summary
- 2. Key Concepts in OpenLayers
- Time for action – creating a map
- Time for action – using the JavaScript console
- Time for action – overlaying information
- OpenLayers' super classes
- Key-Value Observing with the Object class
- Time for action – using bindTo
- Working with collections
- Summary
- 3. Charting the Map Class
- Time for action – creating a map
- Map renderers
- Time for action – rendering a masterpiece
- Map properties
- Time for action – target practice
- Map methods
- Time for action – creating animated maps
- Events
- Views
- Time for action – linking two views
- Summary
- 4. Interacting with Raster Data Source
- Layers in OpenLayers 3
- Common operations on layers
- Time for action – changing layer properties
- Tiled versus untiled layers
- Types of raster sources
- Tiled images' layers and their sources
- Time for action – creating a Stamen layer
- Time for action – creating a Bing Maps layer
- Time for action – creating tiles and adding Zoomify layer
- Image layers and their sources
- Using Spherical Mercator raster data with other layers
- Time For action – playing with various sources and layers together
- Time For action – applying Zoomify sample knowledge to a single raw image
- Summary
- 5. Using Vector Layers
- Time for action – creating a vector layer
- How the vector layer works
- The vector layer class
- Vector sources
- Time for action – using the cluster source
- Time for action – creating a loader function
- Time for action – working with the TileVector source
- Time for action – a drag and drop viewer for vector files
- Features and geometries
- Time for action – geometries in action
- Time for action – interacting with features
- Summary
- 6. Styling Vector Layers
- Time for action – basic styling
- The style class
- Time for action – using the icon style
- Have a go hero – using the circle style
- Multiple styles
- Time for action – using multiple styles
- Style functions
- Time for action – using properties to style features
- Interactive styles
- Time for action – creating interactive styles
- Summary
- 7. Wrapping Our Heads Around Projections
- Time for action – using different projection codes
- Time for action – determining coordinates
- OpenLayers projection class
- Transforming coordinates
- Time for action – coordinate transforms
- Time for action – setting up Proj4js.org
- Time for action – reprojecting extent
- Time for action – using custom projection with WMS sources
- Time for action – reprojecting geometries in vector layers
- Summary
- 8. Interacting with Your Map
- Time for action – converting your local or national authorities data into web mapping formats
- Time for action – testing the use cases for ol.interaction.Select
- Time for action – more options with ol.interaction.Select
- Introducing methods to get information from your map
- Time for action – understanding the forEachFeatureAtPixel method
- Time for action – understanding the getGetFeatureInfoUrl method
- Adding a pop-up on your map
- Time for action – introducing ol.Overlay with a static example
- Time for action – using ol.Overlay dynamically with layers information
- Time for action – using ol.interaction.Draw to share new information on the Web
- Time for action – using ol.interaction.Modify to update drawing
- Understanding interactions and their architecture
- Time for action – configuring default interactions
- Discovering the other interactions
- Time for action – using ol.interaction.DragRotateAndZoom
- Time for action – making rectangle export to GeoJSON with ol.interaction.DragBox
- Summary
- 9. Taking Control of Controls
- Adding controls to your map
- Time for action – starting with the default controls
- Controls overview
- Time for action – changing the default attribution styles
- Time for action – finding your mouse position
- Time for action – configuring ZoomToExtent and manipulate controls
- Creating a custom control
- Time for action – extending ol.control.Control to make your own control
- Summary
- 10. OpenLayers Goes Mobile
- Using a web server
- Time for action – go mobile!
- The Geolocation class
- Time for action – location, location, location
- The DeviceOrientation class
- Time for action – a sense of direction
- Debugging mobile web applications
- Debugging on iOS
- Debugging on Android
- Going offline
- Time for action – MANIFEST destiny
- Going native with web applications
- Time for action – track me
- Summary
- 11. Creating Web Map Apps
- Using geospatial data from Flickr
- Time for action – getting Flickr data
- A simple application
- Time for Action – adding data to your map
- Styling the features
- Time for action – creating a style function
- Creating a thumbnail style
- Time for action – switching to JSON data
- Time for action – creating a thumbnail style
- Turning our example into an application
- Time for action – adding the select interaction
- Time for action – handling selection events
- Time for action – displaying photo information
- Using real time data
- Time for action – getting dynamic data
- Wrapping up the application
- Time for action – adding dynamic tags to your map
- Deploying an application
- Creating custom builds
- Creating a combined build
- Time for action – creating a combined build
- Creating a separate build
- Time for action – creating a separate build
- Summary
- A. Object-oriented Programming – Introduction and Concepts
- Going further
- B. More details on Closure Tools and Code Optimization Techniques
- Introducing Closure Library, yet another JavaScript library
- Time for action – first steps with Closure Library
- Making custom build for optimizing performance
- Time for action – playing with Closure Compiler
- Applying your knowledge to the OpenLayers case
- Time for action - running official examples with the internal OpenLayers toolkit
- Time for action - building your custom OpenLayers library
- Syntax and styles
- Time for action – using Closure Linter to fix JavaScript
- Summary
- C. Squashing Bugs with Web Debuggers
- Time for action – opening Chrome Developer Tools
- Explaining Chrome Developer debugging controls
- Time for action – using DOM manipulation with OpenStreetMap map images
- Time for action – using breakpoints to explore your code
- Time for action – playing with zoom button and map copyrights
- Using the Console panel
- Time for action – executing code in the Console
- Time for action – creating object literals
- Time for action – interacting with a map
- Improving Chrome and Developer Tools with extensions
- Debugging in other browsers
- Summary
- D. Pop Quiz Answers
- Chapter 5, Using Vector Layers
- Chapter 7, Wrapping Our Heads Around Projections
- Chapter 8, Interacting with Your Map
- Chapter 9, Taking Control of Controls
- Chapter 10, OpenLayers Goes Mobile
- Appendix B, More details on Closure Tools and Code Optimization Techniques
- Appendix C, Squashing Bugs with Web Debuggers
- Index
In the previous example, we added an overlay but we didn't really investigate how it behaves. Let's do something a bit more interesting with overlays to illustrate what they do. In this example, we'll build an OpenLayers application that displays the latitude and longitude of the mouse position in an overlay when you click on the map:
- Create a new file called
overlay.htmlin thesandboxdirectory. Add the standard boilerplate content to get started:<!doctype html> <html> <head> <title>OpenLayers Overlays</title> <link rel="stylesheet" href="../assets/ol3/css/ol.css" type="text/css" /> <link rel="stylesheet" href="../assets/css/samples.css" type="text/css" /> </head> <body> <div id="map" class="map"></div> <script src="../assets/ol3/js/ol.js"></script> <script> </script> </body> </html> - Now, add the following code to set up a simple map with the OpenStreetMap data.
var layer = new ol.layer.Tile({ source: new ol.source.OSM() }); var center = ol.proj.transform([-1.812, 52.443], 'EPSG:4326', 'EPSG:3857'); var view = new ol.View({ center: center, zoom: 6 }); var map = new ol.Map({ target: 'map', layers: [layer], view: view }); - We'll create an overlay object to display when the user clicks on the map. We will need an HTML element; so, add the following line of code right after Map's
<div>element. You can change the style of the element if you wish:<div id="overlay" style="background-color: white; border-radius: 10px; border: 1px solid black; padding: 5px 10px;">
- The overlay object itself is pretty simple. Add this at the end, after creating the
Mapclass:var overlay = new ol.Overlay({ element: document.getElementById('overlay'), positioning: 'bottom-center' }); - Now, we need to respond to the user clicking on the map by updating the content of our overlay and adding it to the map at the correct position. Put the following code snippet in the overlay:
map.on('click', function(event) { var coord = event.coordinate; var degrees = ol.proj.transform(coord, 'EPSG:3857', 'EPSG:4326') var hdms = ol.coordinate.toStringHDMS(degrees); var element = overlay.getElement(); element.innerHTML = hdms; overlay.setPosition(coord); map.addOverlay(overlay); }); - The result should look something like this, depending on where you click! After clicking on the map, try panning or zooming the map and notice how the overlay stays in the same geographic location (it moves with the map).
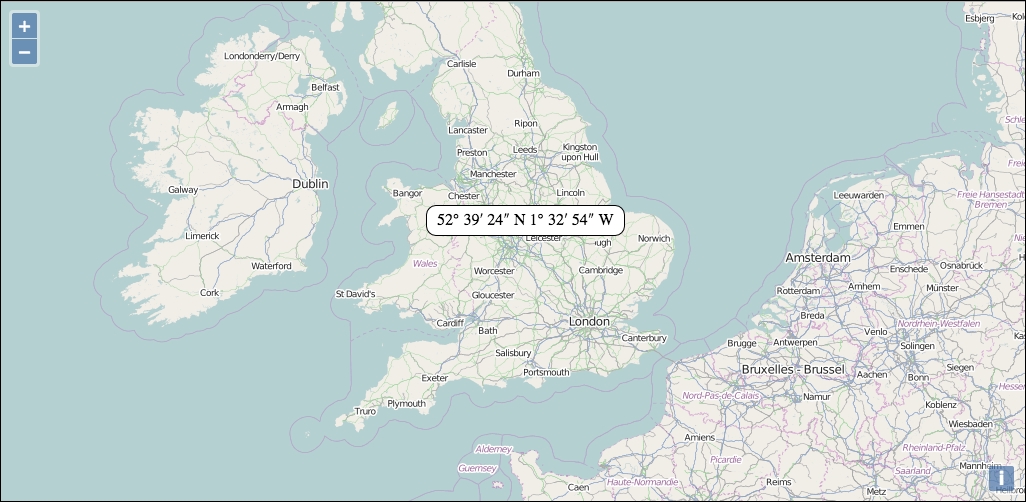
In this example, we illustrated how an overlay is positioned at a geographic location on the map, how it moves with the map to stay at that same location, and how it can be used to display information about some location.
After setting up the boilerplate HTML structure for the page, we added a raster layer with the OpenStreetMap data, a view, and a map to the application. We then created an overlay object pointing at an HTML element for content and with the positioning set to 'bottom-center', which tells OpenLayers to align the bottom, center of the HTML element with the geographic position of the overlay. This means that the overlay will appear above the location, centered on it.
The last step was to register an event handler (more on events later in this chapter) for the map's click event. When the user clicks on the map, the event handler function is called with an event object that contains coordinate (the geographic position) of the click on the map. We transform the coordinate from the map's projection into decimal degrees (longitude and latitude values) and use a helper function in the OpenLayers library to format this into degrees minutes and seconds (a standard way of representing geographic location in human readable form). We then update the content of our overlay's HTML element with this information, set the position of the overlay to the coordinate provided with the event, and add it to the map using the addOverlay method.
If some of this seems overwhelming, don't worry, we'll be covering all of this in later chapters.
As mentioned earlier, the two components that allow users to interact with the map are interactions and controls. Let's look at them in a bit more detail.
Interactions are components that allow the user to interact with the map via some direct input, usually by using the mouse (or a finger with a touch screen). Interactions have no visible user interface. The default set of interactions are:
ol.interaction.DoubleClickZoom: If you double-click the left mouse button, the map will zoom in by a factor of 2ol.interaction.DragPan: If you drag the map, it will pan as you move the mouseol.interaction.PinchRotate: On touch-enabled devices, placing two fingers on the device and rotating them in a circular motion will rotate the mapol.interaction.PinchZoom: On touch-enabled devices, placing two fingers on the device and pinching them together or spreading them apart will zoom the map out and in respectivelyol.interaction.KeyboardPan: You can use the arrow keys to pan the map in the direction of the arrowsol.interaction.KeyboardZoom: You can use the + and – keys to zoom in and outol.interaction.MouseWheelZoom: You can use the scroll wheel on a mouse to zoom the map in and outol.interaction.DragZoom: If you hold the Shift key while dragging on map, a rectangular region will be drawn and when you release the mouse button, you will zoom into that area.
We will discuss interactions in detail in Chapter 8, Interacting with Your Map.
Controls are components that allow the user to modify the map state via some visible user interface element, such as a button. In the examples we've seen so far, we've seen zoom buttons in the top-left corner of the map and an attribution control in the bottom-right corner of the map. In fact, the default controls are:
ol.control.Zoom: This displays the zoom buttons in the top-left corner.ol.control.Rotate: This is a button to reset rotation to 0; by default, this is only displayed when the map's rotation is not 0.- The
ol.control.Attribution: This displays attribution text for the layers currently visible in the map. By default, the attributions are collapsed to a single icon in the bottom-right corner and clicking the icon will show the attributions.
We will discuss these controls and more in detail in Chapter 9, Taking Control of Controls.
This concludes our brief overview of the central components of an OpenLayers application. We saw that the Map class is at the center of everything and there are some key components—the view, layers, overlays, interactions, and controls—that it uses to accomplish its job of putting an interactive map onto a web page. At the beginning of this chapter, we talked about both relationships and inheritance. So far, we've only covered the relationships. In the next section, we'll show the inheritance architecture of the key components and introduce three classes that have been working behind the scenes to make everything work.