Table of Contents for
OpenLayers 3 : Beginner's Guide
 OpenLayers 3 : Beginner's Guide
Published by
Packt Publishing, 2015
OpenLayers 3 : Beginner's Guide
Published by
Packt Publishing, 2015
- Cover
- Table of Contents
- OpenLayers 3 Beginner's Guide
- OpenLayers 3 Beginner's Guide
- Credits
- About the Authors
- About the Reviewers
- www.PacktPub.com
- Preface
- What you need for this book
- Who this book is for
- Sections
- Time for action – heading
- Conventions
- Reader feedback
- Customer support
- 1. Getting Started with OpenLayers
- Advantages of using OpenLayers
- What, technically, is OpenLayers?
- Anatomy of a web mapping application
- Connecting to Google, Bing Maps, and other mapping APIs
- Time for action – downloading OpenLayers
- Time for action – creating your first map
- Where to go for help
- OpenLayers issues
- OpenLayers source code repository
- Getting live news from RSS and social networks
- Summary
- 2. Key Concepts in OpenLayers
- Time for action – creating a map
- Time for action – using the JavaScript console
- Time for action – overlaying information
- OpenLayers' super classes
- Key-Value Observing with the Object class
- Time for action – using bindTo
- Working with collections
- Summary
- 3. Charting the Map Class
- Time for action – creating a map
- Map renderers
- Time for action – rendering a masterpiece
- Map properties
- Time for action – target practice
- Map methods
- Time for action – creating animated maps
- Events
- Views
- Time for action – linking two views
- Summary
- 4. Interacting with Raster Data Source
- Layers in OpenLayers 3
- Common operations on layers
- Time for action – changing layer properties
- Tiled versus untiled layers
- Types of raster sources
- Tiled images' layers and their sources
- Time for action – creating a Stamen layer
- Time for action – creating a Bing Maps layer
- Time for action – creating tiles and adding Zoomify layer
- Image layers and their sources
- Using Spherical Mercator raster data with other layers
- Time For action – playing with various sources and layers together
- Time For action – applying Zoomify sample knowledge to a single raw image
- Summary
- 5. Using Vector Layers
- Time for action – creating a vector layer
- How the vector layer works
- The vector layer class
- Vector sources
- Time for action – using the cluster source
- Time for action – creating a loader function
- Time for action – working with the TileVector source
- Time for action – a drag and drop viewer for vector files
- Features and geometries
- Time for action – geometries in action
- Time for action – interacting with features
- Summary
- 6. Styling Vector Layers
- Time for action – basic styling
- The style class
- Time for action – using the icon style
- Have a go hero – using the circle style
- Multiple styles
- Time for action – using multiple styles
- Style functions
- Time for action – using properties to style features
- Interactive styles
- Time for action – creating interactive styles
- Summary
- 7. Wrapping Our Heads Around Projections
- Time for action – using different projection codes
- Time for action – determining coordinates
- OpenLayers projection class
- Transforming coordinates
- Time for action – coordinate transforms
- Time for action – setting up Proj4js.org
- Time for action – reprojecting extent
- Time for action – using custom projection with WMS sources
- Time for action – reprojecting geometries in vector layers
- Summary
- 8. Interacting with Your Map
- Time for action – converting your local or national authorities data into web mapping formats
- Time for action – testing the use cases for ol.interaction.Select
- Time for action – more options with ol.interaction.Select
- Introducing methods to get information from your map
- Time for action – understanding the forEachFeatureAtPixel method
- Time for action – understanding the getGetFeatureInfoUrl method
- Adding a pop-up on your map
- Time for action – introducing ol.Overlay with a static example
- Time for action – using ol.Overlay dynamically with layers information
- Time for action – using ol.interaction.Draw to share new information on the Web
- Time for action – using ol.interaction.Modify to update drawing
- Understanding interactions and their architecture
- Time for action – configuring default interactions
- Discovering the other interactions
- Time for action – using ol.interaction.DragRotateAndZoom
- Time for action – making rectangle export to GeoJSON with ol.interaction.DragBox
- Summary
- 9. Taking Control of Controls
- Adding controls to your map
- Time for action – starting with the default controls
- Controls overview
- Time for action – changing the default attribution styles
- Time for action – finding your mouse position
- Time for action – configuring ZoomToExtent and manipulate controls
- Creating a custom control
- Time for action – extending ol.control.Control to make your own control
- Summary
- 10. OpenLayers Goes Mobile
- Using a web server
- Time for action – go mobile!
- The Geolocation class
- Time for action – location, location, location
- The DeviceOrientation class
- Time for action – a sense of direction
- Debugging mobile web applications
- Debugging on iOS
- Debugging on Android
- Going offline
- Time for action – MANIFEST destiny
- Going native with web applications
- Time for action – track me
- Summary
- 11. Creating Web Map Apps
- Using geospatial data from Flickr
- Time for action – getting Flickr data
- A simple application
- Time for Action – adding data to your map
- Styling the features
- Time for action – creating a style function
- Creating a thumbnail style
- Time for action – switching to JSON data
- Time for action – creating a thumbnail style
- Turning our example into an application
- Time for action – adding the select interaction
- Time for action – handling selection events
- Time for action – displaying photo information
- Using real time data
- Time for action – getting dynamic data
- Wrapping up the application
- Time for action – adding dynamic tags to your map
- Deploying an application
- Creating custom builds
- Creating a combined build
- Time for action – creating a combined build
- Creating a separate build
- Time for action – creating a separate build
- Summary
- A. Object-oriented Programming – Introduction and Concepts
- Going further
- B. More details on Closure Tools and Code Optimization Techniques
- Introducing Closure Library, yet another JavaScript library
- Time for action – first steps with Closure Library
- Making custom build for optimizing performance
- Time for action – playing with Closure Compiler
- Applying your knowledge to the OpenLayers case
- Time for action - running official examples with the internal OpenLayers toolkit
- Time for action - building your custom OpenLayers library
- Syntax and styles
- Time for action – using Closure Linter to fix JavaScript
- Summary
- C. Squashing Bugs with Web Debuggers
- Time for action – opening Chrome Developer Tools
- Explaining Chrome Developer debugging controls
- Time for action – using DOM manipulation with OpenStreetMap map images
- Time for action – using breakpoints to explore your code
- Time for action – playing with zoom button and map copyrights
- Using the Console panel
- Time for action – executing code in the Console
- Time for action – creating object literals
- Time for action – interacting with a map
- Improving Chrome and Developer Tools with extensions
- Debugging in other browsers
- Summary
- D. Pop Quiz Answers
- Chapter 5, Using Vector Layers
- Chapter 7, Wrapping Our Heads Around Projections
- Chapter 8, Interacting with Your Map
- Chapter 9, Taking Control of Controls
- Chapter 10, OpenLayers Goes Mobile
- Appendix B, More details on Closure Tools and Code Optimization Techniques
- Appendix C, Squashing Bugs with Web Debuggers
- Index
Reusing knowledge about OpenLayers renderers from Chapter 3, Charting the Map Class and OpenStreetMap from Chapter 4, Interacting with Raster Data Source, let's review how to manipulate the DOM and changing OpenStreetMap tiles sources on the fly.
So, let's start with the official OpenLayers example from http://openlayers.org/en/v3.0.0/examples/simple.html using Page inspector.
Open the file and at the end of the URL you get from your browser add ?renderer=dom
- Click on the Page Inspector icon (or right-click on image and click Inspect in the menu) and hover over the images. .
- Then, on one of the
imgtags, right-click on Edit attributes, as illustrated in the following screenshot: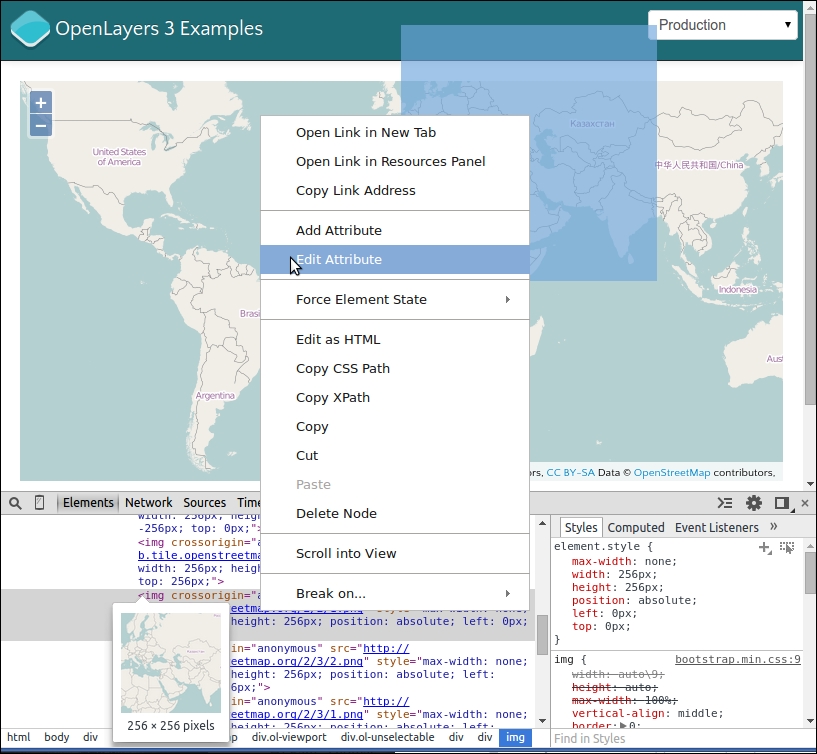
- Next, you will see that you can change the value in our example, http://b.tile.openstreetmap.org/2/2/1.png, of the
srcattribute. So, replace its value with http://tile.stamen.com/toner/2/2/1.png and see the result. In the Elements panel, theimg(for the image tag)srcattribute contains http://b.tile.openstreetmap.org/2/2/1.png. If you remember, URL can be separated in two parts. The first part, http://b.tile.openstreetmap.org/, (called base URL), will change when the second part,2/2/1.png, will change according to images you hover on. Here, we only change the first part. - Repeat the process by changing the image you hover on and the base URL you use. The value you can use for base URL can be http://d.tile.stamen.com/watercolor/, http://b.tile.opencyclemap.org/cycle/, and http://otile2.mqcdn.com/tiles/1.0.0/osm/.
- The result obtained will look like the screenshot that follows:
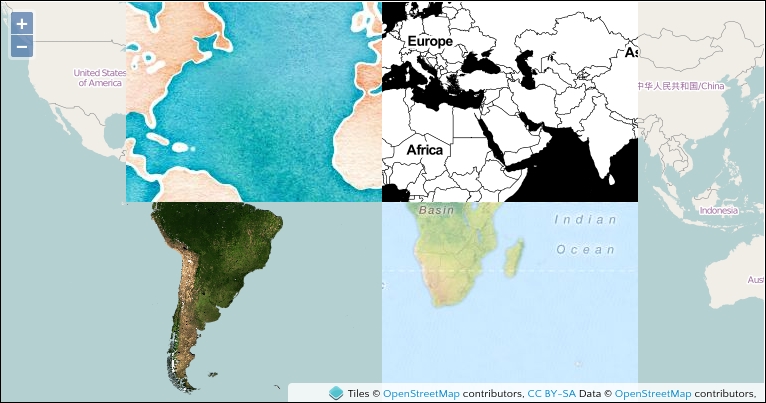
We saw how to modify attributes of HTML elements using the Page Inspector on images. You also saw the correspondence between highlight on the web page and code content in the Elements panel when hovering over. You also rediscovered some different OpenStreetMap backgrounds.
Chrome DevTools's Network panel is a tool we often use throughout this book. It basically provides a way for us to monitor a network activity by viewing all the requests and responses the web page is making. In addition to the initial page load network activity, we are also able to monitor all of the asynchronous JavaScript requests that are made by the web page. Without AJAX, we will have to refresh our entire page any time we want to do anything with our OpenLayers map. So, for example, every time you zoom in, OpenLayers makes a series of requests to the map server to get new map images, and the map server's response is a new map image that OpenLayers then displays. This request/response method is handled via AJAX; without it, we would have to refresh the entire page after every request.
Note
See Appendix B, More details on Closure Tools and Code Optimization Techniques, where a small web history and a diagram covers AJAX.
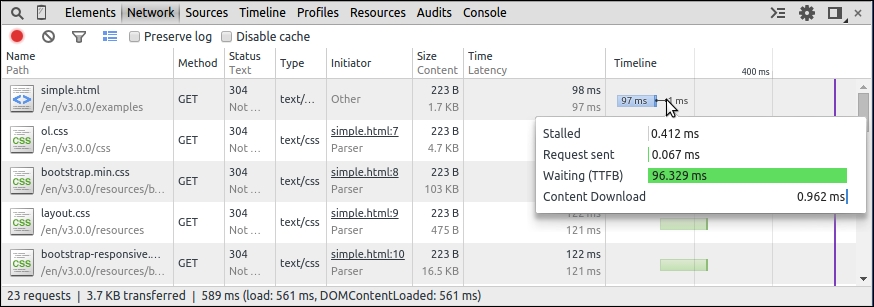
The Network panel allows us to see the URL that is being requested, the GET or POST parameters, the server's status response, the type of resource requested, the size of the response, and the time it took to complete the request. Let's take a look at what the Network panel looks like for the example from the previous official example used when reviewing Elements panel:
Before we talk about the requests being made, take a look at the buttons above the lists of requests—the first one is dedicated to Record Network Log and the second Clear helps you remove the list of network calls. Then, you can activate Filter, which displays a submenu to filter by resources types for example, Documents, Stylesheets, Images, but also by the type of requests such as XHR or WebSockets. The Filter icon also activates a full text search box. The fourth icon is Use small resource rows. The two checkboxes are available, Preserve Log will cause the list of requests to persist, or not get deleted, on page reloads, while Disable cache will not allow you to use cache. For better performances, some assets such as scripts or images can be kept in your browser memory to speed your browsing experience when you visit the same website again. The drawback is when you debug, you can use an outdated file.
Now, let's break down the actual request list.
The request list shows us all the requests the page makes. Each URL in the previous screenshot is a URL that OpenLayers is making a request to. By clicking on each request, we can see more information about the request, including the full request URL and the response. When we are in the Headers sub-tab, we get a Request URL, Request Method, and Status Code, and after we get all details of Request Headers and Response Headers. The Request URL tab gives all the parameters. The Response tab provides us with the server's response to our request:
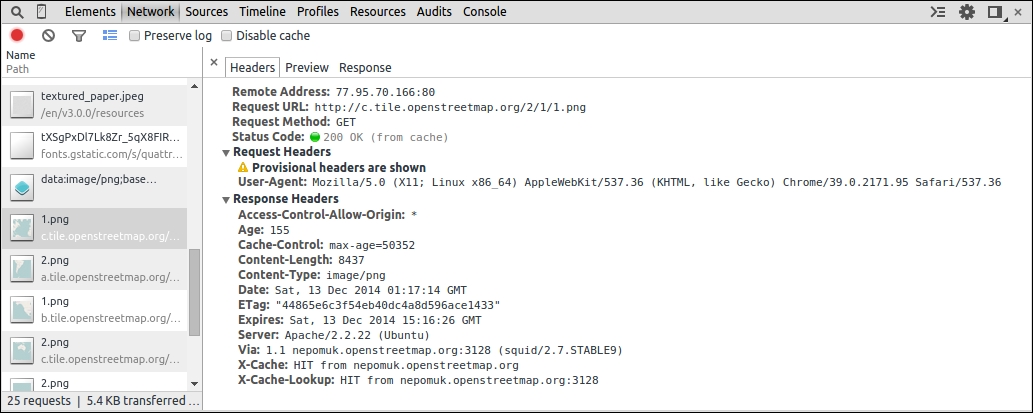
Take a look again at the list—when we look at the first image in the screenshot, the row has the name 1.png. The method, GET in this case, specifies that the request type is GET, which basically means we are embedding variables inside the URL itself, with optional key=value pairs, separated by an & sign.
When we mouse over a URL, we can see more of it; we see the full URL, which may contain a bunch of variables in the key=value&key=value&.... format. In our case, we only have a full URL like http://c.tile.openstreetmap.org/2/1/1.png when hovering.
As we saw in all OpenStreetMap examples through the book, we didn't need parameters. If you remember in Chapter 1, Getting Started with OpenLayers, we told you that OpenLayers consumes cartographic data; some can come from dynamic web mapping server, others from pregenerated data. Our example relies on pregenerated data so that there are no parameters added contrary, for instance, to a WMS data source.
The Sources panel is very powerful. It enables you to view and edit JavaScript and CSS files loaded from the web page. You are not restricted to only view all the JavaScript code associated with the page in this panel; you can use it to do real-time code debugging. You can set watch expressions, view the stack, set breakpoints, and so on. If these terms are foreign, don't worry, we will review some of them.
For example, we want to quickly talk about enabling Pause on exceptions. With this option enabled, Chrome DevTools will stop the web page whenever a JavaScript error is encountered. This makes it very easy to quickly pinpoint where your page is blowing up at. To enable it, simply click on the Pause on exceptions button icon (be careful, it's not the same as an Pause Script Execution icon).
Keep note of this when you enable it. We've been frustrated more than once when developing because we forgot that it had been enabled. When it is enabled, the button isn't gray, as demonstrated with the icon:

Another tip in this panel, is the ability to unminify JavaScript. It's really useful to track errors. You can open a web page with a compressed JavaScript file. If you click on the icon with open/close brackets called Pretty Print, you will see the difference.
You are maybe wondering why we spoke so much about this panel. When you start to make complex web mapping applications, this panel is the best way to analyze how an application works. When you're developing or reusing an already existing code, you can already guess the behavior of the code, but you can't confirm it. The key feature of the debugger is to make this confirmation. Let's see an example of how you can use it.