Table of Contents for
OpenLayers 3 : Beginner's Guide
 OpenLayers 3 : Beginner's Guide
Published by
Packt Publishing, 2015
OpenLayers 3 : Beginner's Guide
Published by
Packt Publishing, 2015
- Cover
- Table of Contents
- OpenLayers 3 Beginner's Guide
- OpenLayers 3 Beginner's Guide
- Credits
- About the Authors
- About the Reviewers
- www.PacktPub.com
- Preface
- What you need for this book
- Who this book is for
- Sections
- Time for action – heading
- Conventions
- Reader feedback
- Customer support
- 1. Getting Started with OpenLayers
- Advantages of using OpenLayers
- What, technically, is OpenLayers?
- Anatomy of a web mapping application
- Connecting to Google, Bing Maps, and other mapping APIs
- Time for action – downloading OpenLayers
- Time for action – creating your first map
- Where to go for help
- OpenLayers issues
- OpenLayers source code repository
- Getting live news from RSS and social networks
- Summary
- 2. Key Concepts in OpenLayers
- Time for action – creating a map
- Time for action – using the JavaScript console
- Time for action – overlaying information
- OpenLayers' super classes
- Key-Value Observing with the Object class
- Time for action – using bindTo
- Working with collections
- Summary
- 3. Charting the Map Class
- Time for action – creating a map
- Map renderers
- Time for action – rendering a masterpiece
- Map properties
- Time for action – target practice
- Map methods
- Time for action – creating animated maps
- Events
- Views
- Time for action – linking two views
- Summary
- 4. Interacting with Raster Data Source
- Layers in OpenLayers 3
- Common operations on layers
- Time for action – changing layer properties
- Tiled versus untiled layers
- Types of raster sources
- Tiled images' layers and their sources
- Time for action – creating a Stamen layer
- Time for action – creating a Bing Maps layer
- Time for action – creating tiles and adding Zoomify layer
- Image layers and their sources
- Using Spherical Mercator raster data with other layers
- Time For action – playing with various sources and layers together
- Time For action – applying Zoomify sample knowledge to a single raw image
- Summary
- 5. Using Vector Layers
- Time for action – creating a vector layer
- How the vector layer works
- The vector layer class
- Vector sources
- Time for action – using the cluster source
- Time for action – creating a loader function
- Time for action – working with the TileVector source
- Time for action – a drag and drop viewer for vector files
- Features and geometries
- Time for action – geometries in action
- Time for action – interacting with features
- Summary
- 6. Styling Vector Layers
- Time for action – basic styling
- The style class
- Time for action – using the icon style
- Have a go hero – using the circle style
- Multiple styles
- Time for action – using multiple styles
- Style functions
- Time for action – using properties to style features
- Interactive styles
- Time for action – creating interactive styles
- Summary
- 7. Wrapping Our Heads Around Projections
- Time for action – using different projection codes
- Time for action – determining coordinates
- OpenLayers projection class
- Transforming coordinates
- Time for action – coordinate transforms
- Time for action – setting up Proj4js.org
- Time for action – reprojecting extent
- Time for action – using custom projection with WMS sources
- Time for action – reprojecting geometries in vector layers
- Summary
- 8. Interacting with Your Map
- Time for action – converting your local or national authorities data into web mapping formats
- Time for action – testing the use cases for ol.interaction.Select
- Time for action – more options with ol.interaction.Select
- Introducing methods to get information from your map
- Time for action – understanding the forEachFeatureAtPixel method
- Time for action – understanding the getGetFeatureInfoUrl method
- Adding a pop-up on your map
- Time for action – introducing ol.Overlay with a static example
- Time for action – using ol.Overlay dynamically with layers information
- Time for action – using ol.interaction.Draw to share new information on the Web
- Time for action – using ol.interaction.Modify to update drawing
- Understanding interactions and their architecture
- Time for action – configuring default interactions
- Discovering the other interactions
- Time for action – using ol.interaction.DragRotateAndZoom
- Time for action – making rectangle export to GeoJSON with ol.interaction.DragBox
- Summary
- 9. Taking Control of Controls
- Adding controls to your map
- Time for action – starting with the default controls
- Controls overview
- Time for action – changing the default attribution styles
- Time for action – finding your mouse position
- Time for action – configuring ZoomToExtent and manipulate controls
- Creating a custom control
- Time for action – extending ol.control.Control to make your own control
- Summary
- 10. OpenLayers Goes Mobile
- Using a web server
- Time for action – go mobile!
- The Geolocation class
- Time for action – location, location, location
- The DeviceOrientation class
- Time for action – a sense of direction
- Debugging mobile web applications
- Debugging on iOS
- Debugging on Android
- Going offline
- Time for action – MANIFEST destiny
- Going native with web applications
- Time for action – track me
- Summary
- 11. Creating Web Map Apps
- Using geospatial data from Flickr
- Time for action – getting Flickr data
- A simple application
- Time for Action – adding data to your map
- Styling the features
- Time for action – creating a style function
- Creating a thumbnail style
- Time for action – switching to JSON data
- Time for action – creating a thumbnail style
- Turning our example into an application
- Time for action – adding the select interaction
- Time for action – handling selection events
- Time for action – displaying photo information
- Using real time data
- Time for action – getting dynamic data
- Wrapping up the application
- Time for action – adding dynamic tags to your map
- Deploying an application
- Creating custom builds
- Creating a combined build
- Time for action – creating a combined build
- Creating a separate build
- Time for action – creating a separate build
- Summary
- A. Object-oriented Programming – Introduction and Concepts
- Going further
- B. More details on Closure Tools and Code Optimization Techniques
- Introducing Closure Library, yet another JavaScript library
- Time for action – first steps with Closure Library
- Making custom build for optimizing performance
- Time for action – playing with Closure Compiler
- Applying your knowledge to the OpenLayers case
- Time for action - running official examples with the internal OpenLayers toolkit
- Time for action - building your custom OpenLayers library
- Syntax and styles
- Time for action – using Closure Linter to fix JavaScript
- Summary
- C. Squashing Bugs with Web Debuggers
- Time for action – opening Chrome Developer Tools
- Explaining Chrome Developer debugging controls
- Time for action – using DOM manipulation with OpenStreetMap map images
- Time for action – using breakpoints to explore your code
- Time for action – playing with zoom button and map copyrights
- Using the Console panel
- Time for action – executing code in the Console
- Time for action – creating object literals
- Time for action – interacting with a map
- Improving Chrome and Developer Tools with extensions
- Debugging in other browsers
- Summary
- D. Pop Quiz Answers
- Chapter 5, Using Vector Layers
- Chapter 7, Wrapping Our Heads Around Projections
- Chapter 8, Interacting with Your Map
- Chapter 9, Taking Control of Controls
- Chapter 10, OpenLayers Goes Mobile
- Appendix B, More details on Closure Tools and Code Optimization Techniques
- Appendix C, Squashing Bugs with Web Debuggers
- Index
During all this chapter, we introduced you to Chrome DevTools. It's one of the most powerful tools for debugging JavaScript applications, but it is important to see the reality of the web market. Just look on this graphic below from StatCounter GlobalStats, http://gs.statcounter.com, that provide statistics from more than 3 million websites.
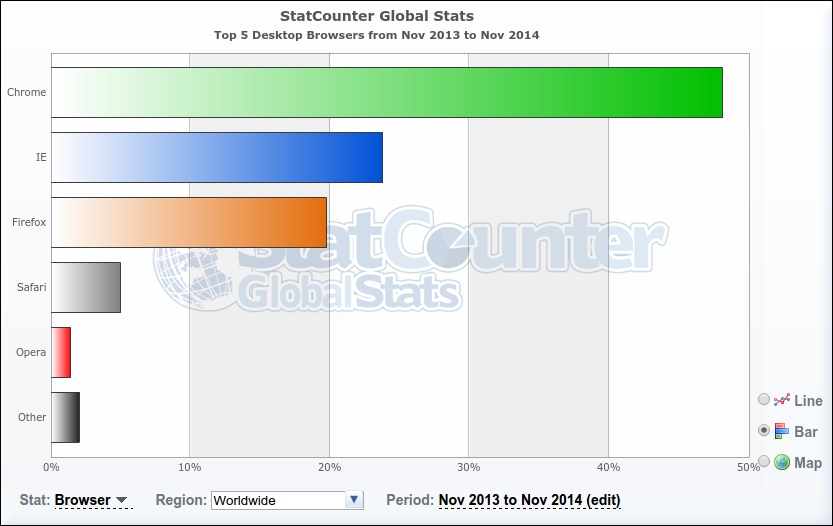
As you see, there exists more than one web browser, and Internet Explorer with Firefox together represents a bit less than 50 percent of the market. It means that your web mapping application must be compliant to those other browsers. Moreover, you have to deal with different versions for the same browser family.
Although OpenLayers itself works really well with all browsers, your own code will not always do it.
Because of this, we'll review some tools to debug in Internet Explorer and Mozilla Firefox. We will describe equivalence between Chrome DevTools panels and browsers-specific debuggers.
Before Internet Explorer 8, there wasn't any debugger built-in. The previous version of OpenLayers library (the 2.x series) was covering old IE versions such as IE 6, 7. OpenLayers 3 supports IE 9+.
Although the IE debugger is considered less powerful than other browsers debuggers, it is valuable tool in particular because of the step-by-step debug.
The following screenshot of IE 9 debugger shows that most panels are similar to Chrome Developer Tools:
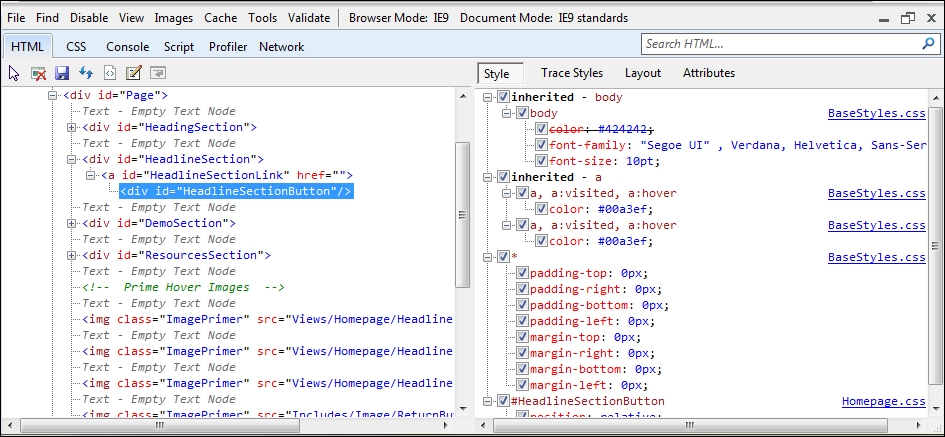
The HTML panel is like the Elements panel, and the CSS and Scripts panels do the same job that the Sources panel in Chrome DevTools does.
The Console and Network panels are quite similar to the ones in Chrome Developer Tools.
In addition, for better performance, for example, to evaluate and improve your JavaScript execution time, a profiler can be found in the Profiles panel but doesn't provide as much functions as its Chrome equivalent.
With IE, each version of the browser debugger gains panels. So, it would be better to review versions differences using the official Microsoft developer website at http://msdn.microsoft.com/en-us/library/ie/.
Like for IE, this part will be dedicated to describe equivalence between Chrome DevTools and Firebug, an extension to Firefox. Although Mozilla Firefox has a built-in debugger included nowadays, Firebug remains the best tool on Mozilla to debug web maps and sites at the time of this writing.
We advise that you install it by visiting the official site at https://getfirebug.com/.
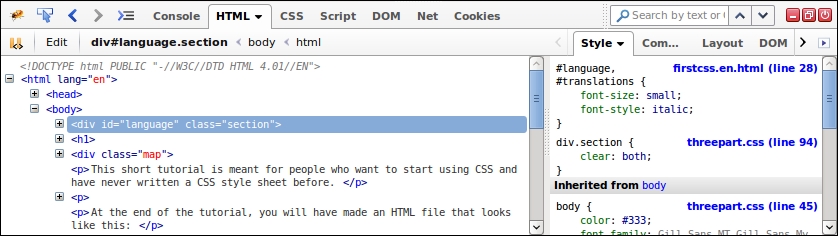
Now, it's time to make the comparison again.
In this case, the Console panel with the DOM panel in Firebug provides the same functionality that Chrome Developer Tools Console panel gives.
The HTML panel is equivalent to the Elements panel.
The CSS and Script panels combined together give you Sources panel functions.
The Timeline, Profiles, and Audits panels are specific to Chrome Developer Tools.
Most of the extensions for Firebug are listed at https://getfirebug.com/wiki/index.php/Firebug_Extensions.
Those extensions help to close the gap between default Chrome Developer and Firefox with only FireBug.
You can also find Mozilla Firefox add-on that do not always depend on FireBug. The official place to get them is https://addons.mozilla.org.
If you need one extension, you will have to install Acebug: https://addons.mozilla.org/en-us/firefox/addon/acebug/.
When you are learning and in particular doing JavaSript test directly in the browser, it behaves like an advanced text editor. Its main goal is to bring new features to Firebug's multi-lines command.
This add-on does the following:
- Add a new Firebug panel, Resources, to see list of files
- Auto-complete with Ctrl + Space. Beautify selected code with Ctrl + Shift + B
- Auto-indent and outdent using Tab and Tab + Shift
- Validate JavaScript, such as incomplete brackets
- Load and save JavaScript files
Moreover, the Resources panel that you get with AceBug in Firebug combined with Cookies panel provides similar experience to the Resources panel in Chrome DevTools.
Tip
More and more efforts have been done on the built-in Firefox Developers Tools, it starts widening the gap with Firebug debugging functions. Sometimes, it exposes more advanced capabilities than Firebug. You can take a look at it main dedicated page at https://developer.mozilla.org/en-US/docs/Tools.
Learning process goes through repetitions. So, go back to the previous Console panel examples of the chapter and retry them in Mozilla Firefox. Take your time to see differences with Chrome Developer Tools behaviors. After those tests, go to your first OpenLayers example and type ol in the Console panel and click on it to browse like if you were in the Chrome Developer Tools Console tab. We also recommend that you play with autocompletion. Don't hesitate to experiment until you feel confident.
Q1. What panel(s) will you use if you wanted to execute JavaScript code?
- The Network panel.
- The Console panel.
- The Timeline panel.
- The Sources panel.
Q2. You want to make some changes in CSS styles; what panel(s) can be used?
- The Elements panel.
- The Resources panel.
- The Network panel.
- The Sources panel.
- The Timeline panel.
Q3. Using the sample from Chapter 1, Getting Started with OpenLayers, when you inspect the map object with console.log, what methods are available?
map.getView().map.getLayers().map.getLayer().map.getInteraction().