Table of Contents for
OpenLayers 3 : Beginner's Guide
 OpenLayers 3 : Beginner's Guide
Published by
Packt Publishing, 2015
OpenLayers 3 : Beginner's Guide
Published by
Packt Publishing, 2015
- Cover
- Table of Contents
- OpenLayers 3 Beginner's Guide
- OpenLayers 3 Beginner's Guide
- Credits
- About the Authors
- About the Reviewers
- www.PacktPub.com
- Preface
- What you need for this book
- Who this book is for
- Sections
- Time for action – heading
- Conventions
- Reader feedback
- Customer support
- 1. Getting Started with OpenLayers
- Advantages of using OpenLayers
- What, technically, is OpenLayers?
- Anatomy of a web mapping application
- Connecting to Google, Bing Maps, and other mapping APIs
- Time for action – downloading OpenLayers
- Time for action – creating your first map
- Where to go for help
- OpenLayers issues
- OpenLayers source code repository
- Getting live news from RSS and social networks
- Summary
- 2. Key Concepts in OpenLayers
- Time for action – creating a map
- Time for action – using the JavaScript console
- Time for action – overlaying information
- OpenLayers' super classes
- Key-Value Observing with the Object class
- Time for action – using bindTo
- Working with collections
- Summary
- 3. Charting the Map Class
- Time for action – creating a map
- Map renderers
- Time for action – rendering a masterpiece
- Map properties
- Time for action – target practice
- Map methods
- Time for action – creating animated maps
- Events
- Views
- Time for action – linking two views
- Summary
- 4. Interacting with Raster Data Source
- Layers in OpenLayers 3
- Common operations on layers
- Time for action – changing layer properties
- Tiled versus untiled layers
- Types of raster sources
- Tiled images' layers and their sources
- Time for action – creating a Stamen layer
- Time for action – creating a Bing Maps layer
- Time for action – creating tiles and adding Zoomify layer
- Image layers and their sources
- Using Spherical Mercator raster data with other layers
- Time For action – playing with various sources and layers together
- Time For action – applying Zoomify sample knowledge to a single raw image
- Summary
- 5. Using Vector Layers
- Time for action – creating a vector layer
- How the vector layer works
- The vector layer class
- Vector sources
- Time for action – using the cluster source
- Time for action – creating a loader function
- Time for action – working with the TileVector source
- Time for action – a drag and drop viewer for vector files
- Features and geometries
- Time for action – geometries in action
- Time for action – interacting with features
- Summary
- 6. Styling Vector Layers
- Time for action – basic styling
- The style class
- Time for action – using the icon style
- Have a go hero – using the circle style
- Multiple styles
- Time for action – using multiple styles
- Style functions
- Time for action – using properties to style features
- Interactive styles
- Time for action – creating interactive styles
- Summary
- 7. Wrapping Our Heads Around Projections
- Time for action – using different projection codes
- Time for action – determining coordinates
- OpenLayers projection class
- Transforming coordinates
- Time for action – coordinate transforms
- Time for action – setting up Proj4js.org
- Time for action – reprojecting extent
- Time for action – using custom projection with WMS sources
- Time for action – reprojecting geometries in vector layers
- Summary
- 8. Interacting with Your Map
- Time for action – converting your local or national authorities data into web mapping formats
- Time for action – testing the use cases for ol.interaction.Select
- Time for action – more options with ol.interaction.Select
- Introducing methods to get information from your map
- Time for action – understanding the forEachFeatureAtPixel method
- Time for action – understanding the getGetFeatureInfoUrl method
- Adding a pop-up on your map
- Time for action – introducing ol.Overlay with a static example
- Time for action – using ol.Overlay dynamically with layers information
- Time for action – using ol.interaction.Draw to share new information on the Web
- Time for action – using ol.interaction.Modify to update drawing
- Understanding interactions and their architecture
- Time for action – configuring default interactions
- Discovering the other interactions
- Time for action – using ol.interaction.DragRotateAndZoom
- Time for action – making rectangle export to GeoJSON with ol.interaction.DragBox
- Summary
- 9. Taking Control of Controls
- Adding controls to your map
- Time for action – starting with the default controls
- Controls overview
- Time for action – changing the default attribution styles
- Time for action – finding your mouse position
- Time for action – configuring ZoomToExtent and manipulate controls
- Creating a custom control
- Time for action – extending ol.control.Control to make your own control
- Summary
- 10. OpenLayers Goes Mobile
- Using a web server
- Time for action – go mobile!
- The Geolocation class
- Time for action – location, location, location
- The DeviceOrientation class
- Time for action – a sense of direction
- Debugging mobile web applications
- Debugging on iOS
- Debugging on Android
- Going offline
- Time for action – MANIFEST destiny
- Going native with web applications
- Time for action – track me
- Summary
- 11. Creating Web Map Apps
- Using geospatial data from Flickr
- Time for action – getting Flickr data
- A simple application
- Time for Action – adding data to your map
- Styling the features
- Time for action – creating a style function
- Creating a thumbnail style
- Time for action – switching to JSON data
- Time for action – creating a thumbnail style
- Turning our example into an application
- Time for action – adding the select interaction
- Time for action – handling selection events
- Time for action – displaying photo information
- Using real time data
- Time for action – getting dynamic data
- Wrapping up the application
- Time for action – adding dynamic tags to your map
- Deploying an application
- Creating custom builds
- Creating a combined build
- Time for action – creating a combined build
- Creating a separate build
- Time for action – creating a separate build
- Summary
- A. Object-oriented Programming – Introduction and Concepts
- Going further
- B. More details on Closure Tools and Code Optimization Techniques
- Introducing Closure Library, yet another JavaScript library
- Time for action – first steps with Closure Library
- Making custom build for optimizing performance
- Time for action – playing with Closure Compiler
- Applying your knowledge to the OpenLayers case
- Time for action - running official examples with the internal OpenLayers toolkit
- Time for action - building your custom OpenLayers library
- Syntax and styles
- Time for action – using Closure Linter to fix JavaScript
- Summary
- C. Squashing Bugs with Web Debuggers
- Time for action – opening Chrome Developer Tools
- Explaining Chrome Developer debugging controls
- Time for action – using DOM manipulation with OpenStreetMap map images
- Time for action – using breakpoints to explore your code
- Time for action – playing with zoom button and map copyrights
- Using the Console panel
- Time for action – executing code in the Console
- Time for action – creating object literals
- Time for action – interacting with a map
- Improving Chrome and Developer Tools with extensions
- Debugging in other browsers
- Summary
- D. Pop Quiz Answers
- Chapter 5, Using Vector Layers
- Chapter 7, Wrapping Our Heads Around Projections
- Chapter 8, Interacting with Your Map
- Chapter 9, Taking Control of Controls
- Chapter 10, OpenLayers Goes Mobile
- Appendix B, More details on Closure Tools and Code Optimization Techniques
- Appendix C, Squashing Bugs with Web Debuggers
- Index
Bing Maps tiles can be viewed using the official Bing Maps API, but they can also be used through an API that gives direct access to their tiles. This is what we will see now:
- Go to the Microsoft Mapping API register website at http://www.bingmapsportal.com to get an official key.
- Let's set up the source object now. We need to not only specify the
styleproperty but also thekey.var sourceBingMaps = new ol.source.BingMaps({ key: 'AibU6zHqoTPYDuNRtHPMJq557poKb9AVTIJ0NWWnNZf8LfoRRwoigHTQ0Frrsr5m', imagerySet: 'Road', }); - Now, create the first
ol.layer.Tilelayer:var bingMapsRoad = new ol.layer.Tile({ source: sourceBingMaps }); - Now, add another layer using the other type of image 'Aerial':
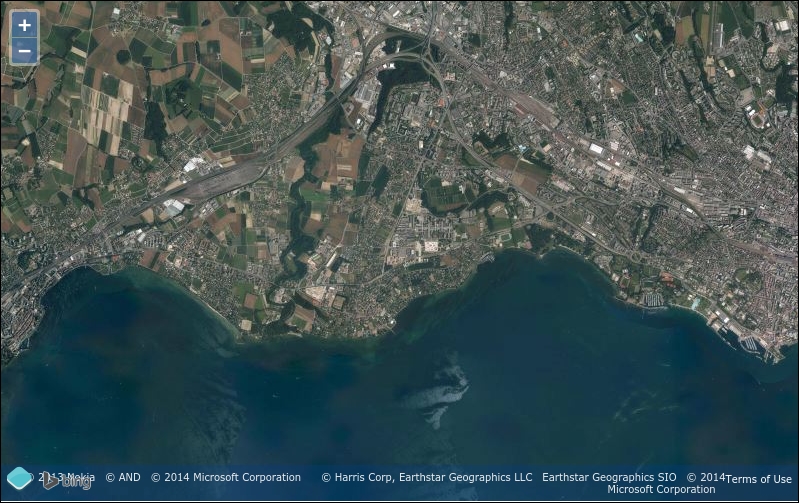
var bingMapsAerial = new ol.layer.Tile({ source: new ol.source.BingMaps({ key: 'AibU6zHqoTPYDuNRtHPMJq557poKb9AVTIJ0NWWnNZf8LfoRRwoigHTQ0Frrsr5m', style: 'Aerial', }) }); - Let's create the map and add the two layers and the view directly:
var map = new ol.Map({ layers: [bingMapsRoad, bingMapsAerial], target: 'map', view: new ol.View({ center: ol.proj.transform([6.562783, 46.517814], 'EPSG:4326', 'EPSG:3857'), zoom: 13 }) }); - You should see something like the following image:
Note
To make the example work, it's required to put your file on a web server. It can be Apache, but with Python, you can simply do it in the command line in your demo file root directory:
python -mSimpleHTTPServerNext, open your browser to
http://localhost:8000/sandbox/your_file_name.html.Another way can be to use the
node index.jscommand (if you downloaded the samples code) and openhttp://localhost:3000/sandbox/your_file_name.html.Also, you don't have the obligation to create an API key when you are on your local machine. The one used in this book works only when using
localhostor the official book website at http://openlayersbook.github.io.
We just made a map using the Microsoft Bing Map tiles' API. It works similar to the OpenStreetMap tiles layers but required to be authenticated. We can communicate with Microsoft tiles API server and use different properties. Let's go over the properties, as there are some that the other third-party sources do not provide.
Bing Maps source helps you consume Bing tiles representing road and imagery in your layer.
The constructor is ol.source.BingMaps and the following table is for the options:
|
Name |
Type |
Description |
|---|---|---|
|
|
|
It is the language and the localization you want to display for your labels. The supported Culture Codes for each style are listed in the official Microsoft documentation at http://msdn.microsoft.com/en-us/library/hh441729.aspx. |
|
|
|
This is the Bing Maps API key. Get yours at http://bingmapsportal.com. |
|
|
|
This is a type of imagery. It can be |
|
|
|
The TileJSON format was invented by MapBox, another company providing OpenStreetMap related services. It relies on JSON notation.
According to the specification, TileJSON is an open standard for representing map metadata. Its main goal is to reference the name, the attribution, the server URL, the minimum and max zoom, the center, the bounds, and the scheme of the tile (for OSM, numbering go top to bottom but other tiles' systems start numbering upwards). You can see all available parameters looking at the official specification at https://github.com/mapbox/tilejson-spec.
As it is not the mainstream way to get tiles, although it's a smart way, we will not review it through an example but directly advise you to go the official demo available at http://openlayers.org/en/v3.0.0/examples/tilejson.html and look into the code.
TileJSON source permits you to display in a tiled layer custom tile. You can declare their source using the following constructor:
ol.source.TileJSON
You can also review the available properties, particularly the required URL parameter on the official API docs at http://openlayers.org/en/v3.0.0/apidoc/ol.source.TileJSON.html.
The WMTS layer is based on the WMTS standards. The specification defines it as The Web Map Tile Service described in this standard builds on earlier efforts to develop scalable, high-performance services for web-based distribution of cartographic maps.
A WMTS-enabled server application can serve map tiles of spatially referenced data using tile images with predefined content, extent, and resolution.
This type of layer is quite different from most of the previous tiled layers we've seen. WMTS layers are more customizable. You can make a request to get tiles in custom projection, you can also choose your grid without caring about the implicit rules, that each tile when you zoom it will give you four tiles, as illustrated with the following figure:
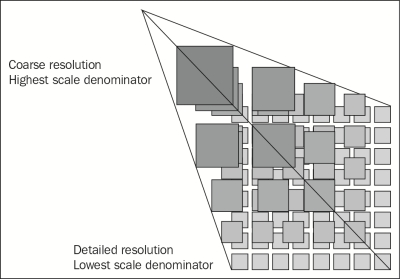
It's really not the most common tiles layer, but you can see it as the most efficient tile system for custom requirements. You can better choose your level of tiling or you can also use custom tile size. For example, for mobile, a smaller tile with 64 pixels for its side can be used instead of the standard 256 pixels size. We recommend, if you are curious, to see the official examples at http://openlayers.org/en/v3.0.0/examples/ using the WMTS keyword. We will not be covering the details here. You can learn more about the standard itself by going to the official dedicated web pages at http://www.opengeospatial.org/standards/wmts.
You also need to understand that one of its main goals was to fill the issue for fast rendering contrary to OGC WMS standard as it can be cached.
WMTS sources are complex to declare. They require more parameters than other sources because of their flexibility. For example, the ability to customize for each tile levels grid means also as a drawback, complexity.
The constructor is ol.source.WMTS. To see its options, we recommend that you visit the official API docs at http://openlayers.org/en/v3.0.0/apidoc/ol.source.WMTS.html.
The DebugTileSource source is only a way to debug tiles rendering in OpenLayers 3. It doesn't use the tile numbering from the source but the internal that OpenLayers use. We just mentioned it to be exhaustive. You use it into a ol.layer.Tile class. You can look at the demo to learn more about it at http://openlayers.org/en/v3.0.0/examples/canvas-tiles.html. It can really help you to debug special grid, for example, in WMTS.
The TileDebugTile source enables you to display numbered grids to show how tiles are regrouped in the OpenLayers Canvas rendering. Canvas is a renderer to display a map in your browser.
The constructor is ol.source.TileDebug and for the options, you should visit the official API docs at http://openlayers.org/en/v3.0.0/apidoc/ol.source.TileDebug.html.
A WMS (Web Map Service) is a standard protocol for serving georeferenced map images over the Internet that are generated by a map server. You can watch the full reference at the official OGC (Open Geospatial Consortium) website, the organization managing this standard (http://www.opengeospatial.org/standards/wms).
The two versions of WMS available are 1.1.1 and 1.3.0.
WMS is dynamic: you can generate on the fly images.
So, why do I see a reference to a tiled WMS in OpenLayers 3?
It's just a way to lower charge on server-side—when you are generating small images, the process is faster, the memory cost does not really change as the number of requests increase, but you gain the ability to cache the tiles.
But wait, so why can't we use ImageWMS with WMS if we can have the advantage of both tiled (caching) and untiled system (freshness)?
We will not directly answer this right now, but will give you the hint in the section dedicated to ImageWMS.
You can refer to the official example to see a simple example as a reference at http://openlayers.org/en/v3.0.0//examples/wms-tiled.html.
Note
To find out what projections a WMS service supports, you can make a getCapabilities request to the server. To make this request, specify the request, service, and version properties in the URL. For example, http://suite.opengeo.org/geoserver/wms?service=WMS&version=1.1.1&request=GetCapabilities.
You also have to be cautious. Here, we use the Version 1.1.1 version call but the specification supports two versions: 1.1.1 and 1.3.0. It's recommended to use 1.3.0 nowadays, but you can meet external WMS web services using only 1.1.1. Just use the VERSION parameter in the params options.
Tiled WMS source helps you set tiled WMS calls for your layer. The constructor is ol.source.TiledWMS and the options are listed in the following table:
Contrary to most components that are useful only in a map context, this component helps you to display any arbitrary images. It's really useful when you need to display a large image and want performances associated with tiles displayed and the usual interactions of mapping such as panning and zooming.
Some use cases can be game maps, discovery of scanned historical documents such as birth certificates for genealogy, or the old maps with no referencing, meaning that they do not overlay well with existing imagery and geographical data.
To make the ol.source.Zoomify component work, you will need to preprocess a large image to create tiles.