Table of Contents for
OpenLayers 3 : Beginner's Guide
 OpenLayers 3 : Beginner's Guide
Published by
Packt Publishing, 2015
OpenLayers 3 : Beginner's Guide
Published by
Packt Publishing, 2015
- Cover
- Table of Contents
- OpenLayers 3 Beginner's Guide
- OpenLayers 3 Beginner's Guide
- Credits
- About the Authors
- About the Reviewers
- www.PacktPub.com
- Preface
- What you need for this book
- Who this book is for
- Sections
- Time for action – heading
- Conventions
- Reader feedback
- Customer support
- 1. Getting Started with OpenLayers
- Advantages of using OpenLayers
- What, technically, is OpenLayers?
- Anatomy of a web mapping application
- Connecting to Google, Bing Maps, and other mapping APIs
- Time for action – downloading OpenLayers
- Time for action – creating your first map
- Where to go for help
- OpenLayers issues
- OpenLayers source code repository
- Getting live news from RSS and social networks
- Summary
- 2. Key Concepts in OpenLayers
- Time for action – creating a map
- Time for action – using the JavaScript console
- Time for action – overlaying information
- OpenLayers' super classes
- Key-Value Observing with the Object class
- Time for action – using bindTo
- Working with collections
- Summary
- 3. Charting the Map Class
- Time for action – creating a map
- Map renderers
- Time for action – rendering a masterpiece
- Map properties
- Time for action – target practice
- Map methods
- Time for action – creating animated maps
- Events
- Views
- Time for action – linking two views
- Summary
- 4. Interacting with Raster Data Source
- Layers in OpenLayers 3
- Common operations on layers
- Time for action – changing layer properties
- Tiled versus untiled layers
- Types of raster sources
- Tiled images' layers and their sources
- Time for action – creating a Stamen layer
- Time for action – creating a Bing Maps layer
- Time for action – creating tiles and adding Zoomify layer
- Image layers and their sources
- Using Spherical Mercator raster data with other layers
- Time For action – playing with various sources and layers together
- Time For action – applying Zoomify sample knowledge to a single raw image
- Summary
- 5. Using Vector Layers
- Time for action – creating a vector layer
- How the vector layer works
- The vector layer class
- Vector sources
- Time for action – using the cluster source
- Time for action – creating a loader function
- Time for action – working with the TileVector source
- Time for action – a drag and drop viewer for vector files
- Features and geometries
- Time for action – geometries in action
- Time for action – interacting with features
- Summary
- 6. Styling Vector Layers
- Time for action – basic styling
- The style class
- Time for action – using the icon style
- Have a go hero – using the circle style
- Multiple styles
- Time for action – using multiple styles
- Style functions
- Time for action – using properties to style features
- Interactive styles
- Time for action – creating interactive styles
- Summary
- 7. Wrapping Our Heads Around Projections
- Time for action – using different projection codes
- Time for action – determining coordinates
- OpenLayers projection class
- Transforming coordinates
- Time for action – coordinate transforms
- Time for action – setting up Proj4js.org
- Time for action – reprojecting extent
- Time for action – using custom projection with WMS sources
- Time for action – reprojecting geometries in vector layers
- Summary
- 8. Interacting with Your Map
- Time for action – converting your local or national authorities data into web mapping formats
- Time for action – testing the use cases for ol.interaction.Select
- Time for action – more options with ol.interaction.Select
- Introducing methods to get information from your map
- Time for action – understanding the forEachFeatureAtPixel method
- Time for action – understanding the getGetFeatureInfoUrl method
- Adding a pop-up on your map
- Time for action – introducing ol.Overlay with a static example
- Time for action – using ol.Overlay dynamically with layers information
- Time for action – using ol.interaction.Draw to share new information on the Web
- Time for action – using ol.interaction.Modify to update drawing
- Understanding interactions and their architecture
- Time for action – configuring default interactions
- Discovering the other interactions
- Time for action – using ol.interaction.DragRotateAndZoom
- Time for action – making rectangle export to GeoJSON with ol.interaction.DragBox
- Summary
- 9. Taking Control of Controls
- Adding controls to your map
- Time for action – starting with the default controls
- Controls overview
- Time for action – changing the default attribution styles
- Time for action – finding your mouse position
- Time for action – configuring ZoomToExtent and manipulate controls
- Creating a custom control
- Time for action – extending ol.control.Control to make your own control
- Summary
- 10. OpenLayers Goes Mobile
- Using a web server
- Time for action – go mobile!
- The Geolocation class
- Time for action – location, location, location
- The DeviceOrientation class
- Time for action – a sense of direction
- Debugging mobile web applications
- Debugging on iOS
- Debugging on Android
- Going offline
- Time for action – MANIFEST destiny
- Going native with web applications
- Time for action – track me
- Summary
- 11. Creating Web Map Apps
- Using geospatial data from Flickr
- Time for action – getting Flickr data
- A simple application
- Time for Action – adding data to your map
- Styling the features
- Time for action – creating a style function
- Creating a thumbnail style
- Time for action – switching to JSON data
- Time for action – creating a thumbnail style
- Turning our example into an application
- Time for action – adding the select interaction
- Time for action – handling selection events
- Time for action – displaying photo information
- Using real time data
- Time for action – getting dynamic data
- Wrapping up the application
- Time for action – adding dynamic tags to your map
- Deploying an application
- Creating custom builds
- Creating a combined build
- Time for action – creating a combined build
- Creating a separate build
- Time for action – creating a separate build
- Summary
- A. Object-oriented Programming – Introduction and Concepts
- Going further
- B. More details on Closure Tools and Code Optimization Techniques
- Introducing Closure Library, yet another JavaScript library
- Time for action – first steps with Closure Library
- Making custom build for optimizing performance
- Time for action – playing with Closure Compiler
- Applying your knowledge to the OpenLayers case
- Time for action - running official examples with the internal OpenLayers toolkit
- Time for action - building your custom OpenLayers library
- Syntax and styles
- Time for action – using Closure Linter to fix JavaScript
- Summary
- C. Squashing Bugs with Web Debuggers
- Time for action – opening Chrome Developer Tools
- Explaining Chrome Developer debugging controls
- Time for action – using DOM manipulation with OpenStreetMap map images
- Time for action – using breakpoints to explore your code
- Time for action – playing with zoom button and map copyrights
- Using the Console panel
- Time for action – executing code in the Console
- Time for action – creating object literals
- Time for action – interacting with a map
- Improving Chrome and Developer Tools with extensions
- Debugging in other browsers
- Summary
- D. Pop Quiz Answers
- Chapter 5, Using Vector Layers
- Chapter 7, Wrapping Our Heads Around Projections
- Chapter 8, Interacting with Your Map
- Chapter 9, Taking Control of Controls
- Chapter 10, OpenLayers Goes Mobile
- Appendix B, More details on Closure Tools and Code Optimization Techniques
- Appendix C, Squashing Bugs with Web Debuggers
- Index
OpenLayers is a JavaScript library, and as discussed earlier is built using Object Oriented Programming (OOP). When we want to actually create a layer, we will create (or instantiate) an object from an ol.layer.Layer subclass.
OpenLayers has many different ol.layer classes. The layer types are only for different kinds of data (tiles, images, and vector). Using an attached ol.source.* will allow you to connect to a different type of map server 'back end.' Each layer object is independent of other layer objects; so, doing things to one layer won't necessarily affect the other.
Note
How many layers can I have?
The safest maximum amount of layers you can have on a map at one time depends largely on the user's machine (that is, their processing power and memory). Too many layers can also overwhelm users; many popular web maps (for example, Google and Yahoo!) contain just a few layers. We recommend that you don't use a lot of layers or limit the number of layers that you can turn on at the same time. Adding layers is cheap but making composition of the map image is expensive, particularly with Canvas renderer. If you turn on many layers at the same time, you will end up with an unusable map, whereas if only some of them are turned on, you will have good performance. You also need to be aware that using vector layers instead of raster layers is better for composition performances.
Whatever the purpose of your web map application is, you will need at least one layer to have a usable map. An OpenLayers map without any layers would be like an atlas without any maps. You need at least one layer—at least one base layer. All other layers that sit above the base layer are called overlay layers. The concept inherits from the existing OpenLayers 2 series and was seen in Chapter 1, Getting Started with OpenLayers.
A base layer is at the very bottom of the layer list, and all other layers are on top of it. This would be our printed map from the earlier example. The order of the other layers can change, but the base layer is always below the overlay layers. By default, the first layer that you add to your map acts as the base layer. You can, however, change the order of any layer on your map to act as the base layer.
You can also have multiple base layers. Although you can set more than one base layer active at a time, for visual readability, most of the time, you only use one.
Any layer that is not a base layer is called an overlay layer. Like we talked about earlier, the order that you add layers to your map is important. Every time you add a layer to the map, it is placed above the previous one.
After this reminder about layers concepts, see what's happening at the OpenLayers 3 library level inheritance to discover the main layers type.
There are two types of layers: raster and vector layers. The main differences between both are:
- Raster layers are images like
PNGorJPEG. They can be generated on server-side or are static. In most cases, your browser doesn't manipulate them but only consumes them. - Vector layers are features, geographic objects that are described by their geographic coordinates. They scale up and down without losing visual quality and are easier to style because style can be done on client-side (your browser if you prefer).
To give you an overview of layers organization at the library level, let's look at the following diagram:
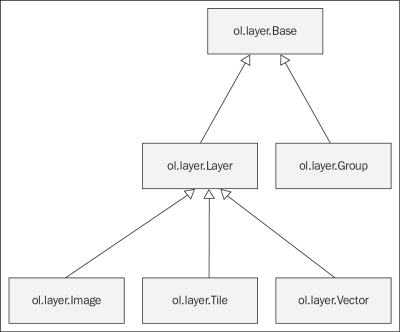
When you are creating a new web mapping application, you have to make a choice between benefits and drawbacks of those layers. For raster, it's mainly that images do not overload the browser as vector layers mostly can. As you can see in the diagram, raster layers such as vector layers are derived from a common ol.layer.Layer class. This ol.layer.Layer class inherits from an ol.layer.Base class, (base in this case means common behavior between layers). This class is also inherited by an ol.layer.Group class designed to group layers to treat them as a single layer. In our case, we will focus mainly on the two raster layer classes, ol.layer.Image and ol.layer.Tile. We will also do a review of the common ol.layer.Layer methods. Moreover, you can divide raster in two categories: tiled or untiled. We will cover both types in this chapter. The ol.layer.Vector class will be covered in Chapter 5, Using Vector Layers.