Table of Contents for
OpenLayers 3 : Beginner's Guide
 OpenLayers 3 : Beginner's Guide
Published by
Packt Publishing, 2015
OpenLayers 3 : Beginner's Guide
Published by
Packt Publishing, 2015
- Cover
- Table of Contents
- OpenLayers 3 Beginner's Guide
- OpenLayers 3 Beginner's Guide
- Credits
- About the Authors
- About the Reviewers
- www.PacktPub.com
- Preface
- What you need for this book
- Who this book is for
- Sections
- Time for action – heading
- Conventions
- Reader feedback
- Customer support
- 1. Getting Started with OpenLayers
- Advantages of using OpenLayers
- What, technically, is OpenLayers?
- Anatomy of a web mapping application
- Connecting to Google, Bing Maps, and other mapping APIs
- Time for action – downloading OpenLayers
- Time for action – creating your first map
- Where to go for help
- OpenLayers issues
- OpenLayers source code repository
- Getting live news from RSS and social networks
- Summary
- 2. Key Concepts in OpenLayers
- Time for action – creating a map
- Time for action – using the JavaScript console
- Time for action – overlaying information
- OpenLayers' super classes
- Key-Value Observing with the Object class
- Time for action – using bindTo
- Working with collections
- Summary
- 3. Charting the Map Class
- Time for action – creating a map
- Map renderers
- Time for action – rendering a masterpiece
- Map properties
- Time for action – target practice
- Map methods
- Time for action – creating animated maps
- Events
- Views
- Time for action – linking two views
- Summary
- 4. Interacting with Raster Data Source
- Layers in OpenLayers 3
- Common operations on layers
- Time for action – changing layer properties
- Tiled versus untiled layers
- Types of raster sources
- Tiled images' layers and their sources
- Time for action – creating a Stamen layer
- Time for action – creating a Bing Maps layer
- Time for action – creating tiles and adding Zoomify layer
- Image layers and their sources
- Using Spherical Mercator raster data with other layers
- Time For action – playing with various sources and layers together
- Time For action – applying Zoomify sample knowledge to a single raw image
- Summary
- 5. Using Vector Layers
- Time for action – creating a vector layer
- How the vector layer works
- The vector layer class
- Vector sources
- Time for action – using the cluster source
- Time for action – creating a loader function
- Time for action – working with the TileVector source
- Time for action – a drag and drop viewer for vector files
- Features and geometries
- Time for action – geometries in action
- Time for action – interacting with features
- Summary
- 6. Styling Vector Layers
- Time for action – basic styling
- The style class
- Time for action – using the icon style
- Have a go hero – using the circle style
- Multiple styles
- Time for action – using multiple styles
- Style functions
- Time for action – using properties to style features
- Interactive styles
- Time for action – creating interactive styles
- Summary
- 7. Wrapping Our Heads Around Projections
- Time for action – using different projection codes
- Time for action – determining coordinates
- OpenLayers projection class
- Transforming coordinates
- Time for action – coordinate transforms
- Time for action – setting up Proj4js.org
- Time for action – reprojecting extent
- Time for action – using custom projection with WMS sources
- Time for action – reprojecting geometries in vector layers
- Summary
- 8. Interacting with Your Map
- Time for action – converting your local or national authorities data into web mapping formats
- Time for action – testing the use cases for ol.interaction.Select
- Time for action – more options with ol.interaction.Select
- Introducing methods to get information from your map
- Time for action – understanding the forEachFeatureAtPixel method
- Time for action – understanding the getGetFeatureInfoUrl method
- Adding a pop-up on your map
- Time for action – introducing ol.Overlay with a static example
- Time for action – using ol.Overlay dynamically with layers information
- Time for action – using ol.interaction.Draw to share new information on the Web
- Time for action – using ol.interaction.Modify to update drawing
- Understanding interactions and their architecture
- Time for action – configuring default interactions
- Discovering the other interactions
- Time for action – using ol.interaction.DragRotateAndZoom
- Time for action – making rectangle export to GeoJSON with ol.interaction.DragBox
- Summary
- 9. Taking Control of Controls
- Adding controls to your map
- Time for action – starting with the default controls
- Controls overview
- Time for action – changing the default attribution styles
- Time for action – finding your mouse position
- Time for action – configuring ZoomToExtent and manipulate controls
- Creating a custom control
- Time for action – extending ol.control.Control to make your own control
- Summary
- 10. OpenLayers Goes Mobile
- Using a web server
- Time for action – go mobile!
- The Geolocation class
- Time for action – location, location, location
- The DeviceOrientation class
- Time for action – a sense of direction
- Debugging mobile web applications
- Debugging on iOS
- Debugging on Android
- Going offline
- Time for action – MANIFEST destiny
- Going native with web applications
- Time for action – track me
- Summary
- 11. Creating Web Map Apps
- Using geospatial data from Flickr
- Time for action – getting Flickr data
- A simple application
- Time for Action – adding data to your map
- Styling the features
- Time for action – creating a style function
- Creating a thumbnail style
- Time for action – switching to JSON data
- Time for action – creating a thumbnail style
- Turning our example into an application
- Time for action – adding the select interaction
- Time for action – handling selection events
- Time for action – displaying photo information
- Using real time data
- Time for action – getting dynamic data
- Wrapping up the application
- Time for action – adding dynamic tags to your map
- Deploying an application
- Creating custom builds
- Creating a combined build
- Time for action – creating a combined build
- Creating a separate build
- Time for action – creating a separate build
- Summary
- A. Object-oriented Programming – Introduction and Concepts
- Going further
- B. More details on Closure Tools and Code Optimization Techniques
- Introducing Closure Library, yet another JavaScript library
- Time for action – first steps with Closure Library
- Making custom build for optimizing performance
- Time for action – playing with Closure Compiler
- Applying your knowledge to the OpenLayers case
- Time for action - running official examples with the internal OpenLayers toolkit
- Time for action - building your custom OpenLayers library
- Syntax and styles
- Time for action – using Closure Linter to fix JavaScript
- Summary
- C. Squashing Bugs with Web Debuggers
- Time for action – opening Chrome Developer Tools
- Explaining Chrome Developer debugging controls
- Time for action – using DOM manipulation with OpenStreetMap map images
- Time for action – using breakpoints to explore your code
- Time for action – playing with zoom button and map copyrights
- Using the Console panel
- Time for action – executing code in the Console
- Time for action – creating object literals
- Time for action – interacting with a map
- Improving Chrome and Developer Tools with extensions
- Debugging in other browsers
- Summary
- D. Pop Quiz Answers
- Chapter 5, Using Vector Layers
- Chapter 7, Wrapping Our Heads Around Projections
- Chapter 8, Interacting with Your Map
- Chapter 9, Taking Control of Controls
- Chapter 10, OpenLayers Goes Mobile
- Appendix B, More details on Closure Tools and Code Optimization Techniques
- Appendix C, Squashing Bugs with Web Debuggers
- Index
All tiled layers share some common properties. They inherit from the ol.source.TileImage. Those common properties are quite useful for other ol.source.* that inherit from it, for example, in some cases to put a logo or give attributions (also called credits) for the maps data and/or tiles. You have to be careful in the API docs online as these properties are considered unstable. You have to uncheck the Stable Only checkbox on the top banner. Unstable doesn't mean that you don't have to use those properties but that they may change with future OpenLayers releases. It's very useful for application developers to see what they may need to use or migrate in the future. See the following table for further information:
The most important functions are mostly those that do not start with the word tile. The tileClass, tileGrid, tileLoadFunction and tilePixelRatio exist but we choose to not cover them as they seem out of the scope for beginners; they help setting access to backend with particular tile grids. Along this book, we will sometimes refer to source as layer but it means a layer with the source adapted for a particular backend.
OpenStreetMap (OSM) is a free, Wikipedia style map of the world driven by user contributed content. You are able to use your own OSM tiles or ones provided through the OpenStreetMap servers.
Setting up an OpenStreetMap service and tiles yourself is not too difficult, but it is outside the scope of this book (visit http://switch2osm.org for more information on this). Accessing OSM with OpenLayers, however, isn't.
More information on the OpenStreetMap project can be found at http://www.openstreetmap.org. To access OpenStreetMap, only using the ol.source.OSM constructor without any options is enough. In the previous examples, we were already using this source, so we will not give you another similar example.
Though using constructor without options can be enough, you can also use other properties. The default constructor code uses the publicly available OSM tiles, but it is easy to point it at your own tiles. To do so, create the layer in this format:
var osmLayer = new ol.layer.Tile({
  source: new ol.source.OSM({
    url: 'http://{a-c}.tile.opencyclemap.org/cycle/{z}/{x}/{y}.png'
  })
});
To use this, you will have to replace http://{a-c}.tile.opencyclemap.org/cycle/ with the server hosting your OSM tiles. {z}, {x}, and {y} are variables that OpenLayers will replace with the appropriate values to reference specific map tiles.
The {a-c} parameters mean to say you can access tiles using these URLs:
http://a.tile.opencyclemap.org/cycle,
http://b.tile.opencyclemap.org/cycle,
http://c.tile.opencyclemap.org/cycle
This behavior comes from restrictions from your browser: you can't simultaneously ask images from a same domain. It can only request a certain number of resources from the same domain simultaneously, usually 2 or 4. Using subdomains is a way to bypass this limit and speed up the map displaying.
If you have different sources for tiling, it is not only to provide different URLs to access different map images. The way tiling is done depends on established standards.
For example, Stamen layers, OpenStreetMap layers, and MapQuest layers are using the same tiling convention, whereas WMTS (Web Map Tile Service) can adopt other patterns to display tiles. These patterns are set with the ol.tilegrid.TileGrid object that describe for each arbitrary zoomlevel how the tiles are split.
The rules are the following. In reality, the Earth is not a sphere, but in this case, our planet is assimilated to a sphere because we are using Spherical Mercator projection (mainly known as EPSG 900913 or EPSG 3857). Do not worry about projections at the moment, we will review them in a later chapter as it can be a difficult topic to understand.
The entire sphere is projected on a single square at the 0 level. Then, for each zoom, you increase a level and for each tile at the previous zoom, we get 4 tiles at this one.
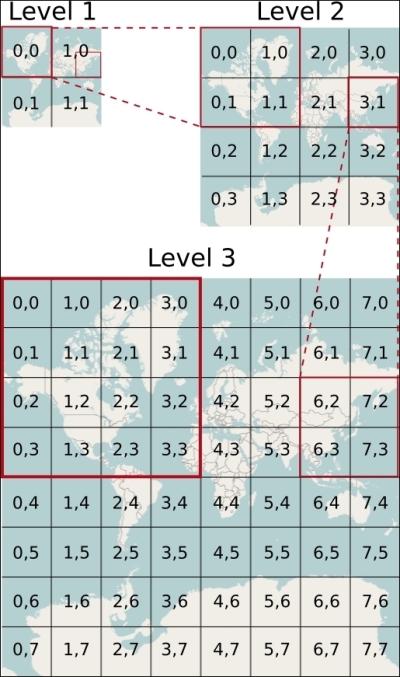
With the preceding diagram, you will know how to access a tile covering East Europe such as Poland at the 3 level. The URL always looks like URL_TO_TILES/level_z/x_in_grid_for_level/y_for_grid_in_level.png. So, for Poland that has a zoom level 3, x equal to 4, an y to 2, the URL could be http://b.tile.openstreetmap.org/3/4/2.png or http://c.tile.openstreetmap.org/3/4/2.png to get the right tile.
This source enables your layer to consume OpenStreetMap data and customize OpenStreetMap specific properties.
The constructor is ol.source.OSM and its properties can use following options:
MapQuest was, until around 2008, the leading provider for web mapping API. With the entry of Google Maps, the leadership was lost. In 2010, the company chose to change its position concerning web mapping API, by choosing to exclusively rely on OpenStreetMap data to do the job.
Two layers are available freely. They also provide other services such as their own web mapping API. You can get further information at the Open developer part website at http://developer.mapquest.com/web/products/open/.
The MapQuest source class refers directly to the MapQuest tiles server URL.
The constructor is ol.source.MapQuest.
You are only required to use the source constructor included in an ol.layer.Tile object to add the layer. There are only two options' properties. The first one is the layer. It can take values such as osm (roads), sat (satellite), and hyb (hybride) depending on the tiles you want to display. The other property tileLoadFunction will not be covered here: it's not a common requirement for beginners and we already listed it in the ol.source.OSM. At least, you just need to know that it helps change call to tiles with rules defined in your code.
- Create a map with both MapQuest OSM and satellite layers.
- Play with the layer used in particular methods such as
setVisibleto be able to see one layer and hide it to show the other underlying layer. - Find some alternative URLs that provide a URL to tiles coming from OpenStreetMap data too but not coming from the official website.
- Find the real URL that MapQuest layers use, using the debugger and in the code of the library itself (available at https://github.com/openlayers/ol3).
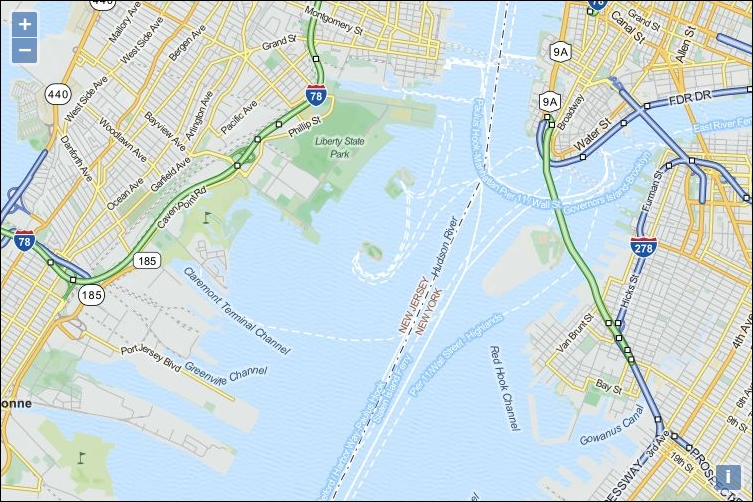
- Center your map on New York City, United States and choose the zoom you want or the part of the city you prefer. You can use http://openstreetmap.org to get the coordinates' center.
You will get something like the following screenshot if you center on the Statue of Liberty and use the MapQuest OSM layer:
The Stamen layers were named so after a company. To cite the OpenstreetMap wiki, Stamen (http://stamen.com) is a San Francisco design and development studio focused on data visualization and map-making. These layers extensively use OpenStreetMap data in many of their map visualizations and have provided three CC-BY OpenStreetMap tilesets: Toner, Terrain, and Watercolor. You can see how the styles look at the official demo website, http://maps.stamen.com.