Table of Contents for
OpenLayers 3 : Beginner's Guide
 OpenLayers 3 : Beginner's Guide
Published by
Packt Publishing, 2015
OpenLayers 3 : Beginner's Guide
Published by
Packt Publishing, 2015
- Cover
- Table of Contents
- OpenLayers 3 Beginner's Guide
- OpenLayers 3 Beginner's Guide
- Credits
- About the Authors
- About the Reviewers
- www.PacktPub.com
- Preface
- What you need for this book
- Who this book is for
- Sections
- Time for action – heading
- Conventions
- Reader feedback
- Customer support
- 1. Getting Started with OpenLayers
- Advantages of using OpenLayers
- What, technically, is OpenLayers?
- Anatomy of a web mapping application
- Connecting to Google, Bing Maps, and other mapping APIs
- Time for action – downloading OpenLayers
- Time for action – creating your first map
- Where to go for help
- OpenLayers issues
- OpenLayers source code repository
- Getting live news from RSS and social networks
- Summary
- 2. Key Concepts in OpenLayers
- Time for action – creating a map
- Time for action – using the JavaScript console
- Time for action – overlaying information
- OpenLayers' super classes
- Key-Value Observing with the Object class
- Time for action – using bindTo
- Working with collections
- Summary
- 3. Charting the Map Class
- Time for action – creating a map
- Map renderers
- Time for action – rendering a masterpiece
- Map properties
- Time for action – target practice
- Map methods
- Time for action – creating animated maps
- Events
- Views
- Time for action – linking two views
- Summary
- 4. Interacting with Raster Data Source
- Layers in OpenLayers 3
- Common operations on layers
- Time for action – changing layer properties
- Tiled versus untiled layers
- Types of raster sources
- Tiled images' layers and their sources
- Time for action – creating a Stamen layer
- Time for action – creating a Bing Maps layer
- Time for action – creating tiles and adding Zoomify layer
- Image layers and their sources
- Using Spherical Mercator raster data with other layers
- Time For action – playing with various sources and layers together
- Time For action – applying Zoomify sample knowledge to a single raw image
- Summary
- 5. Using Vector Layers
- Time for action – creating a vector layer
- How the vector layer works
- The vector layer class
- Vector sources
- Time for action – using the cluster source
- Time for action – creating a loader function
- Time for action – working with the TileVector source
- Time for action – a drag and drop viewer for vector files
- Features and geometries
- Time for action – geometries in action
- Time for action – interacting with features
- Summary
- 6. Styling Vector Layers
- Time for action – basic styling
- The style class
- Time for action – using the icon style
- Have a go hero – using the circle style
- Multiple styles
- Time for action – using multiple styles
- Style functions
- Time for action – using properties to style features
- Interactive styles
- Time for action – creating interactive styles
- Summary
- 7. Wrapping Our Heads Around Projections
- Time for action – using different projection codes
- Time for action – determining coordinates
- OpenLayers projection class
- Transforming coordinates
- Time for action – coordinate transforms
- Time for action – setting up Proj4js.org
- Time for action – reprojecting extent
- Time for action – using custom projection with WMS sources
- Time for action – reprojecting geometries in vector layers
- Summary
- 8. Interacting with Your Map
- Time for action – converting your local or national authorities data into web mapping formats
- Time for action – testing the use cases for ol.interaction.Select
- Time for action – more options with ol.interaction.Select
- Introducing methods to get information from your map
- Time for action – understanding the forEachFeatureAtPixel method
- Time for action – understanding the getGetFeatureInfoUrl method
- Adding a pop-up on your map
- Time for action – introducing ol.Overlay with a static example
- Time for action – using ol.Overlay dynamically with layers information
- Time for action – using ol.interaction.Draw to share new information on the Web
- Time for action – using ol.interaction.Modify to update drawing
- Understanding interactions and their architecture
- Time for action – configuring default interactions
- Discovering the other interactions
- Time for action – using ol.interaction.DragRotateAndZoom
- Time for action – making rectangle export to GeoJSON with ol.interaction.DragBox
- Summary
- 9. Taking Control of Controls
- Adding controls to your map
- Time for action – starting with the default controls
- Controls overview
- Time for action – changing the default attribution styles
- Time for action – finding your mouse position
- Time for action – configuring ZoomToExtent and manipulate controls
- Creating a custom control
- Time for action – extending ol.control.Control to make your own control
- Summary
- 10. OpenLayers Goes Mobile
- Using a web server
- Time for action – go mobile!
- The Geolocation class
- Time for action – location, location, location
- The DeviceOrientation class
- Time for action – a sense of direction
- Debugging mobile web applications
- Debugging on iOS
- Debugging on Android
- Going offline
- Time for action – MANIFEST destiny
- Going native with web applications
- Time for action – track me
- Summary
- 11. Creating Web Map Apps
- Using geospatial data from Flickr
- Time for action – getting Flickr data
- A simple application
- Time for Action – adding data to your map
- Styling the features
- Time for action – creating a style function
- Creating a thumbnail style
- Time for action – switching to JSON data
- Time for action – creating a thumbnail style
- Turning our example into an application
- Time for action – adding the select interaction
- Time for action – handling selection events
- Time for action – displaying photo information
- Using real time data
- Time for action – getting dynamic data
- Wrapping up the application
- Time for action – adding dynamic tags to your map
- Deploying an application
- Creating custom builds
- Creating a combined build
- Time for action – creating a combined build
- Creating a separate build
- Time for action – creating a separate build
- Summary
- A. Object-oriented Programming – Introduction and Concepts
- Going further
- B. More details on Closure Tools and Code Optimization Techniques
- Introducing Closure Library, yet another JavaScript library
- Time for action – first steps with Closure Library
- Making custom build for optimizing performance
- Time for action – playing with Closure Compiler
- Applying your knowledge to the OpenLayers case
- Time for action - running official examples with the internal OpenLayers toolkit
- Time for action - building your custom OpenLayers library
- Syntax and styles
- Time for action – using Closure Linter to fix JavaScript
- Summary
- C. Squashing Bugs with Web Debuggers
- Time for action – opening Chrome Developer Tools
- Explaining Chrome Developer debugging controls
- Time for action – using DOM manipulation with OpenStreetMap map images
- Time for action – using breakpoints to explore your code
- Time for action – playing with zoom button and map copyrights
- Using the Console panel
- Time for action – executing code in the Console
- Time for action – creating object literals
- Time for action – interacting with a map
- Improving Chrome and Developer Tools with extensions
- Debugging in other browsers
- Summary
- D. Pop Quiz Answers
- Chapter 5, Using Vector Layers
- Chapter 7, Wrapping Our Heads Around Projections
- Chapter 8, Interacting with Your Map
- Chapter 9, Taking Control of Controls
- Chapter 10, OpenLayers Goes Mobile
- Appendix B, More details on Closure Tools and Code Optimization Techniques
- Appendix C, Squashing Bugs with Web Debuggers
- Index
Let's dive into OpenLayers and make a map! After you finish this section, you should have a working map, which uses a publicly available OSM server backend from the OpenStreetMap.org project. Execute the following steps:
- Navigate to the
assetsdirectory, create a foldercss,and create a new file calledsamples.css. Add the following code:map { height: 500px; width: 100%; background-color: #b5d0d0; } - Add the following code to a new file called
hello_openstreetmap.htmland save the file in thesandboxdirectory. If you are using Windows, we suggest using Notepad++ in particular because you need to be sure you're editing UTF-8 encoded files. On Linux, you can use Gedit or Geany and for Mac OSX, you can use Text Wrangler (free but not open source). Do not try to edit the file in a program such as Microsoft Word, as it will not save properly. The following code will also be used as the base template code for many future examples in this book, so we'll be using it often and coming back to it a lot:<!doctype html> <head> <title> Hello OpenStreetMap </title> <link rel="stylesheet" href="../assets/ol3/css/ol.css" type="text/css" /> <link rel="stylesheet" href="../assets/css/samples.css" type="text/css" /> </head> <body> <div id="map" class="map"></div> <script src="../assets/ol3/js/ol.js"> </script> <script> var osmLayer = new ol.layer.Tile({ source: new ol.source.OSM() }); var birmingham = ol.proj.transform([-1.81185, 52.44314], 'EPSG:4326', 'EPSG:3857'); var view = new ol.View({ center: birmingham, zoom: 6 }); var map = new ol.Map({ target: 'map' }); map.addLayer(osmLayer); map.setView(view); </script> </body> </html> - Open
hello_openstreetmap.htmlin your web browser. It can be hosted on a server or opened as a file. You should see something similar to the screenshot that follows: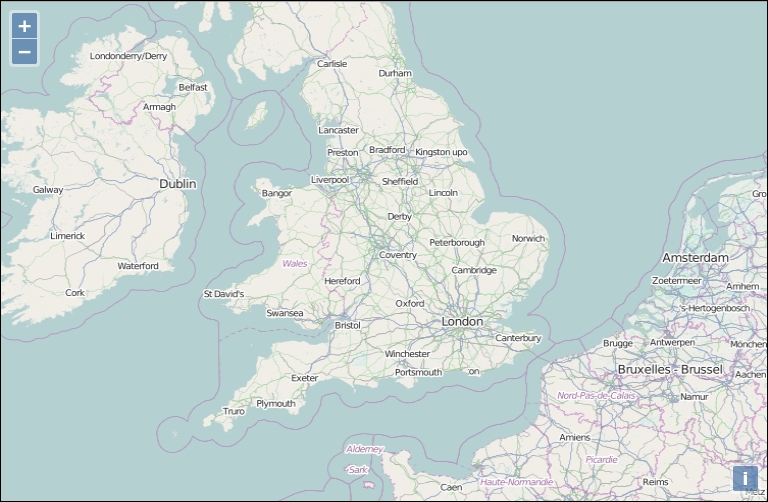
We just created our first map using OpenLayers! If it did not work for you for some reason, try double-checking the code and making sure all the commas and parentheses are in place. You can also open the browser debugger and look for JavaScript errors within the console. If you don't know what a console is, don't worry, we will see it soon. You can also refer to the Preface where a link to code samples used in the book is given. By default, we're given a few controls if we don't specify any. We will use the file we created as a template for many examples throughout the book, so save a copy of it so you can easily refer to it later.
The control on the left side (the navigation buttons) is called the Zoom control, which is a ol.control.Zoom object. You can click the buttons to navigate around the map, drag the map with your mouse, use the scroll wheel to zoom in, or use your keyboard's arrow keys. ol.control.Attribution is added by default. It will be populated if a layer (such as OSM) has attribution info available. This control is on the bottom right corner and gives the credits for the data you're using such as license and data producer.
We'll cover controls in greater detail in Chapter 9, Taking Control of Controls.
Now, let's take a look at the code, line by line.
- Lines 1 to 7: It sets up the HTML page. Every HTML page needs an
<html>and<head>tag, and the extraneous code you see specifies various settings that inform your browser that this is an HTML5 compliant page. For example, we include theDOCTYPEdeclaration in line 1 to specify that the page conforms to standards set by the WC3. We also specify a<title>tag, which contains the title that will be displayed on the page. We also add acssstylesheetcontent to display correctly the zoom and attribution controls, and set the future map size to a height of500pxand a width of100%(the width will always be at the max width depending on the browser window).This is the structure that all our code examples will follow, so this basic code template will be implicitly assumed in all examples that follow throughout the book.
- Lines 8 and 9:
<body>
<div id="map" class="map"></div>
To make an OpenLayers map, we need an HTML element where the map will be displayed in. Almost always, this element will be a
div. You can give it whatever ID you would like, and the ID of this HTML element is passed into the call to create the map object. You can style the<div>tag however you would like—setting the width and height to be 100 percent, for instance, if you want a full page map. We choose a class for this, also calledmap. - Line 10:
<script src="../assets/ol3/js/ol.js" type="text/javascript"></script>
This includes the OpenLayers library. The location of the file is specified by the
src='../assets/ol3/js/ol.js'attribute. Here, we're using a relative path. As thehello_openstreetmap.htmlpage is within thesandboxat the same level as theassets, we need to go outside thesandboxdirectory and then set the path tool.jsfile . The file could either be on your computer, or another computer. Browsers can load it on any computer thanks to the relative path.We can also use an absolute path, which means we pass in a URL where the script is located at. openlayers.org hosts the script file as well; we could use the following line of code to link to the library file directly:
<script src='http://openlayers.org/en/v3.0.0/build/ol.js></script>
Notice how the
srcspecifies an actual URL which is an absolute pathhttp://openlayers.org/en/v3.0.0/css/ol.cssat line 5.Either way works, however, throughout the book we'll assume that you are using a relative path and have the OpenLayers library on your own computer/server. If you use the hosted OpenLayers library, you cannot be sure that it will always be available, so using a local copy is recommended.Be aware that when browsers load a page, they load it from top to bottom. To use any DOM (Document Object Model) elements (any HTML element on your page) in JavaScript, they first have to be loaded by the browser. So, you cannot reference HTML with JavaScript before the browser sees the element. It'd be similar to trying to access a variable that hasn't yet been created. Because of this behavior, don't forget to call your JavaScript content after the
<div id="map" class="map"></div>. - Line 11: This starts a
<script>block. We'll set up all our code inside it to create our map. Since the OpenLayers library has been included in line 13, we are able to use all the classes and functions the library contains. - Lines 12 to 14:
  var osmLayer = new ol.layer.Tile({
  source: new ol.source.OSM()
});
In the previous three lines of code, we created a global variable called
osmLayer. In JavaScript, any time we create a variable we need to placevarin front of it to ensure that we don't run into scope issues (what functions can access which variables). When accessing a variable, you do not need to putvarin front of it.Since we are defining
osmLayeras a variable at the global level (outside of any functions), we can access it anywhere in our code. We declare theosmLayeras anol.layer.Tileobject. It means we use anol.layer.Tileclass for creating the variablelayerOsm.The object created is also referred to as an instance of the
ol.layer.Tileclass. We'll talk about what this means later in the Appendix A, Object-oriented Programming – Introduction and Concepts.Now, let's look at the right hand side of the equal sign (
=):newkeyword means that we are creating a new object from the class that follows it.ol.layer.Tileis the class name which we are creating an object from. Notice that something is inside the parenthesis:{source: new ol.source.OSM()}. This means we are passing one thing into the class (called an argument). Every class in OpenLayers expects different arguments to be passed into it, and some classes don't expect anything.The
ol.layer.Tileclass expects one parameter following the API doc reference. Take a look at: http://openlayers.org/en/v3.0.0/apidoc/ol.layer.Tile.html. The{source: new ol.source.OSM()}is the layer options, consisting ofkey:valuepairs (for example,{key:value}). This is also called JavaScript Object Literal Notation, a way to create objects on the fly.Tip
JavaScript object literal notation
In OpenLayers, we often pass in anonymous objects to classes . In JavaScript, anonymous objects are commas separated
key:valuepairs, and are set up in the format of{key1:value1, key2:value2}. They are, basically, objects that are created without deriving from a class. This format is also referred to as object literal notation.When we say
key1:value1, it's similar to sayingkey1 = value1, but we use a colon instead of an equals sign. We can also affect to a variable an object and reuse this variable instead of creating it on the line, for example:var layer_parameters = {source: new ol.source.OSM()}; var osmLayer = new ol.layer.Tile(layer_parameters);So, the option source
new ol.source.OSM()is the way to tell the characteristic of the tiles we want to retrieve such as the URL or the default attribution text, whereasol.layer.Tileis the way to say how you ask the map image, not where it comes from.The type of
ol.sourcecan be any from a multitude of different services, but we are using OSM here as a source. OSM (OpenStreetMap), is a crowdsourcing project focusing on creating open source map data. The main visible part of the project is the OSM world map we are using.The arguments, like the source we can pass in for layers, are dependent on the layer class—we cover layers in detail in Chapter 3, Charting the Map Class. If you don't want to wait, you can also check out the documentation at http://openlayers.org/en/v3.0.0/apidoc/ to see what arguments different layers of classes expect.
- Line 15:
var birmingham = ol.proj.transform([-1.81185 52.44314], 'EPSG:4326', 'EPSG:3857');
In this line of code, we take coordinates from a place, Birmingham in the UK, and we use a custom function that transforms [longitude, latitude] to the projected coordinate the map will expect in the view.
- Lines 16 to 19:
var view = new ol.View({ center: birmingham zoom: 6 });In the preceding four lines of code, we are defining a view from class
ol.View. It's to use a view. Until now, we have defined what we will see, but with the view, we will define from where we are seeing it. Think of view as equivalent to a shot you might see in a cinema and where the cameraman chooses to see actors with more or less light, from far away or near, from below or above. Maps are usually 2D objects but because of new capabilities in the library, you can also have a tilted 2D view. We will not cover it because it requires advanced knowledge.We have two options here in the JavaScript object:
centerandzoom.The first one sets the center of the map with coordinates. These are not using latitude and longitude coordinates but Spherical Mercator coordinates, a common web mapping standard projection. We will explain this topic in Chapter 7, Wrapping Our Heads Around Projections.
The zoom is a way to set the level of details you get on the map when you open the web page. Change this value to understand better. The value for using the OSM layer can be between 0 and 18. The more you increase the value, the more you zoom in. If you set the value to 20, you will see that the image is always of the level 18 but the library resizes the image itself and and the image quality will be reduced.
- Lines 20 to 22:
var map = new ol.Map({ target: 'map' });We previously created a layer in order to add it to a map but this map was not already created. We have done it using the
ol.Mapclass. The map object is the crux of our OpenLayers application— we call its functions to tell the view bound to the map to zoom to areas, fire off events, keep track of layers, and so on.The
ol.Mapclass expects a JavaScript object parameter. Within this object, we use one object parameter:target. You can provide another parameter renderer to choose the way the image will be displayed in the browser. It can be, DOM, Canvas, or WebGL. Don't worry about these terms, we will explain what they cover. This is not a mandatory option but we'd prefer to tell you already to be aware of this. You will learn more about this in Chapter 2, Key Concepts in OpenLayers.The other object parameter is target. Its purpose is to set where you will attach your map in the HTML. It refers to the
idof an HTML element available in your web page.Notice, we don't include everything on one line when creating our map object—this improves readability, making it easier to see what we pass in. The only difference is that we are also adding a new line after the comma separating arguments, which doesn't affect the code (but does make it easier to read).
- Line 23:
map.addLayer(osmLayer);
Now that we have created both the map and layer, we can add the layer to the map. In OpenLayers, every map needs to have at least one layer. The layer points to the backend, or the server side map server, as we discussed earlier.
Notice, we are calling a function of the map object. There are actually a few ways to go about adding a layer to a map object. We can use the previous code (by calling
map.addLayer), where we pass in an individual layer but we can also add the layers when instantiating theol.Mapwith something such as the following:var map = new ol.Map({ target: 'map', layers: [osmLayer] });In this second case, you have to create your layer before the map. Most official examples use the second syntax but for learning purposes, we thought it would be better to separate map instantiation from layers addition.
- Line 24:
map.setView(view);
This line enables you to set the view to render the image and display it at the right place you defined previously in the
ol.Viewinstance, the view variable. - Lines 25 to 27:
    </script>
  </body>
</html>
These lines close the JavaScript block and the remaining HTML blocks.
After reviewing this first example, if the concept of object-oriented programming is unfamiliar to you, we recommend that you take some time to explore this topic. While you don't necessarily need to know OOP concepts thoroughly to use this book, understanding keywords such as class, properties, abstract class, methods, instance, constructor, or inheritance should ring a bell in your mind. If not, we advise you to visit the Appendix A, Object-oriented Programming – Introduction and Concepts.
Now, let's introduce you to the main resources for getting the most important information about OpenLayers and its ecosystem.