Table of Contents for
OpenLayers 3 : Beginner's Guide
 OpenLayers 3 : Beginner's Guide
Published by
Packt Publishing, 2015
OpenLayers 3 : Beginner's Guide
Published by
Packt Publishing, 2015
- Cover
- Table of Contents
- OpenLayers 3 Beginner's Guide
- OpenLayers 3 Beginner's Guide
- Credits
- About the Authors
- About the Reviewers
- www.PacktPub.com
- Preface
- What you need for this book
- Who this book is for
- Sections
- Time for action – heading
- Conventions
- Reader feedback
- Customer support
- 1. Getting Started with OpenLayers
- Advantages of using OpenLayers
- What, technically, is OpenLayers?
- Anatomy of a web mapping application
- Connecting to Google, Bing Maps, and other mapping APIs
- Time for action – downloading OpenLayers
- Time for action – creating your first map
- Where to go for help
- OpenLayers issues
- OpenLayers source code repository
- Getting live news from RSS and social networks
- Summary
- 2. Key Concepts in OpenLayers
- Time for action – creating a map
- Time for action – using the JavaScript console
- Time for action – overlaying information
- OpenLayers' super classes
- Key-Value Observing with the Object class
- Time for action – using bindTo
- Working with collections
- Summary
- 3. Charting the Map Class
- Time for action – creating a map
- Map renderers
- Time for action – rendering a masterpiece
- Map properties
- Time for action – target practice
- Map methods
- Time for action – creating animated maps
- Events
- Views
- Time for action – linking two views
- Summary
- 4. Interacting with Raster Data Source
- Layers in OpenLayers 3
- Common operations on layers
- Time for action – changing layer properties
- Tiled versus untiled layers
- Types of raster sources
- Tiled images' layers and their sources
- Time for action – creating a Stamen layer
- Time for action – creating a Bing Maps layer
- Time for action – creating tiles and adding Zoomify layer
- Image layers and their sources
- Using Spherical Mercator raster data with other layers
- Time For action – playing with various sources and layers together
- Time For action – applying Zoomify sample knowledge to a single raw image
- Summary
- 5. Using Vector Layers
- Time for action – creating a vector layer
- How the vector layer works
- The vector layer class
- Vector sources
- Time for action – using the cluster source
- Time for action – creating a loader function
- Time for action – working with the TileVector source
- Time for action – a drag and drop viewer for vector files
- Features and geometries
- Time for action – geometries in action
- Time for action – interacting with features
- Summary
- 6. Styling Vector Layers
- Time for action – basic styling
- The style class
- Time for action – using the icon style
- Have a go hero – using the circle style
- Multiple styles
- Time for action – using multiple styles
- Style functions
- Time for action – using properties to style features
- Interactive styles
- Time for action – creating interactive styles
- Summary
- 7. Wrapping Our Heads Around Projections
- Time for action – using different projection codes
- Time for action – determining coordinates
- OpenLayers projection class
- Transforming coordinates
- Time for action – coordinate transforms
- Time for action – setting up Proj4js.org
- Time for action – reprojecting extent
- Time for action – using custom projection with WMS sources
- Time for action – reprojecting geometries in vector layers
- Summary
- 8. Interacting with Your Map
- Time for action – converting your local or national authorities data into web mapping formats
- Time for action – testing the use cases for ol.interaction.Select
- Time for action – more options with ol.interaction.Select
- Introducing methods to get information from your map
- Time for action – understanding the forEachFeatureAtPixel method
- Time for action – understanding the getGetFeatureInfoUrl method
- Adding a pop-up on your map
- Time for action – introducing ol.Overlay with a static example
- Time for action – using ol.Overlay dynamically with layers information
- Time for action – using ol.interaction.Draw to share new information on the Web
- Time for action – using ol.interaction.Modify to update drawing
- Understanding interactions and their architecture
- Time for action – configuring default interactions
- Discovering the other interactions
- Time for action – using ol.interaction.DragRotateAndZoom
- Time for action – making rectangle export to GeoJSON with ol.interaction.DragBox
- Summary
- 9. Taking Control of Controls
- Adding controls to your map
- Time for action – starting with the default controls
- Controls overview
- Time for action – changing the default attribution styles
- Time for action – finding your mouse position
- Time for action – configuring ZoomToExtent and manipulate controls
- Creating a custom control
- Time for action – extending ol.control.Control to make your own control
- Summary
- 10. OpenLayers Goes Mobile
- Using a web server
- Time for action – go mobile!
- The Geolocation class
- Time for action – location, location, location
- The DeviceOrientation class
- Time for action – a sense of direction
- Debugging mobile web applications
- Debugging on iOS
- Debugging on Android
- Going offline
- Time for action – MANIFEST destiny
- Going native with web applications
- Time for action – track me
- Summary
- 11. Creating Web Map Apps
- Using geospatial data from Flickr
- Time for action – getting Flickr data
- A simple application
- Time for Action – adding data to your map
- Styling the features
- Time for action – creating a style function
- Creating a thumbnail style
- Time for action – switching to JSON data
- Time for action – creating a thumbnail style
- Turning our example into an application
- Time for action – adding the select interaction
- Time for action – handling selection events
- Time for action – displaying photo information
- Using real time data
- Time for action – getting dynamic data
- Wrapping up the application
- Time for action – adding dynamic tags to your map
- Deploying an application
- Creating custom builds
- Creating a combined build
- Time for action – creating a combined build
- Creating a separate build
- Time for action – creating a separate build
- Summary
- A. Object-oriented Programming – Introduction and Concepts
- Going further
- B. More details on Closure Tools and Code Optimization Techniques
- Introducing Closure Library, yet another JavaScript library
- Time for action – first steps with Closure Library
- Making custom build for optimizing performance
- Time for action – playing with Closure Compiler
- Applying your knowledge to the OpenLayers case
- Time for action - running official examples with the internal OpenLayers toolkit
- Time for action - building your custom OpenLayers library
- Syntax and styles
- Time for action – using Closure Linter to fix JavaScript
- Summary
- C. Squashing Bugs with Web Debuggers
- Time for action – opening Chrome Developer Tools
- Explaining Chrome Developer debugging controls
- Time for action – using DOM manipulation with OpenStreetMap map images
- Time for action – using breakpoints to explore your code
- Time for action – playing with zoom button and map copyrights
- Using the Console panel
- Time for action – executing code in the Console
- Time for action – creating object literals
- Time for action – interacting with a map
- Improving Chrome and Developer Tools with extensions
- Debugging in other browsers
- Summary
- D. Pop Quiz Answers
- Chapter 5, Using Vector Layers
- Chapter 7, Wrapping Our Heads Around Projections
- Chapter 8, Interacting with Your Map
- Chapter 9, Taking Control of Controls
- Chapter 10, OpenLayers Goes Mobile
- Appendix B, More details on Closure Tools and Code Optimization Techniques
- Appendix C, Squashing Bugs with Web Debuggers
- Index
We noted at the end of the previous example that the map wasn't working normally. We replaced the default controls and interactions and so the default behavior wasn't present any more. Let's take a moment to try to fix this. In many cases, mistakes or oversights in our code will produce unexpected results. Web developers have a number of tools available to help them diagnose and fix these problems. In this example, we'll work with the Developer Tools available in the Chrome browser. Similar tools exist for all major browsers; if you are not using Chrome, you should still be able to follow along using your browser's Developer Tools. With the previous example open in your browser, let's get started:
- The first step is to open the Developer Tools. In Chrome, this is done by using one of the following methods:
- Select the Chrome menu at the top-right corner of your browser window, then select Tools | Developer Tools.
- Right-click on any element on the web page and select Inspect Element.
- Use a keyboard shortcut. On Windows or Linux, you can use Ctrl-Shift-I. On a Mac, you can use Cmd-Shift-I.
Using any of these methods, a new Developer Tools window will open. By default, the Developer Tools window will be docked to the current tab at the bottom. You can change this by detaching it to a separate window or moving it to one side, but for now, let's keep it at the bottom. It should look something like the following screenshot:
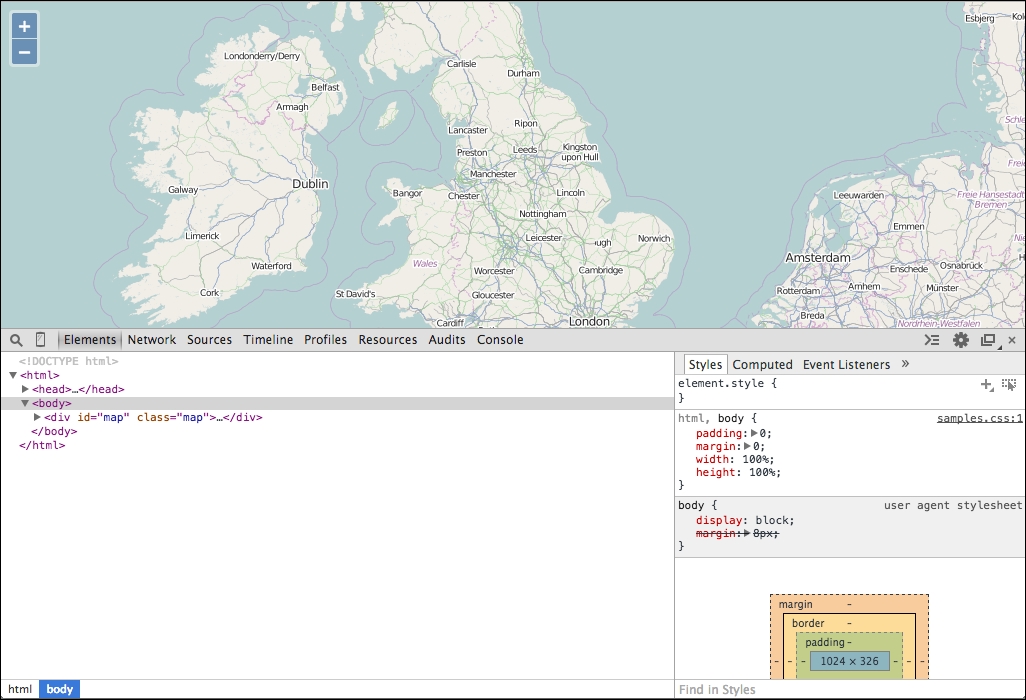
- Look at the bar between the map and the Developer Tools console. From left to right, the components are:
- A magnifying glass: If you click this, you can then hover over elements in the web page to select them and reveal them in the Elements panel.
- A vertical rectangle that looks a bit like a phone: If you click this, it enables device mode that allows you to emulate the size and features of most populate mobile devices.
- Elements: This panel shows the HTML elements that make up the current state of the Document Object Model (DOM). It's displayed as a tree structure. You can expand parts of the tree to investigate the structure of the web page. When you click an element, the panel on the right is updated to show the CSS styling information for the selected elements. You can edit both the element itself (in the tree view) and most of its CSS properties on the right. This is a great tool for testing quick CSS changes.
- Network: This panel displays the network requests made by the web page to load remote assets. You can see what is requested, the size, and response time to load assets, and if you click one you can see details about the request and response.
- Sources: This panel allows you to interact with your JavaScript code. You can set break points in different files, and when the execution of your code is stopped in the debugger, you can investigate the state of any variables and even modify their values.
- Timeline: This panel shows performance details about loading and executing your web page and can be very useful for identifying bottlenecks in your code.
- Profiles: This panel allows you to capture a snapshot of running code over a period of time and see which functions were called, how many times, and how much time was spent executing each function. This is another useful tool to use in improving performance of a slow web application.
- Resources: This panel shows you resources used by the current web page, including cookies and local storage.
- Audits: This panel can analyze your web page as it loads and provides suggestions for decreasing load time and improving real or perceived responsiveness.
- Console: This panel allows you to type in arbitrary JavaScript and run it within the context of the web page. If the debugger is currently paused on a line of code, then that will be the current context for the console.
- The next group of buttons, aligned to the right edge, shows (respectively) any errors or warnings for the current page (this will be missing if there are no errors or warnings), toggles an inline console that appears at the bottom of the current panel, a gear icon to access settings for the Developer Tools, a button to detach the Developer Tools into a separate window, and a button to close the Developer Tools on the far right.
- Open the console by clicking the Console tab. We will run some interactive JavaScript commands to add back some missing behavior. Specifically, we'll get the default OpenLayers interactions and add them to the map. Type the following code into the Console and hit Enter key to execute it. This should return the default set of controls for us:
controls = ol.control.defaults();
This should output the value that was assigned to the variable
controls, something like the following screenshot: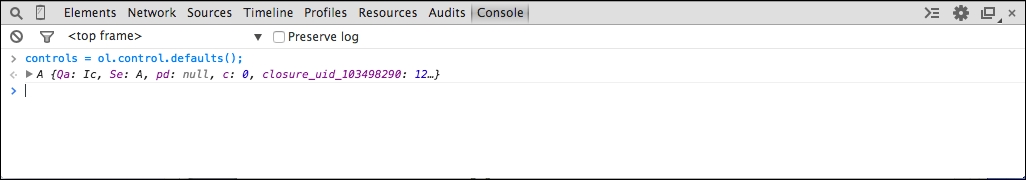
You can click the small triangle next to the line of output to expose properties of the object, like the following screenshot:
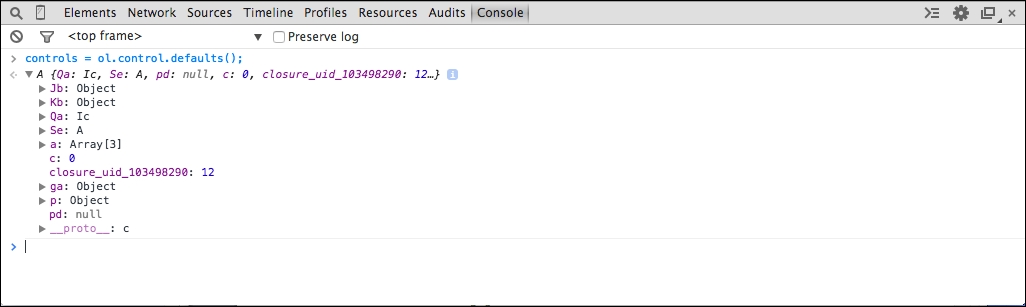
We can't even tell what kind of object this is! Let's fix that first.
- The version of OpenLayers we are using is compressed to minimize its size. While this is good for production use, it's not helping us because much of the useful information is obfuscated by the compression process. We'll need to use the debug version to get any further. Open the page in your text editor and change the script tag that adds
ol.jsto load the debug versionol-debug.js:<script src="../assets/ol3/js/ol-debug.js"></script>
Note
The build process used to create production and debug versions of OpenLayers is covered in detail in Chapter 11, Creating Web Map Apps and Appendix B, More details on Closure Tools and Code Optimization Techniques.
- Now, reload the page in your browser and type the JavaScript from step 4 into the Console tab again. You should be able to hit the up arrow to recall it easily and just hit Enter again. Now, we will get more useful information:
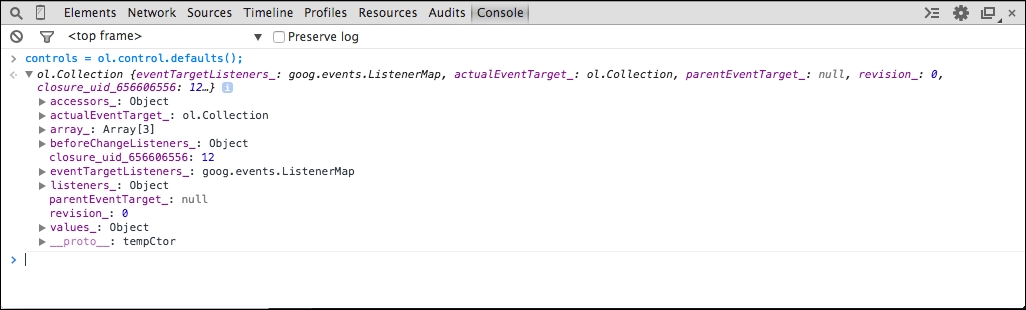
Now, we can see that the
controlsvariable is an instance ofol.Collectionand we should be able to add each of the elements of the collection to the map. The line of output expanded, you can see the properties of the collection object.Note
The last entry is labeled
__proto__and has a triangle next to it. The__proto__property is a special property that shows us an object's prototype, essentially the methods it gains from the class the object was created from. We can explore this property for methods available to be called on the object. Note that the__proto__property may also have a__proto__property revealing further methods inherited from other classes in the inheritance hierarchy. - We can use the map's
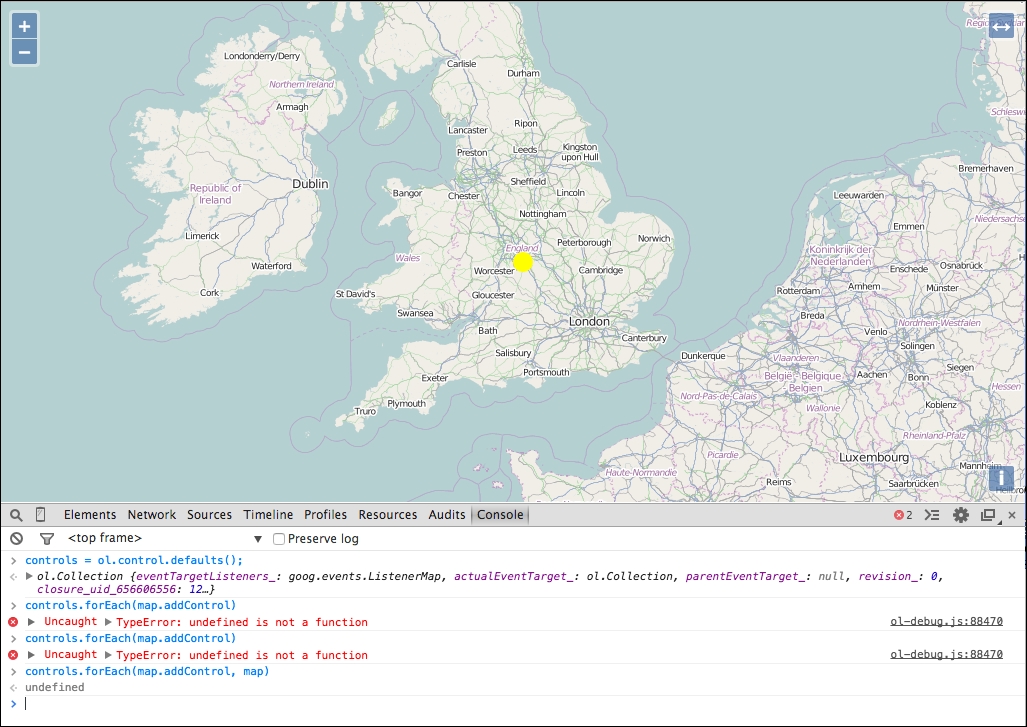
addControlmethod to add one control at a time, so we need a way of doing this for each individual controls in the collection. Collections have aforEachmethod that invokes a function for each item in the collection, which sounds ideal! Let's give it a try by running the following code in the Console tab:controls.forEach(map.addControl);
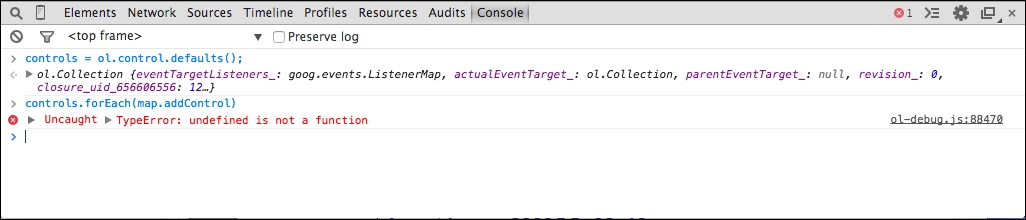
Something is not right, we are getting an error. Let's investigate.
- To the right of the line showing the error is the file in which it occurred and line number on which it occurred. Click on the filename to open the Sources panel at the line of code that is producing the error.
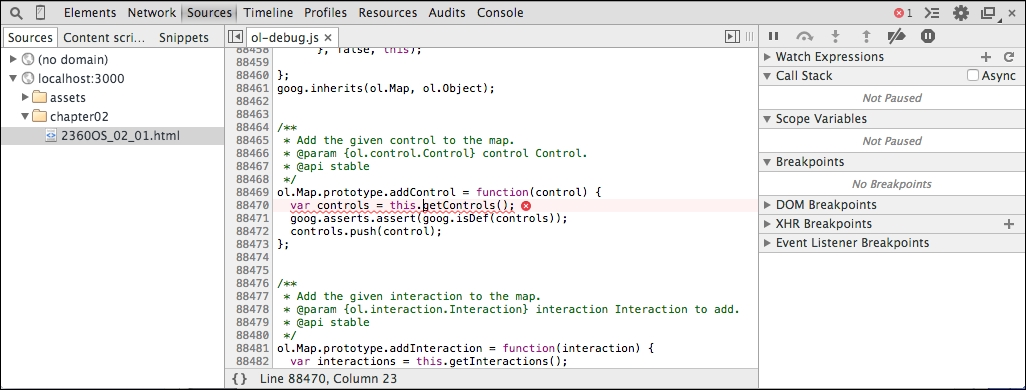
- We want to stop here and see what is going on. There are two ways we can do this. We can set a break point on this line of code, or we can ask the debugger to stop automatically when an error is detected. Let's take the first route and add a break point. To add a break point, simply click on the line number to the left of the line of code you want to stop on in the Sources panel and the line number is highlighted in blue. To remove a break point, just click it again.
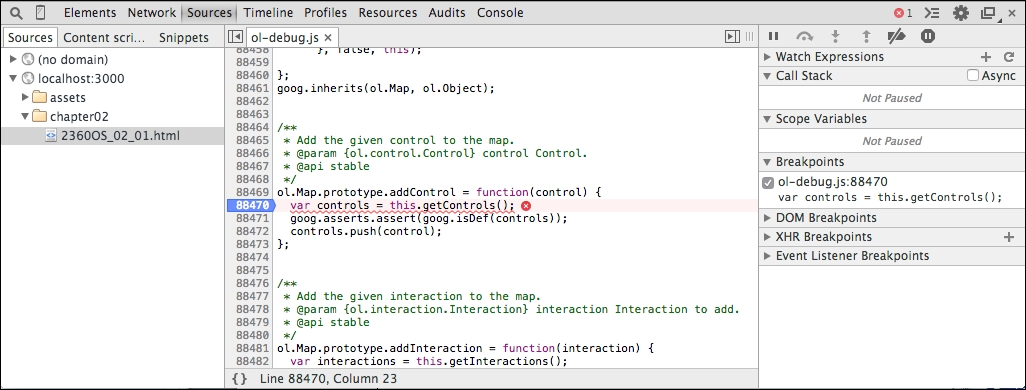
- With the break point set, click on Console again and rerun that last line of code. The debugger will automatically pause execution of the code when it gets to our break point and switch to the Sources panel for us.
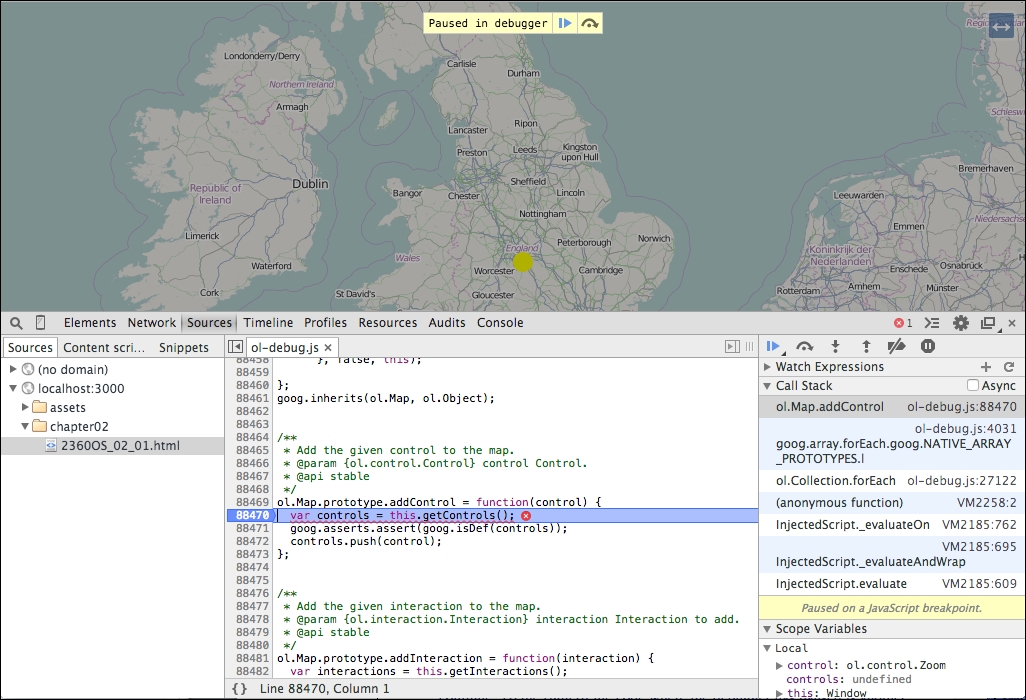
- The line of code we've stopped at assigns a variable, controls, with the result of calling
this.getControls(). Move the mouse over thethiskeyword and the debugger will show us what its value is. Now, we can see thatthisis theWindowobject and not aMapclass object, which is why thegetInteractionsmethod isundefined! We need to provide the correct object,map, as the scope of theforEachfunction call by passing it as the second argument.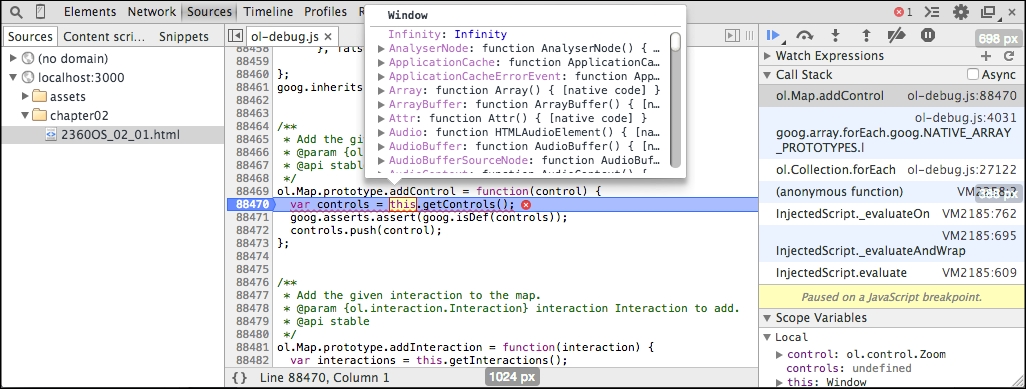
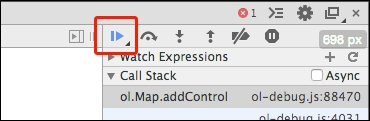
- Before we can try this, we need to let the execution of JavaScript code continue. Click the highlighted line number to remove the break point. To the right of the code, where the debugger has paused, is another panel that shows various information about the current state of the code. At the top of this panel is a row of buttons that control the debugger. The left-most button, a sideways triangle, will resume execution when the code is paused. Go ahead and click it now. A mini console will open at the bottom of the debugger and show us the error again.
- In the console, retype the last command, this time passing a second argument to specify the correct scope object for the callback function:
controls.forEach(map.addControl, map);
Much better! Now, we have all our controls back.
We used the Developer tools console to execute some JavaScript and modify our running application to add the default zoom controls that were missing. Along the way, we ran into a problem and switched to the debug build of the OpenLayers library so that we could get more useful information about problems we ran into. We touched briefly on using the powerful Developer tools, including the Console and Sources panels.
There are a great many things we can do with the Developer tools, and this just touches briefly on one aspect of them. Please read Appendix C, Squashing Bugs with Web Debuggers to learn more about using the Developer tools in application development.
In the following sections, we'll look a little more closely at each of the components we've introduced so far, starting with the view class.
Based on the previous example, use the Console to add the default interactions to the running application. You can get the default interactions by calling the ol.interaction.defaults() method.
The OpenLayers view class, ol.View, represents a simple two-dimensional view of the world. It is responsible for determining where, and to some degree how, the user is looking at the world. We'll cover views in more detail at the end of Chapter 3, Charting the Map Class, but briefly, it is responsible for managing the following information:
- The geographic center of the map
- The resolution of the map, which is to say how much of the map we can see around the center
- The rotation of the map
Although you can create a map without a view, it won't display anything until a view is assigned to it. Every map must have a view in order to display any map data at all. However, a view may be shared between multiple instances of the Map class. This effectively synchronizes the center, resolution, and rotation of each of the maps. In this way, you can create two or more maps in different HTML containers on a web page, even showing different information, and have them look at the same world position. Changing the position of any of the maps (for instance, by dragging one) automatically updates the other maps at the same time! We'll see an example of this in the next chapter.
So, if the view is responsible for managing where the user is looking in the world, which component is responsible for determining what the user sees there? That's the job of layers and overlays.
A layer provides access to a source of geospatial data. There are two basic kinds of layers, that is, raster and vector layers:
- In computer graphics, the term raster (raster graphics) refers to a digital image. In OpenLayers, a raster layer is one that displays images in your map at specific geographic locations. So far, all of our examples have used raster layers. We'll cover raster layers in Chapter 4, Interacting with Raster Data Source.
- In computer graphics, the term vector (vector graphics) refers to images that are defined in terms of geometric shapes, such as points, lines, and polygons—or mathematic formulae such as Bézier curves. In OpenLayers, a vector layer reads geospatial data from vector data (such as a KML file) and the data can then be drawn onto the map. We'll cover vector layers in Chapter 5, Using Vector Layers.
Layers are not the only way to display spatial information on the map. The other way is to use an overlay. As we saw in the example earlier in this chapter, we can create instances of ol.Overlay and add them to the map at specific locations. The overlay then positions its content (an HTML element) on the map at the specified location. The HTML element can then be used like any other HTML element.
The most common use of overlays is to display spatially relevant information in a pop-up dialog in response to the mouse moving over, or clicking on a geographic feature.