Table of Contents for
OpenLayers 3 : Beginner's Guide
 OpenLayers 3 : Beginner's Guide
Published by
Packt Publishing, 2015
OpenLayers 3 : Beginner's Guide
Published by
Packt Publishing, 2015
- Cover
- Table of Contents
- OpenLayers 3 Beginner's Guide
- OpenLayers 3 Beginner's Guide
- Credits
- About the Authors
- About the Reviewers
- www.PacktPub.com
- Preface
- What you need for this book
- Who this book is for
- Sections
- Time for action – heading
- Conventions
- Reader feedback
- Customer support
- 1. Getting Started with OpenLayers
- Advantages of using OpenLayers
- What, technically, is OpenLayers?
- Anatomy of a web mapping application
- Connecting to Google, Bing Maps, and other mapping APIs
- Time for action – downloading OpenLayers
- Time for action – creating your first map
- Where to go for help
- OpenLayers issues
- OpenLayers source code repository
- Getting live news from RSS and social networks
- Summary
- 2. Key Concepts in OpenLayers
- Time for action – creating a map
- Time for action – using the JavaScript console
- Time for action – overlaying information
- OpenLayers' super classes
- Key-Value Observing with the Object class
- Time for action – using bindTo
- Working with collections
- Summary
- 3. Charting the Map Class
- Time for action – creating a map
- Map renderers
- Time for action – rendering a masterpiece
- Map properties
- Time for action – target practice
- Map methods
- Time for action – creating animated maps
- Events
- Views
- Time for action – linking two views
- Summary
- 4. Interacting with Raster Data Source
- Layers in OpenLayers 3
- Common operations on layers
- Time for action – changing layer properties
- Tiled versus untiled layers
- Types of raster sources
- Tiled images' layers and their sources
- Time for action – creating a Stamen layer
- Time for action – creating a Bing Maps layer
- Time for action – creating tiles and adding Zoomify layer
- Image layers and their sources
- Using Spherical Mercator raster data with other layers
- Time For action – playing with various sources and layers together
- Time For action – applying Zoomify sample knowledge to a single raw image
- Summary
- 5. Using Vector Layers
- Time for action – creating a vector layer
- How the vector layer works
- The vector layer class
- Vector sources
- Time for action – using the cluster source
- Time for action – creating a loader function
- Time for action – working with the TileVector source
- Time for action – a drag and drop viewer for vector files
- Features and geometries
- Time for action – geometries in action
- Time for action – interacting with features
- Summary
- 6. Styling Vector Layers
- Time for action – basic styling
- The style class
- Time for action – using the icon style
- Have a go hero – using the circle style
- Multiple styles
- Time for action – using multiple styles
- Style functions
- Time for action – using properties to style features
- Interactive styles
- Time for action – creating interactive styles
- Summary
- 7. Wrapping Our Heads Around Projections
- Time for action – using different projection codes
- Time for action – determining coordinates
- OpenLayers projection class
- Transforming coordinates
- Time for action – coordinate transforms
- Time for action – setting up Proj4js.org
- Time for action – reprojecting extent
- Time for action – using custom projection with WMS sources
- Time for action – reprojecting geometries in vector layers
- Summary
- 8. Interacting with Your Map
- Time for action – converting your local or national authorities data into web mapping formats
- Time for action – testing the use cases for ol.interaction.Select
- Time for action – more options with ol.interaction.Select
- Introducing methods to get information from your map
- Time for action – understanding the forEachFeatureAtPixel method
- Time for action – understanding the getGetFeatureInfoUrl method
- Adding a pop-up on your map
- Time for action – introducing ol.Overlay with a static example
- Time for action – using ol.Overlay dynamically with layers information
- Time for action – using ol.interaction.Draw to share new information on the Web
- Time for action – using ol.interaction.Modify to update drawing
- Understanding interactions and their architecture
- Time for action – configuring default interactions
- Discovering the other interactions
- Time for action – using ol.interaction.DragRotateAndZoom
- Time for action – making rectangle export to GeoJSON with ol.interaction.DragBox
- Summary
- 9. Taking Control of Controls
- Adding controls to your map
- Time for action – starting with the default controls
- Controls overview
- Time for action – changing the default attribution styles
- Time for action – finding your mouse position
- Time for action – configuring ZoomToExtent and manipulate controls
- Creating a custom control
- Time for action – extending ol.control.Control to make your own control
- Summary
- 10. OpenLayers Goes Mobile
- Using a web server
- Time for action – go mobile!
- The Geolocation class
- Time for action – location, location, location
- The DeviceOrientation class
- Time for action – a sense of direction
- Debugging mobile web applications
- Debugging on iOS
- Debugging on Android
- Going offline
- Time for action – MANIFEST destiny
- Going native with web applications
- Time for action – track me
- Summary
- 11. Creating Web Map Apps
- Using geospatial data from Flickr
- Time for action – getting Flickr data
- A simple application
- Time for Action – adding data to your map
- Styling the features
- Time for action – creating a style function
- Creating a thumbnail style
- Time for action – switching to JSON data
- Time for action – creating a thumbnail style
- Turning our example into an application
- Time for action – adding the select interaction
- Time for action – handling selection events
- Time for action – displaying photo information
- Using real time data
- Time for action – getting dynamic data
- Wrapping up the application
- Time for action – adding dynamic tags to your map
- Deploying an application
- Creating custom builds
- Creating a combined build
- Time for action – creating a combined build
- Creating a separate build
- Time for action – creating a separate build
- Summary
- A. Object-oriented Programming – Introduction and Concepts
- Going further
- B. More details on Closure Tools and Code Optimization Techniques
- Introducing Closure Library, yet another JavaScript library
- Time for action – first steps with Closure Library
- Making custom build for optimizing performance
- Time for action – playing with Closure Compiler
- Applying your knowledge to the OpenLayers case
- Time for action - running official examples with the internal OpenLayers toolkit
- Time for action - building your custom OpenLayers library
- Syntax and styles
- Time for action – using Closure Linter to fix JavaScript
- Summary
- C. Squashing Bugs with Web Debuggers
- Time for action – opening Chrome Developer Tools
- Explaining Chrome Developer debugging controls
- Time for action – using DOM manipulation with OpenStreetMap map images
- Time for action – using breakpoints to explore your code
- Time for action – playing with zoom button and map copyrights
- Using the Console panel
- Time for action – executing code in the Console
- Time for action – creating object literals
- Time for action – interacting with a map
- Improving Chrome and Developer Tools with extensions
- Debugging in other browsers
- Summary
- D. Pop Quiz Answers
- Chapter 5, Using Vector Layers
- Chapter 7, Wrapping Our Heads Around Projections
- Chapter 8, Interacting with Your Map
- Chapter 9, Taking Control of Controls
- Chapter 10, OpenLayers Goes Mobile
- Appendix B, More details on Closure Tools and Code Optimization Techniques
- Appendix C, Squashing Bugs with Web Debuggers
- Index
For this example, we will render the country layer by styling each country based on income level by associating its country code to income level data provided by the world bank. There are quite a few brackets; so, we've simplified it to four levels: high, medium, low, and poor. We'll draw each country in a color associated with its income level based on these brackets. Let's start from the previous example.
- At the beginning of the
<script>tag, before anything else, we will define colors for the four brackets. Use any colours you like:var high = [64,196,64,1]; var mid = [108,152,64,1]; var low = [152,108,64,1]; var poor = [196,32,32,1];
- The income levels for each feature are indicated by a code. We need a way to look up the color to use for each code. You don't need to include the comments, they are there to show how we are grouping the income levels:
var incomeLevels = { 'HIC': high, // high income 'OEC': high, // high income OECD 'NOC': high, // high income, non-OECD 'UMC': mid, // upper middle income 'MIC': mid, // middle income 'LMC': mid, // lower middle income 'LIC': low, // low income 'LMY': low, // low and middle income 'HPC': poor // heavily indebted poor country }; - It's good practice to have a default style to use if something goes wrong:
var defaultStyle = new ol.style.Style({ fill: new ol.style.Fill({ color: [250,250,250,1] }), stroke: new ol.style.Stroke({ color: [220,220,220,1], width: 1 }) }); - Our style function will create styles as needed and cache them. Here's the cache and the style function. We'll discuss what it does at the end of the code.
var styleCache = {}; function styleFunction(feature, resolution) { var level = feature.get('incomeLevel'); if (!level || !incomeLevels[level]) { return [defaultStyle]; } if (!styleCache[level]) { styleCache[level] = new ol.style.Style({ fill: new ol.style.Fill({ color: incomeLevels[level] }), stroke: defaultStyle.stroke }); } return [styleCache[level]]; } - Modify the countries layer to use the style function. While you are at it, make sure the source is specified as a separate object. We'll need this in a moment:
var source = new ol.source.GeoJSON({ projection: 'EPSG:3857', url: '../assets/data/countries.geojson' }); var countries = new ol.layer.Vector({ source: source, style: styleFunction }); - Now, we come to the part where we load the income data and associate it with our features. Add the following somewhere after the source is defined:
var key = source.on('change', function(event) { if (event.target.getState() == 'ready') { source.unByKey(key); $.ajax('../assets/data/income_levels.json').done(function(data) { source.forEachFeature(function(feature) { var code = feature.get('iso_a2'); if (data[code]) { feature.set('incomeLevel', data[code]); } }); }); } }); - Give it a whirl, you should see something like the following screenshot:
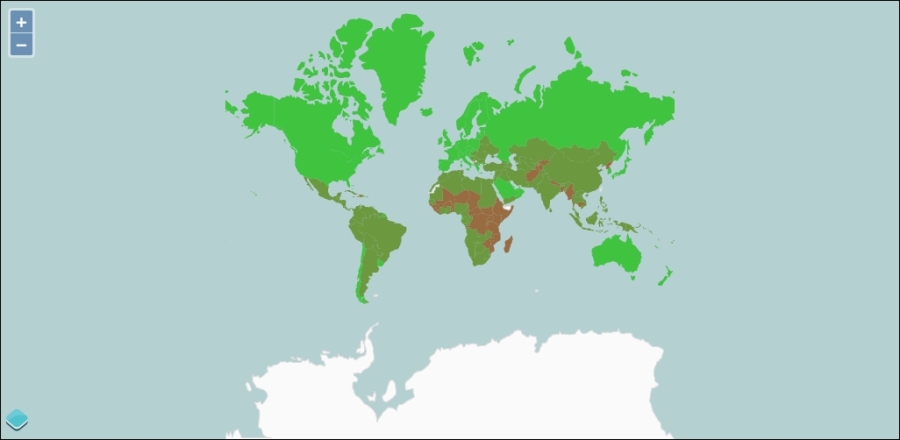
Let's review what is happening in this example. We are using a standard setup for vector layers, and combining some extra data into our features dynamically. The data is used to style, or classify, the country polygons by the income level as recorded by the world bank. Some interesting things are happening in this example; so we'll look at each step and highlight what's going on.
In step 1, we created some colors to be used to fill countries that fall into one of the four income categories. The number of categories is arbitrary—you can create colors for each of the income levels, or decide to group them differently.
In step 2, we created an object that we can use to look up a color based on an income level, and in step 3, we defined a default style. It's usually good practice when dealing with data that can change to have some kind of fallback so that your code doesn't break. We'll use the default style if we can't find a income level in our lookup object.
In step 4, we created our style function. Another best practice is to reuse style objects as much as possible. Since several countries might be drawn in the same style, we created an empty object (the styleCache) to store previously created styles. The actual function comes next. When the style function is called, it gets a reference to the feature being styled and the current resolution of the view on which it is being rendered. We aren't using the resolution in this example. We are using the feature, however. The feature should have a property called incomeLevel that matches the values in our lookup tables, so we grab that value and assign it to a variable. If the income level wasn't set or if it doesn't exist in the lookup table, we'll return the default style. Otherwise, we can check to see whether the styleCache object already has a style for this income level. If it doesn't, we need to create a new style using the color from our lookup table. In this case, we are using the default style's stroke for everything, but you could easily change the stroke for each feature too. Because we've assigned the new style to the correct slot in the cache, we can then return it directly.
Note
Note that in both cases, we return an array containing the style. This is required for a very important reason: performance! The Style functions are executed a lot of times when rendering vector features and if OpenLayers had to check the return type of each call to see if it was a style object or an array of style objects, this would add significant overhead to the rendering pipeline. For individual features, the difference is so tiny that it's probably not measurable even with the best of tools. For many features, this tiny difference adds up to a lot and it is measurable. The OpenLayers developers have put a lot of effort into this kind of detail and it shows!
In step 5, we modified the layer to use the style function we just created and defined a separate variable for the source. This was to make the next step a little easier.
In step 6, we loaded the income level data. The goal of the code in this step is to load the income data and associate it with the appropriate country feature. To do this, we need to make sure that the country features have been loaded. Once the countries are loaded, then, we need to load the income data. Then we can create a new property on each country feature with the appropriate income level. There are a few important things happening in this step, so we'll review each line:
- Line 1: This registers for the change event on the source and assigns the return value to a variable. The sources inherit from
ol.Observableand so they provide theon()method for this. Recall from Chapter 2, Key Concepts in OpenLayers, that theon()method returns a key that can be used later to deregister an event handler (using theunByKey()method)—we'll need it in just a moment. The change event on a vector source is triggered when the source changes state. - Line 2: This checks the state of the source to see if the source is ready. There are three states—loading, ready, and error—for a vector source, and we are interested to know when the state changes to ready as that's when we can load our income data safely.
- Line 3: This unregisters the event handler by using the
unByKey()method so that the handler doesn't get called again. This is very important. A source triggers the change event when its state changes, but also when any of its features change. This means that our event handler will get called again when we add properties to the feature. Since the state of the source will already be ready, our code will try to load the income data again and will create an infinite loop. - Line 4: This line loads the income data using jQuery's
ajax()method. The data loaded from this file is passed to the function we register usingdone(). - Line 5: This line starts a loop over each of the features in the source by calling
forEachFeature()and providing a function that will be called with each feature. - Line 6: This line gets the
iso_a2property of the feature, which is a two letter code associated with each country. The income data in our file is organized by this code so we can use this code to get the income level for each country. - Line 7: This checks to see if the income data has a value for the current country and line 8 adds the income level as a property of the feature if it does. As we add the property to each feature, the map responds to the change by redrawing itself. You might think that it seems inefficient to redraw the map for each feature change. What actually happens though, is that the map schedules a redraw for the next available render cycle. This won't happen until the current JavaScript process completes, so all the features will be changed and the map will only be redrawn once at some (very short) time later.
These eight lines of code accomplish quite a bit and combine concepts from other chapters of this book, including Chapter 2, Key Concepts in OpenLayers (event registration and deregistration) and Chapter 5, Using Vector Layers (vector layers, vector sources, and feature properties).