Table of Contents for
OpenLayers 3 : Beginner's Guide
 OpenLayers 3 : Beginner's Guide
Published by
Packt Publishing, 2015
OpenLayers 3 : Beginner's Guide
Published by
Packt Publishing, 2015
- Cover
- Table of Contents
- OpenLayers 3 Beginner's Guide
- OpenLayers 3 Beginner's Guide
- Credits
- About the Authors
- About the Reviewers
- www.PacktPub.com
- Preface
- What you need for this book
- Who this book is for
- Sections
- Time for action – heading
- Conventions
- Reader feedback
- Customer support
- 1. Getting Started with OpenLayers
- Advantages of using OpenLayers
- What, technically, is OpenLayers?
- Anatomy of a web mapping application
- Connecting to Google, Bing Maps, and other mapping APIs
- Time for action – downloading OpenLayers
- Time for action – creating your first map
- Where to go for help
- OpenLayers issues
- OpenLayers source code repository
- Getting live news from RSS and social networks
- Summary
- 2. Key Concepts in OpenLayers
- Time for action – creating a map
- Time for action – using the JavaScript console
- Time for action – overlaying information
- OpenLayers' super classes
- Key-Value Observing with the Object class
- Time for action – using bindTo
- Working with collections
- Summary
- 3. Charting the Map Class
- Time for action – creating a map
- Map renderers
- Time for action – rendering a masterpiece
- Map properties
- Time for action – target practice
- Map methods
- Time for action – creating animated maps
- Events
- Views
- Time for action – linking two views
- Summary
- 4. Interacting with Raster Data Source
- Layers in OpenLayers 3
- Common operations on layers
- Time for action – changing layer properties
- Tiled versus untiled layers
- Types of raster sources
- Tiled images' layers and their sources
- Time for action – creating a Stamen layer
- Time for action – creating a Bing Maps layer
- Time for action – creating tiles and adding Zoomify layer
- Image layers and their sources
- Using Spherical Mercator raster data with other layers
- Time For action – playing with various sources and layers together
- Time For action – applying Zoomify sample knowledge to a single raw image
- Summary
- 5. Using Vector Layers
- Time for action – creating a vector layer
- How the vector layer works
- The vector layer class
- Vector sources
- Time for action – using the cluster source
- Time for action – creating a loader function
- Time for action – working with the TileVector source
- Time for action – a drag and drop viewer for vector files
- Features and geometries
- Time for action – geometries in action
- Time for action – interacting with features
- Summary
- 6. Styling Vector Layers
- Time for action – basic styling
- The style class
- Time for action – using the icon style
- Have a go hero – using the circle style
- Multiple styles
- Time for action – using multiple styles
- Style functions
- Time for action – using properties to style features
- Interactive styles
- Time for action – creating interactive styles
- Summary
- 7. Wrapping Our Heads Around Projections
- Time for action – using different projection codes
- Time for action – determining coordinates
- OpenLayers projection class
- Transforming coordinates
- Time for action – coordinate transforms
- Time for action – setting up Proj4js.org
- Time for action – reprojecting extent
- Time for action – using custom projection with WMS sources
- Time for action – reprojecting geometries in vector layers
- Summary
- 8. Interacting with Your Map
- Time for action – converting your local or national authorities data into web mapping formats
- Time for action – testing the use cases for ol.interaction.Select
- Time for action – more options with ol.interaction.Select
- Introducing methods to get information from your map
- Time for action – understanding the forEachFeatureAtPixel method
- Time for action – understanding the getGetFeatureInfoUrl method
- Adding a pop-up on your map
- Time for action – introducing ol.Overlay with a static example
- Time for action – using ol.Overlay dynamically with layers information
- Time for action – using ol.interaction.Draw to share new information on the Web
- Time for action – using ol.interaction.Modify to update drawing
- Understanding interactions and their architecture
- Time for action – configuring default interactions
- Discovering the other interactions
- Time for action – using ol.interaction.DragRotateAndZoom
- Time for action – making rectangle export to GeoJSON with ol.interaction.DragBox
- Summary
- 9. Taking Control of Controls
- Adding controls to your map
- Time for action – starting with the default controls
- Controls overview
- Time for action – changing the default attribution styles
- Time for action – finding your mouse position
- Time for action – configuring ZoomToExtent and manipulate controls
- Creating a custom control
- Time for action – extending ol.control.Control to make your own control
- Summary
- 10. OpenLayers Goes Mobile
- Using a web server
- Time for action – go mobile!
- The Geolocation class
- Time for action – location, location, location
- The DeviceOrientation class
- Time for action – a sense of direction
- Debugging mobile web applications
- Debugging on iOS
- Debugging on Android
- Going offline
- Time for action – MANIFEST destiny
- Going native with web applications
- Time for action – track me
- Summary
- 11. Creating Web Map Apps
- Using geospatial data from Flickr
- Time for action – getting Flickr data
- A simple application
- Time for Action – adding data to your map
- Styling the features
- Time for action – creating a style function
- Creating a thumbnail style
- Time for action – switching to JSON data
- Time for action – creating a thumbnail style
- Turning our example into an application
- Time for action – adding the select interaction
- Time for action – handling selection events
- Time for action – displaying photo information
- Using real time data
- Time for action – getting dynamic data
- Wrapping up the application
- Time for action – adding dynamic tags to your map
- Deploying an application
- Creating custom builds
- Creating a combined build
- Time for action – creating a combined build
- Creating a separate build
- Time for action – creating a separate build
- Summary
- A. Object-oriented Programming – Introduction and Concepts
- Going further
- B. More details on Closure Tools and Code Optimization Techniques
- Introducing Closure Library, yet another JavaScript library
- Time for action – first steps with Closure Library
- Making custom build for optimizing performance
- Time for action – playing with Closure Compiler
- Applying your knowledge to the OpenLayers case
- Time for action - running official examples with the internal OpenLayers toolkit
- Time for action - building your custom OpenLayers library
- Syntax and styles
- Time for action – using Closure Linter to fix JavaScript
- Summary
- C. Squashing Bugs with Web Debuggers
- Time for action – opening Chrome Developer Tools
- Explaining Chrome Developer debugging controls
- Time for action – using DOM manipulation with OpenStreetMap map images
- Time for action – using breakpoints to explore your code
- Time for action – playing with zoom button and map copyrights
- Using the Console panel
- Time for action – executing code in the Console
- Time for action – creating object literals
- Time for action – interacting with a map
- Improving Chrome and Developer Tools with extensions
- Debugging in other browsers
- Summary
- D. Pop Quiz Answers
- Chapter 5, Using Vector Layers
- Chapter 7, Wrapping Our Heads Around Projections
- Chapter 8, Interacting with Your Map
- Chapter 9, Taking Control of Controls
- Chapter 10, OpenLayers Goes Mobile
- Appendix B, More details on Closure Tools and Code Optimization Techniques
- Appendix C, Squashing Bugs with Web Debuggers
- Index
Let's try with another example to discover more about the forEachFeatureAtPixel method. It should remind you about the last sample from Chapter 5, Using Vector Layers. To complete the task, check the following steps:
- First, copy and paste the code from Time for action – converting your local or national authorities data into web mapping formats, that is, the file
2360_08_01_simple_select.htmlin a new HTML file2360_08_03_foreachfeatureatpixel.html. - Then change the
ol.jsJavaScript file reference withol-debug.js. - After that, add at the end of the JavaScript section of the new HTML file the following:
map.on('click' , function(evt) { var pixel = evt.pixel; console.log(evt); console.log(pixel);}); - Open your browser with the console, and click where you have blue features to get a result like the following screenshot:
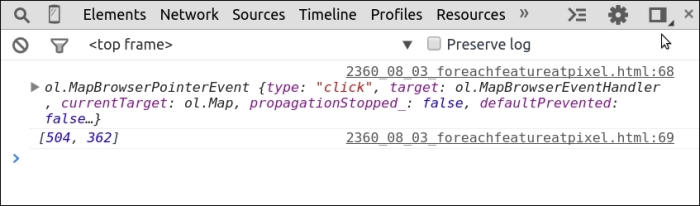
- Next, remove both
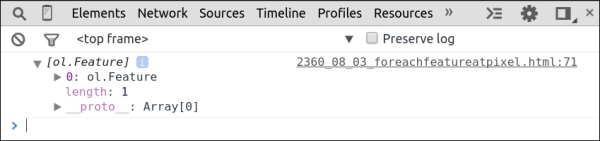
console.logstatements, and add the following code just after the linevar pixel = evt.pixel;displayFeatureInfo(pixel);. - Add the function
displayFeatureInfobefore themap.on(code:var displayFeatureInfo = function(pixel) { var features = []; map.forEachFeatureAtPixel(pixel, function(feature, layer) { features.push(feature); }); console.log(features);}; - Again, open your browser and try to click not only on features, but also on the sea, where you don't have features to understand the behavior. Here's the resultant screenshot:
- Replace
console.logwith this code:var container = document.getElementById('information'); if (features.length > 0) { var info = []; for (var i = 0, ii = features.length; i < ii; ++i) { info.push(features[i].get('N3NM')); } container.innerHTML = info.join(', ') || '(unknown)'; } else { container.innerHTML = ' '; } - Add just before the HTML div the class map, as follows:
<div id="information"></div>
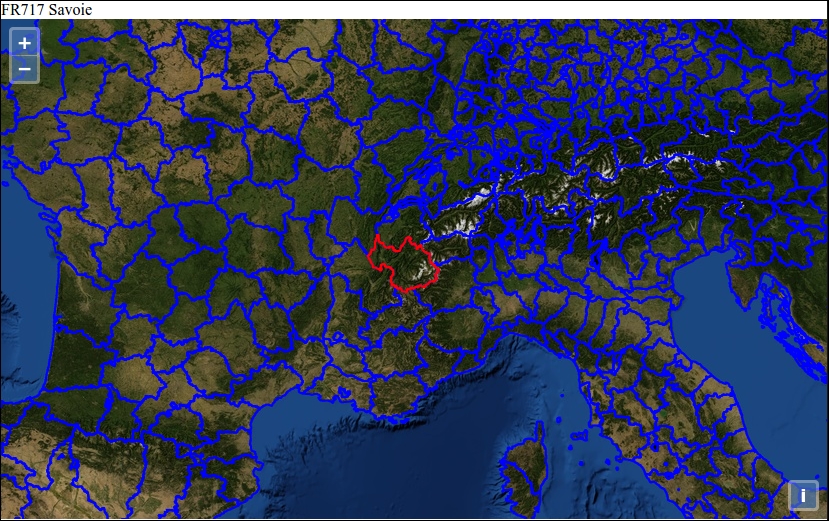
- Now, for the last time, open or reload your example, and click on features on the map to see something like the following screenshot:
First, with console.log, we tried to see the event content and also get the pixel position with an array of x, y, where we click. Next, we made a call to the function that relies on a map.forEachFeatureAtPixel function. Its purpose is to get back every feature under the click using the pixel position from the event where we want to see the return you get from the callback in success property and also restrict the action on the vectorEuropa layer.
We also saw that the return contained the ol.Feature object, and because of this, we chose to play to try if the return was empty or not. As a click can send back more than one feature, we used a loop to push the features property N3NM information in an array. Depending on this, we have the choice to display or not the name of the NUTS region with the attribute N3NM in a DOM element in the screenshot FR717 Savoie.
After this review, we know how to retrieve and manipulate information from vector layers. You understand that the method map.forEachFeatureAtPixel within displayFeatureInfo sends back ol.Feature. You can manipulate to retrieve geometry or attributes from the layers you click on.
There is another way to retrieve information when clicking, and it's with the WMS getGetFeatureInfoUrl method. In which circumstances should we use it, and why does it exist?
The title can be unclear if you don't already have some basics.
For this, we will start by reviewing the Open Geospatial Consortium (OGC) Web Map Services (WMS) standard.
Let's begin with the basics of WMS, and later, we will come back to the main topic.
For this, we will reuse two excerpts from the Geoserver documentation (a server-side component that can work with the OpenLayers 3 library).
The first one summarizes what WMS is:
"The OGC Web Map Service (WMS) specification defines an HTTP interface for requesting georeferenced map images from a server."
The second one, a table, gives you the type of requests the WMS standard can perform:
In this list of possible operations, the most common operation is GetMap, an operation that send back an image to display in a client, JavaScript or desktop.
But you also see GetFeatureInfo, an optional operation for WMS.
Here, when you read, the point is that it's not the client side that manages returned features, but the server side. The purpose here is to have less load on the client side: managing a lot of features in the client side is mainly a pain, in particular if you use DOM.
The idea is to send the information to a server and retrieve the minimum and really light result. The result can be an HTML, a GML, raw text or depending on your server, also a GeoJSON. To illustrate, type into your browser the following URL:
You will see an HTML table with information from the point where we clicked on: INFO_FORMAT= text/html. It is the way to say we want an HTML format return.
As a conclusion, just retain at the moment that when you choose to use the OpenLayers getGetFeatureInfoUrl method, you are supposed to use it with WMS layers.
Now, you have enough knowledge, let's go back to the main topic.