Table of Contents for
OpenLayers 3 : Beginner's Guide
 OpenLayers 3 : Beginner's Guide
Published by
Packt Publishing, 2015
OpenLayers 3 : Beginner's Guide
Published by
Packt Publishing, 2015
- Cover
- Table of Contents
- OpenLayers 3 Beginner's Guide
- OpenLayers 3 Beginner's Guide
- Credits
- About the Authors
- About the Reviewers
- www.PacktPub.com
- Preface
- What you need for this book
- Who this book is for
- Sections
- Time for action – heading
- Conventions
- Reader feedback
- Customer support
- 1. Getting Started with OpenLayers
- Advantages of using OpenLayers
- What, technically, is OpenLayers?
- Anatomy of a web mapping application
- Connecting to Google, Bing Maps, and other mapping APIs
- Time for action – downloading OpenLayers
- Time for action – creating your first map
- Where to go for help
- OpenLayers issues
- OpenLayers source code repository
- Getting live news from RSS and social networks
- Summary
- 2. Key Concepts in OpenLayers
- Time for action – creating a map
- Time for action – using the JavaScript console
- Time for action – overlaying information
- OpenLayers' super classes
- Key-Value Observing with the Object class
- Time for action – using bindTo
- Working with collections
- Summary
- 3. Charting the Map Class
- Time for action – creating a map
- Map renderers
- Time for action – rendering a masterpiece
- Map properties
- Time for action – target practice
- Map methods
- Time for action – creating animated maps
- Events
- Views
- Time for action – linking two views
- Summary
- 4. Interacting with Raster Data Source
- Layers in OpenLayers 3
- Common operations on layers
- Time for action – changing layer properties
- Tiled versus untiled layers
- Types of raster sources
- Tiled images' layers and their sources
- Time for action – creating a Stamen layer
- Time for action – creating a Bing Maps layer
- Time for action – creating tiles and adding Zoomify layer
- Image layers and their sources
- Using Spherical Mercator raster data with other layers
- Time For action – playing with various sources and layers together
- Time For action – applying Zoomify sample knowledge to a single raw image
- Summary
- 5. Using Vector Layers
- Time for action – creating a vector layer
- How the vector layer works
- The vector layer class
- Vector sources
- Time for action – using the cluster source
- Time for action – creating a loader function
- Time for action – working with the TileVector source
- Time for action – a drag and drop viewer for vector files
- Features and geometries
- Time for action – geometries in action
- Time for action – interacting with features
- Summary
- 6. Styling Vector Layers
- Time for action – basic styling
- The style class
- Time for action – using the icon style
- Have a go hero – using the circle style
- Multiple styles
- Time for action – using multiple styles
- Style functions
- Time for action – using properties to style features
- Interactive styles
- Time for action – creating interactive styles
- Summary
- 7. Wrapping Our Heads Around Projections
- Time for action – using different projection codes
- Time for action – determining coordinates
- OpenLayers projection class
- Transforming coordinates
- Time for action – coordinate transforms
- Time for action – setting up Proj4js.org
- Time for action – reprojecting extent
- Time for action – using custom projection with WMS sources
- Time for action – reprojecting geometries in vector layers
- Summary
- 8. Interacting with Your Map
- Time for action – converting your local or national authorities data into web mapping formats
- Time for action – testing the use cases for ol.interaction.Select
- Time for action – more options with ol.interaction.Select
- Introducing methods to get information from your map
- Time for action – understanding the forEachFeatureAtPixel method
- Time for action – understanding the getGetFeatureInfoUrl method
- Adding a pop-up on your map
- Time for action – introducing ol.Overlay with a static example
- Time for action – using ol.Overlay dynamically with layers information
- Time for action – using ol.interaction.Draw to share new information on the Web
- Time for action – using ol.interaction.Modify to update drawing
- Understanding interactions and their architecture
- Time for action – configuring default interactions
- Discovering the other interactions
- Time for action – using ol.interaction.DragRotateAndZoom
- Time for action – making rectangle export to GeoJSON with ol.interaction.DragBox
- Summary
- 9. Taking Control of Controls
- Adding controls to your map
- Time for action – starting with the default controls
- Controls overview
- Time for action – changing the default attribution styles
- Time for action – finding your mouse position
- Time for action – configuring ZoomToExtent and manipulate controls
- Creating a custom control
- Time for action – extending ol.control.Control to make your own control
- Summary
- 10. OpenLayers Goes Mobile
- Using a web server
- Time for action – go mobile!
- The Geolocation class
- Time for action – location, location, location
- The DeviceOrientation class
- Time for action – a sense of direction
- Debugging mobile web applications
- Debugging on iOS
- Debugging on Android
- Going offline
- Time for action – MANIFEST destiny
- Going native with web applications
- Time for action – track me
- Summary
- 11. Creating Web Map Apps
- Using geospatial data from Flickr
- Time for action – getting Flickr data
- A simple application
- Time for Action – adding data to your map
- Styling the features
- Time for action – creating a style function
- Creating a thumbnail style
- Time for action – switching to JSON data
- Time for action – creating a thumbnail style
- Turning our example into an application
- Time for action – adding the select interaction
- Time for action – handling selection events
- Time for action – displaying photo information
- Using real time data
- Time for action – getting dynamic data
- Wrapping up the application
- Time for action – adding dynamic tags to your map
- Deploying an application
- Creating custom builds
- Creating a combined build
- Time for action – creating a combined build
- Creating a separate build
- Time for action – creating a separate build
- Summary
- A. Object-oriented Programming – Introduction and Concepts
- Going further
- B. More details on Closure Tools and Code Optimization Techniques
- Introducing Closure Library, yet another JavaScript library
- Time for action – first steps with Closure Library
- Making custom build for optimizing performance
- Time for action – playing with Closure Compiler
- Applying your knowledge to the OpenLayers case
- Time for action - running official examples with the internal OpenLayers toolkit
- Time for action - building your custom OpenLayers library
- Syntax and styles
- Time for action – using Closure Linter to fix JavaScript
- Summary
- C. Squashing Bugs with Web Debuggers
- Time for action – opening Chrome Developer Tools
- Explaining Chrome Developer debugging controls
- Time for action – using DOM manipulation with OpenStreetMap map images
- Time for action – using breakpoints to explore your code
- Time for action – playing with zoom button and map copyrights
- Using the Console panel
- Time for action – executing code in the Console
- Time for action – creating object literals
- Time for action – interacting with a map
- Improving Chrome and Developer Tools with extensions
- Debugging in other browsers
- Summary
- D. Pop Quiz Answers
- Chapter 5, Using Vector Layers
- Chapter 7, Wrapping Our Heads Around Projections
- Chapter 8, Interacting with Your Map
- Chapter 9, Taking Control of Controls
- Chapter 10, OpenLayers Goes Mobile
- Appendix B, More details on Closure Tools and Code Optimization Techniques
- Appendix C, Squashing Bugs with Web Debuggers
- Index
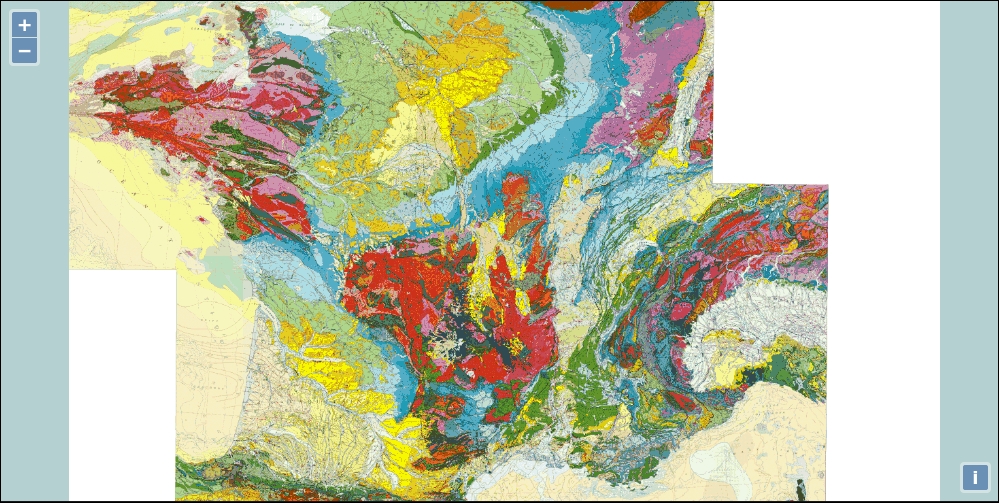
In this part, we will see how to display the WMS image coming from the authority responsible for geology maps in France, the BRGM (equivalent to USGS to simplify):
- Let's copy the usual template into the sandbox directory but do not forget to include, in this case, the reference to Proj4js JavaScript library before the
ol3.jsfile. - Go within the
<script>tag and declare the additional projection for local projection, in this case, Lambert 93, an official projection for France:proj4.defs("EPSG:2154","+proj=lcc +lat_1=49 +lat_2=44 +lat_0=46.5 +lon_0=3 +x_0=700000 +y_0=6600000 +ellps=GRS80 +towgs84=0,0,0,0,0,0,0 +units=m +no_defs"); - Declare the extent and the projection reusing your knowledge about declaring custom projection:
var extent = [-378305.81, 6093283.21, 1212610.74, 7186901.68];var projection = ol.proj.get('EPSG:2154');projection.setExtent(extent); - Declare an array with one layer using a source providing a WMS-projected web service in
EPSG:2154, the EPSG code for Lambert 93:var layers = [new ol.layer.Image({ source: new ol.source.ImageWMS({ url: 'http://geoservices.brgm.fr/geologie', attributions: [new ol.Attribution({ html: '© ' + 'BRGM (French USGS equivalent)' }) params: { 'LAYERS': 'SCAN_F_GEOL1M', 'VERSION': '1.1.1' }, extent: extent }) }) - Declare the map and the view with its center and zoom:
var map = new ol.Map({ layers: layers, target: 'map', view: new ol.view({ projection: projection, center: [495520.187986, 6587896.855407], zoom: 2 }) }); - Open the file in the browser and you should see the following screenshot:
We reused the custom projection by first declaring the Proj4js projection declaration and its extent. We recommend that you visit the website http://epsg.io to better understand how to get the extent and the meaning of the second parameter in from the proj4.defs function.
Then, we used our raster WMS knowledge to create the layer. Analyzing the network can be useful to remind you about the relationship between the WMS source layer declaration and the backend web server delivering the image. You can look in particular at getCapabilities, to inspect the available projections and the layers name you may change, if you want to play with the sample. The most important part to understand is to set the projection in the map view projection parameter. How can we deduce this? We understood that because in all the code, we never set any projection at the layer or source level. We should mention that Proj4js is not needed for maps, as long as they do not need any client-side transforms.
Using our example, a minimal case can be achieved replacing previous projection declarations by only declaring a projection, with units and code parameters like below:
var projection = new ol.proj.Projection({
  code: 'EPSG:2154',
  units: 'm'
});When someone reviews someone else job, it seems to be quite easy but reusing the same method for your own case is not the same, and will help you to really understand it.
So, we will ask you to complete a simple job:
- Find local projections for your country by visiting your national mapping agency, if available or sort out projections using the recommended website, http://epsg.io.
- Find web services that provide WMS in your local projection. Search engines or Geodata portals can help you. Do not forget to use the
getCapabilitiesoperation to get a layer's name or projections available for the data. If you don't find public web services using local projections for your country, to complete the assessment, explore other countries local projections web services. - Find the extent and the code you will need to make your map with local projections.
- Copy the previous example to readapt it and not reinvent the wheel.
Never forget to inspect the Network panel to help you if you encounter web services issues. You may also need to use the DOM renderer within the map; it helps you to inspect the url call. With the default canvas renderer, images are assembled in the background and you can't get the WMS URL that can help you.
To find the open data portals, the main entry for America is https://www.data.gov. For Europe, you should visit http://publicdata.eu. For a worldwide overview, go at http://datacatalogs.org, a website for A Comprehensive List of Open Data Catalogs from Around the World. To grasp the state of OpenData in your country, you can visit Global Open Data Index at http://global.census.okfn.org. It's a website maintained by the community to make surveys about each country's open data initiative. The focus is mainly on the type of open data datasets available.
After inspecting how to work with custom projection using raster layers, it's time to see vector reprojection. We already reviewed how to manipulate vector but not explaining further how to manage vector projections. Let's see a bit about them.