Table of Contents for
OpenLayers 3 : Beginner's Guide
 OpenLayers 3 : Beginner's Guide
Published by
Packt Publishing, 2015
OpenLayers 3 : Beginner's Guide
Published by
Packt Publishing, 2015
- Cover
- Table of Contents
- OpenLayers 3 Beginner's Guide
- OpenLayers 3 Beginner's Guide
- Credits
- About the Authors
- About the Reviewers
- www.PacktPub.com
- Preface
- What you need for this book
- Who this book is for
- Sections
- Time for action – heading
- Conventions
- Reader feedback
- Customer support
- 1. Getting Started with OpenLayers
- Advantages of using OpenLayers
- What, technically, is OpenLayers?
- Anatomy of a web mapping application
- Connecting to Google, Bing Maps, and other mapping APIs
- Time for action – downloading OpenLayers
- Time for action – creating your first map
- Where to go for help
- OpenLayers issues
- OpenLayers source code repository
- Getting live news from RSS and social networks
- Summary
- 2. Key Concepts in OpenLayers
- Time for action – creating a map
- Time for action – using the JavaScript console
- Time for action – overlaying information
- OpenLayers' super classes
- Key-Value Observing with the Object class
- Time for action – using bindTo
- Working with collections
- Summary
- 3. Charting the Map Class
- Time for action – creating a map
- Map renderers
- Time for action – rendering a masterpiece
- Map properties
- Time for action – target practice
- Map methods
- Time for action – creating animated maps
- Events
- Views
- Time for action – linking two views
- Summary
- 4. Interacting with Raster Data Source
- Layers in OpenLayers 3
- Common operations on layers
- Time for action – changing layer properties
- Tiled versus untiled layers
- Types of raster sources
- Tiled images' layers and their sources
- Time for action – creating a Stamen layer
- Time for action – creating a Bing Maps layer
- Time for action – creating tiles and adding Zoomify layer
- Image layers and their sources
- Using Spherical Mercator raster data with other layers
- Time For action – playing with various sources and layers together
- Time For action – applying Zoomify sample knowledge to a single raw image
- Summary
- 5. Using Vector Layers
- Time for action – creating a vector layer
- How the vector layer works
- The vector layer class
- Vector sources
- Time for action – using the cluster source
- Time for action – creating a loader function
- Time for action – working with the TileVector source
- Time for action – a drag and drop viewer for vector files
- Features and geometries
- Time for action – geometries in action
- Time for action – interacting with features
- Summary
- 6. Styling Vector Layers
- Time for action – basic styling
- The style class
- Time for action – using the icon style
- Have a go hero – using the circle style
- Multiple styles
- Time for action – using multiple styles
- Style functions
- Time for action – using properties to style features
- Interactive styles
- Time for action – creating interactive styles
- Summary
- 7. Wrapping Our Heads Around Projections
- Time for action – using different projection codes
- Time for action – determining coordinates
- OpenLayers projection class
- Transforming coordinates
- Time for action – coordinate transforms
- Time for action – setting up Proj4js.org
- Time for action – reprojecting extent
- Time for action – using custom projection with WMS sources
- Time for action – reprojecting geometries in vector layers
- Summary
- 8. Interacting with Your Map
- Time for action – converting your local or national authorities data into web mapping formats
- Time for action – testing the use cases for ol.interaction.Select
- Time for action – more options with ol.interaction.Select
- Introducing methods to get information from your map
- Time for action – understanding the forEachFeatureAtPixel method
- Time for action – understanding the getGetFeatureInfoUrl method
- Adding a pop-up on your map
- Time for action – introducing ol.Overlay with a static example
- Time for action – using ol.Overlay dynamically with layers information
- Time for action – using ol.interaction.Draw to share new information on the Web
- Time for action – using ol.interaction.Modify to update drawing
- Understanding interactions and their architecture
- Time for action – configuring default interactions
- Discovering the other interactions
- Time for action – using ol.interaction.DragRotateAndZoom
- Time for action – making rectangle export to GeoJSON with ol.interaction.DragBox
- Summary
- 9. Taking Control of Controls
- Adding controls to your map
- Time for action – starting with the default controls
- Controls overview
- Time for action – changing the default attribution styles
- Time for action – finding your mouse position
- Time for action – configuring ZoomToExtent and manipulate controls
- Creating a custom control
- Time for action – extending ol.control.Control to make your own control
- Summary
- 10. OpenLayers Goes Mobile
- Using a web server
- Time for action – go mobile!
- The Geolocation class
- Time for action – location, location, location
- The DeviceOrientation class
- Time for action – a sense of direction
- Debugging mobile web applications
- Debugging on iOS
- Debugging on Android
- Going offline
- Time for action – MANIFEST destiny
- Going native with web applications
- Time for action – track me
- Summary
- 11. Creating Web Map Apps
- Using geospatial data from Flickr
- Time for action – getting Flickr data
- A simple application
- Time for Action – adding data to your map
- Styling the features
- Time for action – creating a style function
- Creating a thumbnail style
- Time for action – switching to JSON data
- Time for action – creating a thumbnail style
- Turning our example into an application
- Time for action – adding the select interaction
- Time for action – handling selection events
- Time for action – displaying photo information
- Using real time data
- Time for action – getting dynamic data
- Wrapping up the application
- Time for action – adding dynamic tags to your map
- Deploying an application
- Creating custom builds
- Creating a combined build
- Time for action – creating a combined build
- Creating a separate build
- Time for action – creating a separate build
- Summary
- A. Object-oriented Programming – Introduction and Concepts
- Going further
- B. More details on Closure Tools and Code Optimization Techniques
- Introducing Closure Library, yet another JavaScript library
- Time for action – first steps with Closure Library
- Making custom build for optimizing performance
- Time for action – playing with Closure Compiler
- Applying your knowledge to the OpenLayers case
- Time for action - running official examples with the internal OpenLayers toolkit
- Time for action - building your custom OpenLayers library
- Syntax and styles
- Time for action – using Closure Linter to fix JavaScript
- Summary
- C. Squashing Bugs with Web Debuggers
- Time for action – opening Chrome Developer Tools
- Explaining Chrome Developer debugging controls
- Time for action – using DOM manipulation with OpenStreetMap map images
- Time for action – using breakpoints to explore your code
- Time for action – playing with zoom button and map copyrights
- Using the Console panel
- Time for action – executing code in the Console
- Time for action – creating object literals
- Time for action – interacting with a map
- Improving Chrome and Developer Tools with extensions
- Debugging in other browsers
- Summary
- D. Pop Quiz Answers
- Chapter 5, Using Vector Layers
- Chapter 7, Wrapping Our Heads Around Projections
- Chapter 8, Interacting with Your Map
- Chapter 9, Taking Control of Controls
- Chapter 10, OpenLayers Goes Mobile
- Appendix B, More details on Closure Tools and Code Optimization Techniques
- Appendix C, Squashing Bugs with Web Debuggers
- Index
Having explored raster layers, it's time to explore the other layer type that OpenLayers supports—vector layers. In this chapter, we'll introduce the vector layer and discover how to display and interact with vector data on the fly. We'll see how we can use vector sources to load vector data in a variety of formats. Through several hands-on examples, we'll explore the Format, Feature, and Geometry classes that are the foundation of OpenLayers 3 vector support.
In this chapter, we will cover using the vector layer class, ol.layer.vector, and some related classes to display vector data. Specifically, we'll:
- Discuss what the vector layer class is and see how it works
- Cover the properties, methods, and events of the vector layer class
- Introduce the three subclasses of the vector layer class
- Discover and demonstrate the use of format classes
- Cover the Feature and Geometry classes
- Learn how to interact with features in vector layers
In OpenLayers, the vector layer is used to display vector data on top of a map and allow real-time interaction with the data. What does this mean? Basically, it means we can load raw geographic data from a variety of sources, including geospatial file formats such as KML and GeoJSON, and display that data on a map, styling the data however we see fit. For example, take a look at the map that follows:
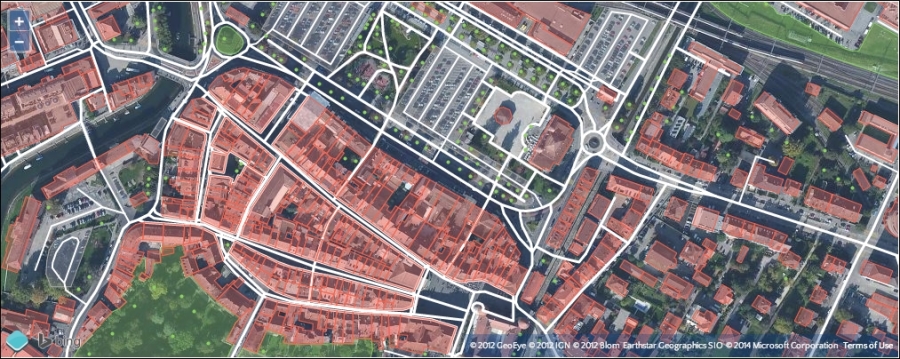
It shows a map with a Bing satellite raster layer and a vector layer on top of it. The vector layer loads data using the OSM XML Vector source and draws it in real time with different styles based on the type and attribute of each feature (the individual points, lines, and polygons). In this example, a small subset of the OSM data has been requested and is styled by OpenLayers to highlight roads (white lines), parking lots (gray polygons), buildings (red polygons), green space (in green, of course) and the location of trees (the green dots). We'll cover vector styles in detail in Chapter 6, Styling Vector Layers.
With a raster image, what you see is what you get. If you were to look at some close up satellite imagery on your map and see a bunch of buildings clustered together, you wouldn't necessarily know any additional information about those buildings. You might not even know they are buildings. Since raster layers are made up of images, it is up to the user to interpret what they see. This isn't necessarily a bad thing, but vector layers provide much more.
With a vector layer, you can show the actual geometry of the building and attach additional information to it—such as its address, who owns it, its square footage, and so on. As we'll see later in this chapter, it's easy to put a vector layer on top of your existing raster layers and create features in a specific location. We'll also see how we can get additional information about features just by clicking or hovering our mouse over them.
We can display any type of geometric shape with the vector layer—points, lines, polygons, squares, markers, any shape you can imagine. We can use the vector layer to draw lines or polygons and then calculate the distance between them. We can draw shapes and then export the data using a variety of formats, then import that data in other programs, such as Google Earth. These are just a few basic cases though, and throughout this chapter, you'll see how powerful the vector layer can be.
Another fundamental difference is that the vector layer is a client side layer. This means that interaction with the actual vector data happens on the client side. When you display vector data, for instance, its visual representation is generated by OpenLayers in response to the rules you define in your code. Raster data looks the way it looks and you can't easily change the color of roads or decide not to display buildings. When you navigate your map, vector data is generally already available and can be displayed immediately. With raster layers, each time you zoom in or out, OpenLayers has to request more image tiles from the server and wait for them to arrive unless they are already in the browser cache.
Since, in most cases, the vector data is loaded on the client side, presentation of and interaction with the vector layer usually happens nearly instantaneously. However, there are some practical limitations. Most vector sources make a lot more data available than can be loaded and rendered in the browser. Network bandwidth, memory and processor speed all have limits and, although computers and web browsers are getting faster and more powerful all the time, there are always practical boundaries to what can be done with vector data. The OpenLayers developers have worked hard to push these boundaries and many things that were impossible to consider even two years ago are now practical—we'll highlight some best practices along the way.
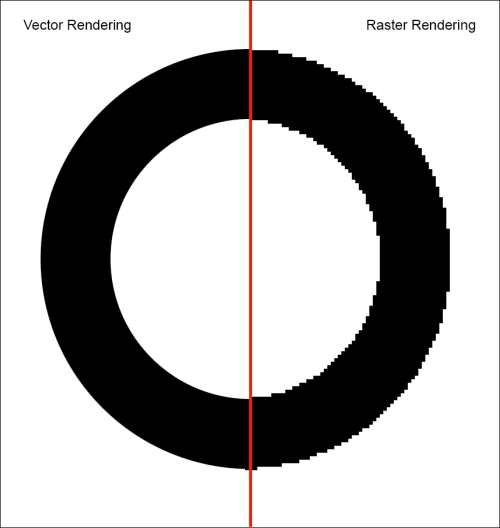
In computer graphics, there are essentially two types of data: raster and vector. The majority of image files—.jpeg, .png, .gif, and other bitmap image formats—are raster images. A photograph, for example, is a raster image. A raster image is a rectangular grid—like graph paper—of color information, and each color point in an image is called a pixel. When you look at a raster image on your computer, it interprets the color information in each pixel and maps this to physical pixels on your screen. As you zoom in on a raster image, there is a point at which each pixel in the raster image can be rendered to a single physical pixel on your screen. This is referred to as the resolution of the image, the most information that the image can accurately represent. As you zoom in further, each pixel in the raster image is drawn into more than one physical pixel and the quality of the image starts to degrade—we say it is pixelated. When you zoom out, each pixel in the raster image requires only part of a physical pixel on the screen and so several adjacent raster pixels are combined to compute a color to display in the physical pixel.
A vector, on the other hand, encodes information about how to draw a particular shape. There might be many ways of representing vector shapes—a straight line can be represented as a starting point and an ending point, or a starting point, direction and distance. When you display a vector on a computer screen, it has to be converted from its encoded format into colors for physical pixels—a process called rasterization. However, because the computer has detailed instructions on how to draw the shape, it can choose a resolution that exactly matches the physical pixels of your computer display every single time it draws it, regardless of how much you zoom in or out. In fact, the same vector information can be drawn on any other screen at the appropriate resolution. For this reason, we often call vector data resolution independent.
Here is an example of how a circle appears when drawn as a vector and a raster. The left side is rendered as a vector and the right side is rendered as a raster. When the image is zoomed, the vector remains sharp and clear but the raster becomes blocky.