Table of Contents for
OpenLayers 3 : Beginner's Guide
 OpenLayers 3 : Beginner's Guide
Published by
Packt Publishing, 2015
OpenLayers 3 : Beginner's Guide
Published by
Packt Publishing, 2015
- Cover
- Table of Contents
- OpenLayers 3 Beginner's Guide
- OpenLayers 3 Beginner's Guide
- Credits
- About the Authors
- About the Reviewers
- www.PacktPub.com
- Preface
- What you need for this book
- Who this book is for
- Sections
- Time for action – heading
- Conventions
- Reader feedback
- Customer support
- 1. Getting Started with OpenLayers
- Advantages of using OpenLayers
- What, technically, is OpenLayers?
- Anatomy of a web mapping application
- Connecting to Google, Bing Maps, and other mapping APIs
- Time for action – downloading OpenLayers
- Time for action – creating your first map
- Where to go for help
- OpenLayers issues
- OpenLayers source code repository
- Getting live news from RSS and social networks
- Summary
- 2. Key Concepts in OpenLayers
- Time for action – creating a map
- Time for action – using the JavaScript console
- Time for action – overlaying information
- OpenLayers' super classes
- Key-Value Observing with the Object class
- Time for action – using bindTo
- Working with collections
- Summary
- 3. Charting the Map Class
- Time for action – creating a map
- Map renderers
- Time for action – rendering a masterpiece
- Map properties
- Time for action – target practice
- Map methods
- Time for action – creating animated maps
- Events
- Views
- Time for action – linking two views
- Summary
- 4. Interacting with Raster Data Source
- Layers in OpenLayers 3
- Common operations on layers
- Time for action – changing layer properties
- Tiled versus untiled layers
- Types of raster sources
- Tiled images' layers and their sources
- Time for action – creating a Stamen layer
- Time for action – creating a Bing Maps layer
- Time for action – creating tiles and adding Zoomify layer
- Image layers and their sources
- Using Spherical Mercator raster data with other layers
- Time For action – playing with various sources and layers together
- Time For action – applying Zoomify sample knowledge to a single raw image
- Summary
- 5. Using Vector Layers
- Time for action – creating a vector layer
- How the vector layer works
- The vector layer class
- Vector sources
- Time for action – using the cluster source
- Time for action – creating a loader function
- Time for action – working with the TileVector source
- Time for action – a drag and drop viewer for vector files
- Features and geometries
- Time for action – geometries in action
- Time for action – interacting with features
- Summary
- 6. Styling Vector Layers
- Time for action – basic styling
- The style class
- Time for action – using the icon style
- Have a go hero – using the circle style
- Multiple styles
- Time for action – using multiple styles
- Style functions
- Time for action – using properties to style features
- Interactive styles
- Time for action – creating interactive styles
- Summary
- 7. Wrapping Our Heads Around Projections
- Time for action – using different projection codes
- Time for action – determining coordinates
- OpenLayers projection class
- Transforming coordinates
- Time for action – coordinate transforms
- Time for action – setting up Proj4js.org
- Time for action – reprojecting extent
- Time for action – using custom projection with WMS sources
- Time for action – reprojecting geometries in vector layers
- Summary
- 8. Interacting with Your Map
- Time for action – converting your local or national authorities data into web mapping formats
- Time for action – testing the use cases for ol.interaction.Select
- Time for action – more options with ol.interaction.Select
- Introducing methods to get information from your map
- Time for action – understanding the forEachFeatureAtPixel method
- Time for action – understanding the getGetFeatureInfoUrl method
- Adding a pop-up on your map
- Time for action – introducing ol.Overlay with a static example
- Time for action – using ol.Overlay dynamically with layers information
- Time for action – using ol.interaction.Draw to share new information on the Web
- Time for action – using ol.interaction.Modify to update drawing
- Understanding interactions and their architecture
- Time for action – configuring default interactions
- Discovering the other interactions
- Time for action – using ol.interaction.DragRotateAndZoom
- Time for action – making rectangle export to GeoJSON with ol.interaction.DragBox
- Summary
- 9. Taking Control of Controls
- Adding controls to your map
- Time for action – starting with the default controls
- Controls overview
- Time for action – changing the default attribution styles
- Time for action – finding your mouse position
- Time for action – configuring ZoomToExtent and manipulate controls
- Creating a custom control
- Time for action – extending ol.control.Control to make your own control
- Summary
- 10. OpenLayers Goes Mobile
- Using a web server
- Time for action – go mobile!
- The Geolocation class
- Time for action – location, location, location
- The DeviceOrientation class
- Time for action – a sense of direction
- Debugging mobile web applications
- Debugging on iOS
- Debugging on Android
- Going offline
- Time for action – MANIFEST destiny
- Going native with web applications
- Time for action – track me
- Summary
- 11. Creating Web Map Apps
- Using geospatial data from Flickr
- Time for action – getting Flickr data
- A simple application
- Time for Action – adding data to your map
- Styling the features
- Time for action – creating a style function
- Creating a thumbnail style
- Time for action – switching to JSON data
- Time for action – creating a thumbnail style
- Turning our example into an application
- Time for action – adding the select interaction
- Time for action – handling selection events
- Time for action – displaying photo information
- Using real time data
- Time for action – getting dynamic data
- Wrapping up the application
- Time for action – adding dynamic tags to your map
- Deploying an application
- Creating custom builds
- Creating a combined build
- Time for action – creating a combined build
- Creating a separate build
- Time for action – creating a separate build
- Summary
- A. Object-oriented Programming – Introduction and Concepts
- Going further
- B. More details on Closure Tools and Code Optimization Techniques
- Introducing Closure Library, yet another JavaScript library
- Time for action – first steps with Closure Library
- Making custom build for optimizing performance
- Time for action – playing with Closure Compiler
- Applying your knowledge to the OpenLayers case
- Time for action - running official examples with the internal OpenLayers toolkit
- Time for action - building your custom OpenLayers library
- Syntax and styles
- Time for action – using Closure Linter to fix JavaScript
- Summary
- C. Squashing Bugs with Web Debuggers
- Time for action – opening Chrome Developer Tools
- Explaining Chrome Developer debugging controls
- Time for action – using DOM manipulation with OpenStreetMap map images
- Time for action – using breakpoints to explore your code
- Time for action – playing with zoom button and map copyrights
- Using the Console panel
- Time for action – executing code in the Console
- Time for action – creating object literals
- Time for action – interacting with a map
- Improving Chrome and Developer Tools with extensions
- Debugging in other browsers
- Summary
- D. Pop Quiz Answers
- Chapter 5, Using Vector Layers
- Chapter 7, Wrapping Our Heads Around Projections
- Chapter 8, Interacting with Your Map
- Chapter 9, Taking Control of Controls
- Chapter 10, OpenLayers Goes Mobile
- Appendix B, More details on Closure Tools and Code Optimization Techniques
- Appendix C, Squashing Bugs with Web Debuggers
- Index
First off, what is a web-mapping application? To put it bluntly, it's some type of Internet application that makes use of a map. This could be a site that displays the latest geo-tagged images from Flickr (we'll do this in Chapter 11, Creating Web Map Apps), a map that shows markers of locations you've traveled to, or an application that tracks invasive plant species and displays them. If it contains a map and it does something, you could argue that it is a web map application. The term can be used in a pretty broad sense.
So, where exactly does OpenLayers fit in? We know OpenLayers is a client-side mapping library, but what does that mean? Let's take a look at the following figure:
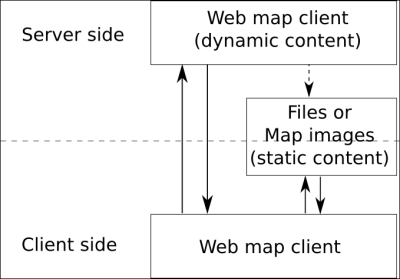
This is called the client/server model and it is, essentially, the core of how all web applications operate. In the case of a web map application, some sort of map client (for example: OpenLayers) communicates with some sort of web map server (for example: a map server using the WMS (Web Map Service) standard, an OpenStreetMap backend, or some satellite images). We've added a bit of complexity in it because the truth is that you can also rely only on client-side for web mapping applications using static content that you have pre-generated. To illustrate, you can use GeoJSON files, a JSON based format to display pins. For example, it is very useful for mobile content.
OpenLayers lives on the client-side. One of the primary tasks the client performs is to get map images from a map server. Essentially, the client asks a map server for what you want to look at. Every time you navigate or zoom around on the map, the client has to make new requests to the server—because you're asking to look at something different.
OpenLayers handles this all for you, and it is happening via AJAX (asynchronous JavaScript + XML) calls to a map server. Refer to http://en.wikipedia.org/wiki/Ajax_(programming) for further information on AJAX. To reiterate—the basic concept is that OpenLayers sends requests to a map server for map data every time you interact with the map, then OpenLayers pieces together all the returned map data (which might be images or vector data) so it looks like one big, seamless map. In Chapter 2, Key Concepts in OpenLayers, we'll cover this concept in more depth.
A map server (or map service) provides the map itself. There are a myriad of different map server backends. The examples include:
- The map servers using WMS and WFS standards (such as the GeoServer, Mapserver, and so on)
- Proprietary backends provided such as Bing Maps or Esri's ArcGIS Online, mainly based on proprietary data
- Backends based on OpenStreetMap data such as the official OpenStreetMap, Stamen maps, or MapQuest maps
If you are unfamiliar with these terms, don't sweat it. The basic principle behind all these services is that they allow you to specify the area of the map you want to look at (by sending a request), and then the map servers send back a response containing the map image. With OpenLayers, you can choose to use as many different backends in any sort of combination as you'd like.
Note
OpenLayers is not a web map server; it only consumes data from them. So, you will need access to some type of WMS. Don't worry about it though. Fortunately, there are a myriad of free and/or open source web map servers available that are remotely hosted or easy to set up yourself, such as MapServer. We speak a lot about web map servers but you must be aware that depending on your web-mapping application, you can use geographic data files to provide the needed data consumed by OpenLayers.
Throughout this book, we'll often use a freely available web-mapping service from http://www.openstreetmap.org/, so don't worry now about having to provide your own.
With many web map servers, you do not have to do anything to use them—just supplying a URL to them in OpenLayers is enough. OSGeo, OpenStreetMap, Google, Here Maps, and Bing Maps, for instance, provide access to their map servers (although some commercial restrictions may apply with various services in some situations).