The biggest challenge with GPGPU applications is that of debugging a kernel. CUDA comes with a simulator for this reason, which allows one to run and debug a kernel on a CPU. OpenCL allows one to run a kernel on a CPU without modification, although this may not get the exact same behavior (and bugs) as when run on a specific GPU device.
A slightly more advanced method involves the use of a dedicated debugger such as Nvidia's Nsight, which comes in versions both for Visual Studio (https://developer.nvidia.com/nvidia-nsight-visual-studio-edition) and Eclipse (https://developer.nvidia.com/nsight-eclipse-edition).
According to the marketing blurb on the Nsight website:
The following screenshot shows an active CUDA debug session:
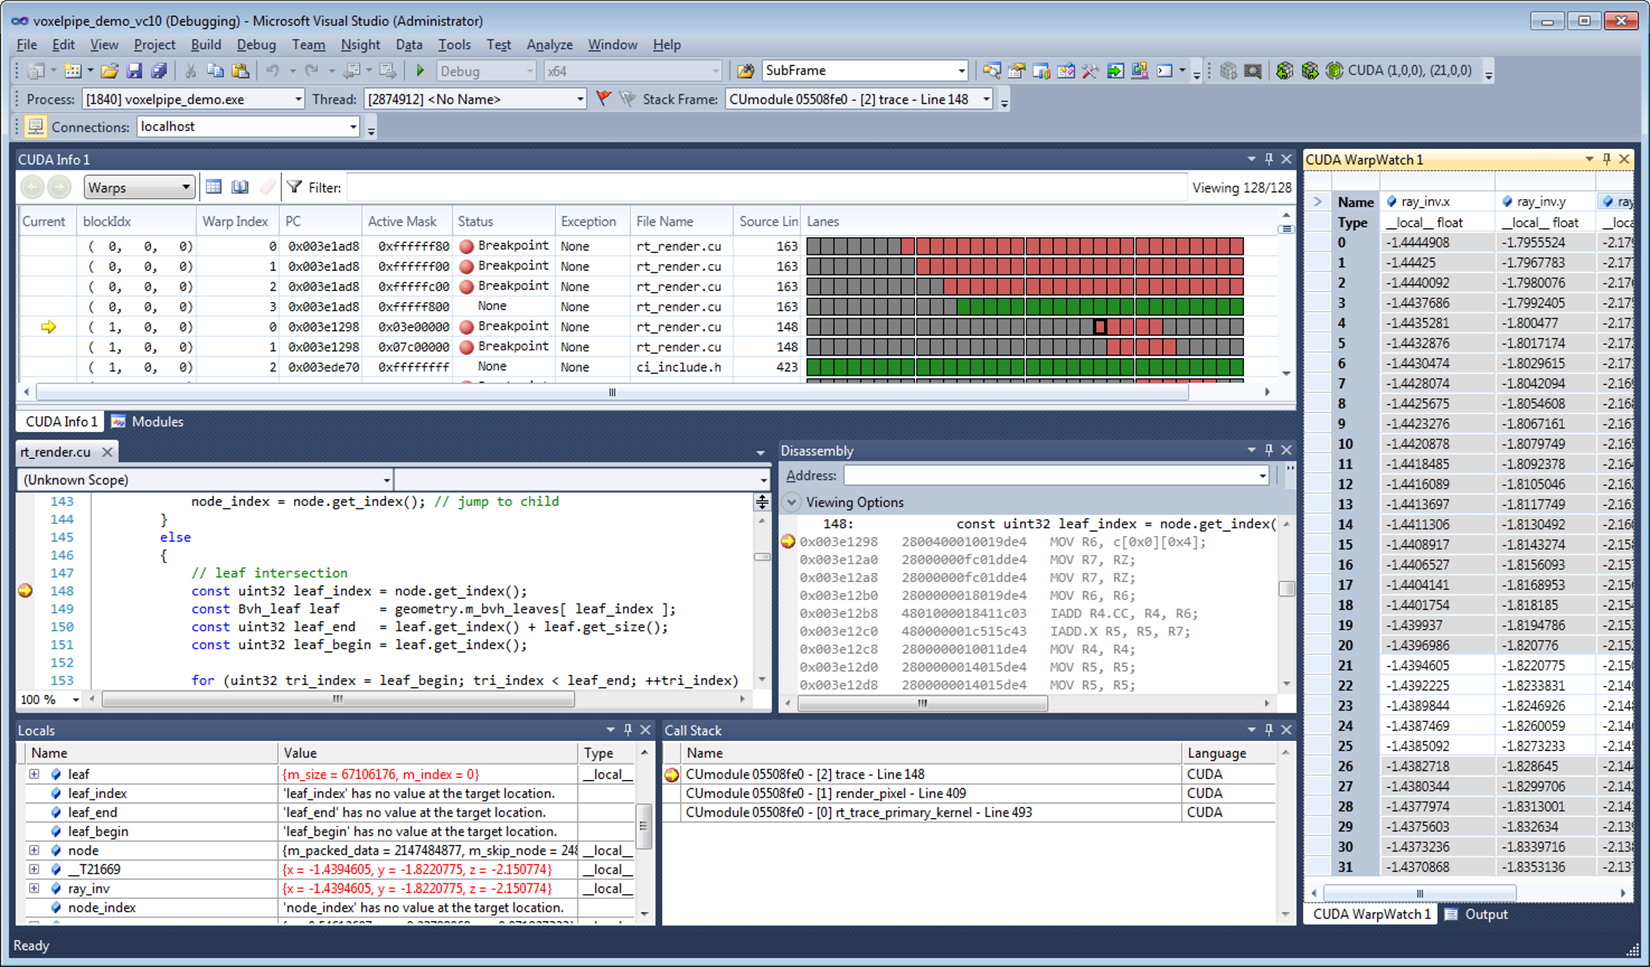
A big advantage of such a debugger tool is that it allows one to monitor, profile and optimize one's GPGPU application by identifying bottlenecks and potential problems.