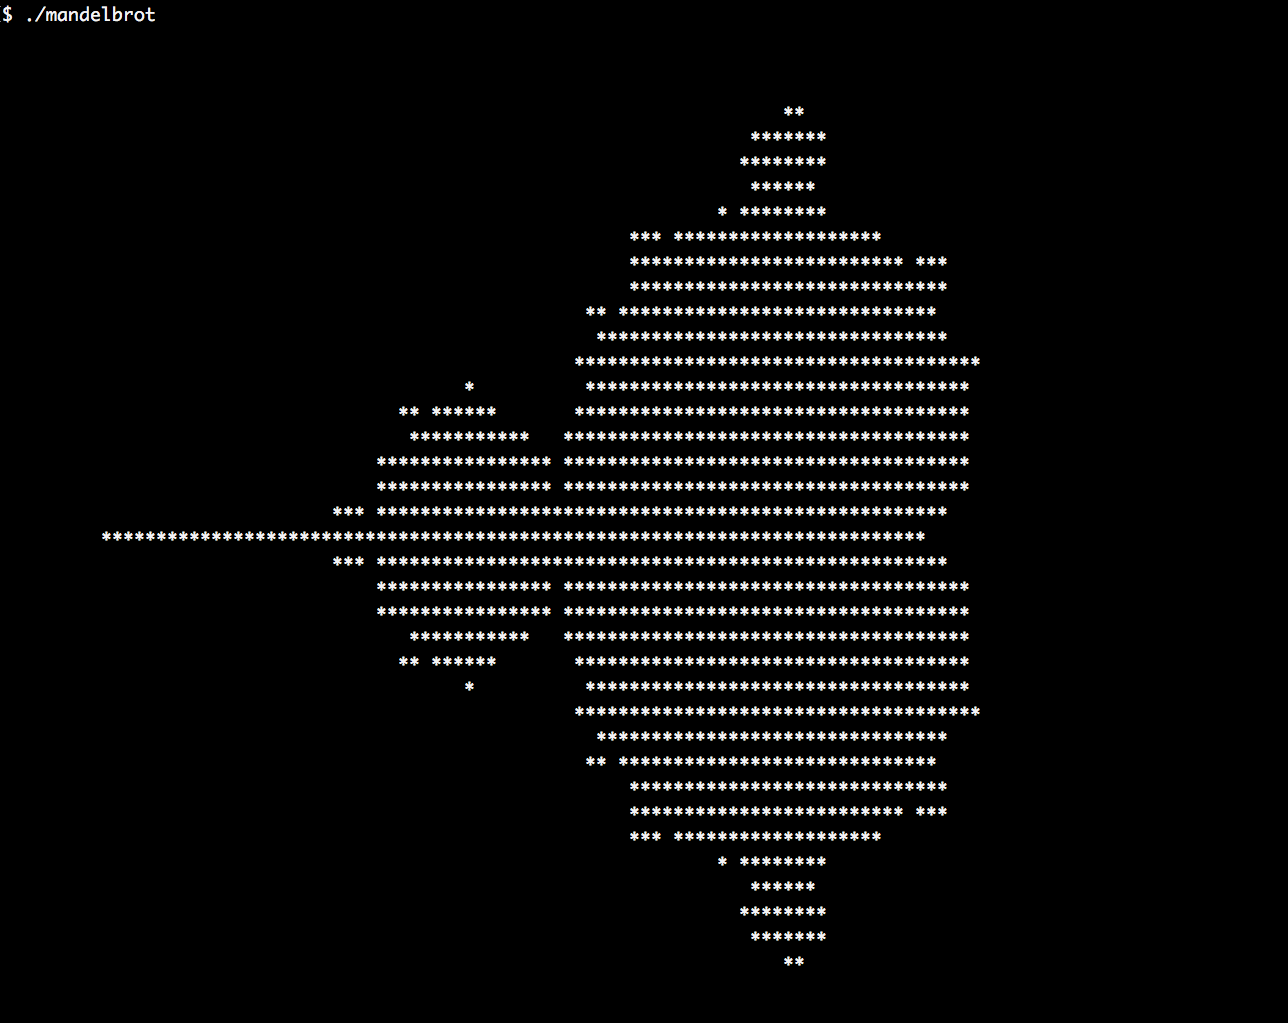
In this section, we are going to print the same image from the wall poster as a little piece of ASCII art in the terminal:
- First, we include all the headers and declare that we use the std namespace:
      #include <iostream>
      #include <algorithm>
      #include <iterator>
      #include <complex>
      #include <numeric>
      #include <vector>

      using namespace std;
- The Mandelbrot set and formula operate on complex numbers. So, we define a type alias, cmplx to be of class std::complex, specializing on double values.
using cmplx = complex<double>;
- It is possible to hack together all the code for an ASCII Mandelbrot image in something around 20 lines of code, but we will implement each logical step in a separate form, and then assemble all the steps in the end. The first step is implementing a function that scales from integer coordinates to floating point coordinates. What we have in the beginning is columns and rows of character positions on the terminal. What we want are complex-typed coordinates in the coordinate system of the Mandelbrot set. For this, we implement a function that accepts parameters that describe the geometry of the user terminal coordinate system, and the system we want to transform to. Those values are used to build a lambda expression, which is returned. The lambda expression accepts an int coordinate and returns a double coordinate:
      static auto scaler(int min_from, int max_from,
                         double min_to, double max_to)
      {
          const int    w_from   {max_from - min_from};
          const double w_to     {max_to - min_to};
          const int    mid_from {(max_from - min_from) / 2 + min_from};
          const double mid_to   {(max_to - min_to) / 2.0 + min_to};

          return [=] (int from) {
              return double(from - mid_from) / w_from * w_to + mid_to;
          };
      }
- Now we can transform points on one dimension, but the Mandelbrot set exists in a two-dimensional coordinate system. In order to translate from one (x, y) coordinate system to another, we combine an x-scaler and a y-scaler and construct a cmplx instance from their output:
      template <typename A, typename B>
      static auto scaled_cmplx(A scaler_x, B scaler_y)
      {
          return [=](int x, int y) {
              return cmplx{scaler_x(x), scaler_y(y)};
          };
      }
- After being able to transform coordinates to the right dimensions, we can now implement the Mandelbrot formula. The function that we're implementing now knows absolutely nothing about the concept of terminal windows or linear plane transformations, so we can concentrate on the Mandelbrot math. We square z and add c to it in a loop until its abs value is smaller than 2. For some coordinates, this never happens, so we also break out of the loop if the number of iterations exceeds max_iterations. In the end, we return the number of iterations we had to do until the abs value converged:
      static auto mandelbrot_iterations(cmplx c)
      {
          cmplx z {};
          size_t iterations {0};
          const size_t max_iterations {1000};
          while (abs(z) < 2 && iterations < max_iterations) {
              ++iterations;
              z = pow(z, 2) + c;
          }
          return iterations;
      }
- We can now begin with the main function, where we define the terminal dimensions and instantiate a function object, scale, which scales our coordinate values for both axes:
      int main()
      {
          const size_t w {100};
          const size_t h {40};

          auto scale (scaled_cmplx(
              scaler(0, w, -2.0, 1.0),
              scaler(0, h, -1.0, 1.0)
          ));
- In order to have a one-dimensional iteration over the whole image, we write another transformation function that accepts a one-dimensional i coordinate. It calculates (x, y) coordinates from that, based on our assumed line of characters width. After breaking i down to the row and column numbers, it transforms them with our scale function and returns the complex coordinate.
auto i_to_xy ([=](int i) { return scale(i % w, i / w); });
- What we can do now is transform from one-dimensional coordinates (the int type), via two-dimensional coordinates (the (int, int) type), to Mandelbrot set coordinates (the cmplx type), and then calculate the number of iterations from there (the int type again). Let's combine all that in one function, which sets up this call chain for us:
          auto to_iteration_count ([=](int i) {
              return mandelbrot_iterations(i_to_xy(i));
          });
- Now we can set up all the data. We assume that our resulting ASCII image is w characters wide and h characters high. This can be saved in a one-dimensional vector that has w * h elements. We fill this vector using std::iota with the value range, 0 ... (w*h - 1). These numbers can be used as an input source for our constructed transformation function range, which we just encapsulated in to_iteration_count:
          vector<int> v (w * h);
          iota(begin(v), end(v), 0);
          transform(begin(v), end(v), begin(v), to_iteration_count);
- That's basically it. We now have the v vector, which we initialized with one-dimensional coordinates, but which then got overwritten by Mandelbrot iteration counters. From this, we can now print a pretty image. We could just make the terminal window w characters wide, then we would not need to print line break symbols in between. But we can also kind of creatively misuse std::accumulate to do the line breaks for us. The std::accumulate uses a binary function to reduce a range. We provide it a binary function, which accepts an output iterator (and which we will link to the terminal in the next step), and a single value from the range. We print this value as a * character if the number of iterations is higher than 50. Otherwise, we just print a space character. If we are on a row end (because the counter variable n is evenly divisible by w), we print a line break symbol:
          auto binfunc ([w, n{0}] (auto output_it, int x) mutable {
              *++output_it = (x > 50 ? '*' : ' ');
              if (++n % w == 0) { ++output_it = 'n'; }
              return output_it;
          });
- By calling std:accumulate on the input range, combined with our binary print function and an ostream_iterator, we can flush the calculated Mandelbrot set out to the terminal window:
          accumulate(begin(v), end(v), ostream_iterator<char>{cout},
                     binfunc);
      }
- Compiling and running the program leads to the following output, which looks like the initial detailed Mandelbrot image, but in a simplified form: